FDNY @ 150: Busier an · PDF filePhoto: Courtesy of Kevin Neenan & James Slevin. 2 FDNY @ 150:...
20
FDNY @ 150: Busier an Ever Analysis of 2015 FDNY Firefighter Led Emergency Response Operations R MARCH 2016 Photo: Courtesy of Kevin Neenan & James Slevin
Transcript of FDNY @ 150: Busier an · PDF filePhoto: Courtesy of Kevin Neenan & James Slevin. 2 FDNY @ 150:...

FDNY @ 150: Busier an Ever
Analysis of 2015 FDNY Firefighter LedEmergency Response Operations
RMARCH 2016
Photo: Courtesy of Kevin Neenan & James Slevin

2
FDNY @ 150: Busier an Ever
I. Soaring Emergencies for the World’s Largest and Busiest Fire Department: . . .Pg. 4
II. Growing Population, Taller Skyline: . . . . . . . . . . . . . . . . . . . . . . . . . . . . . . . . . .Pg. 5
III. Modern FDNY Role, Fires & Much More Required: . . . . . . . . . . . . . . . . . . . . .Pg. 7
IV. Nation’s Busiest Fire Department Continually Shattering Record for Emergency Responses, With New & Growing Dangers: . . . . . . . . . . . . . . . .Pg. 8
V. Today’s Fires Burn Faster and Hotter Than Ever Before: . . . . . . . . . . . . . . . . . .Pg. 9
VI. As NY City’s Population Swells, Response Times Must be Maintained to Ensure Safety: . . . . . . . . . . . . . . . . . . . . . . . . . . . . . . . . . . . . . . .Pg. 10
VII. Medical Emergencies: . . . . . . . . . . . . . . . . . . . . . . . . . . . . . . . . . . . . . . . . . . . . .Pg. 11
VIII.Underreporting True Firefighter Response Time: Truth vs. Fiction . . . . . . . . . .Pg. 12 Citywide . . . . . . . . . . . . . . . . . . . . . . . . . . . . . . . . . . . . . . . . . . . . . . . . . . . . . . .Pg. 14 Manhattan . . . . . . . . . . . . . . . . . . . . . . . . . . . . . . . . . . . . . . . . . . . . . . . . . . . . . .Pg. 15 Brooklyn . . . . . . . . . . . . . . . . . . . . . . . . . . . . . . . . . . . . . . . . . . . . . . . . . . . . . . .Pg. 16 Queens . . . . . . . . . . . . . . . . . . . . . . . . . . . . . . . . . . . . . . . . . . . . . . . . . . . . . . . .Pg. 17 Bronx . . . . . . . . . . . . . . . . . . . . . . . . . . . . . . . . . . . . . . . . . . . . . . . . . . . . . . . . .Pg. 18 Staten Island . . . . . . . . . . . . . . . . . . . . . . . . . . . . . . . . . . . . . . . . . . . . . . . . . . . .Pg. 19
INDEX

3
FDNY @ 150: Busier an Ever
FDNY at Age 150, Busier Than Ever BeforeIn 2015 the FDNY, the greatest and busiest fire department in the world, turned 150 years of age.The Department protects the citizens of the City of New York and those working here and visitingthe approximately 468-square-mile metropolis [consisting of 302.64 sq mi of land and 164.1 sq miof water].
The city is the most populated in the United States, with the U.S. Census projecting a 2014 popu-lation of 8,491,079, an increase of 315,946 residents (+3.86%) over the official 2010 count and up6 percent, or 482,801 residents, since the 2000 census.1 The city has 3,371,062 housing units anda density of 27,858 residents per square mile.
By comparison, New York City is more than twice the population of Los Angeles, the second largestcity in the U.S., and more than three times the population of the #3 ranked city, Chicago. Accordingto statements by the de Blasio Administration, New York City has experienced the largest increasein population of any other city in the United States.
New York City is made up of the five boroughs, including Manhattan, The Bronx, Queens, Brook-lyn, and Staten Island. Brooklyn is the largest with 2,621,793 residents and Queens is a closesecond with 2,321,580 residents. If they were stand alone cities, Brooklyn would rank fourth inthe nation and Queens fifth, well ahead of Texas’ largest city, Houston.
The FDNY and its approximate headcount of 8,200 firefighters are responsible for protecting thelives of millions of residents, along with all of the homes and businesses located within the citylimits.1 U.S. Census for New York City http://quickfacts.census.gov/qfd/states/36/3651000.html
New York City’s Five BoroughsJurisdiction Population
Estimate(2014)
1,636,2681,438,1592,621,7932,321,580473,279
8,491,07919,746,227
SquareMiles
234271
10958
30347,214
SquareKm
59109183283151786
122,284
persons /sq. km27,67313,22114,182
8,2373,151
10,756159
persons /sq. mi71,67234,24236,73221,333
8,16027,858
416
Land Area Density
Borough
Manhattan
The BronxBrooklynQueens
Staten Island
County
New York
BronxKings
QueensRichmond
City of New YorkState of New York

4
FDNY @ 150: Busier an Ever
Never in the 150-year history of the FDNY havefirefighters been busier than they are today. In 2015,New York City Firefighters once again set a recordby responding to 581,981 total emergency calls, a12 percent surge over the previous year, which itselfhad been a record, surpassing the number of emer-gencies in 2013 by 8.5 percent.
That means that since 2013 alone, according toFDNY data, firefighters have seen a nearly 21 per-cent increase in the number of total emergency callsthey have answered, part of a steep upward trendthat has seen emergency responses skyrocket since2001 and in every decade since 1960.
This is after the fact that in 2003, New York CityMayor Michael Bloomberg closed six engine com-panies that were located in Brooklyn (4), Queens(1) and Manhattan (1). This has caused an increasein response times for firefighters to respond to firesor medical emergencies.
I. Soaring Emergencies for The World’s Largest & BusiestFire Department:
In fact, all 10 of the busiest years on record for the FDNY – America’s most relied upon fire andemergency service agency -- have occurred since 2005, a clear reflection not only of significantchanges that have come following the 9/11 attacks, but of a rapidly growing city and its communitiesexpanding at a dizzying pace.
These staggering numbers demonstrate what is obvious, not only to firefighters but to anyone elsein the city: New York’s population is booming.

5
FDNY @ 150: Busier an Ever
The city subways are more crowdedthan ever, construction is proceeding ata breakneck pace and former industrialneighborhoods and tenement blocks arebeing replaced with massive high-risesthat have added thousands of housingunits every month.
Zoning changes approved by the NewYork City Council may need to considerrequiring developers to include FDNYFire and EMS station locations to reflectpopulation growth and increased de-mands on public safety. Every zoningchange needs a study on the impact of“vertical response times” when you gofrom a 5-story building to a 70-storybuilding.
Vertical response times would accountfor the time it takes for first respondersto arrive on the emergency or fire floor- as opposed to the curb outside thebuilding - which is the current citymeasurement, or more appropriately called “Call to Curb” response. The city of New York doesnot measure the response time it takes to begin providing emergency services to anyone abovestreet level. In a vertical city such as New York, that time differential can be quite considerable.
Whether it’s a former factory in Williamsburg, an old warehouse in Long Island City or a defuncttrain rail yard on Manhattan’s far west side, thousands of low-rise buildings are giving way totall, high-occupancy residential towers. None of this would be taking place if there weren’t peoplemoving here in droves.
II. Growing Population, Taller Skyline:
6
FDNY @ 150: Busier an Ever
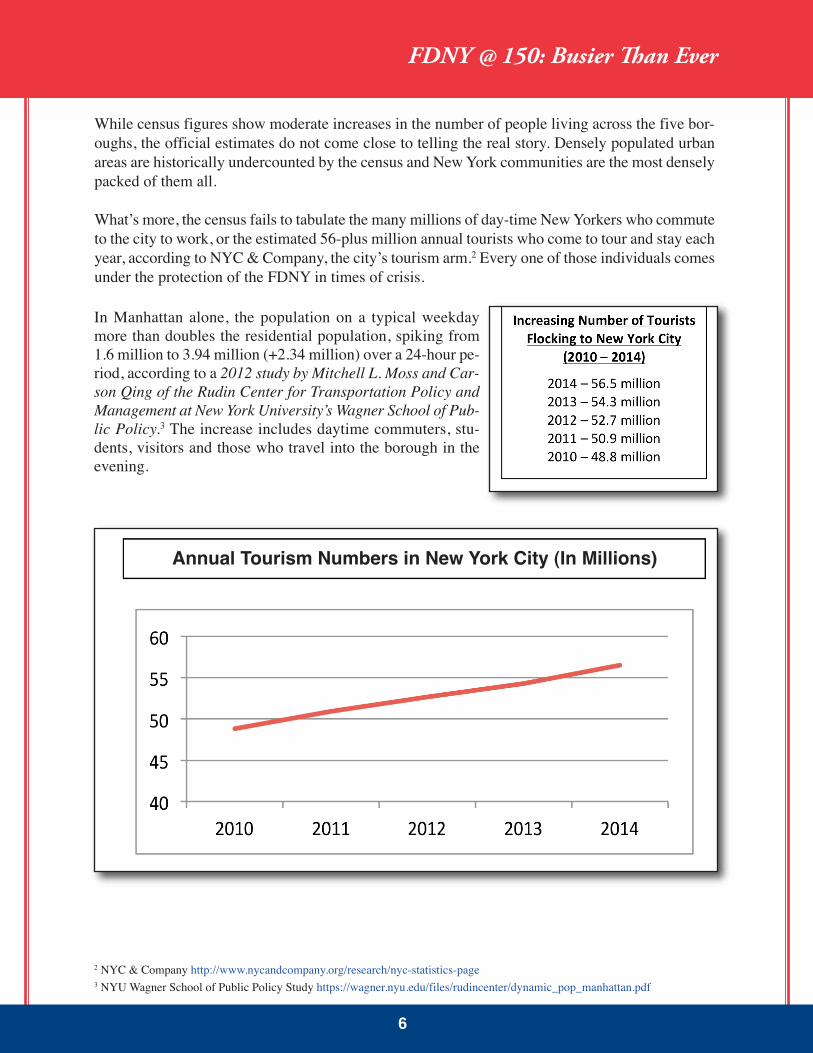
While census figures show moderate increases in the number of people living across the five bor-oughs, the official estimates do not come close to telling the real story. Densely populated urbanareas are historically undercounted by the census and New York communities are the most denselypacked of them all.
What’s more, the census fails to tabulate the many millions of day-time New Yorkers who commuteto the city to work, or the estimated 56-plus million annual tourists who come to tour and stay eachyear, according to NYC & Company, the city’s tourism arm.2 Every one of those individuals comesunder the protection of the FDNY in times of crisis.
2 NYC & Company http://www.nycandcompany.org/research/nyc-statistics-page3 NYU Wagner School of Public Policy Study https://wagner.nyu.edu/files/rudincenter/dynamic_pop_manhattan.pdf
In Manhattan alone, the population on a typical weekdaymore than doubles the residential population, spiking from1.6 million to 3.94 million (+2.34 million) over a 24-hour pe-riod, according to a 2012 study by Mitchell L. Moss and Car-son Qing of the Rudin Center for Transportation Policy andManagement at New York University’s Wagner School of Pub-lic Policy.3 The increase includes daytime commuters, stu-dents, visitors and those who travel into the borough in theevening.
Annual Tourism Numbers in New York City (In Millions)

7
FDNY @ 150: Busier an Ever
III. Modern FDNY Role, Fires & Much More Required:It is not just the increase in the number of people. The sharp surge in firefighter responses reflectsthe changing nature of the job. Since before the 9-11 attacks, the FDNY is no longer just a fire sup-pression agency. It has grown and evolved into New York City’s full service emergency responseagency.
Firefighters are the first to arrive for medical emergencies, allowing them to help quickly stabilizepatients for whom every extra second without care can have long-term medical consequences. Fire-fighters are also trained as New York City’s first line of defense for chemical, biological, radiologicaland nuclear threats.
New York City Firefighters’ job requires them to respond to gas leaks, building collapses, scaffoldrescues, explosions, water and steam leaks, carbon monoxide alarms, natural disasters, train derail-ments and other crises. For 2015, the FDNY emergency response numbers are up across the board: Structural fires increasedby 3.3 percent over 2014 and non-structural fires by 16.5 percent; medical emergencies were up nearly16.8 percent and other emergencies that firefighters respond to rose by 8.3 percent. A disturbing sta-tistic is that FDNY false alarms increased from 19,909 in 2014 to 21,045 last year, a 5.7 percent jump.
2014 East Harlem gas explosion
FDNY emergency response numbers in 2015
16.8%

8
FDNY @ 150: Busier an Ever
The historical FDNY emergency response numbers demonstrate this in an even starker picture. Since1990, there has been a 62 percent increase in emergency responses by firefighters; since 1970, a 121percent increase; and since 1960, New York City Firefighters have experienced an astounding 518percent jump in emergencies!
IV. Nation’s Busiest Fire Department Continually Shattering Recordsfor Emergency Responses, With New & Growing Dangers:
Increase in FDNY emergency responses in 2015
Since 9-11, firefighters have been asked to do more in an increasingly challenging environment. Asnew construction transforms neighborhoods and high-rises sprout from Midtown to DUMBO and theSouth Bronx, emergency calls require even more advanced training and present new obstacles for res-cues. Obviously it takes longer for firefighters to reach someone unconscious or trapped in a fire onthe 23rd floor, than it does on the second floor. Not only do these new challenges present dangers for those who would be victims of a fire or otheremergency, they also could pose a threat to our city’s economic vitality. New construction represents significant and vital investments. Firefighters protect not only lives butproperty. The longer it takes for firefighters to arrive at the scene of a fire, the more it grows and spreads.
518%
231, 122
9
FDNY @ 150: Busier an Ever
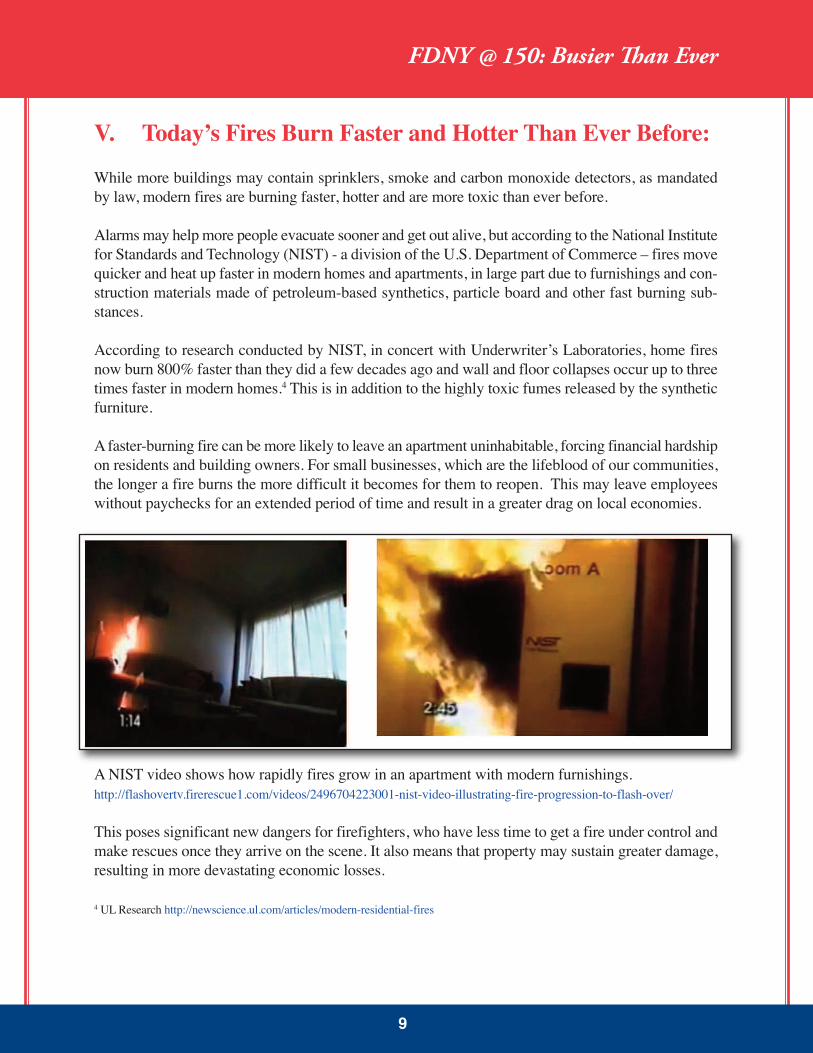
V. Today’s Fires Burn Faster and Hotter Than Ever Before:While more buildings may contain sprinklers, smoke and carbon monoxide detectors, as mandatedby law, modern fires are burning faster, hotter and are more toxic than ever before.
Alarms may help more people evacuate sooner and get out alive, but according to the National Institutefor Standards and Technology (NIST) - a division of the U.S. Department of Commerce – fires movequicker and heat up faster in modern homes and apartments, in large part due to furnishings and con-struction materials made of petroleum-based synthetics, particle board and other fast burning sub-stances.
According to research conducted by NIST, in concert with Underwriter’s Laboratories, home firesnow burn 800% faster than they did a few decades ago and wall and floor collapses occur up to threetimes faster in modern homes.4 This is in addition to the highly toxic fumes released by the syntheticfurniture.
A faster-burning fire can be more likely to leave an apartment uninhabitable, forcing financial hardshipon residents and building owners. For small businesses, which are the lifeblood of our communities,the longer a fire burns the more difficult it becomes for them to reopen. This may leave employeeswithout paychecks for an extended period of time and result in a greater drag on local economies.
A NIST video shows how rapidly fires grow in an apartment with modern furnishings.http://flashovertv.firerescue1.com/videos/2496704223001-nist-video-illustrating-fire-progression-to-flash-over/
This poses significant new dangers for firefighters, who have less time to get a fire under control andmake rescues once they arrive on the scene. It also means that property may sustain greater damage,resulting in more devastating economic losses.
4 UL Research http://newscience.ul.com/articles/modern-residential-fires

10
FDNY @ 150: Busier an Ever
VI. As NY City’s Population Swells, Response Times Must beMaintained to Ensure Safety:
Construction is booming and people are living and working here in record numbers. One of the keyreasons people feel confident living and working in NYC is that if an emergency occurs we have thebest first responders just minutes away. Yet as the number of emergency calls continues to break newrecords, it is essential to ensure that the quality and speed of the emergency responses keep pace.
With more people, congestion on our streets is greater. Traffic speeds have declined over the past twoyears, which can have a very significant impact on response times. According to research by Streets-blog, in conjunction with the Manhattan Borough President’s office, in 2014, the average traffic speedin Manhattan was only 8.51 MPH, compared to 9.35 MPH in 2010.
From 2013 to 2014, M.T.A. bus rush hour traffic speeds declined five percent, which is indicative ofthe growing traffic difficulties that also confront responding FDNY emergency vehicles.5
According to a transportation study released by the de Blasio administration in January 2016, NewYork City traffic speeds have decreased nearly 10 percent in the past two years and vehicle commutersfaced an average annual delay of 74 hours in 2014.6 The greater traffic congestion is, regardless ofthe time of day, FDNY units’ ability to arrive at the scene of emergencies is hampered.
With fires spreading quicker, more people living and working in their potential paths, and the devel-opment boom bringing significant new investment into our city, New York cannot afford to allow fireprotection to fall behind the demand.
With bus traffic slowing, it takes longer for firefighters to respond to the ever growing numberof emergencies that take place each year.
5 FHV Pause Bill http://www.streetsblog.org/wp-content/uploads/2015/06/FHV-Growth-Limitation-Bills-Presentation.pdf 6 Mayor Bill de Blasio For-Hire Vehicle Transportation Study http://www1.nyc.gov/assets/operations/downloads/pdf/For-Hire-Vehicle-Transportation-Study.pdf

11
FDNY @ 150: Busier an Ever
VII. Medical EmergenciesNew York City Firefighters responded to a total of 269,951 medical emergencies in 2015 and 231,122in 2014. New York City Firefighters are typically the first to arrive on the scene of medical emergen-cies, followed later by an ambulance crew.
Upon arrival firefighters immediately begin treatment to stabilize and assess the victim’s condition,until FDNY, EMS or other paramedics arrive at the scene. Those paramedics and EMT’s with a higherlevel of medical certification then transport victims to emergency rooms while continuing medicalcare.
When life is on the line, every second counts. The American Heart Association estimates that nation-ally more than 90 percent of serious cardiac arrest victims die before reaching the hospital. Studiesfind that a heart attack victim’s chance of survival is reduced by 7-10% with every minute that passesand that few resuscitation attempts succeed after 10 minutes. New York City firefighters acting asCertified First Responders with Defibrillation (CFR-D) treatment – used for cardiac emergencies –can all too often mean the difference between life or death.
Since the merger of the FDNY and EMS, survival rates can reach as high as 30-45 percent in NewYork City, partially due to firefighters’ ability to respond to the emergency scene within a 5 to 7minute window.7
With CFR-D Treatment SurvivalRate Grows to 45%
Without CFR-D Treatment Only 5% of Cardiac Arrest Victims Survive
7 http://www.heart.org/idc/groups/heart-public/@wcm/@adv/documents/downloadable/ucm_301646.pdf

12
FDNY @ 150: Busier an Ever
VIII. Underreporting True Firefighter Response Time: Truth vs. Fiction
The city of New York promotes that the citywide average response time to FDNY emergencies isapproximately four minutes, below a nationally accepted standard of five minutes or less in thecase of structural fires, for instance. This is an inaccurate portrayal because the FDNY emergencyresponse data the city is promoting is significantly misleading. In reality, the average citywide re-sponse times in 2015 were:
u 05:00 to structural fires and NOT 04:11, as widely reported;
u 06:03 for non-structural fires and NOT 04:30, as widely reported;
u 08:16 for non-fire emergencies (gas leaks, collapsed buildings, hazmat situations, ter-rorist threats, train derailments, elevator rescues and serious car accidents) and NOT the05:16 statistic published on the FDNY website;
u 08:11 for medical emergencies (heart attacks, strokes, seizures, major accidents, gunshotwounds and other major injury classifications) and NOT the reported 04:31 response time;
In 2012, a report by the Winbourne Consulting Group, com-missioned by the Bloomberg Administration demonstratedthat New York City’s 9-11 call system time measurementsand statistical protocols do not conform to industry bestpractices. At the time, Deputy Mayor Cas Holloway toldCBS News, “The report points out that the way responsetime is measured right now, it’s not measured entirely pre-cisely because this period when the 911 call taker picks upthe call, to when the fire call taker is conferenced in is notcounted.”8
Two years earlier, Council Member Lewis A. Fidler introduced Local Law 119, to require NewYork City to record response times, which includes the entire 911 call. The bill passed 49-0 on De-cember 10, 2013 and was signed into law December 13, 2013 by Mayor Bloomberg.
What is “Call to Curb”While this statistic should increase transparency of real FDNY emergency response times in thefuture, it still only represents true “Call to Curb” response, meaning the time that a 9-11 call is an-swered until the first unit arrives at the curb outside the building where the emergency is takingplace. If a victim or emergency is on the 5th or 20th floor, many more minutes will elapse beforefirefighters arrive at the door of the apartment where the emergency is occuring.
Despite this legal requirement to transparently report accurate emergency response times, the cityhas continued to spotlight the pre-Local Law 119 style response times, which underreport true emer-gency response data, in some cases by as much as 92%.9
8 http://newyork.cbslocal.com/2012/05/04/report-new-york-citys-911-system-beset-by-delays-errors/
9 http://legistar.council.nyc.gov/LegislationDetail.aspx?ID=657984&GUID=57F2CA96-6DF1-4F45-9368-7EB95E5240DA&Options=ID|Text|&Search=Response+Times

13
FDNY @ 150: Busier an Ever
To hunt for accurate response times on theFDNY website for instance, a New Yorkerwould first need to know what Local Law119 is and then would have to find andclick on an obscure tab labelled “LocalLaw 119 Compliance” on the FDNY web-site. Since the vast majority of the publicdoes not have this knowledge, most, in-cluding the news media and communityleaders, would instead click the “Fire Sta-tistics” tab, which instead offers the mostrecent data containing only the misleading“old school” version of New York City’sFDNY emergency reponse times.
The UFA has evaluated and compared these two data sets to identify and articulate acual responsetimes citywide, and for each of the five boroughs in both 2014 and 2015.
Photo Courtesy of Wikimedia Commons User PS-2507 (Peter Stehlik)

14
FDNY @ 150: Busier an Ever
!
Below are 2015 and 2014 Actual Citywide Response Times to Emergencies Per Local Law 119
2015 Actual Citywide Response Times to Emergencies Per LL 119 FDNY Reported
Response Times Actual FDNY
Firefighter Response
Times
Actual Time Discrepancy
(Underreporting)
Percentage Difference
(Underreporting)
Structural Fires 04:11 5:00 :49 19% Non-Structural Fires 04:30 06:03 1:33 34%
Non-Fire Emergencies
05:16 08:16 3:00 56%
Medical Emergencies
04:31 08:11 3:40 81%
2014 Actual Citywide Response Times to Emergencies Per LL 119 Structural Fires 04:09 04:53 :44 18%
Non-Structural Fires 04:25 05:57 1:32 35% Non-Fire
Emergencies 05:12 07:26 2:14 43%
Medical Emergencies
04:23 07:13 2:50 65%
New York CityCITYWIDE
Every second counts: New York City is underreporting average responsetimes for structural fires by 49 seconds and medical emergencies by a whop-ping three minutes and forty seconds (03:40). For people experiencing theseemergencies, those seconds can be the crucial difference between life anddeath.
Below are emergency response statistics the city spotlights:
05:00 20%
57%

15
FDNY @ 150: Busier an Ever
! !
Below are 2015 and 2014 Actual Manhattan Response Times to Emergencies Per Local Law 119
2015 Actual Manhattan Response Times to Emergencies Per LL 119 FDNY Reported
Response Times Actual FDNY
Firefighter Response
Times
Actual Time Discrepancy
(Underreporting)
Percentage Difference
(Underreporting)
Structural Fires 04:23 05:40 1:17 29% Non-Structural Fires 04:50 6:18 1:28 30%
Non-Fire Emergencies
04:49 08:07 3:18 68%
Medical Emergencies
05:01 08:26 3:25 68%
2014 Actual Manhattan Response Times to Emergencies Per LL 119 Structural Fires 04:18 04:58 :40 16%
Non-Structural Fires 04:35 06:10 1:35 35% Non-Fire
Emergencies 05:22 07:19 1:57 36%
Medical Emergencies
04:33 07:18 2:45 60%
MANHATTANMANHATTANManhattan response times are being underreported by 0:41 for structural fires;03:40 for non-fire emergencies such as gas leaks, construction site accidents,building collapses and terrorist threats, among other perilous situations; andmore than 3 ½ minutes (03:37) to medical emergencies. The actual average re-sponse time to medical emergencies in the borough of Manhattan is 08:26, astaggering 49% longer than what the city has been spotlighting. According tothe American Heart Association, a heart attack victim’s chances of survival arereduced by 7-10% with every minute of delay.
Below are emergency response statistics the city spotlights:
06:1805:04
05:27
04:49 3:37
3:40
:41 16%
49%

16
FDNY @ 150: Busier an Ever
B
!
+/=;D%30/%9)'(%34S%9)'H%J@<,3=%+0;;C=84%%T/-U;4-/%1.>/-%<;%5>/0?/4@./-%M/0%V;@3=%V3D%''W%
9)'(%J@<,3=%+0;;C=84%T/-U;4-/%1.>/-%<;%5>/0?/4@./-%M/0%VV%''W%! !"#$%T/U;0</S%
T/-U;4-/%1.>/-%J@<,3=%!"#$%!.0/B.?2</0%T/-U;4-/%1.>/-%
J@<,3=%1.>/%".-@0/U34@8%
FL4S/00/U;0<.4?I%
M/0@/4<3?/%".BB/0/4@/%
FL4S/00/U;0<.4?I%
X<0,@<,03=%!.0/-% B>6FA! BF6>B! 6FI! EEQ!#;4YX<0,@<,03=%!.0/-% B>6@J! B@6EJ! A6>B! >JQ!#;4Y!.0/%5>/0?/4@./-% BF6FE! BG6>E! E6@B! ?BQ!K/S.@3=%5>/0?/4@./-% BF6B>! BG6>B! >6EG! J@Q!
9)'H%J@<,3=%+0;;C=84%T/-U;4-/%1.>/-%<;%5>/0?/4@./-%M/0%VV%''W%X<0,@<,03=%!.0/-% B>6FB! BF6E@! 6F@! EBQ!
#;4YX<0,@<,03=%!.0/-% B>6@>! B@6EB! A6EG! >GQ!#;4Y!.0/%5>/0?/4@./-% BF6>I! B?6@F! E6A@! FJQ!K/S.@3=%5>/0?/4@./-% BF6BB! B?6FB! E6FB! ?GQ!
BROOKLYNBROOKLYNBrooklyn results show the actual response times to medical emer-gencies are underreported by 85%, or a discrepancy of 03:27, be-tween reported and actual response times. City data disclosuresunder Local Law 119 finds that it actually takes the FDNY enginecompanies 7 ½ minutes to respond to medical emergencies, whichinclude heart attacks, siezures, strokes, gun shot wounds and stab-bings or slashings. Non-fire emergencies, on average, are beingunderreported by about 3 minutes (02:50).
Below are emergency response statistics the city spotlights:

17
FDNY @ 150: Busier an Ever
!
Below are 2015 and 2014 Actual Queens Response Times to Emergencies Per Local Law 119
2015 Actual Queens Response Times to Emergencies Per LL 119 FDNY Reported
Response Times Actual FDNY
Firefighter Response
Times
Actual Time Discrepancy
(Underreporting)
Percentage Difference
(Underreporting)
Structural Fires 04:33 05:21 :48 17% Non-Structural Fires 04:45 06:26 1:41 35%
Non-Fire Emergencies
05:30 08:46 3:16 59%
Medical Emergencies
04:37 08:03 3:26 74%
2014 Actual Queens Response Times to Emergencies Per LL 119 Structural Fires 04:31 05:09 :38 14%
Non-Structural Fires 04:40 06:19 1:39 35% Non-Fire
Emergencies 05:26 07:51 2:25 44%
Medical Emergencies
04:34 07:24 2:50 62%
QUEENSQUEENSIn Queens, response times for non-fire emergencies and medical emer-gencies are distressingly high. Non-fire emergency response times pre-viously announced by the city were 05:30, yet in actuality the responsetime was 08:46. The underreporting for non-fire emergencies in QueensCounty is 03:16, or 59 percent.The average time for medical emergen-cies in Queens was said by the city to be 04:37 but in reality the elapsedaverage response time in the borough was 08:03, or a difference of 74%.According to FDNY directives, the survival rate for a heart attack victimis as high as 30-45% when firefighters from an FDNY engine companycan respond to medical emergencies within 5 to 7 minutes.
Below are emergency response statistics the city spotlights:

18
FDNY @ 150: Busier an Ever
To non-fire emergency calls, the discrepancy is still a staggering 82%, an
u
!
Below are 2015 and 2014 Actual Bronx Response Times to Emergencies Per Local Law 119
2015 Actual Bronx Response Times to Emergencies Per LL 119 FDNY Reported
Response Times Actual FDNY
Firefighter Response
Times
Actual Time Discrepancy
(Underreporting)
Percentage Difference
(Underreporting)
Structural Fires 04:18 05:19 1:01 24% Non-Structural Fires 04:44 06:26 2:43 57% #;4Y!.0/%5>/0?/4@./-% B@6>B! BI6BE! F6>E! JEQ!
Medical Emergencies
04:44 09:06 4:22 91%
2014 Actual Bronx Response Times to Emergencies Per LL 119 Structural Fires 04:18 05:12 :54 21%
Non-Structural Fires 04:39 06:14 1:35 34% Non-Fire
Emergencies 05:29 07:55 2:26 44%
Medical Emergencies
04:33 07:48 3:15 71%
BRONXBRONXResidents of the Bronx suffering from medical emergencies waited92% longer (an extra 4 minutes and 22 seconds) for first respondersto arrive than the time being announced by the City of New York.To non-fire emergency calls, the discrepancy is still a staggering64%, an underreporting of 3 minutes and 32 seconds. The responsetimes for each of these categories, 09:02 and 09:06, respectively,are the highest response times in the five boroughs.
Below are emergency response statistics the city spotlights:
1:423:32
36%64%92%
19
FDNY @ 150: Busier an Ever
!
Below are 2015 and 2014 Actual Staten Island Response Times to Emergencies Per Local Law 119
2015 Actual Staten Island Response Times to Emergencies Per LL 119 FDNY Reported
Response Times Actual FDNY
Firefighter Response
Times
Actual Time Discrepancy
(Underreporting)
Percentage Difference
(Underreporting)
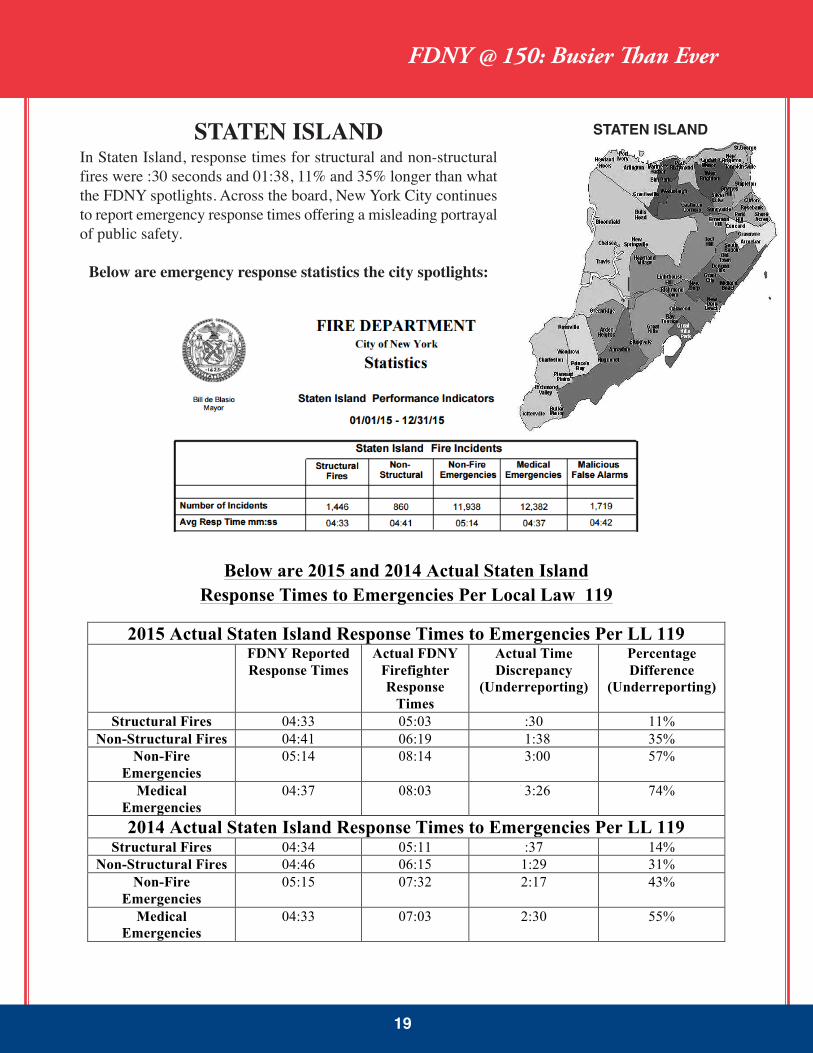
Structural Fires 04:33 05:03 :30 11% Non-Structural Fires 04:41 06:19 01:38 35%
Non-Fire Emergencies
05:14 08:14 03:00 57%
Medical Emergencies
04:37 08:03 03:26 74%
2014 Actual Staten Island Response Times to Emergencies Per LL 119 Structural Fires 04:34 05:11 :37 14%
Non-Structural Fires 04:46 06:15 1:29 31% Non-Fire
Emergencies 05:15 07:32 2:17 43%
Medical Emergencies
04:33 07:03 2:30 55%
STATEN ISLANDSTATEN ISLANDIn Staten Island, response times for structural and non-structuralfires were :30 seconds and 01:38, 11% and 35% longer than whatthe FDNY spotlights. Across the board, New York City continuesto report emergency response times offering a misleading portrayalof public safety.
Below are emergency response statistics the city spotlights:

For more information contact:[email protected]
facebook.com/ufanyc @UFANYC
WWW.UFANYC.ORG
Produced by theUniformed Firefighters Association