
FCE Bank plc ANNUAL REPORT AND ACCOUNTS...FCE Bank plc – ANNUAL REPORT AND ACCOUNTS – 2006 7 The...
100
FCE Bank plc ANNUAL REPORT AND ACCOUNTS for the year ended December 31, 2006
Transcript of FCE Bank plc ANNUAL REPORT AND ACCOUNTS...FCE Bank plc – ANNUAL REPORT AND ACCOUNTS – 2006 7 The...

FCE Bank plcANNUAL REPORTAND ACCOUNTSfor the year ended December 31, 2006

FCE Bank plc is an indirect wholly owned subsidiary of Ford. The Company and its subsidiaries are the automotive financial services arm of Ford in Europe and employ around 2,800 people who provide automotive finance and services to dealers, retail and fleet customers in
19 European countries. Our mission is to support the sales of Ford automotive brands in Europe (Ford, Jaguar, Land Rover, Mazda, and Volvo) while returning value to our shareholder. The Company typically operates as a secured lender in the financing products provided.
Contents
www.fcebank.com
FCE Bank plc. Central Office, Eagle Way, Brentwood, Essex CM13 3AR. Registered in England and Wales no 772784
FCE Bank plc – ANNUAL REPORT AND ACCOUNTS – 2006
Current Directors 4
Definitions 4
Ten year financial highlights 5
The Chairman’s statement 6
Annual report of the Directors 8
Directors’ responsibilities for financial statements 13
Strategy and performance summary 14
Risk management 18
Corporate governance 21
Independent auditors’ report to the members of FCE Bank plc 26
Consolidated income statement 27
Statement of total recognised income and expense 27
Balance sheets 28
Cash flow statements 29
Accounting policies 30
Notes to the financial statements 43
Web site addresses 97
European operating locations 97
3

Current Directors
Chairman B B Silverstone
Managing Director, Britain J Coffey
Executive Director, Global Operations and Technology N J Falotico
Executive Director, Finance and Strategy P R Jepson
Executive Director, European Sales Operations M E Ribits
Managing Director, Germany R N Rothwell
Director J Noone
Director A Vandenplas
Non-Executive Director C A Bogdanowicz-Bindert
Non-Executive Director R A Corbello
Non-Executive Director M F Robinson
Non-Executive Director A K Romer-Lee
Non-Executive Director C Toner
Secretary C V Rogoff
Registered office Central Office
Eagle Way
Brentwood
Essex CM13 3AR
United Kingdom
Auditors PricewaterhouseCoopers LLP
Chartered Accountants
and Registered Auditors
Southwark Towers
32 London Bridge Street
London SE1 9SY
DefinitionsFor the purpose of this report (with the exception of the Independent Auditors’ report) the term(i) ‘Company’ means FCE Bank plc. and its European branches(ii) ‘Group’, ‘FCE’, ‘we’, ‘us’ or ‘our’ means the Company, its European branches and subsidiaries(iii) ‘FMCC’ means Ford Motor Credit Company, an indirect wholly owned subsidiary of Ford(iv) ‘Ford’ means Ford Motor Company, the Companys ultimate parent company(v) ‘FCI’ means Ford Credit International, Inc. a subsidiary of FMCC and the Company’s immediate shareholder
�
Current Directors / Definitions

FCE Bank plc – ANNUAL REPORT AND ACCOUNTS – 2006
Profit before Tax £ Millions
370
323
229216
172178
264
245226222
0
50
100
150
200
250
300
350
400
1 9 9 6 1 9 9 7 1 9 9 8 1 9 9 9 2 0 0 0 2 0 0 1 2 0 0 2 2 0 0 3 2 0 0 4 2 0 0 5
UK GAAP IF RS
0
50
100
150
200
250
300
350
400
02468
101214161820
0200400600800
100012001400160018002000
0
50
100
150
200
250
300
350
400Profit before Tax £ Millions
370
323
229216
172178
264
245226222
0
50
100
150
200
250
300
350
400
1 9 9 6 1 9 9 7 1 9 9 8 1 9 9 9 2 0 0 0 2 0 0 1 2 0 0 2 2 0 0 3 2 0 0 4 2 0 0 5
UK GAAP IF RS
0
50
100
150
200
250
300
350
400
02468
101214161820
0200400600800
100012001400160018002000
0
50
100
150
200
250
300
350
400
400
350
300
250
200
150
100
50
0
226245
264
178 172
216229
329
356
UK GAAP
IFRS
UK GAAP
IFRS
Profit before Tax £ Millions
Total Assets£ Billions
Retail and Lease Contracts Outstanding000's
20
16
14
10
8
6
4
2
0
18
12
10.9
12.4 12.413.7
16.317.6
19.3 18.617.5
1,4031,487
1,5711,635
1,701 1,7371,659
1,522
1,359
2,000
1,600
1,400
1,000
800
600
400
200
0
1,800
1,200
329
200520042003200220012000199919981997 2006
200520042003200220012000199919981997 2006
200520042003200220012000199919981997 2006
17.0
1,245
5
Ten year financial highlights

6
The Chairman’s statement
I am pleased to announce that FCE achieved pre-tax profits of
£329 million in 2006. Although this is down £27 million from the
prior year it represents strong performance in a highly competitive
market. Exceptional items represented a £8 million decrease to
profits compared to a £34 million increase to profits in 2005 as
detailed in Note 8 to the accounts, ‘Profit before tax’
Overall FCE’s asset levels were at approximately the same level as
2005 and were well diversified by both market and automotive brand.
The retail portfolio continues to perform in line with the risk profiles
established for origination activities and is reflected in the near to
historically low loss levels being experienced. We are continuing to
invest in improving the data foundations and in enhancing risk
modelling capabilities. By maintaining a disciplined cycle of refresh
to our risk models we can be confident of continued dependable and
predictable portfolio performance.
The Company’s credit rating is linked to those of our parent company,
FMCC, which were lowered during 2006. However in July 2006,
Standard & Poor’s, a leading provider of independent credit ratings,
assigned to the Company a rating one notch higher than FMCC. The
Company has continued its European Medium Term Note programme
and resumed issuance under the programme at the beginning of
2007. To date in 2007 we have completed two large unsecured debt
transactions for Euro 1 billion and £750 million respectively. While
continuing to access the unsecured debt market, FCE has also increased
its use of securitisation and other asset-backed sources of funding
as these channels are presently more cost effective than unsecured
funding and provide access to a broad investor base. In 2006 FCE
launched a record number and value of securitisation transactions.
New Jaguar XKFord Transit Van Of The Year 2007 New Volvo C30 at 2006 Paris Motor Show

FCE Bank plc – ANNUAL REPORT AND ACCOUNTS – 2006 7
The completion of the five year programme to outsource FCE’s
full-service lease business in 12 markets in Europe is an example of
an alternative business model which also reduces FCE’s funding
requirements. FCE’s leasing product is now consistently branded as
“Business Partner” and is a fee-based, non-equity model that supports
Ford’s vehicle sales. FCE also has a well established automotive
insurance business through which we are able to provide a valuable
customer offering by partnering with leading insurance providers
and receive fees without exposure to the insurance risk.
Common IT applications and business processes are at the centre of
FCE’s drive to minimise its operating costs ensuring consistency in
the quality of service provided to our customers throughout Europe.
The wholesale financing system, which enables FCE to manage a
dealer’s inventory financing was introduced into our German operations
in 2006 and is now used by every FCE location in Europe. Our principal
platform for retail financing is operated in 17 of our 19 locations.
While in Britain and Germany we leverage a shared technology
platform with our US parent that provides appropriate scale and
economics for our two largest operations.
Thanks to the hard work and dedication of our employees we
accomplished a great deal in 2006 delivering strong profits while
supporting the sales of vehicles by our automotive partners. Our
close working relationship with both the automotive marketing and
sales organisations and the dealer network remains key to our
success. We continue to focus on new and innovative ways to support
vehicle sales through targeted offers that provide funding and
services to our customers at the time when they are in market. We
were particularly pleased to be able to support the launch of the
new Transit and the all new S-MAX, which were awarded 2007 Van
Of The Year and 2007 Car Of The Year respectively. The coming
year will no doubt be another challenging one, but with exciting new
products from our automotive partners such as the Ford Mondeo,
Volvo C30, Land Rover Freelander 2, and Mazda CX7, we are well
placed to achieve our goals.
Bernard B Silverstone
Chairman, FCE Bank plc.
28 March 2007
New Ford Mondeo New Land Rover Freelander 2 New Mazda CX7
Ford S-MAX Car Of The Year 2007
Germany
UKFrance
Italy
Spain
Other Europe
27%
30%6%
9%
8%
20%
Receivables by Market
UK
Germany
FranceItaly
Spain
Other Europe
22%
66%
6%11%
11%
26%
2002 2006
2002 2006
Receivables by Brand
Review of business and operations
Description of the businessThe Company is authorised and is regulated by the United Kingdom (UK) Financial Services Authority (FSA). The Company also holds a standard licence pursuant to the Consumer Credit Act 1974 in the UK and additional licenses to conduct financing business in other European locations.
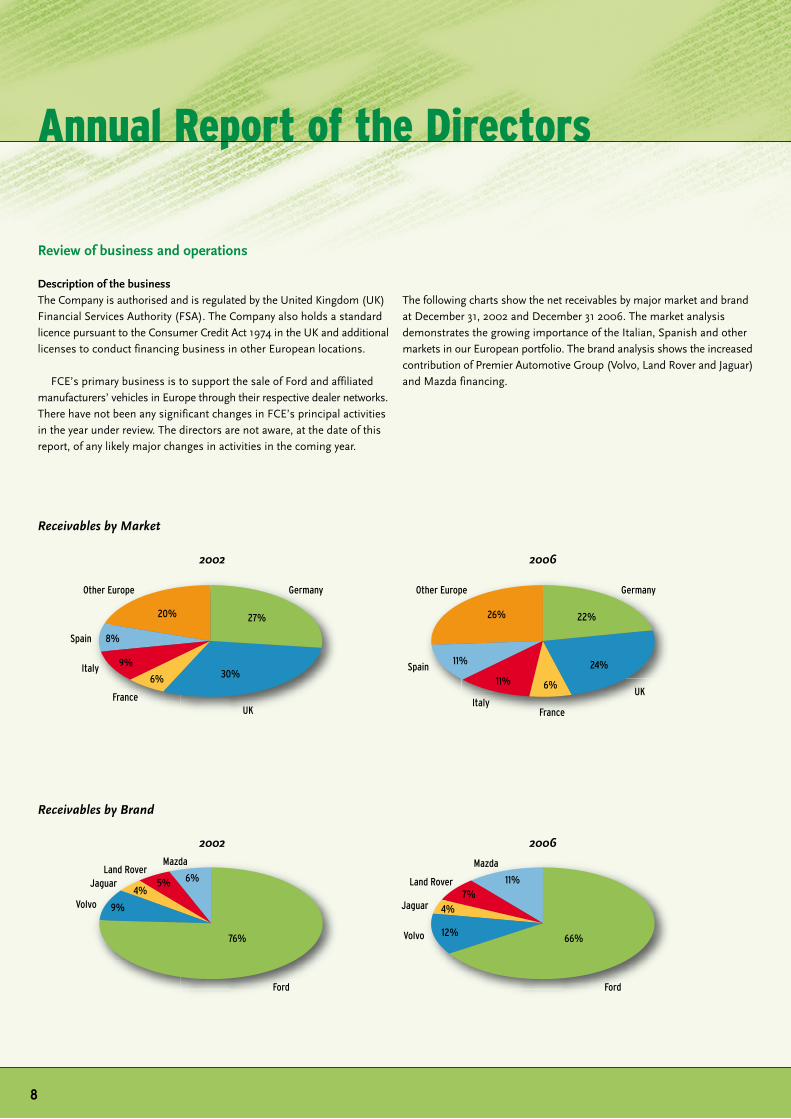
FCE’s primary business is to support the sale of Ford and affiliated manufacturers’ vehicles in Europe through their respective dealer networks. There have not been any significant changes in FCE’s principal activities in the year under review. The directors are not aware, at the date of this report, of any likely major changes in activities in the coming year.
The following charts show the net receivables by major market and brand at December 31, 2002 and December 31 2006. The market analysis demonstrates the growing importance of the Italian, Spanish and other markets in our European portfolio. The brand analysis shows the increased contribution of Premier Automotive Group (Volvo, Land Rover and Jaguar) and Mazda financing.
Ford
Jaguar
Volvo
Land Rover
Mazda
12%
11%7%
4%
76%
Ford
Volvo 9%
24%
JaguarLand Rover
Mazda
6%5%4%
Annual Report of the Directors
�

FCE Bank plc – ANNUAL REPORT AND ACCOUNTS – 2006 �
FCE provides a variety of retail, leasing and wholesale finance plans in the markets in which they operate. Retail financing is provided predominately through a number of title retention plans, including conditional sale, hire purchase and instalment credit loans. Operating and finance leases are provided to individual, corporate and other institutional customers, covering single vehicles as well as large and small fleets. In most markets operating leases are provided by business partners to whom FCE has outsourced certain functions whilst retaining responsibility for marketing and sales in return for fee income (see opposite under Full Service Leasing). FCE provides a variety of vehicle wholesale plans to dealers and in addition, loans for working capital and property acquisitions.
FCE also offers distinctive branded insurance products in partnership with local insurance providers. It distributes these products primarily through Ford, Jaguar, Land Rover, Mazda and Volvo dealerships in many European markets. Insurance is a fee-based, non-equity business for FCE. High loyalty rates mean that insurance continues to encourage repair work into franchised dealer body shops, as all policies require original manufacturer parts for repairs. Payment protection policies are sold in many European markets providing additional security to customers.
In addition to operating in the UK, the Company operates branches in 15 other European countries and has subsidiaries in the Czech Republic, Finland (where also it has a branch); Hungary, Poland and the UK (see Note 14 ‘Investment in group undertakings’). Other than the UK the main operations are in the EU focused in France, Germany, Italy and Spain. The European branches and subsidiaries of the Company have established additional finance facilities and associated trading styles primarily for Ford affiliated manufacturers in Europe which are detailed within the European operating locations listing on pages 97 and 98.
The Company’s Worldwide Trade Financing (WTF) division provides finance to distributors and importers in countries where typically there is no established local Ford presence. WTF currently provides finance in over 70 countries. In addition there are private label operations in some European markets.
Disposals
Full service leasingUnder our business model for the provision of full service leasing products (FSL) FCE retains responsibility for marketing and sales, for which it receives a fee income, and outsources finance, leasing, maintenance and repair services for current and future portfolios of commercial operating leases to a preferred FSL business partner identified on a market by market basis. This business model ensures that the outsourced operations will deliver a more competitive product and will continue marketing support for Ford and affiliated manufacturers. In line with this strategy, FCE has sold certain European FSL portfolios and outsourced the on-going provision of FSL products in those markets in the future. For further information on transactions completed in 2006 please see Note 35 ‘Disposals’ on page 84.
IrelandOn 23 December 2005 FCE agreed, with effect 3 January 2006, to outsource future provision of retail and lease finance in Ireland to a third party bank. For further information please see Note 35 ‘Disposals’ on page 84.
FCE continues to review its operations to identify alternative business structures and other opportunities to generate non-equity business.
Funding
During 2006 FCE continued to meet a significant portion of its funding requirements through sales of receivables taking advantage of the stability of the market for asset-backed securities. Asset-backed funding has lower relative costs compared to unsecured debt and provides further diversity of funding. In doing so we utilised a variety of both amortising and revolving structures as well as other forms of structured financing and factoring. For further information see Note 13: ‘Sales of Receivables and Related Financing’. Accordingly, we raised GBP 752 million of funding through the sale of wholesale automotive receivables in Belgium, the Netherlands and Germany. Also during the year, we raised GBP 1,122 million through the sale of retail automotive receivables in Belgium, Germany, the Netherlands and Spain, and approximately GBP 1,198 million through the sale of retail automotive receivables in the UK. Further securitisation transactions are planned during 2007.
In addition, FCE raises funds through local bank borrowing, private and public debt offerings and the issuance of commercial paper.
Share Capital
There was no change to the issued share capital of the Group during the year.
In December 2006 the Company received a capital contribution of US$ 75 million (2005 US$ 49 million) from its shareholder to be used solely to make a payment to Jaguar Cars Limited in return for use of group tax relief. For further information see Note 31 ‘Retained earnings and other reserves’.
Post balance sheet events
Refer to Note 36 ‘Post balance sheet events’.
Results and dividends
The directors did not declare any dividends during 2006 and do not recommend the payment of a final dividend (2005: none). The profit for the year of £231 million will be transferred to the Group’s reserves.
Future Outlook
For future prospects and key performance indicators please see the Strategy and Performance section starting on page 14.
Principal risks and uncertainties
The Risk Management section which starts on page 18 details the risks that FCE is exposed to during the normal course of business and the processes in place to manage those risks. The principal external business risks and uncertainties facing FCE which are not already included in the Risk Management section are itemised below:
FCE’s business is substantially dependent upon the sale of Ford and affiliated manufacturers’ vehicles in Europe and its ability to offer competitive financing on those vehicles. The automotive industry is highly competitive. Sales of Ford and affiliated manufacturers’ vehicles could decline if Ford is unable to respond to price pressure in the industry.
The provision of finance in Europe is highly competitive, and FCE must compete effectively with other providers of finance. Ford in Europe currently provides a number of marketing programmes that employ financing incentives to generate increased sales of vehicles. These financing incentives generate significant business for FCE. If Ford chose to shift the emphasis from such financing incentives, this could impact FCE’s share of financing related to Ford vehicles.
The credit ratings of FCE and FMCC have been closely associated with the rating agencies’ assessments of Ford. The lower credit ratings assigned to FCE and FMCC over the past several years are primarily a reflection of the rating agencies’ concerns regarding Ford’s automotive cash flow, profitability, market share, and health care and post-retirement benefit plan costs, as well as the potential impact on Ford of market factors such as excess industry capacity and industry pricing pressure. Lower credit ratings generally result in higher borrowing costs and reduced access to capital markets.
A future inability to access debt or securitisation markets at competitive rates or in sufficient amounts due to additional credit rating downgrades or other reasons or the withdrawal of existing liquidity facilities (such as bank committed lines of credit) or Ford intra-group lending may reduce the amount of receivables FCE could purchase and adversely affect profitability and volume.
10

FCE Bank plc – ANNUAL REPORT AND ACCOUNTS – 2006
Annual Report of the Directors
11
Directors
The full list of present directors is shown on page 4. Mr. Corbello resigned as Chairman of the Board effective 1 June 2006 upon his retirement from the Ford organisation. Mr. Silverstone was appointed as Chairman of the Board with effect the same date. Mr. J Moynes resigned as a director with effect 1 July 2006. Ms. Falotico and Mr. Ribits were appointed as directors effective 21 July 2006. Mr. Corbello and Mr. Romer-Lee were appointed as additional Non-Executive Directors effective 1 August 2006 and 1 October 2006 respectively. Mr. Thomson resigned as a Non-Executive Director and Chairman of the Audit Committee effective 31 December 2006. Mr. A Vandenplas was appointed as a director effective 28 March 2007. For details on the attendance record of Non-Executive Directors please see the section entitled Corporate Governance on page 21.
With the exception of Mr. Noone, Mr. Vandenplas and the five current Non-Executive Directors, Mrs. C A Bogdanowicz-Bindert, Mr. Corbello, Mr. M Robinson, Mr. Romer-Lee and Mr. C Toner, all directors are employees of the Company. Mr. Noone is employed elsewhere within Ford.
Mrs. C A Bogdanowicz-Bindert is a Non-Executive Director of McBride plc. She was previously a Non-Executive Director of BPH Bank, PBK Bank and Bank Gdanski before which she worked in various senior positions at Lehman Brothers and the International Monetary Fund.
Mr. Corbello is former Chairman of FCE up until June 2006, former Vice President of FMCC and Executive Vice President Ford Credit International, Inc and previously held various other senior posts with FMCC.
Mr. Robinson is a former Regional Managing Director at National Westminster Bank plc with whom previously he had held various other senior management posts including being Head of Streamline Merchant Services and Head of Card Services.
Mr. Romer-Lee is a Non-Executive Director of Sonali Bank (UK) Limited and was formerly a partner of PricewaterhouseCoopers LLP, where he was Head of Financial Services, Central & Eastern Europe and with whom he previously held various other senior management posts.
Mr. Toner has been Non-Executive Chairman of Barratt Developments plc since October 2002, having previously been Non-Executive Vice Chairman, former Deputy Group Chief Executive of Abbey National plc and former Deputy Chairman of NHBC.
In accordance with the Articles of Association all directors will seek re-appointment at the Annual General Meeting to be held on 28 March 2007.
None of the directors have a beneficial interest in the share capital of the Company. The executive directors hold shares in and/or options over shares in Ford – for further details please refer to Note 6 ‘Other operating expenses’.
Going concern
The Directors are confident in making the formal going concern statement that they have a reasonable expectation that the Company has adequate resources to continue in existence for the foreseeable future. For this reason the directors believe it is appropriate to continue to adopt the going concern basis in preparing these accounts.
Payments to suppliers
FCE does not operate a standard payment policy as each location is responsible for agreeing terms of payment in accordance with the conditions of the order. We seek to abide by the payment terms agreed with suppliers whenever it is satisfied that the supplier has provided the goods or services in accordance with the agreed terms and conditions.
The ratio, expressed in days, between the amounts owed by FCE to trade creditors at the end of the year and the amounts invoiced by suppliers in the year ended 31 December 2006 is 45 days (2005: 45 days).
Changes in fixed assets
Movements in fixed assets are as disclosed in Note 15 ‘Goodwill and other intangible assets’ and Note 16 ‘Property and equipment’ on pages 64 and 65 respectively.
Donations
FCE made no charitable or political donations during the year under review.
Pensions
The executive directors and the majority of employees of FCE are accruing benefits as members of various retirement plans administered by Ford affiliated companies. For further information see Note 25 ‘Retirement benefit obligations’ which commences on page 72
Employees
Details of the number of employees and related costs can be found in Note 6 ‘Other operating expenses’ which commences on page 50.
Employee communication
FCE keeps all employees informed of its activities on a national, pan-European and global level by means of in-house publications, intranet and the annual publication of its reports and financial statements. FCE conducts an annual employee satisfaction survey (Pulse) with a feedback and action-planning process aimed at continued dialogue between management and staff to achieve appropriate levels of employee satisfaction. In addition senior management conducts regular cascade meetings throughout the year with employees. These allow management to communicate key business information whilst allowing two-way dialogue via question and answer sessions on business matters. FCE also fully complies with relevant European and national legislation on information and consultation procedures.
Employment practices
FCE complies fully with relevant legislation enacted by both European and national parliaments and any impact the requirements of the FSA has on Human Resources (HR) policy and process. The Company is also committed to ‘best practice’ HR policies and processes in support of the business objectives and in line with its ‘Employer of Choice’ strategy.
As part of being an ‘Employer of Choice’ FCE has a retention strategy to ensure that the required skills and experience required to support business objectives are retained. This strategy includes the use of Personnel Development Committees to support the development of employees and ensure effective succession planning for key roles, a compensation and benefits philosophy targeted at achieving overall competitiveness with the external market, rewarding performing and retaining key skills, and completion of annual individual development plans for all employees which identify their training and development needs.
Diversity
FCE is committed to diversity in the workplace. This values differences provided by culture, ethnicity, race, gender, disability, nationality, age, religion/beliefs, education, experience and sexual orientation. FCE uses the views of employees to improve processes and to foster a culture based on honesty and respect.
Applications for employment by disabled persons are always fully considered, bearing in mind the aptitudes of the applicant concerned. In the event of members of staff becoming disabled every effort is made to ensure that their employment with FCE continues and that appropriate training is arranged. It is FCE’s policy that the training, career development and promotion of disabled persons should, as far as possible, be identical with that of other employees.
Consistent with the principle of diversity FCE also operates a Dignity at Work policy which promotes a business environment where employees, customers and suppliers are valued for themselves and their contribution to the business. FCE is committed to conducting its business with integrity and utilising the talents of everyone through providing an environment free from unlawful discrimination, harassment, bullying and victimisation.
FCE encourages its employees to give something back to their local community. Our policy in this area is that all employees can have up to 16 normal paid work hours per annum (equivalent to two paid work days) to invest in community projects.
12

Annual Report of the Directors / Directors’ responsibilities
for financial statements
FCE Bank plc – ANNUAL REPORT AND ACCOUNTS – 2006 13
Basel II revised international capital framework
Basel II provides a more robust and risk-sensitive framework for determining the capital requirements of financial institutions than the Basel I Accord it replaces. A thorough review of the implications of the adoption of Basel II has been carried out and the required changes to ensure compliance with BASEL II from January 2008 have been identified.
The Company’s Basel II project is being overseen by a Steering Committee with Executive level sponsorship and regular reporting to the Regulatory Compliance Committee.
FCE’s Basel II project has core aims of:• Demonstrating robust internal capital adequacy assessment processes,• Implementing credit risk reporting processes based on management
information systems,• Deploying comprehensive operational risk tracking, measurement
and management processes,• Developing compliant and informative market disclosures.
Disclosure of Information to Auditors
This confirmation is given and should be interpreted in accordance with the provisions of Section 234ZA of the Companies Act 1985. Each person who is a director at the date of approval of this report confirms that:• So far as the director is aware, there is no relevant audit information
of which FCE’s auditors are unaware; and• Each director has taken all the steps that he/she ought reasonably be
expected to have taken as a director to make himself/herself aware of any relevant audit information and to establish that FCE’s auditors are aware of that information.
Directors' responsibilities for financial statements
The directors are required by UK company law to prepare financial statements for each financial year that give a true and fair view of the state of affairs of the Company and the Group of which it forms a part as at the end of the financial year and of the profit or loss of the Group for that period.
The directors confirm that suitable accounting policies have been used and applied consistently, and reasonable and prudent judgements and estimates have been made in the preparation of the financial statements for the year ended 31 December 2006 and that they comply with International Financial Reporting Standards. The directors also confirm that applicable accounting standards have been followed and that the financial statements have been prepared on the going concern basis.
The directors are responsible for keeping proper accounting records which disclose with reasonable accuracy at any time the financial position of the Company and the Group and enable them to ensure that the financial statements comply with the Companies Act 1985. They are also responsible for safeguarding the assets of the Company and the Group, and for taking reasonable steps for the prevention and detection of fraud and other irregularities.
Auditors
In accordance with Section 384 of the Companies Act 1985, a resolution proposing the re-appointment of PricewaterhouseCoopers LLP as auditors will be submitted to the Annual General Meeting to be held on 28 March 2007.
BY ORDER OF THE BOARDCarol V RogoffCompany Secretary28 March 2007
Strategy and performance summary
FCE’s objective is to support the sales of our automotive partners while returning value to the shareholder.
Our business model goes beyond simply providing the means for customers to finance the purchase of a motor vehicle. It is to develop customer loyalty which is a critical success factor for the automotive dealer-based distribution system. Market research over time and over different markets and sectors consistently shows that customers who finance their vehicle purchase through FCE are significantly more likely to purchase their next vehicle from the same dealer and the same automotive brand.
The customer benefits from convenience of arranging finance and insurance at the vehicle point of sale and from the service provided by an organisation dedicated to support the customer right through the ownership experience. The dealer benefits from increased customer satisfaction and loyalty, from the support of a bank that supports dealers across the risk range, and that works closely and consistently with the vehicle manufacturer. The automotive company benefits from increased customer satisfaction and loyalty, consistent support for the dealer distribution model, and the efficiency of marketing with the aid of a consistent pan-European finance provider. FCE benefits from increased vehicle sales as this increases our own sales opportunity, through presence at the dealer point of sale, and through manufacturer support for finance-based marketing programs.
Strategies
Origination: Buy it Right, Price it Right We will continue to work closely with our brand partners to create value for our dealers and customers by seeking opportunities to go into the market place together, maximising our unique position as Ford’s financing company. Risk management is also key to our continued value and profitability. We have extensive risk management experience and our focus is on leveraging and strengthening global risk skills internally. Through these efforts, we will continue to optimise profitability as well as generate incremental vehicle sales for Ford.
Servicing:Operate Efficiently, Collect Effectively, Enhance Owner Loyalty FCE has continued to drive efficiencies by increasing the commonality of business processes and information technology platforms. This program has enabled us to reduce the number of unique market/brand systems in core activities. Our two major service centres in Germany and Britain combine with the US service centres of FMCC to drive efficiencies globally by sharing best practices. We remain focused on driving cost reductions in proportion to the overall size of our business while improving customer service and owner loyalty.
Funding:Fund it Efficiently, Manage Risk Our funding strategy is to maintain liquidity and access to diverse funding sources that are cost effective. In recent years, lower credit ratings generally have resulted in higher borrowing costs and reduced access to capital markets. Our credit ratings are closely associated with the credit ratings of Ford, which have been lowered in the last several years. This is mainly a reflection of concerns regarding Ford’s automotive cash flow and profitability, declining share of the US market, excess industry capacity, industry pricing pressure and rising US health care costs. In July 2006, Standard & Poor’s assigned a one notch positive differential credit rating to the Company versus FMCC. Asset-backed funding programs are more cost-effective compared with unsecured funding programs, and allow us access to a broader investor base. We plan to meet a significant portion of our funding requirements through securitisation transactions in 2007.
1�

FCE Bank plc – ANNUAL REPORT AND ACCOUNTS – 2006 15
Key Financial Ratios 2006 2005
Restated
Return on Equity 10.4% 11.8%
Margin (Net Income/Receivables) 3.8% 3.8%
Cost Effi ciency Ratio (Cost/Receivables) 1.5% 1.6%
Cost Affordability Ratio (Cost/Income) 40% 42%
Credit Loss Ratio (Losses/Receivables) 39 bpts 37 bpts
ACE*/ Risk Weighted Receivables* 14.7% 13.3%
ATE*/ Risk Weighted Receivables* 15.9% 14.6%
*(Refer to page 17 for defi nitions)
The Company is holding significantly more capital than is required by either our regulatory minimum or our internal risk-based capital policy. This supplements our funding program and is a source of further reassurance for our unsecured fixed income investors.
Sales Results 2006 2005
Automotive Brand share of Western Europe
Passenger Car Market* 12.4% 12.5%
FCE New Contracts as a percentage of Vehicle Sales 27.6% 28.5%
FCE Sales of New Retail/Lease Contracts (000’s) 711 734
*(Source: ACEA – European Automobile Manufacturers Association)
Ford, Jaguar, Land Rover, Mazda, and Volvo’s combined share of the Western European passenger car market was 12.4% in 2006, compared with a share of 12.5% in 2005 and 12.0% at the start of the decade. This reflects a highly competitive automotive market where manufacturers are balancing profits and volume.
Consistent with the funding strategy, FCE’s sales efforts are focused on supporting Ford’s automotive brands and our core products which are inherently low risk. Although new contract sales reduced, this partly reflects our decision to withdraw from marginal areas outside our core brands and products. This withdrawal together with our partnering strategy for the FSL business largely accounts for the reduction in managed assets since 2003. For further information in regard to the FSL partnering strategy refer to the ‘Disposals’ section, contained on page 9 of the Annual Report of the Directors.
Satisfaction Indices 2006 2005
Customer Satisfaction Index (CSI)
- Completely and Very Satisfied 86% 85%
- Completely Satisfied 41% 41%
Dealer Satisfaction Index (DSI)
- Completely and Very Satisfied 81% 80%
- Completely Satisfi ed 44% 45%
We monitor customer satisfaction through sample market research covering a range of questions. The CSI and DSI metrics we use internally reflect the percentage of those customers who are completely satisfied with their experience in dealing with us. Customers have different expectations by country and by automotive brand and these metrics are used internally to drive improvements in our service as a key contributor to further improving customer loyalty.
The credit loss ratio has reduced from a peak in 2002/2003 which reflected the economic cycle across Europe and difficult trading conditions for dealers particularly in Germany. FCE’s performance in 2006 on consumer credit losses reflects continued improvements in the deployment of risk management tools and improved economic conditions across most of Europe. Dealer losses are stable following a low in 2004 when there were significant recoveries from prior periods. There have been further enhancements to dealer risk models and risk monitoring in 2006.
The credit loss ratio has increased in 2006 to 39 basis points from 37 basis points in 2005. We would normally expect an average credit loss ratio of around 45 to 50 basis points. Almost all our lending is secured, normally against the motor vehicle, and FCE derives strong benefits from the risk management expertise that has been developed by FMCC in the US market.
FCE’s capitalisation has been strengthened as a result of both the increase in equity and the reduction in the balance sheet size in the year to December 2006.
The ratio for Adjusted Common Equity (ACE) as a percentage of risk weighted assets has increased to 14.7% at December 31, 2006 from 13.3% from a year ago.
• Adjusted Common Equity (ACE) = End of period shareholders’ equity less goodwill and other intangible assets,
• Adjusted Total Equity (ATE) = ACE plus perpetual subordinated debt (see Note 22 ‘Other borrowed funds’),
• Risk Weighted Assets = Assets multiplied by the appropriate percentage risk weighting utilised for capital adequacy ratio purposes.
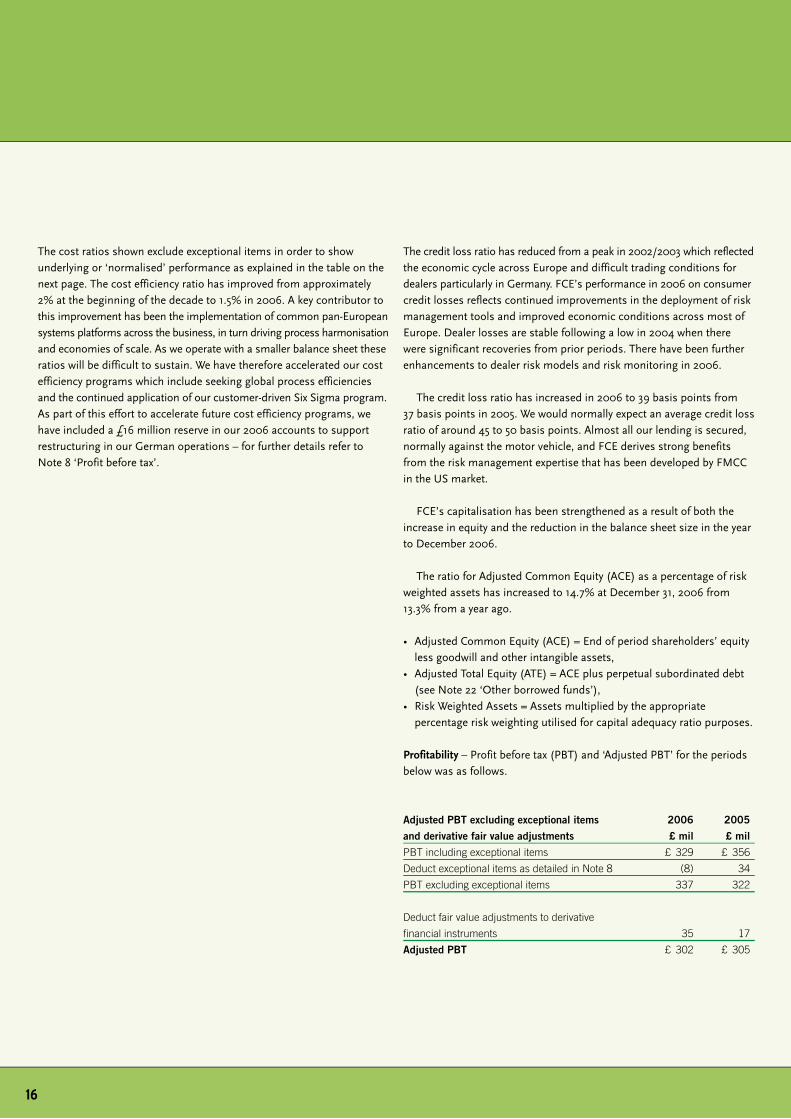
Profitability – Profit before tax (PBT) and ‘Adjusted PBT’ for the periods below was as follows.
Adjusted PBT excluding exceptional items 2006 2005
and derivative fair value adjustments £ mil £ mil
PBT including exceptional items £ 329 £ 356
Deduct exceptional items as detailed in Note 8 (8) 34
PBT excluding exceptional items 337 322
Deduct fair value adjustments to derivative
financial instruments 35 17
Adjusted PBT £ 302 £ 305
The cost ratios shown exclude exceptional items in order to show underlying or ‘normalised’ performance as explained in the table on the next page. The cost efficiency ratio has improved from approximately 2% at the beginning of the decade to 1.5% in 2006. A key contributor to this improvement has been the implementation of common pan-European systems platforms across the business, in turn driving process harmonisation and economies of scale. As we operate with a smaller balance sheet these ratios will be difficult to sustain. We have therefore accelerated our cost efficiency programs which include seeking global process efficiencies and the continued application of our customer-driven Six Sigma program. As part of this effort to accelerate future cost efficiency programs, we have included a £16 million reserve in our 2006 accounts to support restructuring in our German operations – for further details refer to Note 8 ‘Profit before tax’.
16

Strategy and performance summary
Memo: Key Financial data 2006 2005
£ mil £ mil
Restated
A [i] Average Year Net Receivables (*) £ 15,166 £ 15,643
A [ii] Risk Weighted Assets 15,681 15,524
B [i] Average Year Equity 2,228 1,982
B [ii] End of period Adjusted Common Equity (ACE) 2,311 2,070
B [iii] End of period Adjusted Total Equity (ATE) 2,494 2,271
INCOME:
- Operating income £ 722 £ 827
- Deduct exceptional items (Note 8) (8) (21)
- Depreciation of Operating lease vehicles (132) (211)
- Deduct exceptional items (Note 8) - (4)
C Normalised Income (Margin) £ 582 £ 591
OPERATING COSTS:
- Other Operating expenses £ (246) £ (248)
- Office equipment and leasehold amortisation (2) (1)
- Deduct exceptional items (Note 8) 16 (1)
D Normalised Operating costs £ (232) £ (250)
E Net losses (Note 12) (59) (58)
F Profit after tax £ 231 £ 234
KEY FINANCIAL RATIOS:
Return on Equity (F/B[i]) 10.4% 11.8%
Margin (C/A[i]) 3.8% 3.8%
Cost Efficiency Ratio (D/A[i]) 1.5% 1.6%
Cost Affordability Ratio (D/C) 40% 42%
Credit loss Ratio (E/A[i]) 0.39% 0.37%
ACE/Risk weighted assets (B[ii]/A[ii]) 14.7% 13.3%
ATE/Risk weighted assets (B[iii]/A[ii]) 15.9% 14.6%
(*) Includes ‘Loans and advances to customers’
(Note 12) and ‘Wholesale consignment vehicles’
(Note 18)
Excluding exceptional items and derivative fair value adjustments, adjusted PBT for 2006 was £302 million, reflecting similar earnings to the previous year.
FCE uses derivatives to manage interest rate and currency risks and, as a matter of policy, does not use derivatives for speculative purposes. For interest rate risk management, FCE uses primarily interest rate receive-float swaps which change the interest characteristics of debt from floating to fixed rate. Consequently, the fair value of derivatives increases in periods of rising forward interest rates and decreases in periods of falling forward interest rates. The fair value adjustment to derivatives for the periods disclosed result primarily from changes in forward interest rates during the same periods. As the derivative fair value adjustment does not reflect accruals accounting for the underlying assets and liabilities. This adjustment has been excluded in the calculation of ‘Adjusted PBT’.
Future prospectsIn 2007 FCE expects the ‘Adjusted PBT’, which excludes exceptional items and derivative fair value adjustments to be similar to 2006. Higher interest rates will increase margin pressure and potentially increase FCE’s credit losses from their current historically low level, but we are planning on accelerated operating cost efficiencies to partially mitigate this effect. Our sustained focus will be on operational effectiveness, increasing customer satisfaction and supporting Ford vehicles sales.
The future prospects statement is based on current expectations, forecasts and assumptions and involves a number of risks, uncertainties, and other factors that could cause actual results to differ. FCE cannot be certain that any expectations, forecasts and assumptions will prove accurate or that any projections will be realised. Our future prospects statement is based on the best available data at the time of issuance and will be updated upon publication of the FCE’s 2007 Interim Report and Accounts. Other than the FCE 2007 interim results FCE does not undertake to update or revise publicly any forward-looking statements, whether as a result of new information, future events or otherwise.
FCE Bank plc – ANNUAL REPORT AND ACCOUNTS – 2006 17

In the normal course of business, FCE is exposed to several types of risk. These risks include primarily credit, vehicle residual value, financial market (including interest rate, currency, counterparty and liquidity risks) and operational risk. Each form of risk is uniquely managed in the context of its contribution to overall risk. Business decisions are evaluated on a risk-adjusted basis and products are priced to be consistent with these risks.
FCE continuously reviews and improves its risk management practices.
Credit risk management
Credit risk is the possibility of loss from a customer’s or dealer’s failure to make payments according to contract terms. Whilst credit risk has a significant impact on our business, it is mitigated by the majority of FCE retail, leasing and wholesale financing having the benefit of a security interest in the finance vehicle or similar title retention plans. In the case of customer default the value of the re-possessed collateral provides a source of protection. FCE actively manages the credit risk on retail and commercial portfolios to balance the levels of risk and return.
Retail products (vehicle instalment sale, hire purchase, conditional sale and lease contracts) are classified by risk ranking, term and whether the vehicle financed is new or used. This segmented data is used to assist with product pricing to ensure risk factors are appropriately considered. In our two largest markets, Germany and UK data segmentation is also used in contract servicing to ensure contracts receive collection attention appropriate to their risk level. In these markets centralised servicing in the respective Customer Service Centres includes the application of enhanced risk management techniques and controls, e.g. harmonised originations and collections practices plus the realisation of economies of scale through the introduction and use of the latest servicing technology.
Retail credit underwriting typically includes a credit bureau review of each applicant together with an internal review and verification process. Retail credit loss management strategy is based on historical experience of many thousands of contracts. Statistically-based retail credit risk rating models are used to determine the creditworthiness of applicants. Portfolio performance is monitored regularly and originations processes and models are reviewed, revalidated and recalibrated as necessary.
FCE has developed retail behavioural models in the UK and Germany to assist in determining optimal collection strategies. Accounts are placed in risk categories for collection follow-up. Every reasonable effort is made to collect on delinquent accounts and keep accounts current.
Repossession is considered a last resort. A repossessed vehicle is sold and proceeds are applied to the amount owing on the receivable. FCE endeavours to realise maximum vehicle sale proceeds by using various resale channels. Collection of the remaining balance continues after repossession until the account is paid in full or is deemed economically uncollectable by FCE.
FCE extends commercial credit primarily to franchised dealers selling Ford’s brands in the form of approved lines of credit to purchase inventories of new and used vehicles. In addition, FCE provides mortgages, working capital and other types of loans to dealers. FCE also provides automotive financing for leasing and daily rental companies, as well as other commercial entities.
Each commercial lending request is evaluated, taking into consideration the borrower’s financial condition, supporting security, debt servicing capacity, and numerous other financial and qualitative factors. All credit exposures are scheduled for review at least annually at the appropriate commercial credit committee.
Financial and judgmental risk evaluation ratings are assigned to each
dealer. Asset verification processes are in place and include the use of physical audits of vehicle inventory with increased audit frequency for higher risk dealers. In addition, inventory-financing payoffs are monitored to detect adverse deviations from typical payoff patterns, in which case appropriate actions are taken.
Vehicle residual value risk management
Vehicle residual value risk is the possibility that the actual proceeds realised by FCE upon the sale of returned vehicles at contract termination will be lower than that forecast at contract initiation. FCE establishes the expected residual values based on input from independent consultants (who forecast residual values), current trade guide valuations and our own proprietary knowledge of historical experience and forward-looking information available to FCE. This information includes new product plans, marketing programmes and quality metrics. Any unfavourable variance between FCE’s forecast and expected residual values for existing contracts results in an adjustment to the carrying value of the asset on the balance sheet. Vehicle residual value provision adequacy is reviewed quarterly to reflect changes in the projected values. At contract end, FCE maximises residual value proceeds by using various resale channels including auctions, trade buyers and dealerships.
For further details see Note 29 ‘Vehicle residual values’.
1�
Risk management

FCE Bank plc – ANNUAL REPORT AND ACCOUNTS – 2006 1�
Financial market risk management
The objective of financial market risk management is to maximise financing margin while limiting the impact of changes in interest rates and foreign exchange rates. Interest rate and currency exposures are monitored and managed by FCE as an integral part of its overall risk management programme, which recognises the unpredictability of financial markets and seeks to reduce potential adverse effects on FCE’s operating results. Financial market risk is reduced through the use of interest rate and foreign exchange derivatives. FCE’s derivatives strategy is defensive; derivatives are not used for speculative purposes.
For further details on the use of derivatives see Note 11 ‘Derivative Financial Instruments’ and Note 39 ‘Interest rate risk’.
Interest rate riskFCE’s asset base consists primarily of fixed-rate retail instalment sale, hire purchase, conditional sale and lease contracts, with an average life of approximately three years, and floating rate wholesale financing receivables with an average life of about 90 days. Funding sources consist primarily of receivable sales (including securitisation and other structured and financing transactions), term debt (public and inter-company) and short-term commercial paper. To ensure funding availability over a business cycle, FCE often borrows longer-term debt (two to five years). Interest rate swaps are used to change the interest characteristics of the debt to match, within a tolerance range, the interest rate characteristics of FCE’s assets. This matching maintains margins and reduces profit volatility. Since a portion of assets is funded with equity, some income volatility can occur as changes in interest rates impact the repricing of FCE’s assets.
The interest rate sensitivity of FCE’s assets and liabilities, including derivatives, is evaluated each month. The interest rate repricing gap information is shown in Note 39 ‘Interest rate risk’.
Currency riskFCE faces exposure to currency exchange rate fluctuations if a mismatch exists between the currency of receivables and the currency of the debt funding those receivables. Whenever possible, FCE funds receivables with debt in the same currency, minimising exposure to exchange rate movements. When funding is in a different currency, FCE uses foreign currency derivatives to convert substantially all of our foreign currency debt obligations to the currency of the receivables.
For further details see Note 38 ‘Currency Risk’.
Counterparty riskCounterparty risk is the risk that FCE that could incur a loss if the counterparty to an investment, interest rate or foreign currency derivatives with FCE defaults. Counterparty exposure limits are established in order to minimise risk and provide counterparty diversification. Exposures to counterparties, including the mark-to-market on derivatives, are monitored on a regular basis. FCE’s Large Exposure position is reported to the FSA on a quarterly basis.
Liquidity riskLiquidity risk is the possibility of being unable to meet all present and future financial obligations as they become due. One of FCE’s major objectives is to maintain funding availability through any economic or business cycle. FCE focuses on developing funding sources to support both growth and refinancing of maturing debt. FCE also issues debt which on average mature later than assets liquidate, further enhancing overall liquidity.
FCE closely monitors the amount and mix of short-term funding to total debt, the overall composition of total debt and the availability of committed credit facilities in relation to the level of outstanding short-term debt.
FCE has the ability to use committed lines of credit from major banks, providing additional levels of liquidity. For further details of these facilities see Note 40 ‘Liquidity Risk’ on page 93. These facilities do not contain restrictive financial covenants (e.g. debt-to-equity limitations) or material adverse change clauses that could preclude borrowing under these facilities. FCE’s liquidity position is reported to the FSA on a quarterly basis.
In the normal course of funding transactions, FCE may generate more proceeds than are necessary for immediate funding needs. These excess amounts are maintained primarily as highly liquid investments, providing liquidity for our short-term funding obligations and flexibility in the use of other funding programs. We monitor our cash levels daily and adjust them as necessary to support our short-term liquidity needs.

Operational risk management
Operational risk is the risk of loss resulting from inadequate or failed internal processes, people or systems, or from external events. This definition of operational risk captures events such as IT problems, human error and shortcomings in the organisational structure, legal changes and lapses in internal controls, fraud or external threats.
FCE takes a pro-active approach to operational risk management, anticipating risks and minimising exposure through risk identification, assessment, monitoring, control and mitigation. FCE seeks to maintain a strong and open operational risk management culture throughout the organisation, embodied within a sound corporate governance structure and supported by company-wide operational risk management processes, policies and procedures.
The Operational Risk Committee (ORC) has responsibility for reviewing and monitoring major operational risks and for promoting the use of sound operational risk management across FCE. Among some of the main areas of focus for the ORC are the implementation of appropriate policies, processes and procedures to control or mitigate material exposure to losses and the maintenance of suitable contingency arrangements for all areas to ensure that FCE can continue to function in the event of an unforeseen interruption.
The guiding principle is that management at all levels is responsible for managing operational risks. FCE also maintains a strong internal control culture across the organisation through the Operations Review Program, a self-assessment control process used by the locations, which is reinforced by central controls from the Internal Control Office (ICO) and Ford General Auditors Office (GAO).
20
Risk management

Corporate governance
FCE Bank plc – ANNUAL REPORT AND ACCOUNTS – 2006 21
General
FCE considers effective corporate governance as a key factor underlying the strategies and operations of the Group. Since only some of the Company’s debt securities are listed on Stock Exchanges there are significantly fewer reporting obligations on the Company compared with a company with listed equity. Nevertheless the Company chooses to comply with many of the provisions of the Combined Code on Corporate Governance applicable to UK listed companies except for those provisions that are not appropriate for a wholly-owned subsidiary. The Company annually undertakes a benchmarking exercise against the latest guidelines on corporate governance making any adjustments as it deems necessary and appropriate. The Company has developed internal standards to ensure that the Group’s business is conducted within a strong and defined control framework. These internal standards are well suited to the evolving demands of corporate governance in highly regulated, multi-national environments.
Board of Directors
The Company is controlled through its Board of Directors. The Board’s main roles are to create value to the shareholder, to provide leadership to the Company, to approve the Company’s strategic objectives and to ensure that the necessary financial and other resources are made available to the management to enable them to meet those objectives. In addition, the Board of Directors has the ultimate responsibility for ensuring that the Company has systems of corporate governance and internal control appropriate to the various business environments in which it operates. The Board regularly evaluates all risks affecting the business and the processes put in place within the business to control them. The process is focused on the key risks, with formal risk mitigation, transfer or acceptance documented. FCE controls are based on Ford standard controls to safeguard assets, check the accuracy and reliability of financial and non-financial data, promote operational efficiency and encourage adherence to prescribed managerial policies. Policy Statements governing credit and treasury risk management are reviewed annually. The Board also reviews the Group’s commercial strategy, business and funding plans, the annual operating budget, capital structure and dividend policy, statutory accounts, financial performance and operation of each of the Company’s businesses, together with receiving other business reports and presentations from senior management, and is responsible for the appropriate constitution of Committees of the Board and to regularly review their activities and terms of reference as part of an annual review of corporate governance.
The composition of the Board is shown on page 4. The Board of Directors met four times during 2006. With the exception of Mr. Corbello and Mr. Noone, who were unable to attend the third meeting held in September 2006, all directors in post at the relevant time attended all the Board meetings. Four Non-Executive Directors were in post for and attended the first two meetings. Five Non-Executive Directors were in post at the time of the third meeting with four attending and six Non-Executives were in post and attended the fourth meeting in November 2006. All directors are equally accountable under the law for the proper stewardship of the Company’s affairs. Throughout the year under review, the Board and its Committees have been supplied with information and papers to ensure that all aspects of the company’s affairs are reviewed on a regular basis in accordance with a rolling agenda of work.
The Non-Executive Directors fulfill a vital additional role in corporate and regulatory accountability. The Board considers that, with the exception of Mr. Corbello, all the other Non-Executive Directors are independent in that they have no material business relationship with the Company (either directly or as a partner, shareholder or officer of an organisation that has a relationship with the Company) and that they neither represent the sole shareholder nor have any involvement in the day to day manage-ment of the Company or its subsidiaries. As such they bring objectivity and independent judgement to the Board, complement the Executive Directors’ skills, experience and detailed knowledge of the business and play a vital role in the governance of the Company through their member-ship of the Audit Committee.
There is no limitation on the term of office for the Non-Executive Directors. Each year the Non-Executive Directors hold a meeting with the Chairman to discuss Executive Director succession planning, corporate governance and any other relevant issues. The Board reviews the number of Executive and Non-Executive Directors periodically to maintain an appropriate balance for effective control and direction of the business.
Within the financial and overall objectives for the Company, the management of the Company is delegated to Directors and management through the Chairman. Each of the six Executive Directors is accountable for the conduct and performance of their particular business within the agreed business strategy. They have full authority to act subject to the reserved powers and sanctioning limits laid down by the Board and Company policies and guidelines.

Selection of Directors
Generally, specialist executive recruitment agencies are employed to find suitable Non-Executive Directors benchmarked against formal competency criteria. Formal interviews are held with senior Company management before a preferred candidate meets other members of the Board including all the current Non-Executive Directors. During the year, to address the imminent retirement of Mr. Thomson as Chairman of the Audit Committee, an additional Non-Executive Director, Mr Romer-Lee, was appointed to the Board to broaden the skills, experience and diversity of the Board and specifically to take Chairmanship of the Audit Committee upon Mr Thomson’s retirement. Five years had elapsed since Mr. Romer-Lee had been a Partner at PricewaterhouseCoopers, FCE’s external auditor, and he had severed all business and pension links with his previous employer and as such he was considered independent in line with current corporate governance best practice. Executive Directors (including the Chairman) are selected through a Ford Financial Personnel Development Committee process. Succession plans for Directors and other senior appointments are reviewed with senior representatives of the Company’s parent and the Non-Executive Directors. Proposals for all new Executive and Non-Executive Director appointments are then submitted for corporate approval both by senior FMCC Management in the US and to the Ford Corporate Governance Committee before being submitted to the Company’s Board of Directors for formal legal approval.
Training of Directors
Consideration is given to the training needs of Directors on their appointment to the Board and Non-Executive Directors benefit from a comprehensive induction to the Company’s business, risk management and regulatory environment. Also there is at least one off-site senior management financial review and strategy meeting held each year to which the Non-Executive Directors are invited and a training day is available as required for the Non-Executives where topical issues and developments can be discussed. From time to time Ford develops training programs for various aspects of Director’s duties and responsibilities, corporate governance and regulatory and general compliance matters.
Evaluation and Compensation of Directors
Each Executive Director is evaluated by FCE’s performance review process and remuneration is determined in line with the global compensation policy of FMCC and Ford. Senior representatives of FMCC evaluate the performance of the Chairman.
Non-Executive Directors receive a flat fee for their services. The level of the fee is reviewed periodically with the last review undertaken in 2005 and the fee level is approved by senior representatives of FMCC. The Non-Executive Directors do not receive any other remuneration or participate in any incentive arrangements.
During 2006 whilst still a Non-Executive Director of the Company Mr. Thomson was in receipt of a pension from Ford Motor Company Limited (‘FMCL’) accrued from completed service with FMCL prior to his appointment to the Company’s Board of Directors. In addition, as a senior management FMCL pensioner Mr. Thomson was entitled to a loan from the Company to purchase a new vehicle from FMCL (see Note 6 ‘Other operating expenses’).
Committees of the Board
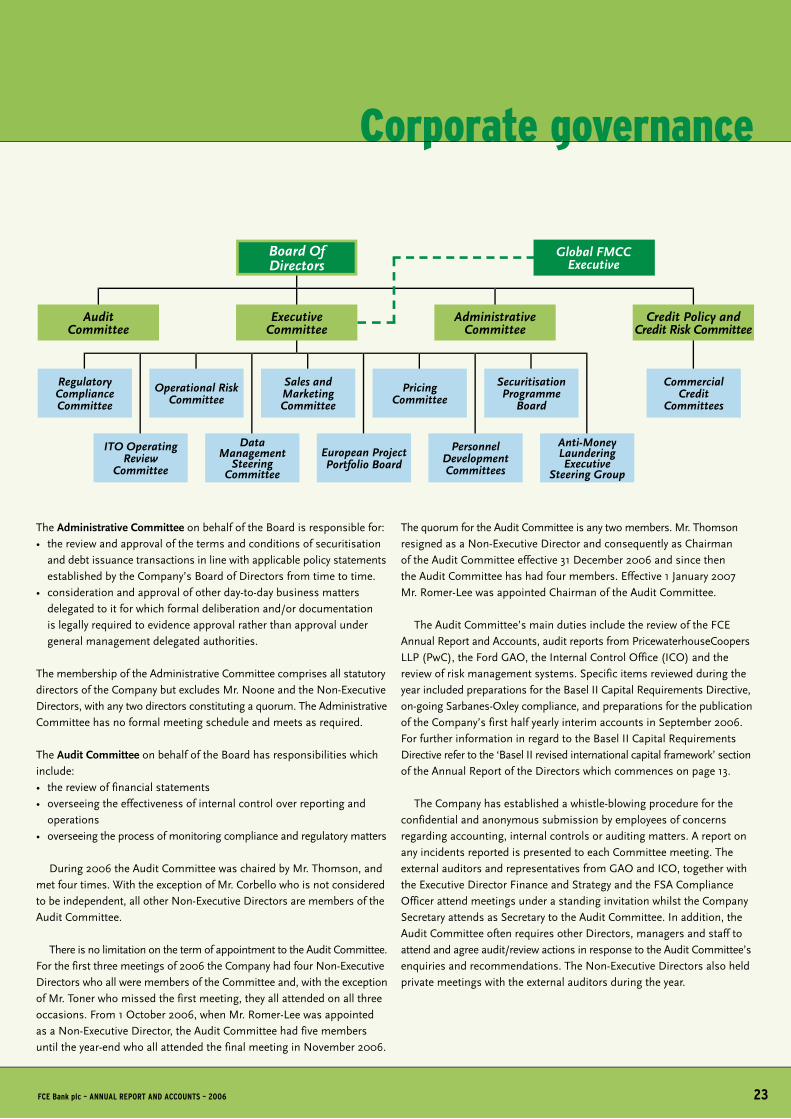
Three Committees reporting directly into the Board were established in 1998 and a fourth, the Administrative Committee, was established on 30 November 2004. Each of the Board Committees has specific delegated authority and detailed terms of reference which is reviewed annually with a report on the activities of each Committee presented to each meeting of the full Board of Directors.
The following chart shows the interrelationship of the Company’s
Board and Committees that deal with corporate governance:
22
Board Of Directors
Audit Committee
Credit Policy and Credit Risk Committee
Commercial Credit
Committees
Administrative Committee
Pricing Committee
Sales and Marketing Committee
Operational Risk Committee
Executive Committee
Global FMCC Executive
FCE Bank plc – ANNUAL REPORT AND ACCOUNTS – 2006 23
Corporate governance
Securitisation Programme
Board
Personnel Development Committees
European Project Portfolio Board
Data Management
Steering Committee
ITO Operating Review
Committee
Anti-Money Laundering Executive
Steering Group
Regulatory Compliance Committee
The Administrative Committee on behalf of the Board is responsible for:• the review and approval of the terms and conditions of securitisation
and debt issuance transactions in line with applicable policy statements established by the Company’s Board of Directors from time to time.
• consideration and approval of other day-to-day business matters delegated to it for which formal deliberation and/or documentation is legally required to evidence approval rather than approval under general management delegated authorities.
The membership of the Administrative Committee comprises all statutory directors of the Company but excludes Mr. Noone and the Non-Executive Directors, with any two directors constituting a quorum. The Administrative Committee has no formal meeting schedule and meets as required.
The Audit Committee on behalf of the Board has responsibilities which include:• the review of financial statements• overseeing the effectiveness of internal control over reporting and
operations• overseeing the process of monitoring compliance and regulatory matters
During 2006 the Audit Committee was chaired by Mr. Thomson, and met four times. With the exception of Mr. Corbello who is not considered to be independent, all other Non-Executive Directors are members of the Audit Committee.
There is no limitation on the term of appointment to the Audit Committee. For the first three meetings of 2006 the Company had four Non-Executive Directors who all were members of the Committee and, with the exception of Mr. Toner who missed the first meeting, they all attended on all three occasions. From 1 October 2006, when Mr. Romer-Lee was appointed as a Non-Executive Director, the Audit Committee had five members until the year-end who all attended the final meeting in November 2006.
The quorum for the Audit Committee is any two members. Mr. Thomson resigned as a Non-Executive Director and consequently as Chairman of the Audit Committee effective 31 December 2006 and since then the Audit Committee has had four members. Effective 1 January 2007 Mr. Romer-Lee was appointed Chairman of the Audit Committee.
The Audit Committee’s main duties include the review of the FCE Annual Report and Accounts, audit reports from PricewaterhouseCoopers LLP (PwC), the Ford GAO, the Internal Control Office (ICO) and the review of risk management systems. Specific items reviewed during the year included preparations for the Basel II Capital Requirements Directive, on-going Sarbanes-Oxley compliance, and preparations for the publication of the Company’s first half yearly interim accounts in September 2006. For further information in regard to the Basel II Capital Requirements Directive refer to the ‘Basel II revised international capital framework’ section of the Annual Report of the Directors which commences on page 13.
The Company has established a whistle-blowing procedure for the confidential and anonymous submission by employees of concerns regarding accounting, internal controls or auditing matters. A report on any incidents reported is presented to each Committee meeting. The external auditors and representatives from GAO and ICO, together with the Executive Director Finance and Strategy and the FSA Compliance Officer attend meetings under a standing invitation whilst the Company Secretary attends as Secretary to the Audit Committee. In addition, the Audit Committee often requires other Directors, managers and staff to attend and agree audit/review actions in response to the Audit Committee’s enquiries and recommendations. The Non-Executive Directors also held private meetings with the external auditors during the year.

Committees of the Board (continued)
The Board is confident that the collective experience of the Audit Committee members enables them, as a group, to act as an effective audit committee. The Committee also has access to the financial expertise of the Group and its auditors, internal and external, and can seek further professional advice at the Company’s expense if required. The Board considers that Mr. Romer-Lee, in particular, qualifies as having recent and relevant financial experience to bring to the deliberations of the Committee as required by the Combined Code on Corporate Governance.
The Credit Policy and Credit Risk Committee (Credit Policy Committee), usually chaired by the FCE Chairman, determines on behalf of the Board, the general credit policy of the Group on a pan-European basis. It oversees and reviews retail and commercial credit risk and vehicle residual value risk. It reports to each full Board meeting held during the year. Six of the ten members of the Credit Policy Committee are members of the Board of Directors. The Credit Policy Committee consists of individuals responsible for the key components of the business; British, German and European markets, brand directors and pan-European and cross-brand functions such as credit policy and credit risk, marketing, sales, and finance.
The quorum for the Credit Policy Committee is five members to include two from either the Chairman, the Executive Director Finance and Strategy, the Executive Director, Marketing, Sales and Strategy and the Director Credit Policy and Risk Management provided one is either the Executive Director Finance and Strategy or the Director Credit Policy and Risk Management. In addition a Business Unit Head is required for the quorum. The Credit Policy Committee meets monthly. During 2006 it held eleven meetings. No more than three members were absent at any of the meetings held during 2006.
The Commercial Credit Committees have been established as sub-committees of the Credit Policy Committee to review and approve commercial lending requests across Europe. The Commercial Credit Committees are constituted and operate at district, country, European and international levels according to delegated approval authorities and risk assessment.
The Executive Committee usually chaired by the FCE Chairman, reviews, on behalf of the Board, the Group’s strategic direction and policy and the enhancement of shareholder and customer value whilst improving growth, efficiency and profitability. The Executive Committee reports to the Board at each of the full Board meetings held during the year. For the first six months of 2006 the Executive Committee had thirteen members and thereafter fourteen members of whom six are members of the Board of Directors.
The Executive Committee consists of individuals responsible for the key components of the business; British, German and European markets and brand directors, as well as pan-European and cross-brand functions such as credit policy and credit risk, information technology, marketing, sales, general counsel, strategy and finance. Either the Chairman or the Executive Director Finance and Strategy are required in attendance as one of seven members needed to constitute a quorum. The Executive Committee meets monthly and held 12 meetings during 2006. With the exception of the August meeting when four members were absent no more than two members were absent from any meeting.
Several sub-committees have been established and meet regularly and cover all areas of the business. These sub-committees report into the Executive Committee:• The Regulatory Compliance Committee informs senior management
and the Audit Committee on regulatory compliance issues. Its responsibilities include monitoring and evaluating regulatory changes and determining the Company’s response or changes needed. The Committee also reviews returns submitted to the FSA.
• The Information Technology Office Operating Review Committee monitors, aligns and resolves plans and priorities across FCE to support key information technology related projects and initiatives.
• The Operational Risk Committee has the overall responsibility for reviewing and monitoring major operational risks and for promoting the use of sound operational risk management across FCE.
• The Data Management Steering Committee provides a co-ordinated input to process and IT application development to meet business requirements through data solutions that are consistent with strategic priorities.
• The Sales and Marketing Committee facilitates regular and timely information exchanges between business units and functional areas covering sales, marketing and operational matters.
• The European Project Portfolio Board oversees the management of FCE’s strategic projects. This sub-committee meets on a monthly basis to review, approve and prioritise large / strategic projects.
• The Pricing Committee reviews and approves pricing strategies and policies on a national, regional and European basis.
• The Personnel Development Committees drive personnel development and career and vacancies planning. The sub-committees are comprised of members of management, who are assisted by Human Resources representatives.
• The Securitisation Programme Board approves and reviews structural and policy matters concerning planned securitisation transactions and securitisation issues raised at other committees and forums may be referred to it for further deliberation.
2�
Corporate governance
• The Anti-Money Laundering Executive Steering Group oversees compliance with the provisions of the relevant European Community Money Laundering and related directives as applied to those markets in which FCE operates.
In addition, the Executive Committee may from time-to-time appoint working groups or steering committees to address specific business risks and opportunities.
Audit and internal control
PricewaterhouseCoopers LLP (PwC) conducts audits of FCE’s financial statements, in accordance with relevant legal and regulatory requirements and International Standards on Auditing (UK and Ireland). PwC provides external audit opinions on FCE’s financial statements.
To help ensure that the auditors’ independence and objectivity are not prejudiced by the provision of non-audit services, the Audit Committee has agreed that the external auditors should be excluded from providing management, strategic or Information Technology consultancy services and all other non-audit related services, unless the firm appointed as external auditor is:- the only provider of the specific expertise/service required; or- the clear leader in the provision of the service and is able to provide
that service on a competitively priced basis.
As auditors, PwC will undertake work that they must or are best placed to complete. This includes tax-related work, formalities related to borrowings, regulatory reports or work in respect of acquisitions and disposals.
Ford’s GAO is fully independent from FCE; its coverage is based on the relative risk assessment of each ‘audit entity’, which is defined as a collection of processes and systems that are closely related. The GAO’s mission is to provide objective assurance and advisory services to Management and the Board of Ford and to the Company’s Audit Committee in order to improve the efficiency and effectiveness of Company operations and assist the Company in achieving its objectives through systemic and disciplined auditing.
ICO is based within FCE to offer control consultancy, audits, process reviews, advice on systems controls and control training across all locations. ICO access to internal reports and operational experience informs the conduct of operational reviews and audits. The department has created and delivered training in ongoing controls as part of formal feedback to reflect learning points derived from the audits and reviews. This matches industry leading-edge practices to assist management in early identification of potential control risks which is an essential element of the process to ensure compliance with the Sarbanes-Oxley Act.
The Operations Review Programme (ORP) has been designed, implemented and revised for the last several years to embed the assessment of risk and opportunity across the Group. The ORP provides the means for the management of each location or activity to continually monitor control integrity throughout their operation by the performance of regular and appropriate checks and embeds sound governance principles in key processes. The ORP facilitates high levels of control self-assessment as part of good business practice. It also embodies the principles established by the UK’s Turnbull Committee on achieving the standards in the Combined Code of Corporate Governance. The ORP was modified for, and provides a key structure in FCE’s compliance with the US Sarbanes-Oxley legislation.
FCE Bank plc – ANNUAL REPORT AND ACCOUNTS – 2006 25

We have audited the group and parent company financial statements (the ‘financial statements’) of FCE Bank Plc for the year ended 31 December 2006 which comprise the Consolidated Income Statement, the Group and Parent Company Balance Sheets, the Group and Parent Company Cash Flow Statements, the Group and Parent Company Statements of Recognised Income and Expense and the related notes. These financial statements have been prepared under the accounting policies set out therein.
Respective responsibilities of directors and auditorsThe directors’ responsibilities for preparing the Annual Report and the financial statements in accordance with applicable law and International Financial Reporting Standards (IFRSs) as adopted by the European Union are set out in the Statement of Directors’ Responsibilities.
Our responsibility is to audit the financial statements in accordance with relevant legal and regulatory requirements and International Standards on Auditing (UK and Ireland). This report, including the opinion, has been prepared for and only for the company’s members as a body in accordance with Section 235 of the Companies Act 1985 and for no other purpose. We do not, in giving this opinion, accept or assume responsibility for any other purpose or to any other person to whom this report is shown or into whose hands it may come save where expressly agreed by our prior consent in writing.
We report to you our opinion as to whether the financial statements give a true and fair view and have been properly prepared in accordance with the Companies Act 1985 and, as regards the group financial statements, Article 4 of the IAS Regulation. We also report to you whether in our opinion the information given in the Directors’ Report is consistent with the financial statements.
In addition we report to you if, in our opinion, the company has not kept proper accounting records, if we have not received all the information and explanations we require for our audit, or if information specified by law regarding directors’ remuneration and other transactions is not disclosed.
We read the other information contained in the Annual Report and consider whether it is consistent with the audited financial statements. The other information comprises only the Directors’ Report, the Chairman’s Statement, Risk Management and Corporate Governance. We consider the implications for our report if we become aware of any apparent misstatements or material inconsistencies with the financial statements. Our responsibilities do not extend to any other information.
Independent auditors’ report to the members of FCE Bank plc
Basis of audit opinionWe conducted our audit in accordance with International Standards on Auditing (UK and Ireland) issued by the Auditing Practices Board. An audit includes examination, on a test basis, of evidence relevant to the amounts and disclosures in the financial statements. It also includes an assessment of the significant estimates and judgments made by the directors in the preparation of the financial statements, and of whether the accounting policies are appropriate to the group’s and company’s circumstances, consistently applied and adequately disclosed.
We planned and performed our audit so as to obtain all the information and explanations which we considered necessary in order to provide us with sufficient evidence to give reasonable assurance that the financial statements are free from material misstatement, whether caused by fraud or other irregularity or error. In forming our opinion we also evaluated the overall adequacy of the presentation of information in the financial statements.
OpinionIn our opinion:• the group financial statements give a true and fair view, in accordance
with IFRSs as adopted by the European Union, of the state of the group’s affairs as at 31 December 2006 and of its profit and cash flows for the year then ended;
• the parent company financial statements give a true and fair view, in accordance with IFRSs as adopted by the European Union as applied in accordance with the provisions of the Companies Act 1985, of the state of the parent company’s affairs as at 31 December 2006 and cash flows for the year then ended;
• the financial statements have been properly prepared in accordance with the Companies Act 1985 and, as regards the group financial statements, Article 4 of the IAS Regulation; and
• the information given in the Directors’ Report is consistent with the financial statements.
PricewaterhouseCoopers LLPChartered Accountants and Registered AuditorsLondon 28 March 2007
Notes:The maintenance and integrity of the FCE Bank Plc website is the responsibility of the directors; the work carried out by the auditors does not involve consideration of these matters and, accordingly, the auditors accept no responsibility for any changes that may have occurred to the financial statements since they were initially presented on the website.
Legislation in the United Kingdom governing the preparation and dissemination of financial statements may differ from legislation in other jurisdictions.
26

FCE Bank plc – ANNUAL REPORT AND ACCOUNTS – 2006 27
Consolidated income statement /Statement of total recognised
income and expense
Consolidated income statementfor the year ended 31 December Group
Notes 2006 2005
£ mil £ mil
Restated*
Interest income £ 1,114 £ 1,143
Interest expense (627) (630)
NET INTEREST INCOME 2 487 513
Fees and commissions income 82 64
Fees and commissions payable (7) (6)
NET FEES AND COMMISSIONS INCOME 3 75 58
Dividend income 4 - 1
Other operating income 5 160 255
OPERATING INCOME 722 827
Impairment losses on loans and advances 12 (48) (28)
Other operating expenses 6 (246) (248)
Depreciation on tangible fixed assets 16 (134) (212)
Fair value adjustments to derivative
financial instruments 7 35 17
PROFIT BEFORE TAX 8 329 356
Income tax expenses 9 (98) (122)
PROFIT AFTER TAX AND
PROFIT FOR THE YEAR £ 231 £ 234
Statement of total recognised income and expensefor the year ended 31 December Company Group
Notes 2006 2005 2006 2005
£ mil £ mil £ mil £ mil
Restated* Restated*
Profit for the financial year £ 218 £ 196 £ 231 £ 234
Cash flow hedges fair value gains 7 - 7 - 7
Currency translation differences on
foreign currency net investments 31 (30) (15) (30) (17)
Capital contribution 31 38 28 38 28
TOTAL RECOGNISED INCOME RELATING
TO THE YEAR SINCE LAST ANNUAL REPORT £ 226 £ 216 £ 239 £ 252
* Refer to page 31 Accounting Policy A for details of 2005 restated figures
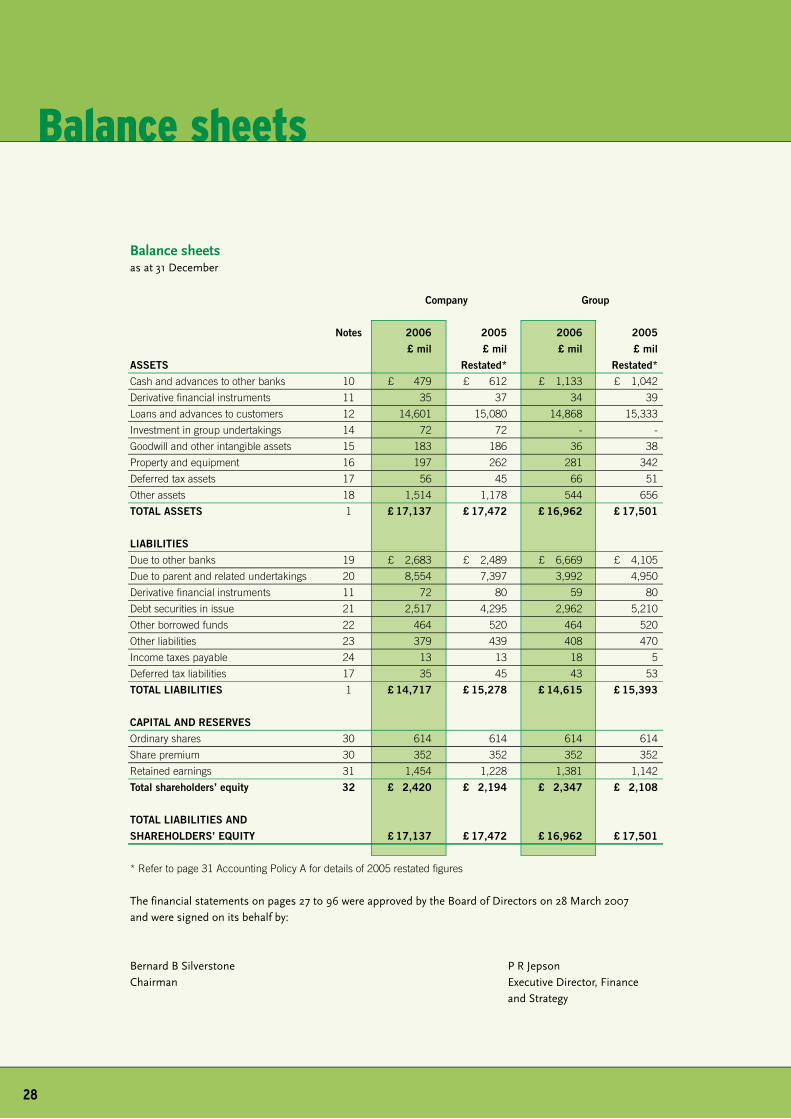
Balance sheets
Balance sheetsas at 31 December
Company Group
Notes 2006 2005 2006 2005
£ mil £ mil £ mil £ mil
ASSETS Restated* Restated*
Cash and advances to other banks 10 £ 479 £ 612 £ 1,133 £ 1,042
Derivative financial instruments 11 35 37 34 39
Loans and advances to customers 12 14,601 15,080 14,868 15,333
Investment in group undertakings 14 72 72 - -
Goodwill and other intangible assets 15 183 186 36 38
Property and equipment 16 197 262 281 342
Deferred tax assets 17 56 45 66 51
Other assets 18 1,514 1,178 544 656
TOTAL ASSETS 1 £ 17,137 £ 17,472 £ 16,962 £ 17,501
LIABILITIES
Due to other banks 19 £ 2,683 £ 2,489 £ 6,669 £ 4,105
Due to parent and related undertakings 20 8,554 7,397 3,992 4,950
Derivative financial instruments 11 72 80 59 80
Debt securities in issue 21 2,517 4,295 2,962 5,210
Other borrowed funds 22 464 520 464 520
Other liabilities 23 379 439 408 470
Income taxes payable 24 13 13 18 5
Deferred tax liabilities 17 35 45 43 53
TOTAL LIABILITIES 1 £ 14,717 £ 15,278 £ 14,615 £ 15,393
CAPITAL AND RESERVES
Ordinary shares 30 614 614 614 614
Share premium 30 352 352 352 352
Retained earnings 31 1,454 1,228 1,381 1,142
Total shareholders’ equity 32 £ 2,420 £ 2,194 £ 2,347 £ 2,108
TOTAL LIABILITIES AND
SHAREHOLDERS’ EQUITY £ 17,137 £ 17,472 £ 16,962 £ 17,501
* Refer to page 31 Accounting Policy A for details of 2005 restated figures
The financial statements on pages 27 to 96 were approved by the Board of Directors on 28 March 2007 and were signed on its behalf by:
Bernard B Silverstone P R JepsonChairman Executive Director, Finance and Strategy
2�

FCE Bank plc – ANNUAL REPORT AND ACCOUNTS – 2006 2�
Cash flow statements
Cash flow statementsfor the year ended 31 December
Company Group
Notes 2006 2005 2006 2005
£ mil £ mil £ mil £ mil
Restated* Restated*
Cash flows from operating activities
Cash from operating activities 42 £ (3) £ 401 £ 411 £ 529
Interest paid (605) (630) (628) (716)
Interest received 1,086 1,069 1,188 1,132
Income taxes paid (110) (165) (110) (168)
Net cash from operating activities 368 675 861 777
Cash flows from investing activities
Purchase of property and equipment (5) (8) (6) (8)
Proceeds from sale of property and equipment 4 5 5 5
Purchase of operating lease vehicles (465) (680) (526) (745)
Proceeds from sale of operating lease vehicles 426 893 452 930
Purchase of intangible assets 15 (2) (4) (2) (4)
Net cash from/(used in) investing activities (42) 206 (77) 178
Cash flows from financing activities
Proceeds from borrowed funds and debt securities 3,892 3,653 2,424 5,079
Repayments of borrowed funds and debt securities (2,269) (4,715) (2,000) (4,662)
Proceeds provided by parent and related undertakings 2,815 2,844 3,797 1,407
Repayment of funds provided by parent and related undertakings (4,844) (2,418) (4,844) (2,418)
Net increase in short term borrowings (87) (637) (113) (638)
Dividends paid
Capital contribution from parent undertaking 31 38 28 38 28
Net cash used in financing activities (455) (1,245) (698) (1,204)
Effect of exchange rate changes on cash and cash equivalents 9 3 17 10
Net increase / (decrease) in cash and cash equivalents (120) (361) 103 (239)
Cash and cash equivalents at beginning of period 482 852 897 1,153
Cash and cash equivalents at end of period 42 362 491 1,000 914
* Refer to page 31 Accounting Policy A for details of 2005 restated figures

Accounting policies
Index to accounting policies
The principal accounting policies adopted in the preparation of these consolidated financial statements are set out below.
Description Page
A Basis of presentation 31
B Group accounts 32
C Net interest income 33
D Fees and commissions income/payable 33
E Other operating income 33
F Cash and cash equivalents 34
G Derivative financial instruments and hedging 34
H Loans and advances to customers 35
I Allowance for impairment losses 35
J Vehicle residual value provisions 36
K Sales of receivables and related financing 36
L Investment in group undertakings 36
M Goodwill and other intangible assets 36
N Property and equipment 37
O Leases 37
P Other assets 37
Q Offsetting of a financial asset and a financial liability 38
R Debt securities in issue and other borrowed funds 38
S Other liabilities and provisions 38
T Deferred and current income taxes 38
U Critical accounting estimates 39
V Segmental reporting 39
W Employee benefits 40
30
A Basis of presentation
These consolidated financial statements are prepared in accordance with International Financial Reporting Standards (IFRS) and International Financial Reporting Interpretations Committee (IFRIC) interpretations and with those parts of the Companies Act, 1985 applicable to companies reporting under IFRS.
The standards applied are those issued by the International Accounting Standards Board and endorsed by the European Union as at 31 December 2006. The consolidated financial statements are prepared under historical cost conventions with the exception of derivative contracts and share based payments which are stated at fair value.
Restatements of prior year reported figures as at 31 December 2005 has been made:• To incorporate interest income and expense within the Cash flow
statement. This has resulted in no change to ‘Net cash from operating activities’ previously reported.
• To reclassify in the Company balance sheet the net proceeds received from Special Purpose Entities. This adjustment has resulted in a reduction of amounts ‘Due to other banks’ and ‘Debt securities in issue’ of £653 million and £736 million respectively and an increase in amounts ‚Due to parent and related undertakings of £1,389 million.
• To reclassify wholesale consignment vehicles to ‘Other assets’ from ‘Loans and advances to customers’. This has resulted in an increase to other assets of £66 million and a reduction of loans and advances to customers of a corresponding amount.
• To appropriately reflect deferred tax liabilities. This adjustment has resulted in an increase to deferred tax liabilities of £10 million and a reduction of total shareholders’ equity of a corresponding amount.
• To reclassify reported receivables between subsidiary undertakings, Special Purpose Entities, external and related parties within Note 18 ‘Other Assets’.
• To incorporate all transactions with Special Purpose Entities within Note 34 ‘Related party transactions’.
The following new standards and amendments to standards are mandatory for the financial year ending 31 December 2006.• IAS19 ‘Employee Benefits’, amendment to ‘Actuarial gains and losses,
group plan and disclosures’ effective for annual periods beginning on or after 1 January 2006. FCE applied the amended version of IAS 19 effective from 1 January 2004.
• IAS 39 ‘Financial instruments, recognition and measurement’, amendment to ‘The fair value option’ effective for annual periods beginning on or after 1 January 2006. This amendment does not have any impact on the classification and valuation of financial instruments classified at fair value prior to 1 January 2006.
• IAS 39 ‘Financial instruments, recognition and measurement’ and IFRS 4 ‘Insurance Contracts’, amendment to ‘Financial guarantee contracts’, effective for annual periods beginning on or after 1 January 2006. The impact of this amendment is not significant to FCE.
The following new standards, amendments to standards and interpretations which are effective for annual periods beginning on or after 1 January 2006 are not relevant to FCE and have no impact on FCE’s consolidated financial statements.• IAS 21 ‘The Effects of Changes in Foreign Exchange Rates’
amendment to ‘Net investment in a Foreign Operation’.• IAS 39 ‘Financial instruments, recognition and measurement’
amendment ‘Cash flow hedge accounting of forecast intragroup transactions’.
• IFRS1 (Amendment) ‘First-time adoption of International Financial Reporting Standards’ and IFRS6 (Amendment) ‘Exploration for and evaluation of mineral resources’.
• IFRS6 ‘Exploration for and evaluation of mineral resources’.• IFRIC4 ‘Determining whether an arrangement contains a lease’• IFRIC5 ‘Rights to interests arising from decommissioning, restoration
and environmental rehabilitation funds’.• IFRIC6 ‘Liabilities arising from participating in a specific market –
waste electrical and electronic equipment’.
The following new standards have been issued but are not effective for annual periods beginning on 1 January 2006 and will be adopted by FCE beginning 1 January 2007.• IFRS7 ‘Financial Instruments: Disclosures’, and IAS 1 ‘Presentation of
Financial Statements’ amendments to capital disclosures’ are effective for annual periods beginning on or after 1 January 2007. FCE has assessed the impacts of IFRS7 and the amendments to IAS1 and concluded that the main additional disclosures will be the sensitivity analysis to market risk and capital disclosures required by the amendment to IAS1. FCE intends to apply IFRS7 and the amend-ments to IAS1 from annual periods beginning 1 January 2007.
FCE Bank plc – ANNUAL REPORT AND ACCOUNTS – 2006 31

A Basis of presentation (continued)
The following new interpretations have been issued but are not effective for annual periods beginning on 1 January 2006 and have not been early adopted by FCE as the interpretations are either not expected to be relevant or significant to FCE.• IFRIC7 ’Applying the Restatement Approach under IAS29’ effective for
annual periods beginning on or after 1 March 2006. This interpretation is not expected to be relevant to FCE.
• IFRIC8 ‘Scope of IFRS 2’ effective for annual periods beginning on or after 1 May 2006. FCE is currently assessing the impact of IFRIC 8 which is not anticipated to be significant.
• IFRIC9 ‘Reassessment of Embedded Derivatives’ effective for annual periods beginning on or after 1 June 2006. FCE believe that this interpretation will not have a significant impact on the reassessment of embedded derivatives as FCE already assess if embedded derivatives should be separated using principles consistent with IFRIC 9.
• IFRIC10 ‘Interim Financial Reporting and Impairment’ effective for annual periods beginning on or after 1 November 2006. FCE believe this interpretation will not have any significant impact as it already applies principles on impairment losses consistent with IFRIC 10.
• IFRIC11 ‘IFRS 2 – Group Treasury Share Transactions’ effective for annual periods beginning on or after 1 March 2007. This interpretation is not expected to be significant to FCE.
• IFRIC12 ‘Service Concession Arrangements’ effective for annual periods beginning on or after 1 January 2009. This interpretation is not expected to be relevant to FCE
Income statement As permitted by Section 230 of the Companies Act 1985, a separate income statement has not been presented in respect of the Company. The profit after tax of the Company is reported in the notes to the financial statement within the Company disclosures contained in Note 31 ‘Retained earnings and other reserves’ and Note 32 ‘Total shareholders’ equity’.
Cash flow statement FCE has elected to produce an indirect Cash flow statement and as such will show cash flow from operating activities by adjusting profit or loss for non cash items and changes in operating assets and liabilities.
B Group accounts
(i) SubsidiariesSubsidiaries, which are those companies and other entities (including Special Purpose Entities) in which FCE directly or indirectly has power to govern the financial and operating policies are consolidated.
Subsidiaries are consolidated from the date on which control is transferred to the Group, and are no longer consolidated from the date that control ceases. The purchase method of accounting is used to account for the acquisition of subsidiaries. The cost of acquisition is measured at the fair value of the assets given up, shares issued or liabilities incurred at the date of acquisition, plus costs directly attributable to the acquisition. The excess of the cost of acquisition over the fair value of the net assets of the subsidiary acquired is recorded as goodwill. See Note M for the accounting policy on goodwill. Inter-company transactions, balances and unrealised gains on transactions between companies within the Group are eliminated.
The consolidated income statement and balance sheet include the financial statements of the Company and its subsidiary undertakings drawn up to the end of the financial year. The Company’s interest in Group undertakings is stated at cost less any provisions for impairment.
For commercial reasons, the accounting reference dates of Jaguar Financial Services Limited (31 March), Automotive Finance Limited (30 June), Meritpoint Limited (30 June), and Ford Automotive Leasing Limited (30 September) are not coterminous with that of the Company. Accordingly the results of those companies are based on the management accounts for the year ended 31 December 2006.
(ii) BranchesIn addition to operating in the UK, the Company operates on a branch network in 15 other European countries and the branches are included within the Company’s financial statements.
(iii) Foreign currency translationThe consolidated financial statements are presented in Sterling. Assets and liabilities of each entity of the Group which are denominated in foreign currencies are translated into Sterling at the exchange rates published at the balance sheet date.
Income statements and cash flows of branches and subsidiaries outside of the UK are translated into the Group’s reporting currency at average-period exchange rates.
32
Exchange differences arising from the application of year end rates of exchange to opening net assets of foreign branches and subsidiaries are taken to shareholder’s equity, as are those differences resulting from the restatement of the results of foreign operations from average to year end rates of exchange. As permitted by IFRS 1 ‘First-time adoption of International Financial Reporting’, FCE on the introduction of IFRS has brought forward a nil opening balance on cumulative foreign currency translation adjustment arising from the re-translation of foreign operations, which is shown as a separate item in shareholders equity at the date of transition in Note 31 ‘Retained earnings and other reserves’.
Goodwill and fair value adjustments arising on the acquisition of foreign entities, prior to the date of transition to IFRS, are treated as assets and liabilities of FCE and reported using the exchange rate applied under previous GAAP.
C Net interest income
Interest income and expense is recognised in the income statement using the effective interest method.
The effective interest method is a method of calculating the amortised cost of a financial asset or liability and of allocating the interest income or interest expense over the relevant period. The effective interest rate is the rate that exactly discounts the expected future cash payments or receipts through the expected life. The application of this method has the effect of recognising income and expense evenly in proportion to the amount outstanding over the period to maturity or repayment.
Certain loan origination fees (income) and costs (expenses) which can be directly associated to the origination of loans and advances to customers are regarded as part of the economic return on the loan and included in the loan’s carrying value and deferred. The amount deferred is recognised in interest income, using the effective interest method, over the term of the related receivable.
Interest supplements and other support payments from related parties (including Ford and affiliated manufacturers) provided for certain financing transactions are recognised on the same basis as the related financing transaction.
D Fees and commissions income/payable
Fees and commission income is recognised on an accruals basis and includes the following:
Insurance commissionFCE offers branded insurance products in partnership with local insurance providers through dealerships in many European markets. FCE is not subject to insurance risks on policies sold.
Operating lease vehicle marketing and sales income In many European markets vehicles provided under operating leases are owned by business partners to whom the Company has outsourced certain functions whilst retaining responsibility for marketing and sales for which fee income is received.
Fees and commissions payable include commissions and other bonuses payable to dealers. Dealer commission which can be directly associated with the origination of financed receivables is regarded as part of the economic return of the loan and is deferred. The amount deferred is recognised as a reduction to interest income using the effective interest rate method over the term of the related receivable. Other bonus payments are recognised in the income statement as they are incurred.
E Other operating income
Other operating income reflects the rentals receivable for vehicles provided under operating leases. Rental income on operating leases is credited to income on a straight-line basis.
Certain loan origination fees (income) and costs (expenses) which can be directly associated to the origination of operating leases are regarded as part of the economic return on the loan and are offset and deferred. The amount deferred is recognised in other operating income on a straight-line basis over the term of the related receivable.
Accounting policies
FCE Bank plc – ANNUAL REPORT AND ACCOUNTS – 2006 33

F Cash and cash equivalents
For the purposes of the cash flow statement, cash and cash equivalents comprise of balances if maturity at acquisition is less than 90 days including: treasury bills and other eligible bills, amounts due from other banks and petty cash.
G Derivative financial instruments and hedging
Transactions are undertaken in derivative financial instruments, ‘derivatives’, which include interest rate and cross-currency swaps and forward exchange contracts. All derivatives entered into by FCE are entered into for the purpose of matching or minimising risk from potential movements in foreign exchange rates and interest rates inherent in FCE’s financial assets and liabilities.
Interest rate swaps are used to manage the effects of interest rate fluctuations. Foreign currency exchange agreements, including forward contracts and swaps, are used to manage foreign exchange exposure.
Risk is reduced as follows:(i) through the use of funding instruments that have interest and
maturity profiles similar to the assets they are funding, and(ii) through the use of interest rate and foreign exchange derivatives.
Derivatives are measured at fair value. The fair values of derivatives are calculated using quoted market rates and discounted cash flow models. All derivatives are included in assets when the fair value is positive and in liabilities when the fair value is negative, unless there is the legal ability and intention to settle net.
When a derivative contract is entered into, FCE may designate certain derivatives as a hedge of the fair value of a recognised asset or liability (‘fair value’ hedge) or of the variability of cash flows to be received or paid related to a recognised asset or liability (‘cash flow’ hedge). FCE applies the settlement date of accounting for the purchase or sale of a financial asset.
The fair values of derivative instruments are disclosed in Note 11 ‘Derivative financial instruments’.
Hedge accountingHedge accounting is applied for derivatives only when the following criteria are met:a) formal documentation of the hedging instrument, hedged item,
hedge objective, strategy and relationship is prepared at or before inception of the hedge transaction,
b) the hedge is documented showing that it is expected to be highly effective in offsetting the risk in the hedged item throughout the reporting period, and
c) the hedge is highly effective on an ongoing basis, as measured by re-performance of effectiveness testing on a quarterly basis.
All forms of hedge accounting result in hedging derivatives being carried at fair value in the balance sheet.
Fair value hedge accountingChanges in the fair value of derivatives that qualify and are designated as fair value hedges are recorded in the income statement, together with changes in the fair value of the hedged asset or liability that are attributable to the hedged risk.
If a hedge no longer meets the criteria for hedge accounting for example, a) when the terms of an underlying transaction are modified, or b) when the underlying hedged item is settled prior to maturity, the carrying amount of the hedged interest-bearing financial instrument is amortised to the income statement over the period to maturity of the instrument. All such changes are included in the income statement under the caption ‘Fair value adjustments to derivative financial instruments’.
Cash flow hedge accountingTo the extent that the hedge is effective changes in the value of a derivative that is designated as a cash flow hedge are recognised in the hedge reserve in shareholders’ equity. Amounts deferred in equity are transferred to the income statement and classified as revenue or expense in the periods during which the hedged transaction affects the income statement. If a cash flow hedge no longer meets the criteria for hedge accounting, any cumulative gain or loss existing in equity is recognised in the income statement in the periods during which the hedged transaction affects the income statement. All such changes are included in the income statement under the caption ‘Fair value adjustments to derivative financial instruments’
3�

Derivatives not qualifying for hedge accountingCertain derivative transactions (referred to as non-designated in Note 11), while providing effective economic hedges under the Group’s risk management policies either do not qualify for hedge accounting under the specific rules in IAS 39 ‘Financial instruments, recognition and measurement’ or we elect not to apply hedge accounting. These derivatives are held at fair value and fair value gains and losses are reported in the income statement. All such changes are included in the income statement under the caption ‘Fair value adjustments to derivative financial instruments’.
H Loans and advances to customers
Loans and advances to customers including finance lease receivables are non-derivative financial assets with fixed or determinable payments that are not quoted in an active market and which are not classified as available for sale. Loans and advances to customers are initially recognised at fair value including direct and incremental transaction costs. They are subsequently valued at amortised cost, using the effective interest rate method – refer to Accounting Policy C ‘Net interest income’.
The major types of loans and advances are as follows:• Retail financing – includes retail finance and lease contracts introduced
from dealers, and offering finance to commercial customers, primarily vehicle leasing companies and fleet purchasers, to lease or purchase vehicle fleets (includes operating lease vehicles included within Property, plant and equipment),
• Wholesale financing – making loans to dealers to finance the purchase of new and used vehicles held in inventory,
• Other financing – making loans to dealers for working capital and property acquisitions.
I Allowance for impairment losses
An allowance for impairment losses is established when FCE considers the credit-worthiness of an individual borrower or lessee has deteriorated such that the recovery of the whole or part of an outstanding advance or group of loan assets is in doubt. The allowance takes into consideration the financial condition of the borrower or lessee, the value of the collateral, recourse to guarantors and other factors. Loan assets with similar credit characteristics are grouped together and evaluated for impairment on a collective basis. Collateral held for resale, included in ‘Other Assets’, is carried at its estimated fair value at the date of the repossession net of estimated disposal costs. Recoveries previously charged off as uncollectible are written back to allowance for impairment losses on loans and advances to customers.
An allowance for impairment losses is made against loans and advances and operating lease assets to cover bad and doubtful debts which have been incurred and not separately identified, but which are known from experience to be present in portfolios of loans and advances and operating leases. The allowance is determined based on a number of factors including historical loss trends, the credit quality of the present portfolio and general economic factors. Allowances for impairment losses relating to operating lease assets are presented as an adjustment to accumulated depreciation.
Allowance for impairment losses are deducted from loans and advances to customers and Property and equipment and are included in the income statement under the caption ‘Impairment losses on loans and advances’ and ‘Depreciation of operating lease vehicles’ respectively. The allowances for impairment losses comprises the brought forward balance at the beginning of the period plus the income statement charge as referred to above less ‘Net losses’ and includes exchange adjustments relating to foreign currency translation. ‘Net losses’ comprises of loans which have been written off when there is no realistic prospect of recovery less any subsequent recoveries of bad debts which had previously been written off.
Accounting policies
FCE Bank plc – ANNUAL REPORT AND ACCOUNTS – 2006 35
J Vehicle residual value provisions
Residual values represent the estimated value of the vehicle at the end of the retail or leasing financing plan. Residual values are calculated after analysing published residual values and FCE’s own historical experience in the used vehicle market.
Residual value provisions and accumulated depreciation on vehicles subject to operating leases are based on assumptions as to the used car prices at the end of the financing plan and the number of vehicles that will be returned. Vehicle residual value provisions are reviewed regularly and are accounted for as an adjustment to the carrying value of the assets. The amount of any impairment to residual values is accounted for as supplemental depreciation for operating leases and as a deduction from ‘Loans and advances to customers’ for retail and finance lease contracts. These assumptions and the related reserves may change based on market conditions – refer to Accounting Policy U ‘Critical accounting estimates’.
Changes to residual value provisions for retail and finance lease contracts are included in the income statement under the caption ‘Interest income’ and for operating leases within ‘Depreciation of operating lease vehicles’.
K Sales of receivables and related financing
FCE has entered into financing arrangements with lenders in order to finance loans and advances to customers. Such receivables have typically been sold for legal purposes to consolidated Special Purpose Entities (SPE’s). As FCE is not fully isolated from the risks and benefits of securitisation transactions, the requirements of IAS 39 ‘Financial instruments, recognition and measurement’ have been followed which requires the SPE to be consolidated under the consolidation principles of IAS 27 ‘Consolidated financial statements and accounting for invest-ments in subsidiaries’. All receivables subject to such arrangements continue to be reported on the balance sheet and a liability is recognised for the proceeds of the funding transaction.
L Investments in group undertakings
The Company’s interest in group undertakings are stated at cost less any provisions for impairment.
M Goodwill and other intangible assets
(i) Goodwill represents the excess of the cost of an acquisition over the fair value of FCE’s share of the net assets of the acquired subsidiary at the date of acquisition. Goodwill on acquisitions of subsidiaries occurring on or after 1 January 1995 is reported in the balance sheet as an intangible asset and was amortised using the straight-line method over its estimated useful life, until 1 January 2004 when amortisation of goodwill ceased. Goodwill on acquisitions of subsidiaries that occurred prior to 1 January 1995 was charged in full to retained profits in shareholder’s equity; such goodwill has not been retrospectively capitalised and amortised.
As permitted by IFRS 1 ‘First-time adoption of International Financial Reporting’ FCE has not applied IFRS 3 ‘Business Combinations’ retrospectively to business combinations prior to the date of transition.
At each balance sheet date Goodwill is tested for impairment and
carried at cost less accumulated impairment losses. Goodwill is allocated to cash-generating units for the purpose of impairment testing.
(ii) Other intangible assets relate to computer software development costs. Such costs typically are expensed as incurred. Costs that are directly associated with identifiable and unique software products controlled by FCE and which are anticipated to generate economic benefits exceeding costs are recognised as intangible assets. Direct costs include staff costs of the software development team. A minimum capitalisation limit applies to internally developed software projects.
Expenditure which significantly enhances or extends the performance of computer software programmes beyond their original specifications is recognised as capital improvements and added to the original costs of the software. Computer software development costs recognised as assets are amortised using a straight line method over their useful lives of three or eight years for PC/network and mainframe applications respectively. Other intangible assets are carried at cost less accumulated amortisation and any impairment charges. Impairment is tested at each reporting date. The amortisation of intangible assets is recorded within the income statement within other operating expenses.
36

N Property and equipment
All property and equipment is stated at historical cost less accumulated depreciation. Depreciation is calculated on a straight line method to write down the cost of such assets to their residual values at the following rates:
Asset Type Annual Depreciation Rate
Computer Equipment 16.67%
Other office equipment 8.00%
Company motor vehicles 25.00%
Where the carrying amount of an asset is greater than its estimated recoverable amount, it is written down immediately to its recoverable amount. Gains and losses on disposal of property and equipment are determined by reference to their carrying amount and are included in ‘Other operating expense’ in the income statement.
Operating lease assets over which FCE has entered into Operating Lease agreements as the lessor are included in Property and equipment. Depreciation is charged on Operating Lease assets over the period of the lease to its estimated residual value on a straight line basis.
The depreciation policy for leased vehicles (including vehicles subject to operating leases) is reviewed on a regular basis taking into consideration various assumptions, such as expected residual values at lease termination (including residual value support payments from manufacturers) and the estimated number of vehicles that will be returned. Adjustments to reflect revised estimates of expected residual values at the end of the lease terms are recorded on a straight-line basis. Upon return of the vehicle, depreciation expense is adjusted for the difference between net book value and expected resale value and the vehicle is transferred to ‘Other assets’.
O Leases
(i) Where FCE is the lessor:Finance leases – Assets purchased by customers under conditional sale agreements and leased under finance leases are included in ‘Loans and advances to customer’ at the gross amount receivable, less unearned finance charges. Finance income is recognised over the lease term using the net investment method so as to reflect a constant periodic rate of return in proportion to the net investment in the contract.
Operating leases – Assets leased to customers under operating leases are included in ‘Property and equipment’. Income recognised in the income statement is described in accounting policy E.
(ii) Where FCE is the lessee:To date, the leases entered into by FCE are all operating leases. Operating lease rental expense is charged to the income statement within ‘Other operating expense’ on a straight line basis over the period of the lease.
When an operating lease is terminated before the lease period has expired, any payment required to be made to the lessor by way of penalty is recognised as an expense in the period in which termination takes place.
P Other assets
The carrying value of ‘Other assets’ is stated at cost less any provision for impairment. Vehicles returned to FCE from Operating lease, retail and finance leases which are awaiting resale are carried at net book value after adjusting for any residual value provisions. Vehicles consigned to dealers on consignment financing arrangements are disclosed in Note 18 ‘Other assets’.
Gains and losses on disposals of Operating lease vehicles are included in the income statement under the caption depreciation expense and for vehicles returned from retail and finance lease contracts under ‘Interest income’.
Accounting policies
FCE Bank plc – ANNUAL REPORT AND ACCOUNTS – 2006 37

Q Offsetting of a financial asset and a financial liability
Financial assets and liabilities are offset and the net amount reported in the balance sheet if, and only if, there is a current enforceable legal right to set off the recognised amounts and there is an intention to settle on a net basis.
R Debt securities in issue and other borrowed funds
Debt securities in issue and other borrowed funds are stated at fair value net of transaction costs incurred. Borrowings are subsequently stated at amortised cost and any differences between net proceeds and the redemption value is recognised in the income statement over the life of the underlying debt.
S Other liabilities and provisions
Provisions are recognised when FCE has a present and legal or constructive obligation as a result of past events, it is probable that an outflow of resource embodying economic benefits will be required to settle the obligation, and a reliable estimate of the amount of the obligation can be made.
Provision is made for the anticipated cost of restructuring including employee separation costs, when an obligation exists. An obligation exists when FCE has a detailed formal plan for restructuring an operation and has raised valid expectations in those affected by the restructuring by starting to implement the plan or announcing its main features.
Contingent liabilities are possible obligations whose existence will be confirmed only by uncertain future events or present obligations where the transfer of economic benefit is not probable or cannot be reliably measured. Contingent liabilities are not recognised but are disclosed unless they are remote.
T Deferred and current income taxes
Deferred tax is provided in full, using the liability method, on temporary differences arising between the tax bases of assets and liabilities and their carrying amounts in the financial statements. Deferred tax is recognised in the income statement except to the extent that it relates to items recognised directly in equity, in which case it is recognised in equity.
Deferred tax is determined using tax rates and laws that have been enacted by the balance sheet date and are expected to apply when the related deferred tax asset is realised or the deferred tax liability is settled.
Deferred tax assets are recognised to the extent that it is probable that future taxable profit will be available against which the temporary differences can be utilised.
Income tax payable on profits is based on the applicable tax law in each company’s jurisdiction and is calculated at rates of tax enacted at the balance sheet date. Income tax payable is recognised as an expense in the period in which the profits arise. The tax effects of income tax losses available for carry forward are recognised as an asset when it is probable that future taxable profits will be available which these losses can be utilised against.
3�
U Critical accounting estimates
The preparation of financial statements in conformity with general accepted accounting principles requires the use of estimates and assumptions that affect the reported amounts of assets and liabilities and disclosure of contingent assets and liabilities at the date of the financial statements and the reported amounts of revenues and expenses during the reporting period. Although these estimates are based on management’s best knowledge of current events and actions, actual results ultimately may differ from those estimates. An accounting estimate is considered to be critical if: • The accounting estimate requires assumptions to be made about
matters that were uncertain at the time the accounting estimate was made, and
• Changes in the estimate are reasonably likely to occur from period to period, or use of different estimates that reasonably could have been used in the current period, and
• The accounting estimate could have a material impact on the financial condition or results.
The accounting estimates that are most important to FCE’s business involve:• Allowance for impairment losses on loans and advances and operating
lease assets (refer to Note 12 ‘Loans and advances to customers’), • Vehicle residual value provisions and the depreciation rate utilised on
vehicles subject to operating leases (refer to Note 29 ‘Vehicle residual values’).
V Segmental reporting
Business segments are distinguishable components of FCE that provides products or services that are subject to risks and rewards that are different to those of other business segments. Geographical segments provide products or services within a particular economic environment that is subject to different risks and rewards that are different to those of components operating in other economic environments.
Primary reporting segments: For the purposes of these financial statements and in accordance with IAS 14 ‘Segment reporting’ FCE has primary reporting segments based around the group’s business unit structure representing the various geographic locations of its operations. These primary segments comprise:• United Kingdom (Company and UK subsidiaries)• Germany• Italy• Spain• France• Other Euro currency locations (consisting of Austria, Belgium, Finland,
Greece, Ireland, Netherlands and Portugal)• Other locations (consisting of the Czech Republic, Denmark, Hungary,
Norway, Poland, Sweden, Switzerland and the Worldwide Trade Financing division)
• Central operations and staffs including funding of FCE branches and subsidiaries
Previously FCE has included within the UK segment both Central operations and WTF. It is now considered appropriate to report WTF within ‘Other locations’ and to report ‘Central operations’ as a separate segment. As a result of this revision the UK segment is now reported on a similar basis to other locations.
In accordance with IAS 14 all segments representing 10% or more of the total group revenue, total group assets or total group turnover are to be reported as individual geographical segments.
Accounting policies
FCE Bank plc – ANNUAL REPORT AND ACCOUNTS – 2006 3�
V Segmental reporting (continued)
Secondary reporting segments relate to FCE’s range of products and comprise:• Retail – includes retail finance and lease contracts introduced from
dealers and finance provided to commercial customers. Commercial customers are primarily vehicle leasing companies and fleet purchasers. Such contracts are primarily fixed-rate retail finance and lease contracts which generally require customers to pay equal monthly payments over the life of the contracts,
• Wholesale financing – primarily receivables originated to finance new and used vehicles held in dealers inventory and generally require dealers to pay a floating rate,
• Other financing – making loans to dealers for working capital and property acquisitions and operating lease vehicle financing programs to commercial customers.
Previously FCE has reported the secondary reporting segments containing ‘Financial Services’, ‘Operating lease business’ and ‘Insurance Commissions’. Following the completion of the sale of the European Full Service Leasing portfolios completed in 2006 the majority of the group revenue is now classified as ‘Financial Services’ and therefore it is now considered appropriate to revise the secondary reporting segments as detailed on page 39.
Allocation of costs: The main costs which are required to be allocated between segments and the basis of allocation are as follows:• Central staff costs. These are analysed by department and type of
cost and allocated to the location benefiting from the service. Various allocation methods are used that ensure an equitable allocation between locations of central staff costs.
• Central funding. In certain of FCE’s European branches and subsidiaries funding is obtained by a mixture of local and centrally allocated funding. The costs of central funding, including derivative costs are, where possible, directly allocated to locations where transactions can be specifically identified. Operational efficiencies are also obtained by pooling certain funding, and the related financing costs are allocated across locations to ensure an appropriate allotment of funding costs
Income and costs on allocation of intra and inter-company transactions are eliminated on consolidation.
W Employee benefits
(i) Retirement benefit obligationsMost of FCE’s branches and subsidiaries operate defined benefit schemes.
In some locations FCE participates in pension schemes that share the risks between related parties, and there is no contractual agreement for charging the net defined benefit costs. In such cases FCE recognises a cost equal to contributions payable for the period only and discloses such schemes as ‘Accounted for as defined contribution’. The funds are valued at least every three years by a professionally qualified independent actuary (the principal UK fund is valued every two years) and the actuary provides advice on the future rates of contributions payable into the schemes.
For defined contribution plans, FCE pays contributions to publicly or privately administered pension insurance plans on a mandatory, contractual or voluntary basis. Once the contributions have been paid, FCE has no further payment obligations. The regular contributions constitute net periodic costs for the years in which they are due.
FCE’s Spanish branch operates a defined benefit plan for management employees and recognises the net liability or asset in the balance sheet. Actuarial gains and losses are recognised in profit and loss as they occur, together with contributions payable for the period.
For all of the above costs are included within ‘Other operating expenses’.
(ii) Share-based paymentsShare options which can be exercised over Ford Common Stock, are granted to directors and to employees of FCE. The options vest and may be exercised in instalments as follows:a) One year from the date of the agreement 33% of the shares may be
exercisedb) Two years from the date of the agreement an additional 33% of the
shares granted may be exercisedc) Three years from the date of the agreement an additional 34% of the
shares granted may be exercised
The fair value of the employee services received in exchange for the grant of the options is recognised as an expense and a corresponding increase in ‘Other’ reserves, which is part of shareholder’s equity, over the vesting period.
�0

The total amount to be expensed over the vesting period is determined by reference to the fair value of the options granted, excluding any non-market vesting conditions. Non-market vesting conditions are taken into account so that the amount expensed is based on the number of share options that eventually vest.
Costs of providing the share options are charged to FCE by Ford in the year granted and are recognised in ‘Other reserves’ over the vesting period.
Accounting policies
FCE Bank plc – ANNUAL REPORT AND ACCOUNTS – 2006 �1

�2
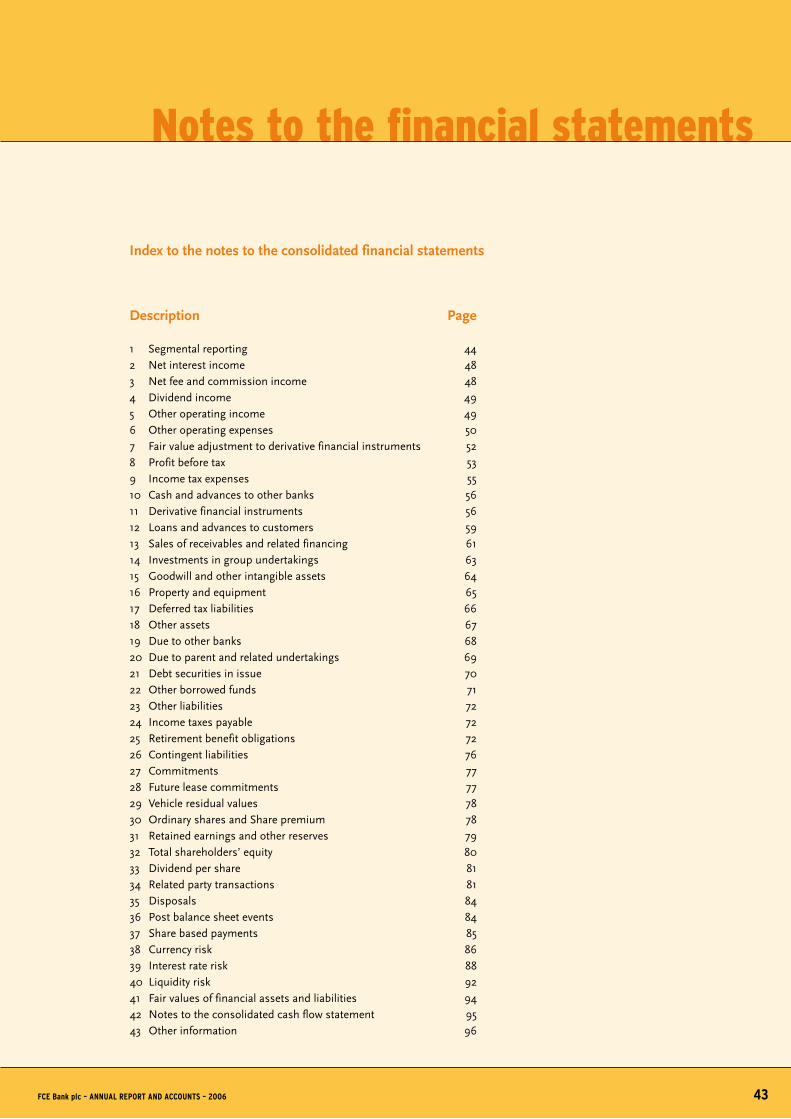
Notes to the financial statements
Index to the notes to the consolidated financial statements
Description Page
1 Segmental reporting 442 Net interest income 483 Net fee and commission income 484 Dividend income 495 Other operating income 496 Other operating expenses 507 Fair value adjustment to derivative financial instruments 528 Profit before tax 539 Income tax expenses 5510 Cash and advances to other banks 5611 Derivative financial instruments 5612 Loans and advances to customers 5913 Sales of receivables and related financing 6114 Investments in group undertakings 6315 Goodwill and other intangible assets 6416 Property and equipment 6517 Deferred tax liabilities 6618 Other assets 6719 Due to other banks 6820 Due to parent and related undertakings 6921 Debt securities in issue 7022 Other borrowed funds 7123 Other liabilities 7224 Income taxes payable 7225 Retirement benefit obligations 7226 Contingent liabilities 7627 Commitments 7728 Future lease commitments 7729 Vehicle residual values 7830 Ordinary shares and Share premium 7831 Retained earnings and other reserves 7932 Total shareholders’ equity 8033 Dividend per share 8134 Related party transactions 8135 Disposals 8436 Post balance sheet events 8437 Share based payments 8538 Currency risk 8639 Interest rate risk 8840 Liquidity risk 9241 Fair values of financial assets and liabilities 9442 Notes to the consolidated cash flow statement 9543 Other information 96
FCE Bank plc – ANNUAL REPORT AND ACCOUNTS – 2006 �3

��
1 Segmental reporting
Geographic segmentation is the primary reporting segment as FCE is organised on a geographic basis through its branches and subsidiaries. FCE measures the performance of its operations primarily on a profit before tax basis, after excluding the impact of earnings from fair value adjustment to derivatives, and other related fair value accounting adjustments. Fair value adjustments to derivatives are recorded within the UK geographic segment as derivatives are administered on a centralised basis for FCE.
Product segmentation is the secondary reporting segment and includes retail, wholesale and other products for which revenue and assets are reported within the boxes in the tables.
Company UK Germany Italy Spain France
Notes 2006 2005 2006 2005 2006 2005 2006 2005 2006 2005
£ mil £ mil £ mil £ mil £ mil £ mil £ mil £ mil £ mil £ mil
* * * * *
Interest income 2 £ 266 £ 333 £ 267 £ 293 £ 115 £ 115 £ 121 £ 106 £ 64 £ 50
Fees and commissions 3 20 15 22 22 10 6 3 2 6 7
Other operating income 5 1 9 94 107 - 1 1 - - 59
Total revenue: 287 357 383 422 125 122 125 108 70 116
- Retail revenue £ 223 £ 278 £ 152 £ 168 £ 98 £ 103 £ 86 £ 63 £ 48 £ 34
- Wholesale revenue 59 64 73 65 17 17 35 45 14 15
- Other revenue 5 15 158 189 10 2 4 - 8 67
Profi t before tax 8 84 95 54 110 26 22 27 24 17 19
- Retail assets 12 1,796 1,930 2,294 2,461 921 987 983 928 283 265
- Wholesale assets 12 2,056 2,075 944 951 923 895 843 879 627 647
- Other assets 1,006 103 1,111 1,130 123 101 142 127 95 346
Total assets 4,858 4,108 4,349 4,542 1,967 1,983 1,968 1,934 1,005 1,258
Total liabilities 2,453 3,075 3,980 4,191 1,854 1,860 1,831 1,818 934 1,195
Additions:
Property & Equipment 16 1 7 330 452 - - 1 1 86 109
Intangible assets 15 - - - - - - - - - -
Depreciation/amortisation 8 - 8 86 84 - - - - - 48
Loan impairment losses 12 9 (7) 21 13 8 11 7 7 - -
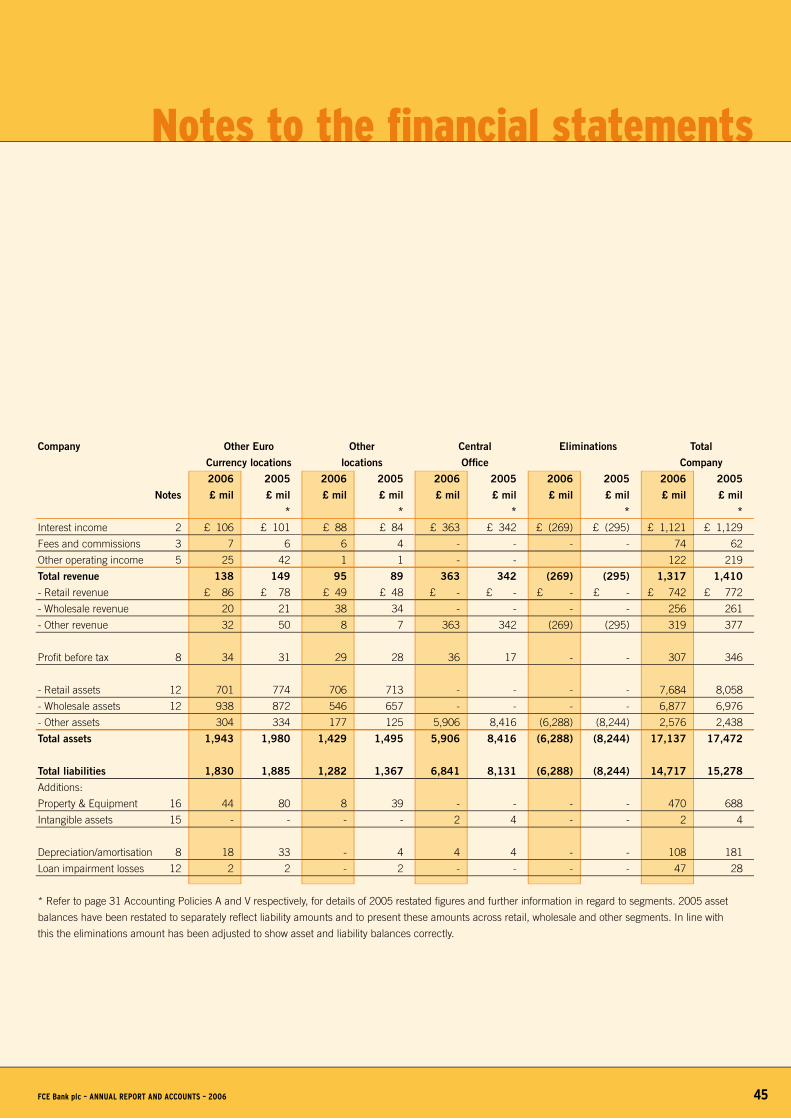
Notes to the financial statements
FCE Bank plc – ANNUAL REPORT AND ACCOUNTS – 2006 �5
Company Other Euro Other Central Eliminations Total
Currency locations locations Offi ce Company
2006 2005 2006 2005 2006 2005 2006 2005 2006 2005
Notes £ mil £ mil £ mil £ mil £ mil £ mil £ mil £ mil £ mil £ mil
* * * * *
Interest income 2 £ 106 £ 101 £ 88 £ 84 £ 363 £ 342 £ (269) £ (295) £ 1,121 £ 1,129
Fees and commissions 3 7 6 6 4 - - - - 74 62
Other operating income 5 25 42 1 1 - - 122 219
Total revenue 138 149 95 89 363 342 (269) (295) 1,317 1,410
- Retail revenue £ 86 £ 78 £ 49 £ 48 £ - £ - £ - £ - £ 742 £ 772
- Wholesale revenue 20 21 38 34 - - - - 256 261
- Other revenue 32 50 8 7 363 342 (269) (295) 319 377
Profi t before tax 8 34 31 29 28 36 17 - - 307 346
- Retail assets 12 701 774 706 713 - - - - 7,684 8,058
- Wholesale assets 12 938 872 546 657 - - - - 6,877 6,976
- Other assets 304 334 177 125 5,906 8,416 (6,288) (8,244) 2,576 2,438
Total assets 1,943 1,980 1,429 1,495 5,906 8,416 (6,288) (8,244) 17,137 17,472
Total liabilities 1,830 1,885 1,282 1,367 6,841 8,131 (6,288) (8,244) 14,717 15,278
Additions:
Property & Equipment 16 44 80 8 39 - - - - 470 688
Intangible assets 15 - - - - 2 4 - - 2 4
Depreciation/amortisation 8 18 33 - 4 4 4 - - 108 181
Loan impairment losses 12 2 2 - 2 - - - - 47 28
* Refer to page 31 Accounting Policies A and V respectively, for details of 2005 restated fi gures and further information in regard to segments. 2005 asset
balances have been restated to separately refl ect liability amounts and to present these amounts across retail, wholesale and other segments. In line with
this the eliminations amount has been adjusted to show asset and liability balances correctly.
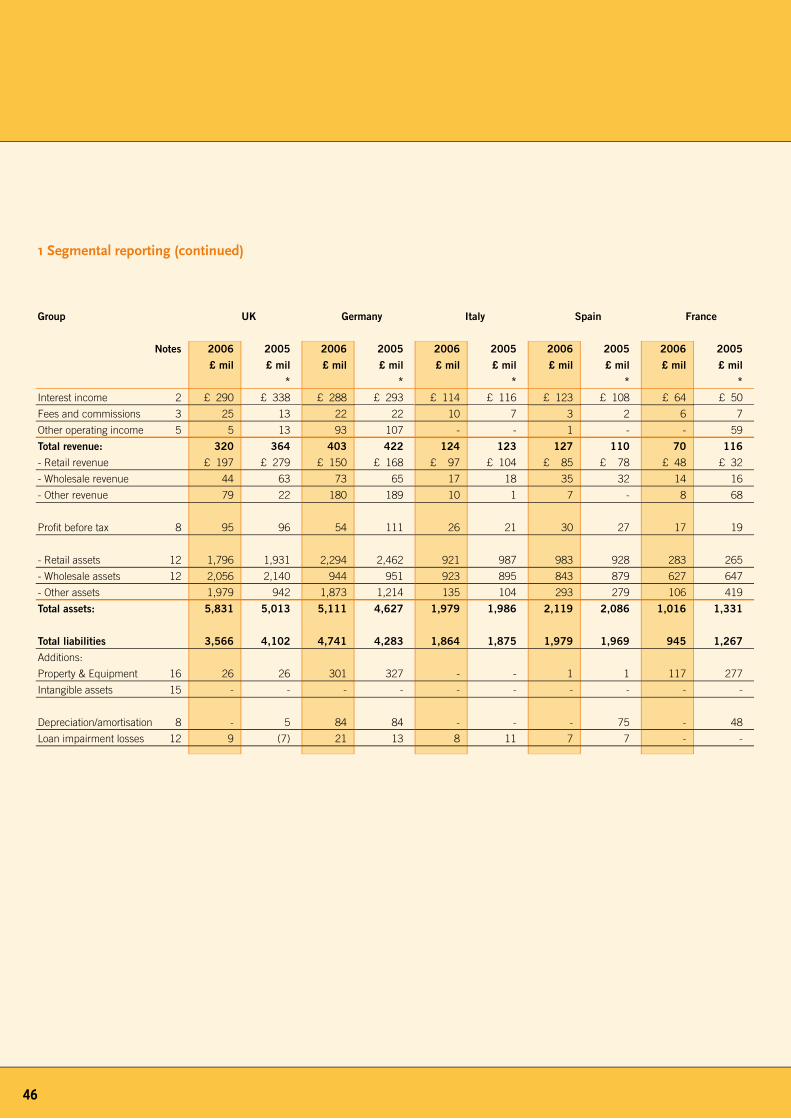
�6
1 Segmental reporting (continued)
Group UK Germany Italy Spain France
Notes 2006 2005 2006 2005 2006 2005 2006 2005 2006 2005
£ mil £ mil £ mil £ mil £ mil £ mil £ mil £ mil £ mil £ mil
* * * * *
Interest income 2 £ 290 £ 338 £ 288 £ 293 £ 114 £ 116 £ 123 £ 108 £ 64 £ 50
Fees and commissions 3 25 13 22 22 10 7 3 2 6 7
Other operating income 5 5 13 93 107 - - 1 - - 59
Total revenue: 320 364 403 422 124 123 127 110 70 116
- Retail revenue £ 197 £ 279 £ 150 £ 168 £ 97 £ 104 £ 85 £ 78 £ 48 £ 32
- Wholesale revenue 44 63 73 65 17 18 35 32 14 16
- Other revenue 79 22 180 189 10 1 7 - 8 68
Profi t before tax 8 95 96 54 111 26 21 30 27 17 19
- Retail assets 12 1,796 1,931 2,294 2,462 921 987 983 928 283 265
- Wholesale assets 12 2,056 2,140 944 951 923 895 843 879 627 647
- Other assets 1,979 942 1,873 1,214 135 104 293 279 106 419
Total assets: 5,831 5,013 5,111 4,627 1,979 1,986 2,119 2,086 1,016 1,331
Total liabilities 3,566 4,102 4,741 4,283 1,864 1,875 1,979 1,969 945 1,267
Additions:
Property & Equipment 16 26 26 301 327 - - 1 1 117 277
Intangible assets 15 - - - - - - - - - -
Depreciation/amortisation 8 - 5 84 84 - - - 75 - 48
Loan impairment losses 12 9 (7) 21 13 8 11 7 7 - -

Notes to the financial statements
FCE Bank plc – ANNUAL REPORT AND ACCOUNTS – 2006 �7
Group Other Euro Other Central Eliminations Total
Currency locations locations Offi ce Company
2006 2005 2006 2005 2006 2005 2006 2005 2006 2005
Notes £ mil £ mil £ mil £ mil £ mil £ mil £ mil £ mil £ mil £ mil
* * * * *
Interest income 2 £ 139 £ 137 £ 105 £ 101 £ 363 £ 342 £ (372) £ (342) £ 1,114 £ 1,143
Fees and commissions 3 7 7 9 6 - - - - 82 64
Dividend income 4 - - - 1 - - - - - 1
Other operating income 5 35 52 26 24 - - - - 160 255
Total revenue 181 196 140 132 363 342 (372) (342) 1,356 1,463
- Retail revenue £ 87 £ 82 £ 65 £ 63 £ - £ - £ - £ - £ 729 £ 806
- Wholesale revenue 20 21 40 37 - - - - 243 252
- Other revenue 74 93 35 32 363 342 (372) (342) 384 405
Profi t before tax 8 35 30 36 35 36 17 - - 329 356
- Retail assets 12 808 881 750 753 - - - - 7,835 8,207
- Wholesale assets 12 939 872 661 696 - - - - 6,993 7,080
- Other assets 1,185 1,464 241 249 5,906 8,416 (9,584) (10,873) 2,134 2,214
Total assets 2,932 3,217 1,652 1,698 5,906 8,416 (9,584) (10,873) 16,962 17,501
Total liabilities 2,795 3,101 1,468 1,538 6,841 8,131 (9,584) (10,873) 14,615 15,393
Additions:
Property & Equipment 16 49 - 37 56 - 67 - - 531 754
Intangible assets 15 - - - - 2 4 - - 2 4
Depreciation/amortisation 8 26 - 24 - 4 5 - - 138 217
Loan impairment losses 12 2 2 1 2 - - - - 48 28
* Refer to page 31 Accounting Policies A and V respectively, for details of 2005 restated fi gures and further information in regard to segments. 2005 asset
balances have been restated to separately refl ect liability amounts and to present these amounts across retail, wholesale and other segments. In line with this
the eliminations amount has been adjusted to show asset and liability balances correctly.
Other Euro Currency locations relate to Austria, Belgium, Finland, Greece, Ireland, Netherlands and Portugal.
Other locations relate to the Czech Republic, Denmark, Hungary, Norway, Poland, Sweden, Switzerland and WTF.
Eliminations are required to adjust for intra and inter-company transactions which are eliminated on consolidation.

2 Net interest income
Net interest income is the difference between interest income and interest expense. Net interest income includes revenue from ‘retail’, ‘wholesale’ and ‘other’ segments as defined in Note 1 ‘Segmental reporting’ except for income from operating lease vehicles which is reported within Note 5 ‘Other operating income’.
Interest earned on most retail receivables is generally fixed at the time the contracts are originated. On some receivables primarily wholesale financing FCE charges interest at a floating rate that varies with changes in short-term interest rates.
Group 2006 2005
Interest income £ mil £ mil
Loans and advances to external parties £ 765 £ 827
Interest income related parties 344 301
Cash and short term deposits income 5 15
1,114 1,143
Interest expense
Interest expense external parties (403) (372)
Interest expense related parties (224) (258)
(627) (630)
Net interest income £487 £513
‘Interest income related parties’ primarily relates to wholesale receivables income with entities that are reported as consolidated entities of Ford and include both wholly and partially Ford owned dealers.
In the normal course of FCE’s funding activities, more proceeds than are necessary for immediate funding needs are generated. These excess amounts are maintained primarily as highly liquid investments and the associated interest income is reported within the caption ‘Cash and short term deposit income’.
3 Net fee and commission income
Net fee and commission income is the difference between fee and commission income and expense.
Group 2006 2005
Fee and commission income £ mil £ mil
Finance related and other fee income £ 44 £ 26
Insurance sales commission income 38 38
82 64
Fee and commission expense
Finance related and other fees expense (4) (3)
Commission and incentives expense (3) (3)
(7) (6)
Net fee and commission income £75 £58
��

Notes to the financial statements
FCE Bank plc – ANNUAL REPORT AND ACCOUNTS – 2006 ��
‘Finance related and other fee income’ relates to other fees received which cannot be directly associated with the origination of the finance receivables. Other fee income includes Full service leasing (FSL) commission income received by FCE from the provision of marketing and sales of commercial operating lease customers to a non-affiliated business partner. The preferred third party FSL business partner in each market is responsible for financing, maintenance, repair services and the resale of vehicles at the end of the lease period.
‘Insurance sales commission income’ primarily relates to Ford branded insurance products which are offered throughout Europe. These insurance products which are mainly vehicle insurance related and payment protection plans are underwritten by non-affiliated local insurance companies from which FCE receive fee income but the underwriting risk remains with the third-party insurance companies.
‘Fee and commission expense’ includes commissions and other bonuses payables to dealers which cannot be directly associated with the origination of the finance receivables.
4 Dividend income
Dividend received of Polish Zloty (PZL) 2006 nil (2005 PZL 3.7 million or approximately £808,000) by FCE Credit Poland S.A. from a related party, Ford Polska Sp. Zoo. FCE Credit Poland S.A. has a beneficial interest of approximately 4% in Ford Polska Sp. Zoo.
5. Other operating income
Other operating income includes rentals received from operating lease vehicles to commercial customers including leasing companies, daily rental companies and fleet customers. For operating leases the financing margin equals rentals received as recorded in ‘Other operating income’ less depreciation expense as recorded within Note 16 ‘Property and equipment’ and the cost of borrowed funds as recorded within the caption ‘Interest expense’ within Note 2 ‘Net interest income’.
Group 2006 2005
£ mil £ mil
Income from operating leases £ 159 £ 251
Gain on sale of operating lease
portfolios (Note 35) 1 4
Other operating income £160 £255
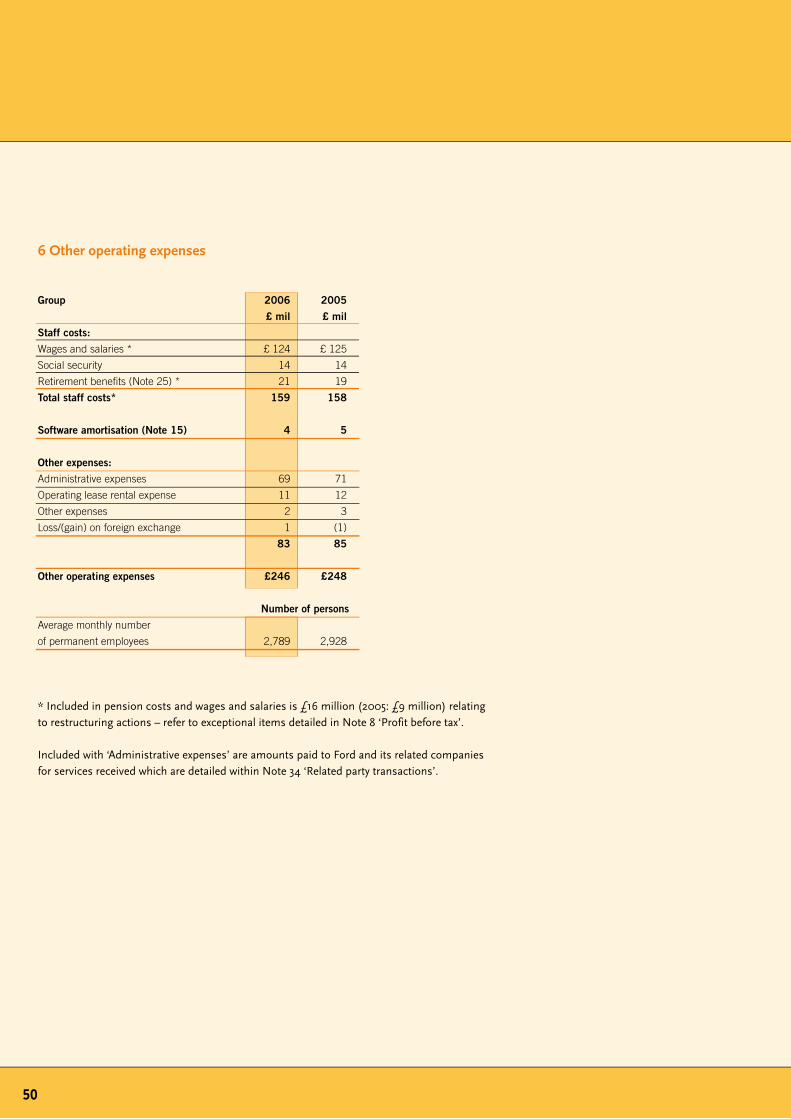
6 Other operating expenses
Group 2006 2005
£ mil £ mil
Staff costs:
Wages and salaries * £ 124 £ 125
Social security 14 14
Retirement benefits (Note 25) * 21 19
Total staff costs* 159 158
Software amortisation (Note 15) 4 5
Other expenses:
Administrative expenses 69 71
Operating lease rental expense 11 12
Other expenses 2 3
Loss/(gain) on foreign exchange 1 (1)
83 85
Other operating expenses £246 £248
Number of persons
Average monthly number
of permanent employees 2,789 2,928
* Included in pension costs and wages and salaries is £16 million (2005: £9 million) relating to restructuring actions – refer to exceptional items detailed in Note 8 ‘Profit before tax’.
Included with ‘Administrative expenses’ are amounts paid to Ford and its related companies for services received which are detailed within Note 34 ‘Related party transactions’.
50

Notes to the financial statements
FCE Bank plc – ANNUAL REPORT AND ACCOUNTS – 2006 51
Directors and officers: Details of transactions, outstanding balances at the beginning and end of periods, maximum amount outstanding and related income and expense in the period are as follows:
‘Salaries/other short-term benefits’ includes termination payments made to one director and one officer. Officers are the eight (2005: seven) remaining members of the Executive Committee who are not directors of the Company. The full list of present directors and details on the Committees of the Board are displayed on page 4 and from page 21 respectively.
Loans: A loan arrangement exists for certain directors and officers of the Company (including connected persons), whereby the director or officer purchases vehicles from Ford Motor Company Limited (FMCL), and the Company provide individuals with loans to finance the purchase. The individual pays the Company only the interest on the loan. When the loans mature, the vehicles are returned to FMCL for resale, and the Company is repaid the loan value from the proceeds of sale.
Compensation payments: Aggregate emoluments for the highest paid director including dividends received under long term incentive schemes were £184,208 (2005: £227,696). No share option awards were received under a Long Term Incentive Scheme.
The highest paid director in 2006 is a member of the Ford Motor Company Limited Pension Scheme for Senior Staff. The projected accrued annual benefit at age 65 for the highest paid director at 31 December 2006 is £79,472 (2005: £83,999). Employer contributions made to the pension
of the highest paid director during 2006 totalled £28,715 (2005: nil). The pension scheme allows for some of the accrued annual pension benefit to be commuted to a lump sum payment on retirement. The maximum projected lump sum available at age 65 for the highest paid director in 2006 is £305,506. The highest paid director in 2005 was a member of the Ford (US) General Retirement Plan (GRP) and comparison between the two pension schemes could be misleading due to their different features and structures. The GRP does not allow for an accrued lump sum.
Post-employment benefits: Retirement benefits are accruing to six current directors and eight officers (2005: seven directors and seven officers) under various Ford defined benefit schemes.
Share-based payments: During the financial year ended 31 December 2006 no directors or officers who received remuneration from the Company in respect of their services to the Company, including the highest paid director, exercised options held over Ford Common Stock (2005: nil). As the share options vested before 1 January 2006 they did not fall under the scope of IFRS 2 ‘Share based payments’ and therefore are excluded from Note 37 ‘Share based payments’. No shares (2005: 1,150) under a Long Term incentive scheme were received by the highest paid director in 2006.
Company 2006 2005
Directors Offi cers Total Directors Offi cers Total
£000’s £000’s £000’s £000’s £000’s £000’s
Loans Restated*
Loans outstanding at 1 January £ 127 £ 180 £ 307 £ 134 £ 258 £ 392
Loans issued in the year 133 312 445 151 309 460
Loan repayments during the year (166) (282) (448) (205) (340) (545)
Reclassifi cation - - - 47 (47) -
Loans outstanding at 31 Dec. £ 94 £ 210 £ 304 £ 127 £ 180 £ 307
Maximum loans amount in period £ 128 £ 225 £ 353 £ 134 £ 258 £ 392
Revenue
Interest revenue from loans 18 33 51 22 34 56
Compensation payments
Salaries/other short-term benefi ts 1,194 1,024 2,218 1,112 728 1,840
Post-employment benefi ts 120 150 270 232 205 437
Share based payments 108 43 151 128 58 186
Total compensation payments £ 1,422 £ 1,217 £ 2,639 £ 1,472 £ 991 £ 2,463
* Loans outstanding at 1 January 2005 have been restated to include all loan arrangements with directors and offi cers.
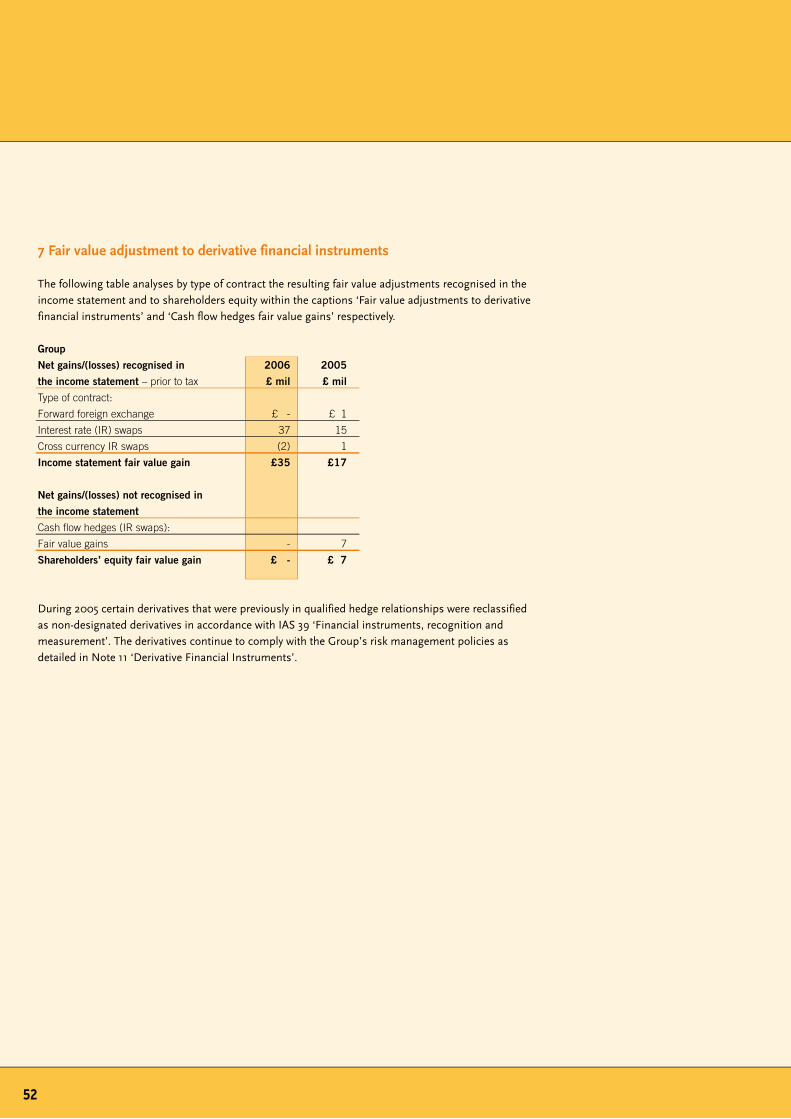
7 Fair value adjustment to derivative financial instruments
The following table analyses by type of contract the resulting fair value adjustments recognised in the income statement and to shareholders equity within the captions ‘Fair value adjustments to derivative financial instruments’ and ‘Cash flow hedges fair value gains’ respectively.
Group
Net gains/(losses) recognised in 2006 2005
the income statement – prior to tax £ mil £ mil
Type of contract:
Forward foreign exchange £ - £ 1
Interest rate (IR) swaps 37 15
Cross currency IR swaps (2) 1
Income statement fair value gain £35 £17
Net gains/(losses) not recognised in
the income statement
Cash fl ow hedges (IR swaps):
Fair value gains - 7
Shareholders’ equity fair value gain £ - £ 7
During 2005 certain derivatives that were previously in qualified hedge relationships were reclassified as non-designated derivatives in accordance with IAS 39 ‘Financial instruments, recognition and measurement’. The derivatives continue to comply with the Group’s risk management policies as detailed in Note 11 ‘Derivative Financial Instruments’.
52

Notes to the financial statements
FCE Bank plc – ANNUAL REPORT AND ACCOUNTS – 2006 53
8 Profit before tax
Exceptional items are typically non-recurring events or transactions of which disclosure aids the interpretation of performance compared to the prior year. Exceptional items represented a reduction in profits of £8 million in 2006 as compared to a £34 million increase in profit before taxes for 2005.
Exceptional items Group
(Brackets indicates geographic location) 2006 2005
Profit before tax is stated after crediting/(charging): £ mil £ mil
Operating income:
- VAT rebate (UK) £ 5 £ -
- Non-refundable fee income received from insurance provider 3 -
- Adjustment to income recognition of retail portfolio (Germany) - 12
- Adjustment to value of derivatives (UK) - 5
- Gain on sale of operating lease/FSL portfolios (Various) - 4
Sub-total Operating income £ 8 £ 21
Impairment losses on loans and advances:
- Reduced emergence period for losses (UK) - 8
Operating expenses:
- Tax reserve adjustments (Various) £ - £ 10
- Restructuring and employee separation (Various) see below (16) (9)
Sub-total Operating expenses £ (16) £ 1
Depreciation on Tangible Fixed Assets:
- Accumulated depreciation for operating lease vehicles (Germany) - 4
Total exceptional items £ (8) £ 34
In 2006, the Company announced a plan to restructure its business in Germany that supports the sales activities of automotive financial services for Ford, Jaguar, Land Rover and Mazda vehicles in Germany. The plan includes the consolidation of branches into district offices. These actions will exploit economies of scale and facilitate the spread of best practice in a manner that will deliver cost efficiency. The Company recognised pre-tax charges of £16 million in 2006. The costs associated with the business restructuring are primarily related to employee separations and were charged to operating expenses. The restructuring will be completed in 2007.
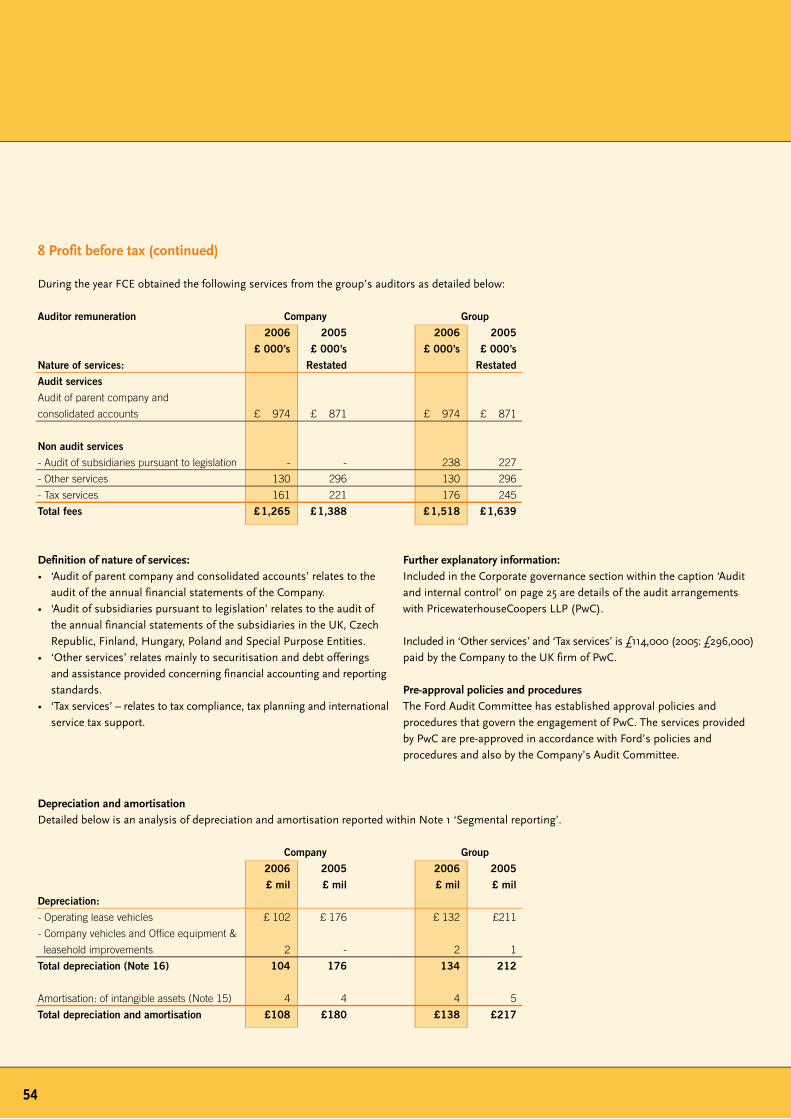
Definition of nature of services:• ‘Audit of parent company and consolidated accounts’ relates to the
audit of the annual financial statements of the Company.• ‘Audit of subsidiaries pursuant to legislation’ relates to the audit of
the annual financial statements of the subsidiaries in the UK, Czech Republic, Finland, Hungary, Poland and Special Purpose Entities.
• ‘Other services’ relates mainly to securitisation and debt offerings and assistance provided concerning financial accounting and reporting standards.
• ‘Tax services’ – relates to tax compliance, tax planning and international service tax support.
8 Profit before tax (continued)
During the year FCE obtained the following services from the group’s auditors as detailed below:
Auditor remuneration Company Group
2006 2005 2006 2005
£ 000’s £ 000’s £ 000’s £ 000’s
Nature of services: Restated Restated
Audit services
Audit of parent company and
consolidated accounts £ 974 £ 871 £ 974 £ 871
Non audit services
- Audit of subsidiaries pursuant to legislation - - 238 227
- Other services 130 296 130 296
- Tax services 161 221 176 245
Total fees £ 1,265 £ 1,388 £ 1,518 £ 1,639
5�
Further explanatory information:Included in the Corporate governance section within the caption ‘Audit and internal control’ on page 25 are details of the audit arrangements with PricewaterhouseCoopers LLP (PwC).
Included in ‘Other services’ and ‘Tax services’ is £114,000 (2005: £296,000) paid by the Company to the UK firm of PwC.
Pre-approval policies and proceduresThe Ford Audit Committee has established approval policies and procedures that govern the engagement of PwC. The services provided by PwC are pre-approved in accordance with Ford’s policies and procedures and also by the Company’s Audit Committee.
Depreciation and amortisationDetailed below is an analysis of depreciation and amortisation reported within Note 1 ‘Segmental reporting’.
Company Group
2006 2005 2006 2005
£ mil £ mil £ mil £ mil
Depreciation:
- Operating lease vehicles £ 102 £ 176 £ 132 £211
- Company vehicles and Office equipment &
leasehold improvements 2 - 2 1
Total depreciation (Note 16) 104 176 134 212
Amortisation: of intangible assets (Note 15) 4 4 4 5
Total depreciation and amortisation £108 £180 £138 £217
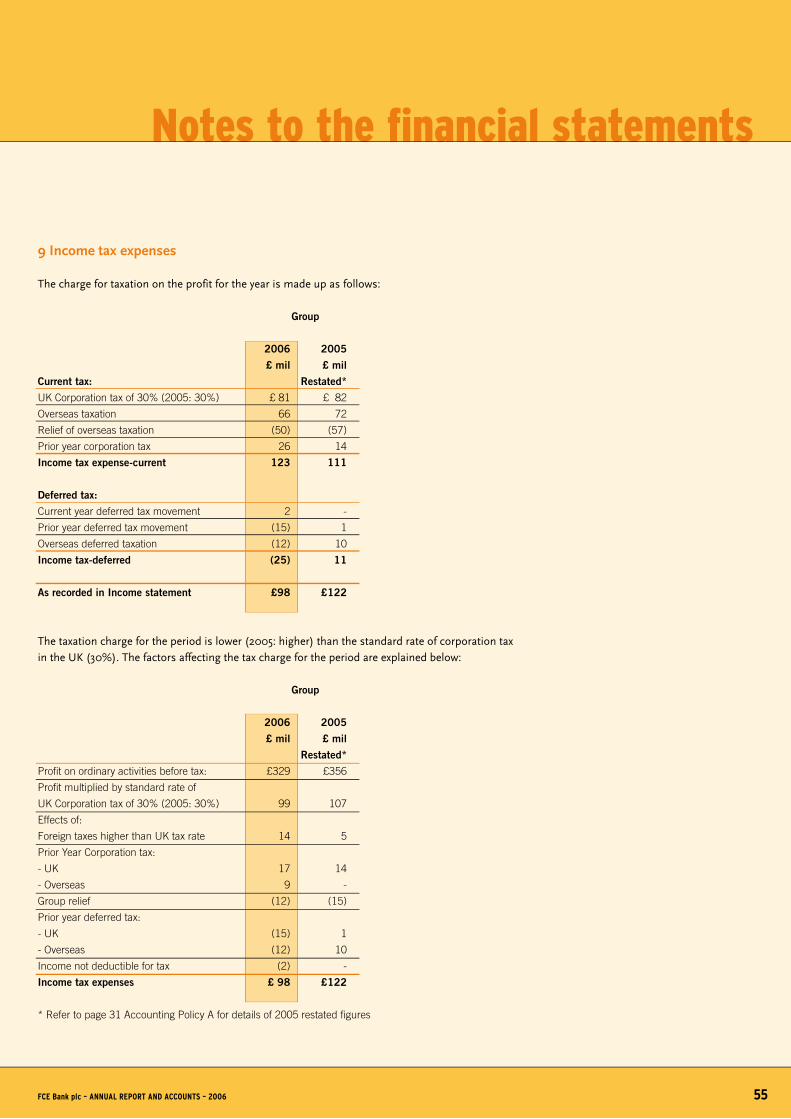
Notes to the financial statements
9 Income tax expenses
The charge for taxation on the profit for the year is made up as follows:
Group
2006 2005
£ mil £ mil
Current tax: Restated*
UK Corporation tax of 30% (2005: 30%) £ 81 £ 82
Overseas taxation 66 72
Relief of overseas taxation (50) (57)
Prior year corporation tax 26 14
Income tax expense-current 123 111
Deferred tax:
Current year deferred tax movement 2 -
Prior year deferred tax movement (15) 1
Overseas deferred taxation (12) 10
Income tax-deferred (25) 11
As recorded in Income statement £98 £122
The taxation charge for the period is lower (2005: higher) than the standard rate of corporation tax in the UK (30%). The factors affecting the tax charge for the period are explained below:
Group
2006 2005
£ mil £ mil
Restated*
Profi t on ordinary activities before tax: £329 £356
Profi t multiplied by standard rate of
UK Corporation tax of 30% (2005: 30%) 99 107
Effects of:
Foreign taxes higher than UK tax rate 14 5
Prior Year Corporation tax:
- UK 17 14
- Overseas 9 -
Group relief (12) (15)
Prior year deferred tax:
- UK (15) 1
- Overseas (12) 10
Income not deductible for tax (2) -
Income tax expenses £ 98 £122
* Refer to page 31 Accounting Policy A for details of 2005 restated fi gures
FCE Bank plc – ANNUAL REPORT AND ACCOUNTS – 2006 55

The following balances at the year end which are included in ‘Cash and advances to other banks’ are not available for use in FCE’s day to day operations:• ‘Cash associated with securitisation transactions’ includes both cash retained in the Company and consolidated
SPEs. For further information on SPE’s refer to Note 13 ‘Sales of receivables and related financing’.• ‘Central bank deposits’ represent balances with the Bank of England and other Central banks in Europe
which FCE is required to maintain.
The effective interest rate of cash and advances to other banks is disclosed within Note 39 ‘Interest rate risk’.
11 Derivative financial instruments
FCE maintains an active asset-liability management programme to maximise financing margins while limiting the impact of changes in interest rates and foreign exchange rates.
The following table provides examples of certain activities undertaken, the related risks associated with such activities and the types of derivatives used in managing such risks.
The use of derivatives is an integral part of FCE’s risk management programme, providing reduced exposure to financial market volatility and substantial funding flexibility at an acceptable cost. Company policies and controls are in place, including derivative effectiveness testing at each reporting date, to manage these risks and are detailed on the following page.
10 Cash and advances to other banks
Cash and highly liquid investments with a maturity of 90 days or less at date of purchase are included within this note. The net book value of cash and advances to other banks approximates fair value due to the short maturities of these investments.
Company Group
2006 2005 2006 2005
£ mil £ mil £ mil £ mil
Cash in bank £ 220 £ 186 £ 239 £ 204
Cash in transit 11 198 11 198
Cash equivalents 128 159 128 159
Cash and cash equivalents 359 543 378 561
Other bank deposits 49 - 366 240
Collateralised deposits 25 - 343 172
Cash associated with securitisation
transactions 74 - 709 412
Central bank deposits 46 69 46 69
Cash and advances to other banks £ 479 £ 612 £ 1,133 £ 1,042
56
Type of derivative• Cross-currency interest swaps• Foreign exchange spot and forward contracts• Pay fixed rate and receive floating-rate swaps• Pay floating rate and receive floating rate
swaps• Pay floating rate and receive fixed rate swaps
ActivityInvestment and funding in foreign currencies
Investment in Floating and Fixed-Rate Assets
Risk Sensitivity to change in foreign exchange rates
Repricing characteristics of assets not matching repricing of liabilities

Notes to the financial statements
The key derivative policies are:a. Prohibition of use for speculative purposesb. Prohibition of use of leveraged instrumentsc. Requirement for regular in-depth exposure analysisd. Establish and document accounting treatment at onset of tradee. Establish exposure limits (including cash deposits) with counterpartiesf. Compensation system not being tied to traders’ profits and losses
The key derivative controls are:a. Reviews of policies, positions and planned actions with managementb. Transactional controls including segregation of duties, approval
authorities, competitive quotes and confirmation proceduresc. Regular management review of portfolio mark to market valuations
and potential future exposuresd. Monitoring of counterparty credit worthinesse. Internal audits to evaluate controls and adherence to policies
Exposure to counterparty risk is managed by diversifying derivative activity amongst highly rated counterparties. FCE does transact with certain Ford related parties, which are non-rated entities. Substantially all of FCE’s activities are transacted with financial institutions. Wherever legally enforceable, FCE nets payments for derivative transactions. Counterparty offset is completed where there is a current enforceable legal right to set off the recognised amounts and there is an intention to settle on a net basis. FCE applies the settlement date of accounting for the purchase or sale of a financial asset.
The following tables analyse the treasury activities by type of contract, giving the underlying principal amount and fair value obtained by marking to market contracts and offsetting positive and negative values by counterparty. The fair values reported below are included in both assets and liabilities sections of the balance sheet within the caption ‘Derivative financial instruments’.
Company 2006 2005
Notional Fair Value Notional Fair Value
Amount Assets Liabilities Amount Assets Liabilities
£ mil £ mil £ mil £ mil £ mil £ mil
Designated as fair value hedges
Interest rate contracts:
Interest rate swaps £ - £ - £ - £ - £ - £ -
Cross currency interest rate swaps 7 - - 11 - -
Total designated as
fair value hedges 7 - - 11 - -
Non-designated derivatives
Exchange contracts:
Forward foreign exchange 1,687 5 3 2,234 25 1
Interest rate contracts:
Interest rate swaps 8,534 40 25 8,348 12 53
Cross currency interest rate swaps 1,378 10 64 1,107 28 54
Total non designated 11,599 55 92 11,689 65 108
Total derivatives excluding offset 11,606 55 92 11,700 65 108
Counterparty offset - (20) (20) - (28) (28)
Total derivatives including offset £ 11,606 £ 35 £ 72 £ 11,700 £ 37 £ 80
During 2005 certain derivatives that were previously in qualified hedge relationships were reclassified as non-designated derivatives in accordance with IAS 39 ‘Financial instruments, recognition and measurement’. The derivatives continue to comply with the above mentioned FCE risk management policies.
FCE Bank plc – ANNUAL REPORT AND ACCOUNTS – 2006 57
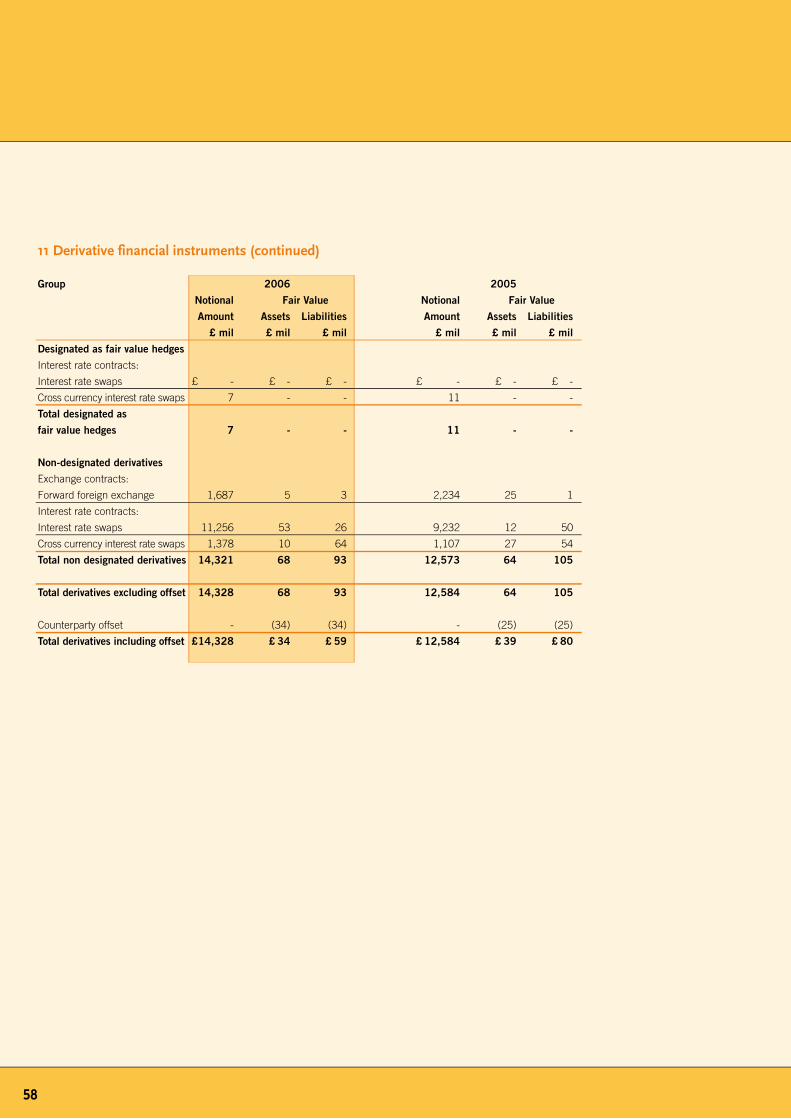
11 Derivative financial instruments (continued)
Group 2006 2005
Notional Fair Value Notional Fair Value
Amount Assets Liabilities Amount Assets Liabilities
£ mil £ mil £ mil £ mil £ mil £ mil
Designated as fair value hedges
Interest rate contracts:
Interest rate swaps £ - £ - £ - £ - £ - £ -
Cross currency interest rate swaps 7 - - 11 - -
Total designated as
fair value hedges 7 - - 11 - -
Non-designated derivatives
Exchange contracts:
Forward foreign exchange 1,687 5 3 2,234 25 1
Interest rate contracts:
Interest rate swaps 11,256 53 26 9,232 12 50
Cross currency interest rate swaps 1,378 10 64 1,107 27 54
Total non designated derivatives 14,321 68 93 12,573 64 105
Total derivatives excluding offset 14,328 68 93 12,584 64 105
Counterparty offset - (34) (34) - (25) (25)
Total derivatives including offset £ 14,328 £ 34 £ 59 £ 12,584 £ 39 £ 80
5�

Notes to the financial statements
12 Loans and advances to customers
Loans and advances to customers at December 31 were as follows:
Company Group
2006 2005 2006 2005
£ mil £ mil £ mil £ mil
Restated* Restated*
Gross loans and advances to customers £ 15,428 £ 16,010 £ 15,702 £ 16,271
Provision for incurred losses (see next page) (105) (118) (106) (119)
Unearned fi nance income (722) (812) (728) (819)
Net loans and advances to customers £ 14,601 £ 15,080 £ 14,868 £ 15,333
Analysis of net loans and advances:
Finance receivables:
Retail £ 7,684 £ 8,058 £ 7,835 £ 8,207
Wholesale 6,877 6,976 6,993 7,080
Other 40 46 40 46
Net loans and advances to customers £ 14,601 £ 15,080 £ 14,868 £ 15,333
Net loans subject to securitisation (Note 13) £ 5,846 £ 3,346 £ 5,846 £ 3,346
Net loans not subject to securitisation 8,755 11,734 9,022 11,987
Net loans and advances to customers £ 14,601 £ 15,080 £ 14,868 £ 15,333
Percentage analysis of net loans and advances:
Percentage of retail fi nancing loans 53% 53% 53% 54%
Percentage of wholesale/other fi nancing loans 47% 47% 47% 46%
Percentage of loans subject to securitisation 40% 22% 39% 22%
Percentage of loans not subject to securitisation 60% 78% 61% 78%
* Refer to page 31 Accounting Policy A for details of 2005 restated figures.
At 31 December 2006 and 31 December 2005, Loans and advances to customers includes £5,846 million and £3,346 million, respectively, of finance receivables that have been sold for legal purposes in securitisation transactions that do not satisfy the requirements for accounting sale treatment. These receivables are available only for repayment of the debt or other obligations issued or arising in the securitisation transactions and to pay other transaction participants; they are not available to pay our other obligations or the claims of our other creditors (Note 13).
FCE Bank plc – ANNUAL REPORT AND ACCOUNTS – 2006 5�
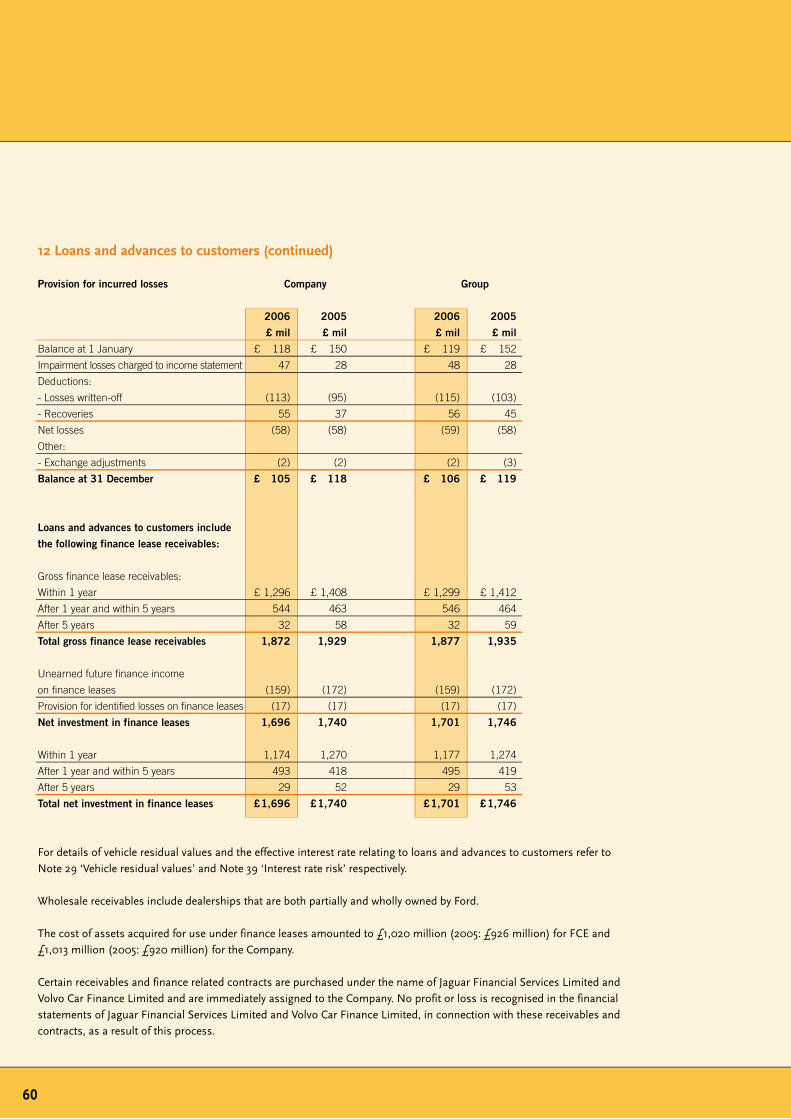
60
12 Loans and advances to customers (continued)
Provision for incurred losses Company Group
2006 2005 2006 2005
£ mil £ mil £ mil £ mil
Balance at 1 January £ 118 £ 150 £ 119 £ 152
Impairment losses charged to income statement 47 28 48 28
Deductions:
- Losses written-off (113) (95) (115) (103)
- Recoveries 55 37 56 45
Net losses (58) (58) (59) (58)
Other:
- Exchange adjustments (2) (2) (2) (3)
Balance at 31 December £ 105 £ 118 £ 106 £ 119
Loans and advances to customers include
the following finance lease receivables:
Gross finance lease receivables:
Within 1 year £ 1,296 £ 1,408 £ 1,299 £ 1,412
After 1 year and within 5 years 544 463 546 464
After 5 years 32 58 32 59
Total gross finance lease receivables 1,872 1,929 1,877 1,935
Unearned future finance income
on finance leases (159) (172) (159) (172)
Provision for identified losses on finance leases (17) (17) (17) (17)
Net investment in finance leases 1,696 1,740 1,701 1,746
Within 1 year 1,174 1,270 1,177 1,274
After 1 year and within 5 years 493 418 495 419
After 5 years 29 52 29 53
Total net investment in finance leases £ 1,696 £ 1,740 £ 1,701 £ 1,746
For details of vehicle residual values and the effective interest rate relating to loans and advances to customers refer to Note 29 ‘Vehicle residual values’ and Note 39 ‘Interest rate risk’ respectively.
Wholesale receivables include dealerships that are both partially and wholly owned by Ford.
The cost of assets acquired for use under finance leases amounted to £1,020 million (2005: £926 million) for FCE and £1,013 million (2005: £920 million) for the Company.
Certain receivables and finance related contracts are purchased under the name of Jaguar Financial Services Limited and Volvo Car Finance Limited and are immediately assigned to the Company. No profit or loss is recognised in the financial statements of Jaguar Financial Services Limited and Volvo Car Finance Limited, in connection with these receivables and contracts, as a result of this process.

Notes to the financial statements
13 Sales of receivables and related financing
Funding sources of the Company include securitisation programs which generally include the transfer of retail and wholesale receivables through a variety of programs, utilising both amortising and revolving structures. The Company also engages in other structured financing and factoring transactions that have similar features to securitisation and we refer to them as securitisation in this report.
As part of these transactions the Company provides various forms of credit enhancements to reduce the risk of loss for investors. Credit enhancements include over-collateralisation; segregated cash reserve funds, subordinated securities and excess spread. Over-collateralisation is when the principal balance of the securitised assets exceeds the principal amount of related asset-backed securities. Excess spread occurs when interest collections on the securitised assets exceed the related fees and expenses, including interest payments on the related asset-backed securities.
The Company retains interests in its securitisation transactions, including senior and subordinated securities issued by SPE’s, rights to restricted cash held for the benefit of the SPE (for example, a reserve fund) and residual interests. Residual interests represent the right to receive collections on the securitised assets in excess of amounts needed to pay securitisation investors and to pay other transaction participants and expenses. The Company’s ability to realise the carrying amount of its retained interests depends on actual credit losses and prepayment speeds on the securitised assets.
By providing these enhancements and retained interests the Company has entered into an arrangement (as described in IAS 39 ‘Financial instruments, recognition and measurement’), which does not qualify as a transfer of a financial asset. The Company therefore continues to recognise the carrying value of the transferred assets within its balance sheet. The transferred assets are held for the sole purpose of repayment of corresponding liabilities to investors or other third parties. These assets are not available to pay the Company’s other obligations or the claims of other creditors.
Use of Special Purpose Entities In a securitisation transaction, legally the securitised assets are generally held by a bankruptcy-remote SPE in order to isolate the securitised assets from the claims of the Company’s creditors and ensure that the cash flows on the securitised assets are available for the benefit of securitisation investors. As a result, payments to securitisation investors are based on the creditworthiness of the securitised assets and any enhancements, and not on the Company’s creditworthiness.
Securitisation SPEs have limited purposes and generally are only permitted to purchase the securitised assets, issue asset-backed securities and make payments on the securities. The SPEs utilised by the Company conduct their activities solely to meet the specific needs of the Company. In accordance with scope of Interpretation SIC-12 ‘Consolidation – Special Purpose Entities’ the entity is consolidated as a subsidiary within the FCE Group balance sheet. Where applicable, the liabilities reported within the Group balance sheet represent the liabilities of the SPE, and these are reported in Note 19 ‘Due to other banks’ and Note 21 ‘Debt securities in issue’ for private and public transactions respectively. Where the Company has entered into a structured financing arrangement with a third party finance provider, and no SPE structure is involved, a liability is recognised within the Company and Group balance sheet within the caption ‘Due to other banks’, representing the proceeds received from the finance provider.
None of the Company’s officers, directors or employees holds any equity interests in the SPEs utlised or receives any direct or indirect compensation from the SPEs. Also such SPEs do not own shares in the Company or shares in any other Ford affiliate.
Sales of receivables and debt securities The tables on the following page summarises balances relating to the Company’s securitisation transactions. The external liabilities and associated cash disclosed represent those of the relevant SPE consolidated into the Group as per SIC-12 ‘Consolidation – Special Purpose Entities’. Net cash proceeds received by the Company from the sale of receivables as at 31 December 2006 were £4,506 million (2005 £2,357 million) and are included in Note 20 ‘Due to parent and related undertakings’.
FCE Bank plc – ANNUAL REPORT AND ACCOUNTS – 2006 61

13 Sales of receivables and related financing (continued)
62
Sales of receivables and debt securities continued
2006
Wholesale Retail Total Total
Public Private Public Private Public Private Total
£ mil £ mil £ mil £ mil £ mil £ mil £ mil
Net loans securitised (Note 12) £ - £ 2,991 £ 372 £ 2,483 £ 372 £ 5,474 £ 5,846
SPE other bank deposits - 210 43 113 43 323 366
SPE collateralised deposits - 87 22 234 22 321 343
SPE cash (Note 10) - 297 65 347 65 644 709
Total assets £ - £ 3,288 £ 437 £ 2,830 £ 437 £ 6,118 £ 6,555
Due to other banks (Note 19) - 2,439 - 2,416 - 4,855 4,855
Debt securities in issue (Note 21) - - 410 - 410 - 410
Total external liabilities - 2,439 410 2,416 410 4,855 5,265
Retained interests (Note 18) - 362 3 330 3 692 695
Other liabilities 487 24 84 24 571 595
Total liabilities £ - £ 3,288 £ 437 £ 2,830 £ 437 £ 6,118 £ 6,555
2005
Wholesale Retail Total Total
Public Private Public Private Public Private Total
£ mil £ mil £ mil £ mil £ mil £ mil £ mil
Net loans securitised (Note 12) £ - £ 1,869 £ 788 £ 689 £ 788 £ 2,558 £ 3,346
SPE other bank deposits - 121 80 39 80 160 240
SPE collateralised deposits - 51 62 59 62 110 172
SPE cash (Note 10) - 172 142 98 142 270 412
Total assets £ - £ 2,041 £ 930 £ 787 £ 930 £ 2,828 £ 3,758
Due to other banks (Note 19) - 1,592 - 690 - 2,282 2,282
Debt securities in issue (Note 21) - - 866 - 866 - 866
Total external liabilities - 1,592 866 690 866 2,282 3,148
Retained interests (Note 18) - 229 9 40 9 269 278
Other liabilities - 220 55 57 55 277 332
Total liabilities £ - £ 2,041 £ 930 £ 787 £ 930 £ 2,828 £ 3,758
‘Retained interests’ includes securities retained by the Company and subordinated loans receivable (refer to Note 18 ‘Other assets’) and senior seller loans provided by the Company to the SPE, which eliminate on consolidation.
‘Other liabilities’ includes outstanding positions held by the SPE with the Company and other external parties. The liabilities represent short term timing differences between collection and distribution periods as well as deferred purchase amounts and discounts from book value granted by the Company upon transfer of assets.

Notes to the financial statements
Continuing obligationsThe Company is engaged as servicer to collect and service the securitised assets and generally receives a servicing fee. Servicing duties include collecting payments and preparing monthly investor reports on the performance of the securitised assets and on amounts of interest and/or principal payments to be made to investors. While servicing securitised assets, the Company applies the same servicing policies and procedures that apply to our owned assets and maintain our normal relationship with our financing customers.
The Company generally has no obligation to repurchase or replace any securitised asset that subsequently becomes delinquent in payment
63
or otherwise is in default. Generally securitisation investors have no recourse to the Company or the Company’s other assets for credit losses on the securitised assets and have no right to require the Company to repurchase their investments. The Company does not guarantee any asset-backed securities and has no obligation to provide liquidity or make monetary contributions or contributions of additional assets to the SPEs either due to the performance of the securitised assets or the credit rating of the Company’s short-term or long-term debt. However, as the seller and servicer of the securitised assets, the Company is obligated to provide certain kinds of support to securitisation transactions, which are customary in the securitisation industry.
14 Investment in group undertakings
Investments in group undertakings Company
at December 31 were as follows:
2006 2005
£ mil £ mil
Cost at 1 January and 31 December £ 80 £ 80
Amounts written down at 1 January
and 31 December (8) (8)
Net book value at 31 December £ 72 £ 72
Investment in banks included above 7 7
Subsidiary undertakings Benefi cial Accounting Country of Principal activity
as at 31 December 2006 interest reference date incorporation/registration
Automotive Finance Limited * 100% 30 June England & Wales Finance company
FCE Leasing (Holdings) Limited 100% 31 December England & Wales Holding company
FCE Leasing Limited * 100% 31 December England & Wales Finance company
Ford Automotive Leasing Limited * 100% 30 September England & Wales Finance company
Jaguar Financial Services Limited * 100% 31 March England & Wales Finance company
Meritpoint Limited 100% 30 June England & Wales Finance company
Primus Automotive Financial Services Limited 100% 31 December England & Wales Dormant
Volvo Car Finance Limited 100% 31 December England & Wales Finance company
FCE Credit s.r.o. 100% 31 December Czech Republic Finance company
Volvo Car Finance Finland Limited 100% 31 December Finland Finance Company
FCE Credit Hungaria Zrt 100% 31 December Hungary Finance company
FCE Services Kft * 100% 31 December Hungary Finance company
FCE SpA 100% 31 December Italy In liquidation
FCE Bank Polska S.A. 100% 31 December Poland Bank
FCE Credit Poland S.A. 100% 31 December Poland Finance company
All subsidiaries are consolidated into these financial statements and operate principally in their country of incorporation. Subsidiaries indicated by an asterisk are not directly owned by the Company.FCE Bank Polska S.A. is a regulated bank and is required, among other things to maintain minimum capital reserves.
FCE Bank plc – ANNUAL REPORT AND ACCOUNTS – 2006

6�
15 Goodwill and other intangible assets
Goodwill and other intangible assets at December 31 were as follows:
Company Group
2006 2005 2006 2005
£ mil £ mil £ mil £ mil
Net book value
Goodwill £ 160 £ 160 £ 12 £ 12
Other intangible assets (per table below) 23 26 24 26
Total goodwill and intangible assets £ 183 £ 186 £ 36 £ 38
GOODWILL
Cost and net book value:
At 1 January and 31 December £ 160 £ 160 £ 12 £ 12
Impairment charge:
At 1 January and 31 December £ - £ - £ - £ -
‘Goodwill’ represents the excess of the cost of an acquisition over the fair value of FCE’s share of the net assets of the acquired subsidiary at the date of acquisition. Goodwill on acquisitions of subsidiaries occurring on or after 1 January 1995 is reported in the balance sheet as an intangible asset and was amortised using the straight-line method over its estimated useful life, until 1 January 2004 when amortisation of goodwill ceased upon the adoption of International Financial Reporting Standards. Goodwill on acquisitions of subsidiaries that occurred prior to 1 January 1995 was charged in full to retained profits in shareholder’s equity; such goodwill has not been retrospectively capitalised and amortised.
Analysis of other intangible assets‘Other intangible assets’ relate entirely to computer software development costs which are anticipated to generate future economic benefits to FCE. Software development costs are amortised to the income statement within the captions ‘Other operating expenses’ over the estimated useful life of the system as specified in Accounting Policy M item (ii) ‘Goodwill and other intangible assets’.
Company Group
Software Software
Internally Externally Total Internally Externally Total
generated acquired generated acquired
£ mil £ mil £ mil £ mil £ mil £ mil
Cost: Restated* Restated*
At 1 January 2006 £15 £24 £39 £15 £24 £39
Additions 1 - 1 2 - 2
At 31 December 2006 16 24 40 17 24 41
Amortisation:
At 1 January 2006 12 1 13 12 1 13
Charge for the year (Note 6) 2 2 4 2 2 4
At 31 December 2006 14 3 17 14 3 17
Net book value at 31 December 2006 £ 2 £21 £23 £ 3 £21 £24
Net book value at 31 December 2005 £ 3 £ 23 £ 26 £ 3 £ 23 £ 26
* Cost of intangible assets as 1 January 2006 have been restated to appropriately refl ect the amount of computer software development costs.
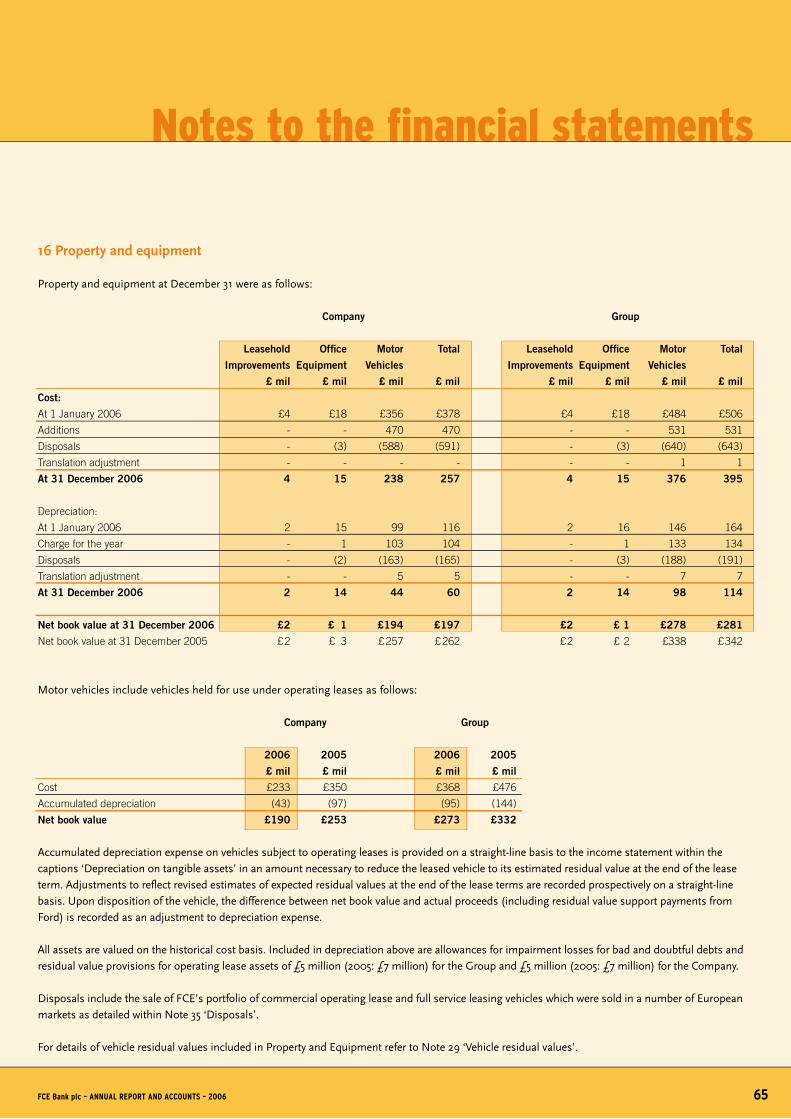
Notes to the financial statements
FCE Bank plc – ANNUAL REPORT AND ACCOUNTS – 2006 65
16 Property and equipment
Property and equipment at December 31 were as follows:
Company Group
Leasehold Offi ce Motor Total Leasehold Offi ce Motor Total
Improvements Equipment Vehicles Improvements Equipment Vehicles
£ mil £ mil £ mil £ mil £ mil £ mil £ mil £ mil
Cost:
At 1 January 2006 £4 £18 £356 £378 £4 £18 £484 £506
Additions - - 470 470 - - 531 531
Disposals - (3) (588) (591) - (3) (640) (643)
Translation adjustment - - - - - - 1 1
At 31 December 2006 4 15 238 257 4 15 376 395
Depreciation:
At 1 January 2006 2 15 99 116 2 16 146 164
Charge for the year - 1 103 104 - 1 133 134
Disposals - (2) (163) (165) - (3) (188) (191)
Translation adjustment - - 5 5 - - 7 7
At 31 December 2006 2 14 44 60 2 14 98 114
Net book value at 31 December 2006 £2 £ 1 £194 £197 £2 £ 1 £278 £281
Net book value at 31 December 2005 £ 2 £ 3 £ 257 £ 262 £ 2 £ 2 £338 £ 342
Motor vehicles include vehicles held for use under operating leases as follows:
Company Group
2006 2005 2006 2005
£ mil £ mil £ mil £ mil
Cost £233 £350 £368 £476
Accumulated depreciation (43) (97) (95) (144)
Net book value £190 £253 £273 £332
Accumulated depreciation expense on vehicles subject to operating leases is provided on a straight-line basis to the income statement within the captions ‘Depreciation on tangible assets’ in an amount necessary to reduce the leased vehicle to its estimated residual value at the end of the lease term. Adjustments to reflect revised estimates of expected residual values at the end of the lease terms are recorded prospectively on a straight-line basis. Upon disposition of the vehicle, the difference between net book value and actual proceeds (including residual value support payments from Ford) is recorded as an adjustment to depreciation expense.
All assets are valued on the historical cost basis. Included in depreciation above are allowances for impairment losses for bad and doubtful debts and residual value provisions for operating lease assets of £5 million (2005: £7 million) for the Group and £5 million (2005: £7 million) for the Company.
Disposals include the sale of FCE’s portfolio of commercial operating lease and full service leasing vehicles which were sold in a number of European markets as detailed within Note 35 ‘Disposals’.
For details of vehicle residual values included in Property and Equipment refer to Note 29 ‘Vehicle residual values’.

17 Deferred tax assets and liabilities
The movement on the deferred income tax account is as follows: Company Group
2006 2005 2006 2005
£ mil £ mil £ mil £ mil
Restated* Restated*
At 1 January liability/(asset) £ - £(40) £ 2 £(9)
Income statement charge/(credit) (21) 40 (25) 11
At 31 December liability/(asset) £(21) £ - £(23) £ 2
Deferred income tax assets and liabilities are attributable to the following items:
Deferred income tax liability: Company Group
2006 2005 2006 2005
£ mil £ mil £ mil £ mil
Accelerated tax depreciation £ - £ 2 £ 3 £ 2
Other 35 43 40 51
At 31 December liability £35 £45 £43 £53
Deferred income tax asset: Company Group
2006 2005 2006 2005
£ mil £ mil £ mil £ mil
Accelerated tax depreciation £(24) £(19) £(24) £(14)
Other provisions (32) (26) (42) (37)
At 31 December (asset) £(56) £(45) £(66) £(51)
The deferred tax charge in the income statement comprises the following temporary differences: Company Group
2006 2005 2006 2005
£ mil £ mil £ mil £ mil
Accelerated tax depreciation £ (5) £19 £ (1) £(3)
Other provisions (16) 21 (24) 14
At 31 December liability/(asset) £(21) £40 £(25) £11
* Refer to page 31 Accounting Policy A for details of 2005 restated figures
Deferred income tax assets are recognised for tax loss carry-forwards only to the extent that realisation of the related tax benefit is probable. At 31 December 2006, the Company’s Irish branch has £3.6 million (2005: £7.3 million) of unused tax losses for which no deferred tax asset is recognised.Deferred income tax liabilities have not been established for the withholding tax and other taxes that would be payable on the unremitted earnings of certain subsidiaries, as such amounts are permanently reinvested; unremitted earnings totalled £49.9 million at 31 December 2006 (2005: £44.2 million).
66
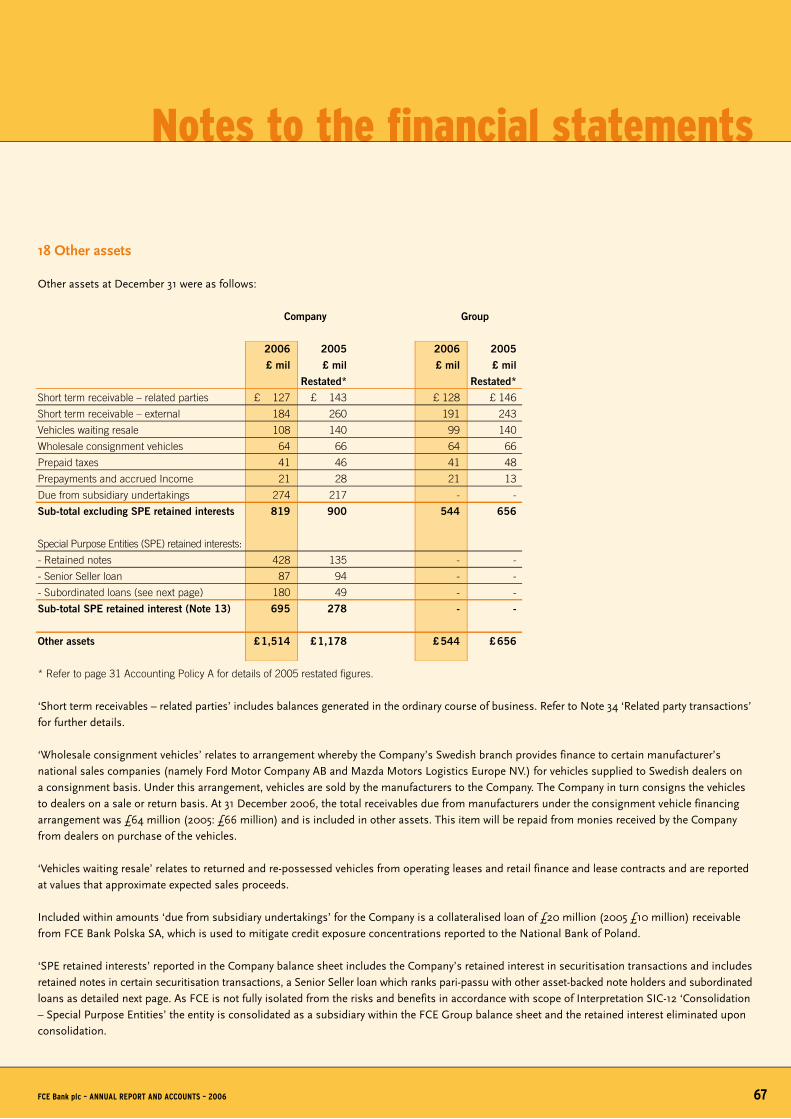
Notes to the financial statements
FCE Bank plc – ANNUAL REPORT AND ACCOUNTS – 2006 67
18 Other assets
Other assets at December 31 were as follows:
Company Group
2006 2005 2006 2005
£ mil £ mil £ mil £ mil
Restated* Restated*
Short term receivable – related parties £ 127 £ 143 £ 128 £ 146
Short term receivable – external 184 260 191 243
Vehicles waiting resale 108 140 99 140
Wholesale consignment vehicles 64 66 64 66
Prepaid taxes 41 46 41 48
Prepayments and accrued Income 21 28 21 13
Due from subsidiary undertakings 274 217 - -
Sub-total excluding SPE retained interests 819 900 544 656
Special Purpose Entities (SPE) retained interests:
- Retained notes 428 135 - -
- Senior Seller loan 87 94 - -
- Subordinated loans (see next page) 180 49 - -
Sub-total SPE retained interest (Note 13) 695 278 - -
Other assets £ 1,514 £ 1,178 £ 544 £ 656
* Refer to page 31 Accounting Policy A for details of 2005 restated fi gures.
‘Short term receivables – related parties’ includes balances generated in the ordinary course of business. Refer to Note 34 ‘Related party transactions’ for further details.
‘Wholesale consignment vehicles’ relates to arrangement whereby the Company’s Swedish branch provides finance to certain manufacturer’s national sales companies (namely Ford Motor Company AB and Mazda Motors Logistics Europe NV.) for vehicles supplied to Swedish dealers on a consignment basis. Under this arrangement, vehicles are sold by the manufacturers to the Company. The Company in turn consigns the vehicles to dealers on a sale or return basis. At 31 December 2006, the total receivables due from manufacturers under the consignment vehicle financing arrangement was £64 million (2005: £66 million) and is included in other assets. This item will be repaid from monies received by the Company from dealers on purchase of the vehicles.
‘Vehicles waiting resale’ relates to returned and re-possessed vehicles from operating leases and retail finance and lease contracts and are reported at values that approximate expected sales proceeds.
Included within amounts ‘due from subsidiary undertakings’ for the Company is a collateralised loan of £20 million (2005 £10 million) receivable from FCE Bank Polska SA, which is used to mitigate credit exposure concentrations reported to the National Bank of Poland.
‘SPE retained interests’ reported in the Company balance sheet includes the Company’s retained interest in securitisation transactions and includes retained notes in certain securitisation transactions, a Senior Seller loan which ranks pari-passu with other asset-backed note holders and subordinated loans as detailed next page. As FCE is not fully isolated from the risks and benefits in accordance with scope of Interpretation SIC-12 ‘Consolidation – Special Purpose Entities’ the entity is consolidated as a subsidiary within the FCE Group balance sheet and the retained interest eliminated upon consolidation.

6�
19 Due to other banks
Due to other banks at December 31 were as follows:
Company Group
2006 2005 2006 2005
£ mil £ mil £ mil £ mil
*Restated
Obligations arising from sales of receivables
(Note 13) £ 965 £ 766 £ 4,855 £ 2,282
Bank borrowings excluding overdrafts 770 840 850 933
European Investment Bank loans 831 762 831 762
Bank overdrafts 117 121 133 128
Due to other banks £2,683 £2,489 £6,669 £4,105
Analysis due to other banks:
Financing from sales of receivables £ 965 £ 766 £ 4,855 £ 2,282
Unsecured borrowings 1,718 1,723 1,814 1,823
Total due to other banks £2,683 £2,489 £6,669 £4,105
* Refer to page 31 Accounting Policy A for details of 2005 restated fi gures
‘Obligations from sales of receivables’ reflects sales of receivables completed under private transactions. As the arrangements do not satisfy the requirements for accounting sale treatment under IAS 39 ‘Financial instruments, recognition and measurement’, the sold receivables and the associated debt are not removed from the balance sheet. Where the Company has entered into a structured financing arrangement with a third party finance provider, and no SPE structure is involved, a liability is recognised within the Company balance sheet representing the proceeds received from the legal transfer of assets to the finance provider. This liability is not the legal obligation of the Company and is payable only out of collections on the underlying assets transferred to the finance provider.
18 Other assets (continued)
Subordinated loans receivable
Special Purpose Entity Currency Interest Rate Per Annum Company
000’s 2006 2005
£ mil £ mil
Globaldrive (UK) Series 4 plc. GBP 102,440 GBP 1-M-LIBOR +100 bps £ 102 £ -
Globaldrive (UK) Variable Funding 1 plc GBP 8,585 GBP 1-M-LIBOR +100 bps 9 -
Globaldrive Spain 2 B.V. EUR €31,900 EUR 3-M-EURIBOR +120 bps 21 -
Globaldrive (Germany) V Ltd EUR €7,600 Performance related 5 -
Globaldrive (UK) Series 2 plc GBP 6,100 GBP 1-M-LIBOR +120 bps 6 6
Globaldrive (UK) Series 2 plc GBP 640 Non interest bearing 1 1
TdA, Fondo de Titulización de Activos EUR €4,200 Performance related 3 8
TdA, Fondo de Titulización de Activos EUR €49,000 Performance related 33 34
Total subordinated loans £180 £49

Notes to the financial statements
‘Bank borrowings excluding overdrafts’ are typically either payment received as servicer in regard to sold receivables to banks which are in process of being repaid or other borrowings excluding overdrafts utilised in the ordinary course of business.
‘European Investment Bank (EIB) loans’ partially support a number of different vehicle projects relating to our automotive partners which have been assigned to the Company. The EIB loans have remaining terms from two to six years and are supported by guarantees and letters of credit provided by financial institutions on behalf of the Company to the EIB.
The effective interest rate of the amounts outstanding to other banks is disclosed within Note 39 ‘Interest rate risk’.
20 Due to parent and related undertakings
Due to parent and related undertakings at December 31 were as follows:
Company Group
2006 2005 2006 2005
£ mil £ mil £ mil £ mil
Restated*
Net cash proceeds from the
sale of receivables (Note 13) £ 4,506 £ 2,357 £ - £ -
Term loans due to related parties 1,984 3,745 1,984 3,745
Amounts drawn under a short term
revolving facility 1,012 343 1,012 343
Deposits received from related parties 710 585 710 585
Accounts payable to related parties 221 215 230 215
Amounts due to subsidiary undertakings 65 91 - -
Accrued interest 56 61 56 62
Due to parent and related undertakings £8,554 £7,397 £3,992 £4,950
* Refer to page 31 Accounting Policy A for details of 2005 restated figures
‘Net cash proceeds from the sale of receivables’ represents proceeds received from the transfer of assets to a SPE. This liability is not the legal obligation of the Company and is payable only out of collections on the underlying assets transferred to the finance provider.
‘Term loans due to related parties’ mainly comprises of loans due to FMCC with maturity dates ranging from 2007 to 2009.
‘Amounts drawn under a short term revolving facility’ provided to the Company by FMCC. This facility matures on 8 February 2008 or earlier upon 60 days notice from FMCC.
‘Deposits received from related parties’ are due to FCI, the Company’s immediate parent undertaking and are utilised to mitigate exposure concentrations reported to the Financial Services Authority.
‘Accounts payable to related parties’ are liabilities which are typically settled on a daily or monthly basis.
‘Accrued interest’ mainly comprises of interest due on ‘term loans due to related parties’ and ‘deposits received from related parties’. Interest is calculated on arm’s length terms.
Other amounts due to FMCC and FCI are reported within Note 22 ‘Other borrowed funds’.
The effective interest rate of amounts due to parent and related undertakings is disclosed within Note 39 ‘Interest rate risk.’
FCE Bank plc – ANNUAL REPORT AND ACCOUNTS – 2006 6�

70
21 Debt securities in issue
Details of the public debt funding programmes as at 31 December are as follows:
Company Group
PROGRAMME (YEAR LAUNCHED) – AMOUNT 2006 2005 2006 2005
£ mil £ mil £ mil £ mil
Euro Medium Term Note (1993) – US$12 billion:
- Continuously Available Retail Securities
(retail investors 1993) £ 339 £ 512 £ 339 £ 512
- Other European Medium Term Notes (excludes
Continuously Available Retail Securities) 1,313 2,547 1,313 2,547
Sub-total Euro Medium Term Notes £1,652 £3,059 £1,652 £3,059
Schuldschein 865 1,207 865 1,207
Obligations arising from sales of receivables
(Note 13) - - 410 866
Polish CP (1993) PLN 1 billion - - 35 49
Euro Commercial Paper (CP) & Euro Certifi cate
of Deposit (CD) (1993) – US$5 billion - 27 - 27
French Euro CD (1993) – EUR €3 billion - 2 - 2
Debt securities in issue £2,517 £4,295 £2,962 £5,210
Analysis of debt securities in issue
Unsecured borrowings £2,517 £4,295 £2,552 £4,344
Obligations arising from sales of receivables - - 410 866
Total debt securities in issue £2,517 £4,295 £2,962 £5,210
‘Euro Medium Term Note’ (EMTN) – the Company subject to compliance with all relevant laws, regulations and directives, may from time to time issue notes under this Programme. The aggregate principal amount of notes outstanding will not at any time exceed $12 billion (or the equivalent in other currencies). Certain notes to be issued under this Programme may be Continuously Available Retail Securities, which may be issued from time to time to investors on a continuously available basis. The Base Prospectus is dated 1 December 2006 and contains information relating to all notes, including Retail Securities.
The Commission de Surveillance du Secteur Financier (the CSSF) in its capacity as competent authority approved the EMTN Base Prospectus as required by Article 5.4 of Directive 2003/71/EC (the ‘Prospectus Directive’). Notes issued under the EMTN programme are listed on the Official List of the Luxembourg Stock Exchange and are admitted for trading on the Luxembourg Stock Exchange’s regulated market. The Luxembourg’s Stock Exchange website address is provided on page 97.
The Company has completed two issuances under the EMTN Programme in early 2007 as detailed in Note 36 ‘Post balance sheet events’.
‘Obligations from sales of receivables’ reflects sales of receivables completed under public transactions. As the arrangements do not satisfy the requirements for accounting sale treatment under IAS 39 ‘Financial instruments, recognition and measurement’, the sold receivables and the associated debt are not removed from the balance sheet. Liabilities reported are not the legal obligation of the Company and are payable only out of collections on the underlying assets transferred to the finance provider.
‘Schuldschein’ are certificates of indebtedness governed under German law issued by the Company’s German branches.
The effective interest rate of debt securities in issue is disclosed within Note 39 ‘Interest rate risk’.
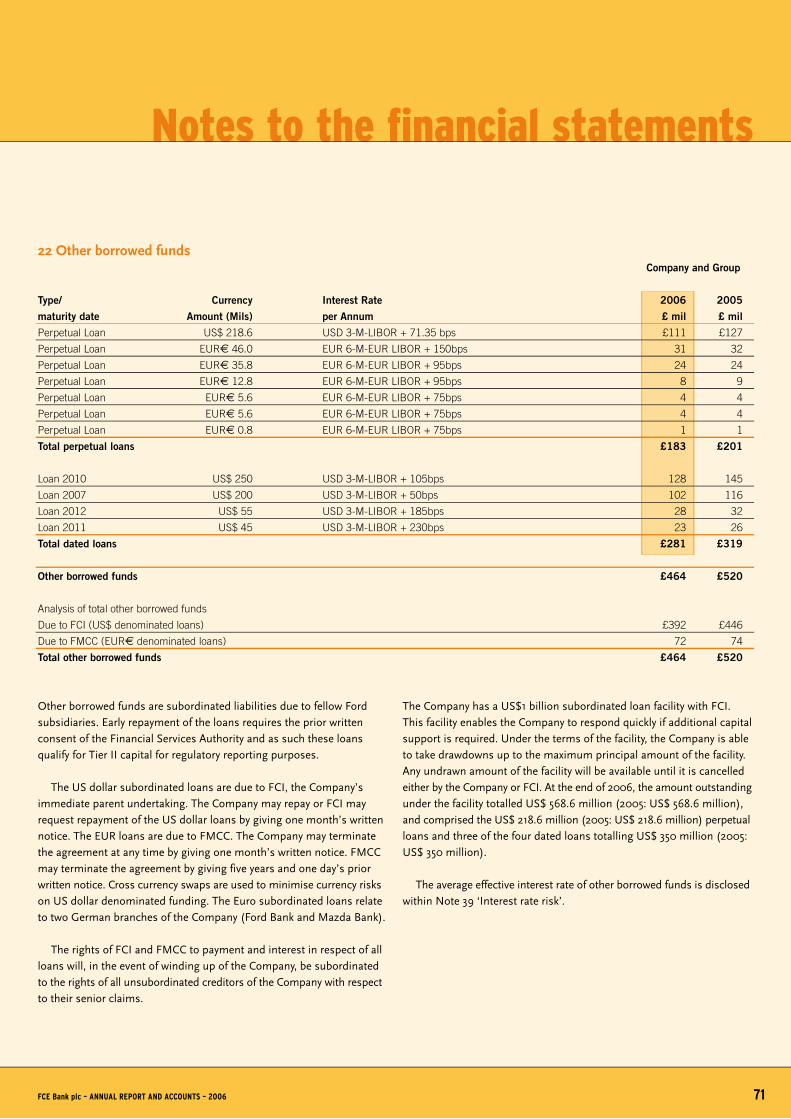
Notes to the financial statements
FCE Bank plc – ANNUAL REPORT AND ACCOUNTS – 2006 71
22 Other borrowed funds Company and Group
Type/ Currency Interest Rate 2006 2005
maturity date Amount (Mils) per Annum £ mil £ mil
Perpetual Loan US$ 218.6 USD 3-M-LIBOR + 71.35 bps £111 £127
Perpetual Loan EUR€ 46.0 EUR 6-M-EUR LIBOR + 150bps 31 32
Perpetual Loan EUR€ 35.8 EUR 6-M-EUR LIBOR + 95bps 24 24
Perpetual Loan EUR€ 12.8 EUR 6-M-EUR LIBOR + 95bps 8 9
Perpetual Loan EUR€ 5.6 EUR 6-M-EUR LIBOR + 75bps 4 4
Perpetual Loan EUR€ 5.6 EUR 6-M-EUR LIBOR + 75bps 4 4
Perpetual Loan EUR€ 0.8 EUR 6-M-EUR LIBOR + 75bps 1 1
Total perpetual loans £183 £201
Loan 2010 US$ 250 USD 3-M-LIBOR + 105bps 128 145
Loan 2007 US$ 200 USD 3-M-LIBOR + 50bps 102 116
Loan 2012 US$ 55 USD 3-M-LIBOR + 185bps 28 32
Loan 2011 US$ 45 USD 3-M-LIBOR + 230bps 23 26
Total dated loans £281 £319
Other borrowed funds £464 £520
Analysis of total other borrowed funds
Due to FCI (US$ denominated loans) £392 £446
Due to FMCC (EUR€ denominated loans) 72 74
Total other borrowed funds £464 £520
Other borrowed funds are subordinated liabilities due to fellow Ford subsidiaries. Early repayment of the loans requires the prior written consent of the Financial Services Authority and as such these loans qualify for Tier II capital for regulatory reporting purposes.
The US dollar subordinated loans are due to FCI, the Company’s immediate parent undertaking. The Company may repay or FCI may request repayment of the US dollar loans by giving one month’s written notice. The EUR loans are due to FMCC. The Company may terminate the agreement at any time by giving one month’s written notice. FMCC may terminate the agreement by giving five years and one day’s prior written notice. Cross currency swaps are used to minimise currency risks on US dollar denominated funding. The Euro subordinated loans relate to two German branches of the Company (Ford Bank and Mazda Bank).
The rights of FCI and FMCC to payment and interest in respect of all loans will, in the event of winding up of the Company, be subordinated to the rights of all unsubordinated creditors of the Company with respect to their senior claims.
The Company has a US$1 billion subordinated loan facility with FCI. This facility enables the Company to respond quickly if additional capital support is required. Under the terms of the facility, the Company is able to take drawdowns up to the maximum principal amount of the facility. Any undrawn amount of the facility will be available until it is cancelled either by the Company or FCI. At the end of 2006, the amount outstanding under the facility totalled US$ 568.6 million (2005: US$ 568.6 million), and comprised the US$ 218.6 million (2005: US$ 218.6 million) perpetual loans and three of the four dated loans totalling US$ 350 million (2005: US$ 350 million).
The average effective interest rate of other borrowed funds is disclosed within Note 39 ‘Interest rate risk’.
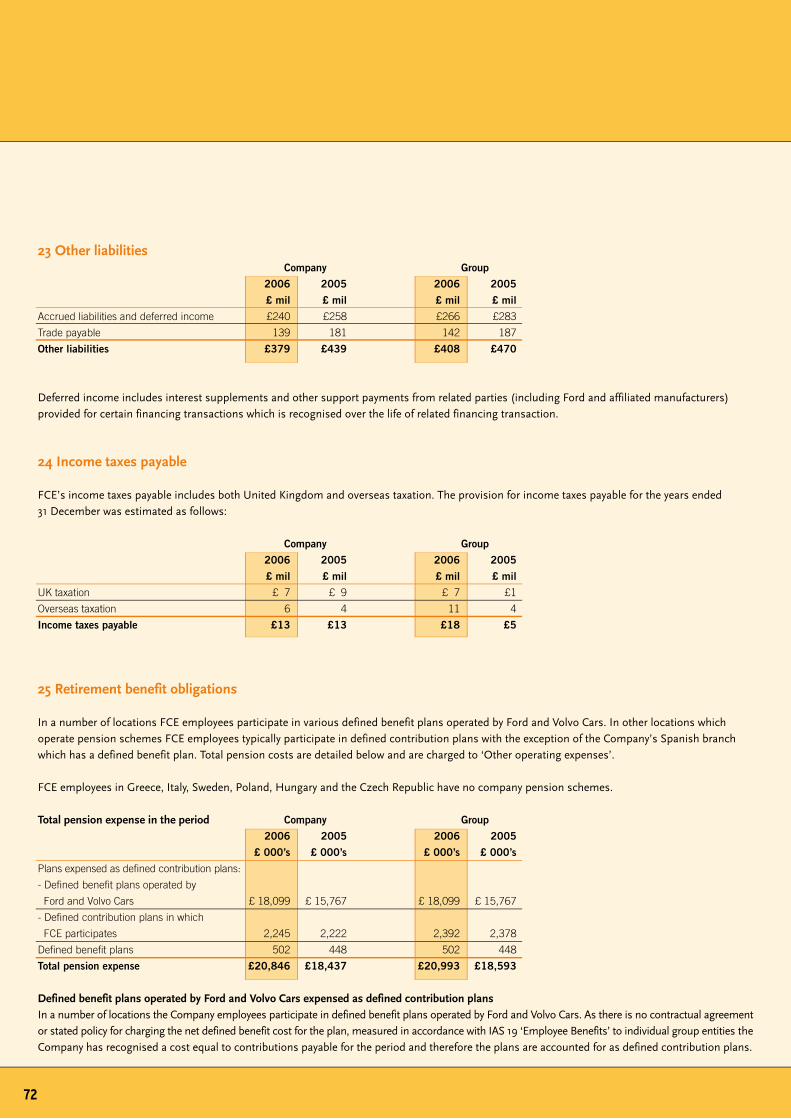
23 Other liabilities Company Group
2006 2005 2006 2005
£ mil £ mil £ mil £ mil
Accrued liabilities and deferred income £240 £258 £266 £283
Trade payable 139 181 142 187
Other liabilities £379 £439 £408 £470
Deferred income includes interest supplements and other support payments from related parties (including Ford and affiliated manufacturers) provided for certain financing transactions which is recognised over the life of related financing transaction.
24 Income taxes payable
FCE’s income taxes payable includes both United Kingdom and overseas taxation. The provision for income taxes payable for the years ended 31 December was estimated as follows:
Company Group
2006 2005 2006 2005
£ mil £ mil £ mil £ mil
UK taxation £ 7 £ 9 £ 7 £1
Overseas taxation 6 4 11 4
Income taxes payable £13 £13 £18 £5
25 Retirement benefit obligations
In a number of locations FCE employees participate in various defined benefit plans operated by Ford and Volvo Cars. In other locations which operate pension schemes FCE employees typically participate in defined contribution plans with the exception of the Company’s Spanish branch which has a defined benefit plan. Total pension costs are detailed below and are charged to ‘Other operating expenses’.
FCE employees in Greece, Italy, Sweden, Poland, Hungary and the Czech Republic have no company pension schemes.
Total pension expense in the period Company Group
2006 2005 2006 2005
£ 000’s £ 000’s £ 000’s £ 000’s
Plans expensed as defi ned contribution plans:
- Defi ned benefi t plans operated by
Ford and Volvo Cars £ 18,099 £ 15,767 £ 18,099 £ 15,767
- Defi ned contribution plans in which
FCE participates 2,245 2,222 2,392 2,378
Defi ned benefi t plans 502 448 502 448
Total pension expense £20,846 £18,437 £20,993 £18,593
Defined benefit plans operated by Ford and Volvo Cars expensed as defined contribution plansIn a number of locations the Company employees participate in defined benefit plans operated by Ford and Volvo Cars. As there is no contractual agreement or stated policy for charging the net defined benefit cost for the plan, measured in accordance with IAS 19 ‘Employee Benefits’ to individual group entities the Company has recognised a cost equal to contributions payable for the period and therefore the plans are accounted for as defined contribution plans.
72
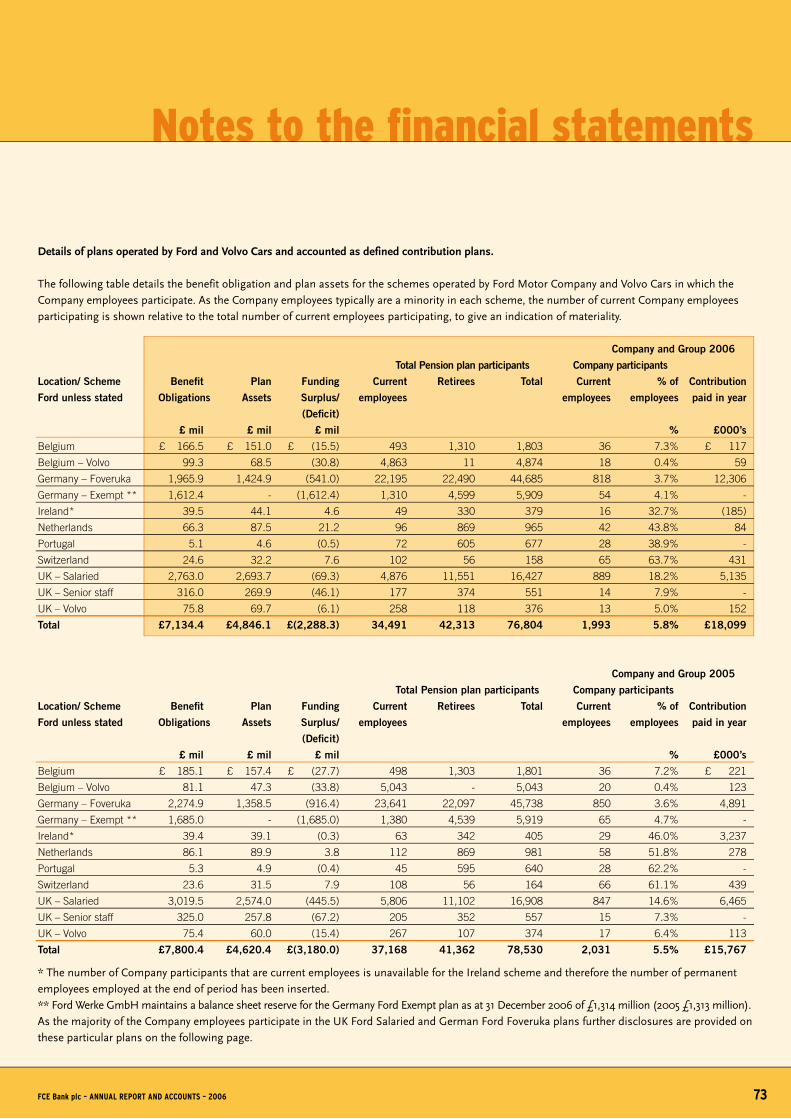
Notes to the financial statements
FCE Bank plc – ANNUAL REPORT AND ACCOUNTS – 2006 73
Company and Group 2006
Total Pension plan participants Company participants
Location/ Scheme Benefi t Plan Funding Current Retirees Total Current % of Contribution
Ford unless stated Obligations Assets Surplus/ employees employees employees paid in year
(Defi cit)
£ mil £ mil £ mil % £000’s
Belgium £ 166.5 £ 151.0 £ (15.5) 493 1,310 1,803 36 7.3% £ 117
Belgium – Volvo 99.3 68.5 (30.8) 4,863 11 4,874 18 0.4% 59
Germany – Foveruka 1,965.9 1,424.9 (541.0) 22,195 22,490 44,685 818 3.7% 12,306
Germany – Exempt ** 1,612.4 - (1,612.4) 1,310 4,599 5,909 54 4.1% -
Ireland* 39.5 44.1 4.6 49 330 379 16 32.7% (185)
Netherlands 66.3 87.5 21.2 96 869 965 42 43.8% 84
Portugal 5.1 4.6 (0.5) 72 605 677 28 38.9% -
Switzerland 24.6 32.2 7.6 102 56 158 65 63.7% 431
UK – Salaried 2,763.0 2,693.7 (69.3) 4,876 11,551 16,427 889 18.2% 5,135
UK – Senior staff 316.0 269.9 (46.1) 177 374 551 14 7.9% -
UK – Volvo 75.8 69.7 (6.1) 258 118 376 13 5.0% 152
Total £7,134.4 £4,846.1 £(2,288.3) 34,491 42,313 76,804 1,993 5.8% £18,099
Company and Group 2005
Total Pension plan participants Company participants
Location/ Scheme Benefi t Plan Funding Current Retirees Total Current % of Contribution
Ford unless stated Obligations Assets Surplus/ employees employees employees paid in year
(Defi cit)
£ mil £ mil £ mil % £000’s
Belgium £ 185.1 £ 157.4 £ (27.7) 498 1,303 1,801 36 7.2% £ 221
Belgium – Volvo 81.1 47.3 (33.8) 5,043 - 5,043 20 0.4% 123
Germany – Foveruka 2,274.9 1,358.5 (916.4) 23,641 22,097 45,738 850 3.6% 4,891
Germany – Exempt ** 1,685.0 - (1,685.0) 1,380 4,539 5,919 65 4.7% -
Ireland* 39.4 39.1 (0.3) 63 342 405 29 46.0% 3,237
Netherlands 86.1 89.9 3.8 112 869 981 58 51.8% 278
Portugal 5.3 4.9 (0.4) 45 595 640 28 62.2% -
Switzerland 23.6 31.5 7.9 108 56 164 66 61.1% 439
UK – Salaried 3,019.5 2,574.0 (445.5) 5,806 11,102 16,908 847 14.6% 6,465
UK – Senior staff 325.0 257.8 (67.2) 205 352 557 15 7.3% -
UK – Volvo 75.4 60.0 (15.4) 267 107 374 17 6.4% 113
Total £7,800.4 £4,620.4 £(3,180.0) 37,168 41,362 78,530 2,031 5.5% £15,767
* The number of Company participants that are current employees is unavailable for the Ireland scheme and therefore the number of permanent employees employed at the end of period has been inserted.** Ford Werke GmbH maintains a balance sheet reserve for the Germany Ford Exempt plan as at 31 December 2006 of £1,314 million (2005 £1,313 million).As the majority of the Company employees participate in the UK Ford Salaried and German Ford Foveruka plans further disclosures are provided on these particular plans on the following page.
Details of plans operated by Ford and Volvo Cars and accounted as defined contribution plans.
The following table details the benefit obligation and plan assets for the schemes operated by Ford Motor Company and Volvo Cars in which the Company employees participate. As the Company employees typically are a minority in each scheme, the number of current Company employees participating is shown relative to the total number of current employees participating, to give an indication of materiality.
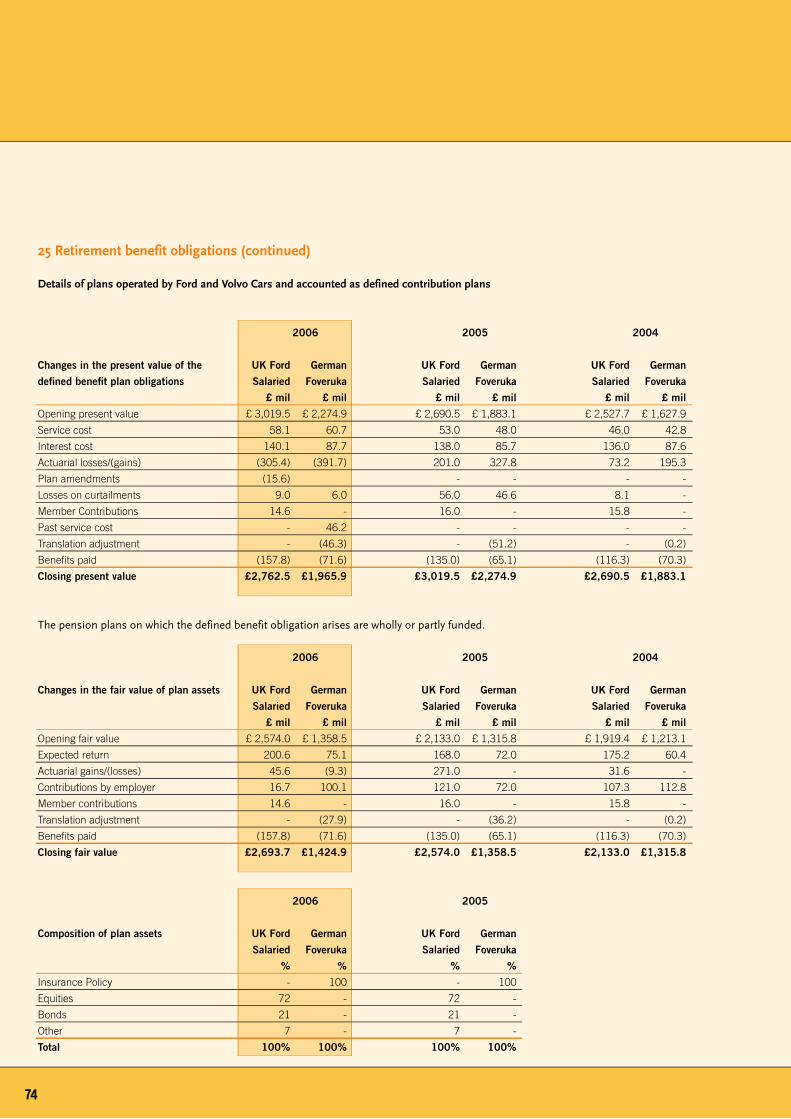
7�
Details of plans operated by Ford and Volvo Cars and accounted as defined contribution plans
2006 2005 2004
Changes in the present value of the UK Ford German UK Ford German UK Ford German
defi ned benefi t plan obligations Salaried Foveruka Salaried Foveruka Salaried Foveruka
£ mil £ mil £ mil £ mil £ mil £ mil
Opening present value £ 3,019.5 £ 2,274.9 £ 2,690.5 £ 1,883.1 £ 2,527.7 £ 1,627.9
Service cost 58.1 60.7 53.0 48.0 46.0 42.8
Interest cost 140.1 87.7 138.0 85.7 136.0 87.6
Actuarial losses/(gains) (305.4) (391.7) 201.0 327.8 73.2 195.3
Plan amendments (15.6) - - - -
Losses on curtailments 9.0 6.0 56.0 46.6 8.1 -
Member Contributions 14.6 - 16.0 - 15.8 -
Past service cost - 46.2 - - - -
Translation adjustment - (46.3) - (51.2) - (0.2)
Benefi ts paid (157.8) (71.6) (135.0) (65.1) (116.3) (70.3)
Closing present value £2,762.5 £1,965.9 £3,019.5 £2,274.9 £2,690.5 £1,883.1
The pension plans on which the defined benefit obligation arises are wholly or partly funded.
2006 2005 2004
Changes in the fair value of plan assets UK Ford German UK Ford German UK Ford German
Salaried Foveruka Salaried Foveruka Salaried Foveruka
£ mil £ mil £ mil £ mil £ mil £ mil
Opening fair value £ 2,574.0 £ 1,358.5 £ 2,133.0 £ 1,315.8 £ 1,919.4 £ 1,213.1
Expected return 200.6 75.1 168.0 72.0 175.2 60.4
Actuarial gains/(losses) 45.6 (9.3) 271.0 - 31.6 -
Contributions by employer 16.7 100.1 121.0 72.0 107.3 112.8
Member contributions 14.6 - 16.0 - 15.8 -
Translation adjustment - (27.9) - (36.2) - (0.2)
Benefi ts paid (157.8) (71.6) (135.0) (65.1) (116.3) (70.3)
Closing fair value £2,693.7 £1,424.9 £2,574.0 £1,358.5 £2,133.0 £1,315.8
2006 2005
Composition of plan assets UK Ford German UK Ford German
Salaried Foveruka Salaried Foveruka
% % % %
Insurance Policy - 100 - 100
Equities 72 - 72 -
Bonds 21 - 21 -
Other 7 - 7 -
Total 100% 100% 100% 100%
25 Retirement benefit obligations (continued)

Notes to the financial statements
FCE Bank plc – ANNUAL REPORT AND ACCOUNTS – 2006 75
2006 2005
Principal Actuarial Assumptions UK Ford German UK Ford German
at the Balance Sheet Date Salaried Foveruka Salaried Foveruka
% % % %
Discount rate 5.00 4.75 4.75 4.00
Expected rate of return on plan assets 8.00 4.75 8.00 5.50
Future salary increases 4.00 3.00 4.00 3.50
Future pension increases 2.50 2.00 2.50 2.00
Future pension increases (discretionary) - - 1.90 -
The average life expectancy in years of a pensioner retiring at age 65 on the balance sheet date is as follows: Years Years Years Years
Male 18.5 18.2 18.4 18.1
Female 21.7 22.4 21.6 22.2
The average life expectancy in years of a pensioner retiring at age 65, 20 years after the balance sheet date is as follows: Years Years Years Years
Male 19.2 21.0 19.2 25.9
Female 22.4 25.0 22.3 24.9
In some locations FCE employees are members of insured schemes, where contributions are made to an insurance company. In the Company’s French branch a balance sheet reserve of £295,000 (2005: £255,000) is held for employees at management level and above. A summary of the defined contribution plans is given in the table below.
Details of defined contribution plans in which FCE participates
Company Group
2006 2005 2006 2005
Contribution paid in year £’000’s £’000’s £’000’s £’000’s
Location Scheme
Austria Insured £ 100 £ (77) £ 100 £ (77)
Denmark Insured 142 128 142 128
Finland Insured 129 180 129 180
VCF Finland Insured - - 147 156
France Balance sheet reserve 45 271 45 271
Italy State 1,636 1,525 1,636 1,525
Norway Insured 78 64 78 64
Spain Insured 65 69 65 69
Sweden State 50 62 50 62
Total contributions paid £2,245 £2,222 £2,392 £2,378
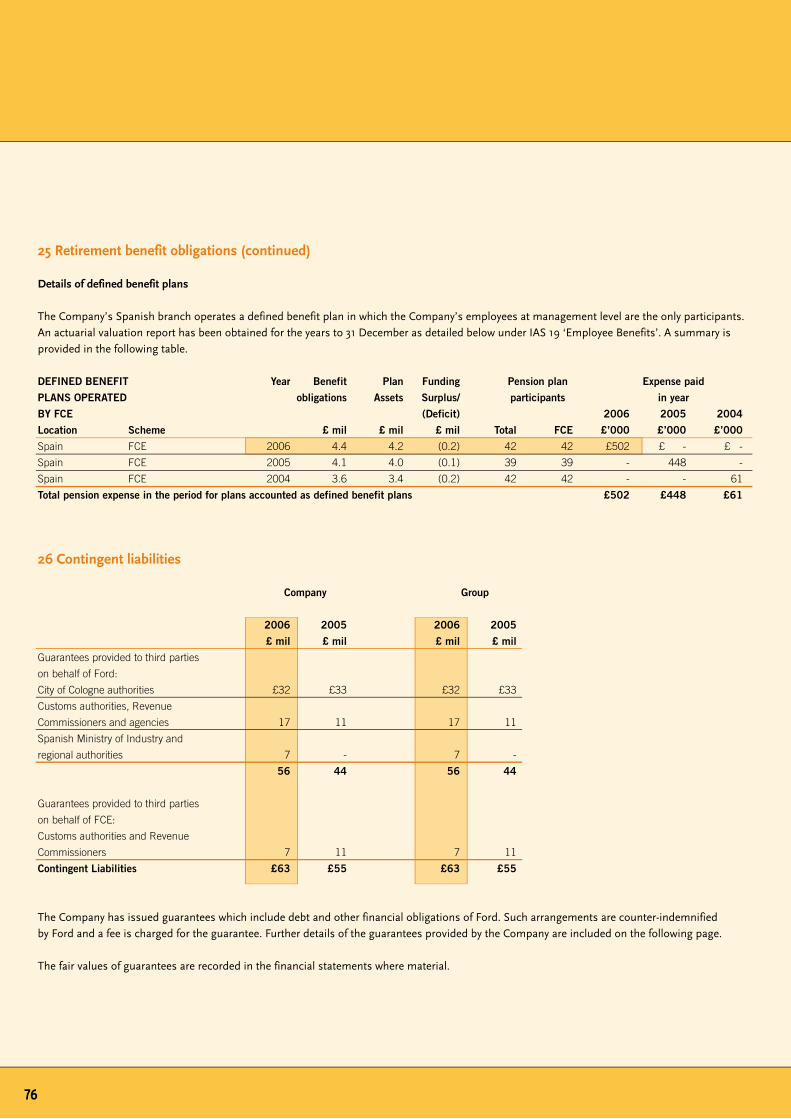
26 Contingent liabilities
Company Group
2006 2005 2006 2005
£ mil £ mil £ mil £ mil
Guarantees provided to third parties
on behalf of Ford:
City of Cologne authorities £32 £33 £32 £33
Customs authorities, Revenue
Commissioners and agencies 17 11 17 11
Spanish Ministry of Industry and
regional authorities 7 - 7 -
56 44 56 44
Guarantees provided to third parties
on behalf of FCE:
Customs authorities and Revenue
Commissioners 7 11 7 11
Contingent Liabilities £63 £55 £63 £55
The Company has issued guarantees which include debt and other financial obligations of Ford. Such arrangements are counter-indemnified by Ford and a fee is charged for the guarantee. Further details of the guarantees provided by the Company are included on the following page.
The fair values of guarantees are recorded in the financial statements where material.
76
25 Retirement benefit obligations (continued)
Details of defined benefit plans
The Company’s Spanish branch operates a defined benefit plan in which the Company’s employees at management level are the only participants. An actuarial valuation report has been obtained for the years to 31 December as detailed below under IAS 19 ‘Employee Benefits’. A summary is provided in the following table.
DEFINED BENEFIT Year Benefit Plan Funding Pension plan Expense paid
PLANS OPERATED obligations Assets Surplus/ participants in year
BY FCE (Deficit) 2006 2005 2004
Location Scheme £ mil £ mil £ mil Total FCE £’000 £’000 £’000
Spain FCE 2006 4.4 4.2 (0.2) 42 42 £502 £ - £ -
Spain FCE 2005 4.1 4.0 (0.1) 39 39 - 448 -
Spain FCE 2004 3.6 3.4 (0.2) 42 42 - - 61
Total pension expense in the period for plans accounted as defined benefit plans £502 £448 £61

Notes to the financial statements
FCE Bank plc – ANNUAL REPORT AND ACCOUNTS – 2006 77
Guarantees provided by the Company are for:• Suspended trade tax payments to the City of Cologne authorities on behalf of Ford Werke GmbH. This guarantee was issued in December 2004 and
is extended each year until notice of termination is provided by FCE.• Duties and registration taxes on imported vehicles and components provided to various European Customs Authorities, Revenue Commissioners
and agencies (including the UK Driver and Vehicle Licensing Agency) on behalf of Ford and FCE.• Loans granted for investment in the Valencia plant on behalf of Ford Espana SL provided to the Spanish Ministry of Industry and regional
authorities.
Litigation and ClaimsCertain legal actions and claims are pending or may be instituted or asserted in the future against FCE concerning finance and other contractual relationships. Litigation is subject to many uncertainties, and the outcome of individual litigated matters is not predictable with assurance. FCE has established provisions for certain of the legal actions and claims where losses are deemed probable and reasonably estimable. It is reasonably possible that certain claims for which accruals have not been established could be decided unfavourably to FCE and could require FCE to pay damages or make other expenditures in amounts or a range of amounts that cannot be estimated at 31 December 2006. We do not reasonably expect, based on our analysis, that such matters would have a material effect on future financial statements for a particular year, although such an outcome is possible.
27 Commitments
The table below details the undrawn portion of commitments to lend. The Company extends commercial credit primarily to vehicle dealers in the form of approved lines of credit to purchase inventories of new and used vehicles. In addition there is a commitment to lend to Company subsidiaries as detailed below. Company Group
2006 2005 2006 2005
£ mil £ mil £ mil £ mil
Less than 1 year maturity £116 £54 £116 £54
1 year or over maturity - 2 - 2
Commitments £116 £56 £116 £56
The Company has commitments to lend with its Polish subsidiaries FCE Bank Polska S.A. and FCE Credit Polska S.A. which are reported in Note 34 ‘Related party transactions’.
28 Future lease commitments
Company Group
2006 2005 2006 2005
The future minimum lease payments under
non cancellable operating leases are as follows: £ mil £ mil £ mil £ mil
Not later than one year £ 8 £ 9 £ 8 £ 9
Later than one year and not later than fi ve years 11 14 11 14
Later than fi ve years - 1 - 1
Future lease commitments £19 £24 £19 £24
These amounts include rental commitments for certain buildings, machinery and equipment.

29 Vehicle residual values
The following vehicle residual values are included in loans and advances to customers and property, plant and equipment in the balance sheet.
Company
Year in which the residual Retail residual Finance lease Operating lease 2006 2005
value will be recovered values residual values residual values Total Total
£ mil £ mil £ mil £ mil £ mil
Within 1 year £ 357 £ 41 £ 157 £ 555 £ 481
Between 1-2 years 457 50 8 515 533
Between 2-5 years 425 44 1 470 397
More than 5 years - - - - -
Total £1,239 £135 £166 £1,540 £1,411
Group
Year in which the residual Retail residual Finance lease Operating lease 2006 2005
value will be recovered values residual values residual values Total Total
£ mil £ mil £ mil £ mil £ mil
Within 1 year £ 357 £ 41 £ 161 £ 559 £ 487
Between 1-2 years 457 50 13 520 540
Between 2-5 years 425 44 6 475 403
More than 5 years - - - - -
Total £1, 239 £135 £180 £1,554 £1,430
FCE is exposed to residual risk on certain retail or finance lease balloon payment products where the customer may return the financed vehicle to FCE if the market value is less than the Minimum Guaranteed Future Value. The overall return rate for retail finance plans is currently less than 3 per cent. As the above figures assume that all such vehicles will be returned the figures are likely to overstate exposure to residual value risk. For an additional discussion of residual risk on operating leases, refer to Note 16 ‘Property and equipment’ and Accounting Policy U ‘Critical accounting estimates’.
Residual risk is the possibility that the amount FCE obtain from returned vehicles will be less than our estimate of the expected residual value for the vehicle.
30 Ordinary shares and share premium
Company and Group
2006 2005
Authorised at 1 January and 31 December: £ mil £ mil
769,926,202 Ordinary shares of £1 each (2005: 769,926,202) £ 770 £ 770
230,073,798 Non Cumulative convertible preference shares 230 230
£1 each (2005: 230,073,798)
Total £1,000 £1,000
Allotted, called up and fully paid at 1 January & 31 December:
614,384,050 Ordinary shares of £1 each (2005: 614,384,050) £ 614 £ 614
Share premium at 1 January and 31 December: £ 352 £ 352
There was no change to the issued share capital of the Company during the year. The share premium account is regarded as permanent capital of the Company and is not available for distribution. No director, officer or employee owns or holds shares or owns or holds options over shares in the Company or its subsidiaries.
7�

Notes to the financial statements
FCE Bank plc – ANNUAL REPORT AND ACCOUNTS – 2006 7�
Support AgreementPursuant to a support agreement between FMCC and the Company dated 30 September 2004, FMCC has agreed to maintain, directly or indirectly, a controlling interest of not less than 75% of the issued share capital of the Company and to maintain or procure the maintenance of the Company’s net worth of not less than US$ 500 million initially until 31 January 2010.
However as neither party provided written notice on 1 February 2006 or 1 February 2007 the termination date was automatically extended each time by one year and now is 31 January 2013. The agreement provides for the termination date to be extended automatically on February 1 of each year for an additional one-year period ending on 31 January of the following year. Either party can give notice one month before automatic extension of their wish to prevent the automatic extension of the termination date and terminate the agreement in which case it will terminate as of the termination date set on the last preceding extension date.
31 Retained earnings and other reserves
Profi t and Translation Total retained Other Total
loss reserve reserve earnings reserves
2006 2005 2006 2005 2006 2005 2006 2005 2006 2005
Company £ mil £ mil £ mil £ mil £ mil £ mil £ mil £ mil £ mil £ mil
Restated* Restated* Restated*
At 1 January: £1,245 £1,021 £(17) £ (2) £1,228 £1,019 £- £(7) £1,228 £1,012
Profi t for the fi nancial year 218 196 - - 218 196 - - 218 196
Capital contribution 38 28 - - 38 28 - - 38 28
Cash fl ow hedges fair value
adjustment gain/(loss) - - - - - - - 7 - 7
Currency translation differences - - (30) (15) (30) (15) - - (30) (15)
At 31 December £1,501 £1,245 £(47) £(17) £1,454 £1,228 £- £ - £1,454 £1,228
Profi t and Translation Total retained Other Total
loss reserve reserve earnings reserves
2006 2005 2006 2005 2006 2005 2006 2005 2006 2005
Group £ mil £ mil £ mil £ mil £ mil £ mil £ mil £ mil £ mil £ mil
Restated* Restated* Restated*
At 1 January: £1,156 £ 894 £(14) £ 3 £1,142 £ 897 £- £(7) £1,142 £ 890
Profi t for the fi nancial year 231 234 - - 231 234 - - 231 234
Capital contribution 38 28 - - 38 28 - - 38 28
Cash fl ow hedges fair value
adjustment gain/(loss) - - - - - - - 7 - 7
Currency translation differences - - (30) (17) (30) (17) - - (30) (17)
At 31 December £1,425 £1,156 £(44) £(14) £1,381 £1,142 £- £ - £1,381 £1,142
* Refer to page 31 Accounting Policy A for details of 2005 restated figures
In December 2006 the Company received a capital contribution of £38,400,000 (2005: £27,803,382) or US$ 75 million (2005 US$ 49 million) from FCI to be used solely to make a payment to Jaguar Cars Limited in return for use of Group tax relief.

�0
32 Total shareholders’ equity
Share Share Retained Other Total
Company capital premium earnings reserves
£ mil £ mil £ mil £ mil £ mil
Notes 30 30 31 31 Restated*
Balance at 1 January 2005 30/31 £614 £352 £1,019 £(7) £1,978
Cash fl ow hedges fair value gains 7 - - - 7 7
Currency translation differences 31 - - (15) (15)
Net gains/(losses) not recognised
in the income statement: - - (15) 7 (8)
Capital contribution 31 - - 28 - 28
Net profi t 31 - - 196 - 196
Balance at 31 December 2005/
1 January 2006 30/31 £614 £352 £1,228 £ - £2,194
Currency translation differences 31 - - (30) - (30)
Net gains/(losses) not recognised
in the income statement: - - (30) - (30)
Capital contribution 31 - - 38 - 38
Net profi t 31 - - 218 - 218
Balance at 31 December 2006 30/31 £614 £352 £1,454 £ - £2,420
Share Share Retained Other Total
Group capital premium earnings reserves
£ mil £ mil £ mil £ mil £ mil
Notes 30 30 31 31 Restated*
Balance at 1 January 2005 30/31 £614 £352 £ 897 £(7) £1,856
Cash flow hedges fair value gains 7 - - - 7 7
Currency translation differences 31 - - (17) - (17)
Net gains/(losses) not recognised
in the income statement - - (17) 7 (10)
Capital contribution 31 - - 28 - 28
Net profit 31 - - 234 - 234
Balance at 31 December 2005/
1 January 2006 30/31 £614 £352 £1,142 £ - £2,108
Currency translation differences 31 - - (30) - (30)
Net gains/(losses) not recognised
in the income statement - - (30) - (30)
Capital contribution 31 - - 38 - 38
Net profit 31 - - 231 - 231
Balance at 31 December 2006 30/31 £614 £352 £1,381 £ - £2,347
* Refer to page 31 Accounting Policy A for details of 2005 restated figures

Notes to the financial statements
33 Dividend per share
Final dividends are not accounted for until they have been approved at the Annual General Meeting. The directors have not declared any dividends during 2006 (2005: none).
34 Related party transactions
Parties are considered to be related if one party has the ability to control the other party or exercise significant influence over the other party in making financial or operational decisions.
A number of transactions are entered into with related parties in the normal course of business. The Company and its subsidiaries are separate, legally distinct companies from Ford and Ford’s automotive affiliates and transactions are carried out on commercial terms and at market rates and enforced by FCE in a commercially reasonable manner. In addition to participating in retirement benefit plans sponsored by Ford and Volvo (discussed in Note 25); the Company has a support agreement with FMCC in regard to Shareholders’ funds (detailed in Note 30).
FCE has reported related party transactions within the following categories:• Directors and officers – reported in Note 6 ‘Other operating expenses’,• Subsidiaries of the Company – as detailed in Note 14 ‘Investments in
group undertakings’,• Parent undertakings – this includes FCI, FMCC and Ford. For further
information refer to Note 43 ‘Other information’,
• Entities under common control – which includes all subsidiaries of Ford except for those entities already reported within ‘Subsidiaries of the Company’ and ‘parent undertakings’. Transactions reported in this category include:- Whereby the Company extends approved lines of credit, mortgages, working capital and other types of loans which mainly relates to automotive partner vehicle dealers in which Ford Motor Company maintains a controlling financial interest.
- The receipt of interest income from Ford and its related companies arising from loans, interest supplements and other support costs in regard to a variety of retail and wholesale finance plans.
- Guarantees provided on behalf of other related parties of which further details can be found in Note 26 ‘Contingent liabilities’.
- Guarantees received from other related parties in relating mainly to vehicle wholesale finance plans.
FCE Bank plc – ANNUAL REPORT AND ACCOUNTS – 2006 �1
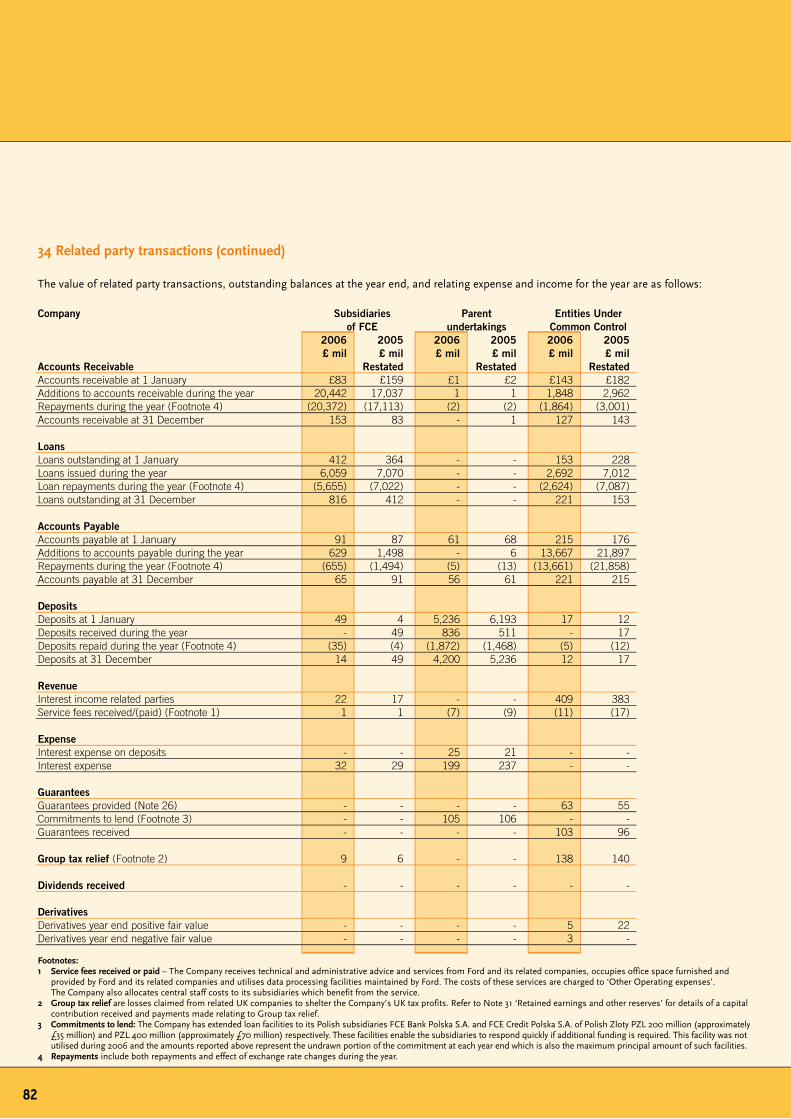
34 Related party transactions (continued)
The value of related party transactions, outstanding balances at the year end, and relating expense and income for the year are as follows:
Company Subsidiaries Parent Entities Under of FCE undertakings Common Control 2006 2005 2006 2005 2006 2005 £ mil £ mil £ mil £ mil £ mil £ milAccounts Receivable Restated Restated RestatedAccounts receivable at 1 January £83 £159 £1 £2 £143 £182Additions to accounts receivable during the year 20,442 17,037 1 1 1,848 2,962Repayments during the year (Footnote 4) (20,372) (17,113) (2) (2) (1,864) (3,001)Accounts receivable at 31 December 153 83 - 1 127 143
LoansLoans outstanding at 1 January 412 364 - - 153 228Loans issued during the year 6,059 7,070 - - 2,692 7,012Loan repayments during the year (Footnote 4) (5,655) (7,022) - - (2,624) (7,087)Loans outstanding at 31 December 816 412 - - 221 153
Accounts PayableAccounts payable at 1 January 91 87 61 68 215 176Additions to accounts payable during the year 629 1,498 - 6 13,667 21,897Repayments during the year (Footnote 4) (655) (1,494) (5) (13) (13,661) (21,858)Accounts payable at 31 December 65 91 56 61 221 215
DepositsDeposits at 1 January 49 4 5,236 6,193 17 12Deposits received during the year - 49 836 511 - 17Deposits repaid during the year (Footnote 4) (35) (4) (1,872) (1,468) (5) (12)Deposits at 31 December 14 49 4,200 5,236 12 17
RevenueInterest income related parties 22 17 - - 409 383Service fees received/(paid) (Footnote 1) 1 1 (7) (9) (11) (17)
ExpenseInterest expense on deposits - - 25 21 - -Interest expense 32 29 199 237 - -
GuaranteesGuarantees provided (Note 26) - - - - 63 55Commitments to lend (Footnote 3) - - 105 106 - -Guarantees received - - - - 103 96
Group tax relief (Footnote 2) 9 6 - - 138 140
Dividends received - - - - - -
DerivativesDerivatives year end positive fair value - - - - 5 22Derivatives year end negative fair value - - - - 3 -
Footnotes:1 Service fees received or paid – The Company receives technical and administrative advice and services from Ford and its related companies, occupies office space furnished and
provided by Ford and its related companies and utilises data processing facilities maintained by Ford. The costs of these services are charged to ‘Other Operating expenses’. The Company also allocates central staff costs to its subsidiaries which benefit from the service.
2 Group tax relief are losses claimed from related UK companies to shelter the Company’s UK tax profits. Refer to Note 31 ‘Retained earnings and other reserves’ for details of a capital contribution received and payments made relating to Group tax relief.
3 Commitments to lend: The Company has extended loan facilities to its Polish subsidiaries FCE Bank Polska S.A. and FCE Credit Polska S.A. of Polish Zloty PZL 200 million (approximately £35 million) and PZL 400 million (approximately £70 million) respectively. These facilities enable the subsidiaries to respond quickly if additional funding is required. This facility was not utilised during 2006 and the amounts reported above represent the undrawn portion of the commitment at each year end which is also the maximum principal amount of such facilities.
4 Repayments include both repayments and effect of exchange rate changes during the year.
�2

Notes to the financial statements
The value of related party transactions, outstanding balances at the year end, and relating expense and income for the year are as follows:
Group Parent Entities Under undertakings Common Control 2006 2005 2006 2005 £ mil £ mil £ mil £ milAccounts Receivable Restated RestatedAccounts receivable at 1 January £1 £2 £146 £182Additions to accounts receivable during the year 1 1 1,860 2,974Repayments of accounts receivable during the year (Footnote 3) (2) (2) (1,878) (3,010)Accounts receivable at 31 December - 1 128 146
LoansLoans outstanding at 1 January - - 153 228Loans issued during the year - - 2,692 7,012Loan repayments during the year (Footnote 3) - - (2,624) (7,087)Loans outstanding at 31 December - - 221 153
Accounts PayableAccounts payable at 1 January 62 68 215 188Additions to accounts payable during the year - 6 14,242 22,380Repayments of accounts payable during the year (Footnote 3) (6) (12) (14,227) (22,353)Accounts payable at 31 December 56 62 230 215
DepositsDeposits at 1 January 5,236 6,193 17 12Deposits received during the year 836 511 - 17Deposits repaid during the year (Footnote 3) (1,872) (1,468) (5) (12)Deposits at 31 December 4,200 5,236 12 17
RevenueInterest income - - 419 394Service fees received/paid (Footnote 1) (7) (9) (11) (18)
ExpenseInterest expense on deposits 25 21 - -Interest expense 199 237 1 -
GuaranteesGuarantees provided (Note 26) - - 63 55Guarantees received - - 103 96
Group tax relief (Footnote 2) - - 138 140
Dividend received (Note 4) - - - 1
DerivativesDerivatives year end positive fair value - - 5 22Derivatives year end negative fair value - - 3 -
Footnotes:1 Service fees received or paid – FCE receives technical and administrative advice and services from Ford and its related companies, occupies office space furnished and provided by
Ford and its related companies and utilises data processing facilities maintained by Ford. The costs of these services are charged to ‘Other operating expenses’.2 Group tax relief are losses claimed from related UK companies to shelter FCE’s UK tax profits. Refer to Note 31 ‘Retained earnings and other reserves’ for details of a capital
contribution received and payments made relating to Group tax relief.3 Repayments include both repayments and effect of exchange rate changes during the year.
FCE Bank plc – ANNUAL REPORT AND ACCOUNTS – 2006 �3
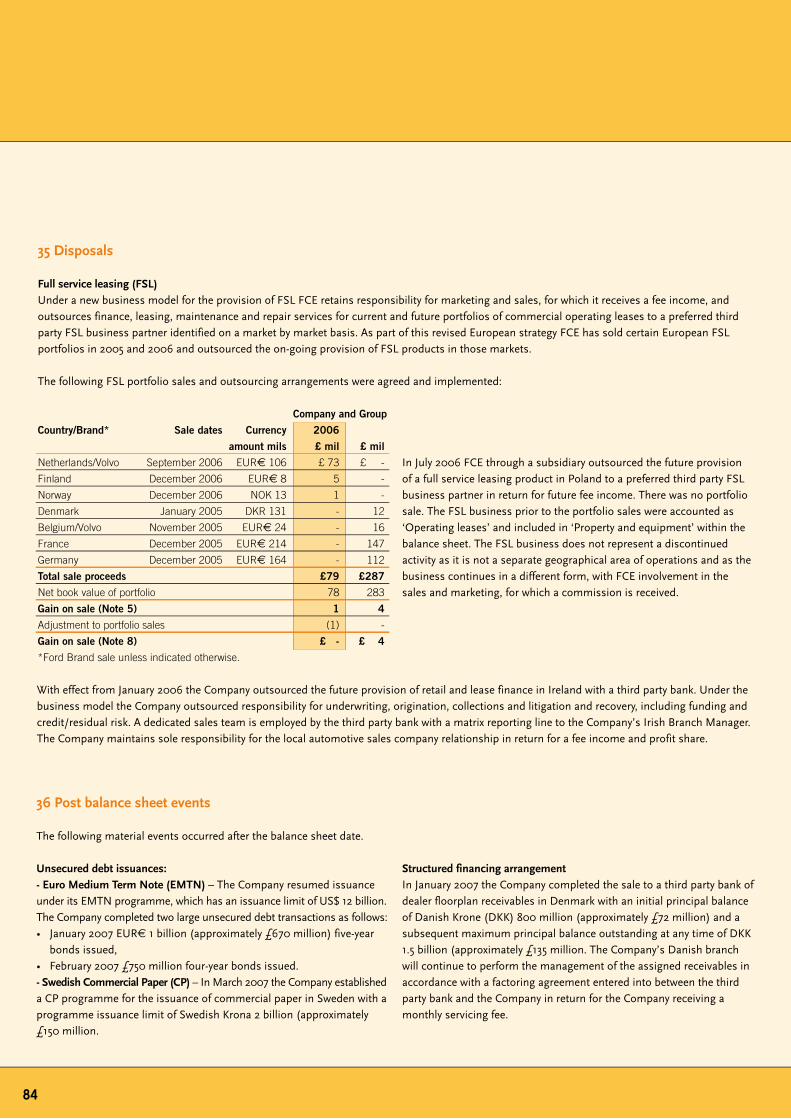
35 Disposals
Full service leasing (FSL)Under a new business model for the provision of FSL FCE retains responsibility for marketing and sales, for which it receives a fee income, and outsources finance, leasing, maintenance and repair services for current and future portfolios of commercial operating leases to a preferred third party FSL business partner identified on a market by market basis. As part of this revised European strategy FCE has sold certain European FSL portfolios in 2005 and 2006 and outsourced the on-going provision of FSL products in those markets.
The following FSL portfolio sales and outsourcing arrangements were agreed and implemented:
Company and Group
Country/Brand* Sale dates Currency 2006
amount mils £ mil £ mil
Netherlands/Volvo September 2006 EUR€ 106 £ 73 £ -
Finland December 2006 EUR 8 5 -
Norway December 2006 NOK 13 1 -
Denmark January 2005 DKR 131 - 12
Belgium/Volvo November 2005 EUR€ 24 - 16
France December 2005 EUR€ 214 - 147
Germany December 2005 EUR€ 164 - 112
Total sale proceeds £79 £287
Net book value of portfolio 78 283
Gain on sale (Note 5) 1 4
Adjustment to portfolio sales (1) -
Gain on sale (Note 8) £ - £ 4
*Ford Brand sale unless indicated otherwise.
36 Post balance sheet events
The following material events occurred after the balance sheet date.
Unsecured debt issuances:- Euro Medium Term Note (EMTN) – The Company resumed issuance under its EMTN programme, which has an issuance limit of US$ 12 billion. The Company completed two large unsecured debt transactions as follows:• January 2007 EUR€ 1 billion (approximately £670 million) five-year
bonds issued,• February 2007 £750 million four-year bonds issued.- Swedish Commercial Paper (CP) – In March 2007 the Company established a CP programme for the issuance of commercial paper in Sweden with a programme issuance limit of Swedish Krona 2 billion (approximately £150 million.
Structured financing arrangementIn January 2007 the Company completed the sale to a third party bank of dealer floorplan receivables in Denmark with an initial principal balance of Danish Krone (DKK) 800 million (approximately £72 million) and a subsequent maximum principal balance outstanding at any time of DKK 1.5 billion (approximately £135 million. The Company’s Danish branch will continue to perform the management of the assigned receivables in accordance with a factoring agreement entered into between the third party bank and the Company in return for the Company receiving a monthly servicing fee.
With effect from January 2006 the Company outsourced the future provision of retail and lease finance in Ireland with a third party bank. Under the business model the Company outsourced responsibility for underwriting, origination, collections and litigation and recovery, including funding and credit/residual risk. A dedicated sales team is employed by the third party bank with a matrix reporting line to the Company’s Irish Branch Manager. The Company maintains sole responsibility for the local automotive sales company relationship in return for a fee income and profit share.
��
In July 2006 FCE through a subsidiary outsourced the future provision of a full service leasing product in Poland to a preferred third party FSL business partner in return for future fee income. There was no portfolio sale. The FSL business prior to the portfolio sales were accounted as ‘Operating leases’ and included in ‘Property and equipment’ within the balance sheet. The FSL business does not represent a discontinued activity as it is not a separate geographical area of operations and as the business continues in a different form, with FCE involvement in the sales and marketing, for which a commission is received.

Notes to the financial statements
37 Share-based payments
Cost of providing share options are included in ‘Other reserves’ within shareholders equity (Note 32) over the vesting period. Movements within other reserves relating to share options are detailed below.
Company and Group
2006 2005
£000’s £000’s
At 1 January £138 £(66)
Expensed to profi t and loss account 402 464
Charged by the parent company (234) (260)
At 31 December £306 £138
FCE offers share options which are held over Ford Common Stock to directors and employees. For more details about the various Ford Share Option plans please refer to the annual report of Ford.
The number and weighted average exercise price of share options granted to directors and employees of FCE after 7 November 2002* that had not vested by 1 January 2005* are as follows:
2006 2005
Company / Group Number Average Grant Number Average Grant
of shares Price of shares of shares Price of shares
US$ US$
At 1 January 580,643 $11.58 353,378 $11.05
Granted 244,600 7.83 227,200 12.49
Exercised (13,578) 7.55 (1,551) 7.55
Transfers In 7,111 12.67 26,207 10.02
Transfers Out - - (21,307) 11.01
Terminated (6,000) 11.49 (3,284) 11.33
At 31 December 812,776 $10.53 580,643 $11.58
* Dates stipulated by IFRS 2 ‘Share based payments’
‘Transfers In’ represents share options granted to employees who at the grant date were employees of another subsidiary of Ford Motor Company US and have since transferred to FCE. ‘Transfers Out’ represents share options granted to employees who at the grant date were employees of FCE and have since transferred to another subsidiary of Ford Motor Company US.
The weighted average market share price of options exercised during 2006 was US$ 7.55 and in 2005 US$ 11.51.
Share options outstanding at the end of the year were as follows:
2006 2005
Range of Exercise Prices Weighted Average Number Weighted Average Weighted Average Number Weighted Average
Grant Price of shares Remaining Life Grant Price of shares Remaining Life
US$ US$ Years US$ Years
7.51 – 9.50 $7.74 358,508 8.8 $7.61 130,275 7.2
9.51 – 11.50 10.04 17,068 6.4 10.11 13,668 7.4
11.51 – 13.50 12.86 437,200 7.7 12.81 436,700 8.8
At 31 December 812,776 580,643
FCE Bank plc – ANNUAL REPORT AND ACCOUNTS – 2006 �5

37 Share-based payments (continued)
The estimated fair value of stock options at the time of grant using the Black Scholes pricing model was as follows:
2006 2005
Weighted average fair value per option US$2.07 US$4.44
Dividend yield 4.9% 3.2%
Expected volatility 39.7% 41.9%
Risk-free interest rate 4.9% 4.4%
Expected option term (years) 7 7
The expected volatility is based on the historical volatility over the last seven years.
Performance Stock rights over Ford Motor Company US Common Stock may be awarded to eligible directors. The number and weighted average market share price of awards are as follows:
2006 2005
Number of shares Average Market Number of shares Average Market
Price of shares Price of shares
US$ US$
- - 1,150 $12.49-
�6
38 Currency risk
In addition to operating in the UK the Company operates branches in fifteen other European countries and has subsidiaries in the Czech Republic, Finland (where also it has a branch), Hungary, Poland and the United Kingdom which provide a variety of wholesale, leasing and retail vehicle financing (see Note 14 ‘Investment in group undertakings’). The main overseas operations are in the EU focused in France, Germany, Italy and Spain.
The main operating (or ‘functional’) currencies are therefore Euro and Sterling. As FCE prepares its consolidated financial statements in Sterling, these will be affected by foreign currency exchange rate movements between Euro and Sterling. FCE does not hedge structural foreign currency investments in overseas operations as each investment is considered to be of a long term nature.
FCE’s policy is to minimise exposure to our operating results from changes in currency exchange rates. To meet funding objectives, we borrow in a variety of currencies. We face exposure to currency exchange rates if a mismatch exists between the currency of our receivables and the currency of the debt funding those receivables. When possible, we fund receivables with debt in the same currency, minimising exposure to exchange rate movements. When a different currency is used, we execute foreign currency derivatives to convert substantially all of our foreign currency debt obligations to the local country currency of the receivables.
As a result of this policy, we believe our market risk exposure relating to changes in currency exchange rates is not significant. For additional information on our derivatives, see Note 11 ‘Derivative Financial Instruments’. Controls are in place to limit the size of transactional currency exposures.

Company and Group
Transactional currency exposure (2006)
US Dollar Euro Sterling Other Total
Functional currency of Group operations £ mil £ mil £ mil £ mil £ mil
Euro £ - £ - £ (11) £ - £ (11)
Sterling (1) 14 - 2 15
Other - - - - -
Total £(1) £14 £(11) £2 £ 4
Transactional currency exposure (2005)
US Dollar Euro Sterling Other Total
Functional Currency of Group Operations £ mil £ mil £ mil £ mil £ mil
Euro £ - £ - £ (17) £ - £ (17)
Sterling (18) 35 - 3 20
Other - - (1) - (1)
Total £(18) £35 £(18) £3 £ 2
Notes to the financial statements
The table below shows transactional currency exposures which give rise to the net currency gains and losses recognised in the consolidated income statement. Such exposures comprise the monetary assets and liabilities that are not denominated in the operating (or ‘functional’) currency of the operating unit involved. The exposures shown below are stated net of derivatives used to limit currency risk.
FCE Bank plc – ANNUAL REPORT AND ACCOUNTS – 2006 �7
Company Group
Assets, Liabilities and Shareholders’ equity 2006 2005 2006 2005
£ mil £ mil £ mil £ mil
Assets:
Denominated in sterling £ 4,858 £ 4,842 £ 5,831 £ 4,424
Denominated in currencies other than sterling 12,279 12,630 11,131 13,077
Total Assets 17,137 17,472 16,962 17,501
Liabilities & shareholders’ equity:
Denominated in sterling 4,082 3,202 5,195 4,760
Denominated in currencies other than sterling 13,055 14,270 11,767 12,741
Total Liabilities & shareholders’ equity £17,137 £17,472 £16,962 £17,501
Foreign currency translation exposures arising from FCE’s investments in overseas branches and subsidiaries are detailed below.
Company and Group
Structural currency exposures 2006 2005
£ mil £ mil
Functional currency of operations involved
Euro £ 479 £ 479
Other Non Euro currencies 48 48
Total £527 £527

The sensitivity analysis presented previously assumes a one-percentage point interest rate change to the year-end yield curve that is both instantaneous and parallel. In reality, interest rate changes are rarely instantaneous or parallel and rates could move more or less than the one percentage point assumed in our analysis. As a result, the actual impact to pre-tax net interest income could be higher or lower than the results detailed above.
While the sensitivity analysis presented is our best estimate of the impacts of the specified assumed interest rate scenarios, our actual results could differ from those projected. The model used to conduct this analysis is heavily dependent on assumptions. Embedded in the model are assumptions regarding the reinvestment of maturing asset principal, refinancing of maturing debt, and predicted repayment of retail installment sale and lease contracts ahead of the contract end date. Our repayment projections ahead of contractual maturity are based on historical experience. If interest rates or other factors change, our actual prepayment experience could be different than projected.
Additionally, as noted previously, the sensitivity analysis presented assumes interest rate changes are instantaneous, parallel shifts in the yield curve. In reality, changes are rarely instantaneous or parallel. We have presented our sensitivity analysis in this Report on a pre-tax rather than an after-tax basis, to exclude the potentially distorting impact of assumed tax rates.
Part of the return on financial instruments is obtained from the controlled mismatching of the dates on which the instruments mature or, if earlier, the dates on which interest receivable on assets and interest payable on liabilities are next reset to market rates. The table summarises these repricing mismatches as at 31 December 2006. Items are allocated to time bands by reference to the earlier of the next contractual interest repricing date and the maturity date. Non interest-bearing items are a consideration in the management of interest rate risk, the allocation of which to the time bands is not reflected on the following page.
��
39 Interest rate risk
As a result of FCE’s interest rate risk management processes which utilise hedging derivatives and as some of assets are funded by equity, the total level of assets re-pricing is greater than the level of debt re-pricing. Other things being equal, this means that during a period of rising interest rates, the interest income received on our assets will increase more rapidly than the interest expense paid on our debt, thereby initially increasing our pre-tax net interest income. Correspondingly, during a period of falling interest rates, we would expect our pre-tax net interest income to initially decrease.
To provide a quantitative measure of the sensitivity of our pre-tax net interest income to changes in interest rates, we use interest rate scenarios that assume a hypothetical, instantaneous increase or decrease in interest rates of one percentage point across all maturities (a ‘parallel shift’), as well as a base case that assumes that interest rates remain constant at existing levels. These interest rate scenarios are purely hypothetical and do not represent our view of future interest rate movements. The differences in pre-tax net interest income between these scenarios and the base case over a twelve-month period represent an estimate of the sensitivity of our pre-tax net interest income. This sensitivity as of year-end 2006 and 2005 is detailed as follows:
Pre-Tax Net Interest Income impact Pre-Tax Net Interest Income impact
given a one percentage point given a one percentage point
instantaneous increase in interest rates instantaneous decrease in interest rates
£ mil £ mil
2006 £10.9 £(10.9)
2005 £17.9 £(17.9)

Notes to the financial statements
Company
At 31 December 2006 Non
Interest
0-3 Mths 4-6 Mths 7-12 Mths 1-5 Years 5+ Years Bearing Total
£ mil £ mil £ mil £ mil £ mil £ mil £ mil
Cash and advances to other banks £ 431 £ - £ - £ 9 £ 23 £ 16 £ 479
Loans and advances to customers 6,956 2,002 1,536 4,179 53 (125) 14,601
Other assets 1,215 7 - - - 835 2,057
Total assets £ 8,602 £ 2,009 £ 1,536 £ 4,188 £ 76 £ 726 £ 17,137
Due to other banks £ 1,919 £ 99 £ 18 £ 647 £ - £ - £ 2,683
Due to parent & related undertakings 6,355 425 312 1,272 7 183 8,554
Debt securities in issue 534 684 722 591 - (14) 2,517
Other borrowed funds 392 - - - 72 - 464
Other liabilities 95 1 23 37 1 342 499
Shareholders’ equity - - - - - 2,420 2,420
Total liabilities £ 9,295 £ 1,209 £ 1,075 £ 2,547 £ 80 £ 2,931 £ 17,137
Gap before hedge (693) 800 461 1,641 (4) (2,205) -
Hedge impact 3,225 290 (618) (2,897) - - -
Interest sensitivity gap 2,532 1,090 (157) (1,256) (4) (2,205) -
Cumulative interest sensitivity gap 2,532 3,622 3,465 2,209 2,205 - -
Company
At 31 December 2005 Non
Interest
0-3 Mths 4-6 Mths 7-12 Mths 1-5 Years 5+ Years Bearing Total
£ mil £ mil £ mil £ mil £ mil £ mil £ mil
Restated* Restated*
Cash and advances to banks £ 598 £ - £ - £ - £ - £ 14 £ 612
Loans & advances to customers 5,563 3,739 1,809 3,840 247 ( 118) 15,080
Other assets 369 9 20 218 3 1,161 1,780
Total assets £ 6,530 £ 3,748 £ 1,829 £ 4,058 £ 250 £ 1,057 £ 17,472
Due to other banks £ 2,378 £ 109 £ - £ - £ - £ 2 £ 2,489
Due to parent & related undertakings 4,847 2,136 - 206 - 208 7,397
Debt securities in issue 3,850 - - 299 146 - 4,295
Other borrowed funds 446 74 - - - - 520
Other liabilities 83 7 15 25 - 447 577
Shareholders’ equity - - - - - 2,194 2,194
Total liabilities £ 11,604 £ 2,326 £ 15 £ 530 £ 146 £ 2,851 £ 17,472
Gap before hedge (5,074) 1,422 1,814 3,528 104 (1,794) -
Hedge impact 4,143 (741) (936) (2,466) - - -
Interest sensitivity gap (931) 681 878 1,062 104 (1,794) -
Cumulative interest sensitivity gap (931) (250) 628 1,690 1,794 - -
* Refer to page 31 Accounting Policy A for details of 2005 restated fi gures
FCE Bank plc – ANNUAL REPORT AND ACCOUNTS – 2006 ��

39 Interest rate risk (continued)
�0
Company
Effective Interest Rates
Currency: EURO GBP USD Other
2006 2005 2006 2005 2006 2005 2006 2005
Assets
Cash and advances to banks 1.19% 2.11% 2.94% 4.67% - - 1.25% 0.83%
Loans and advances to customers 6.57% 6.86% 9.14% 8.39% - - 6.91% 5.71%
Liabilities
Due to other banks 3.91% 2.70% 5.59% 4.33% 5.28% - 4.15% 3.34%
Due to parent and related undertakings 5.43% 4.40% 6.45% 6.50% - - - 6.63%
Debt securities in issue 4.51% 3.48% 5.00% 5.36% - 4.87% 4.09% 3.34%
Other borrowed funds 4.39% 3.47% - - 6.29% 4.05% - -
Group
At 31 December 2006 Non
Interest
0-3 Mths 4-6 Mths 7-12 Mths 1-5 Years 5+ Years Bearing Total
£ mil £ mil £ mil £ mil £ mil £ mil £ mil
Cash and advances to other banks £ 1,020 £ - £ - £ 74 £ 23 £ 16 £ 1,133
Loans and advances to customers 7,088 2,018 1,568 4,267 53 (126) 14,868
Other assets 331 15 10 3 - 602 961
Total assets £ 8,439 £ 2,033 £ 1,578 £ 4,344 £ 76 £ 492 £ 16,962
Due to other banks £ 4,218 £ 517 £ 325 £ 1,605 £ 4 £ - £ 6,669
Due to parent & related undertakings 3,793 - - - - 199 3,992
Debt securities in issue 653 694 741 884 - (10) 2,962
Other borrowed funds 392 - - - 72 - 464
Other liabilities 106 1 23 38 1 3 59 528
Shareholders’ equity - - - - - 2,347 2,347
Total liabilities £ 9,162 £ 1,212 £ 1,089 £ 2,527 £ 77 £ 2,895 £ 16,962
Gap before hedge (723) 821 489 1,817 (1) (2,403) -
Hedge impact 2,215 540 (157) (2,598) - - -
Interest sensitivity gap 1,492 1,361 332 (781) (1) (2,403) -
Cumulative interest sensitivity gap 1,492 2,853 3,185 2,404 2,403 - -
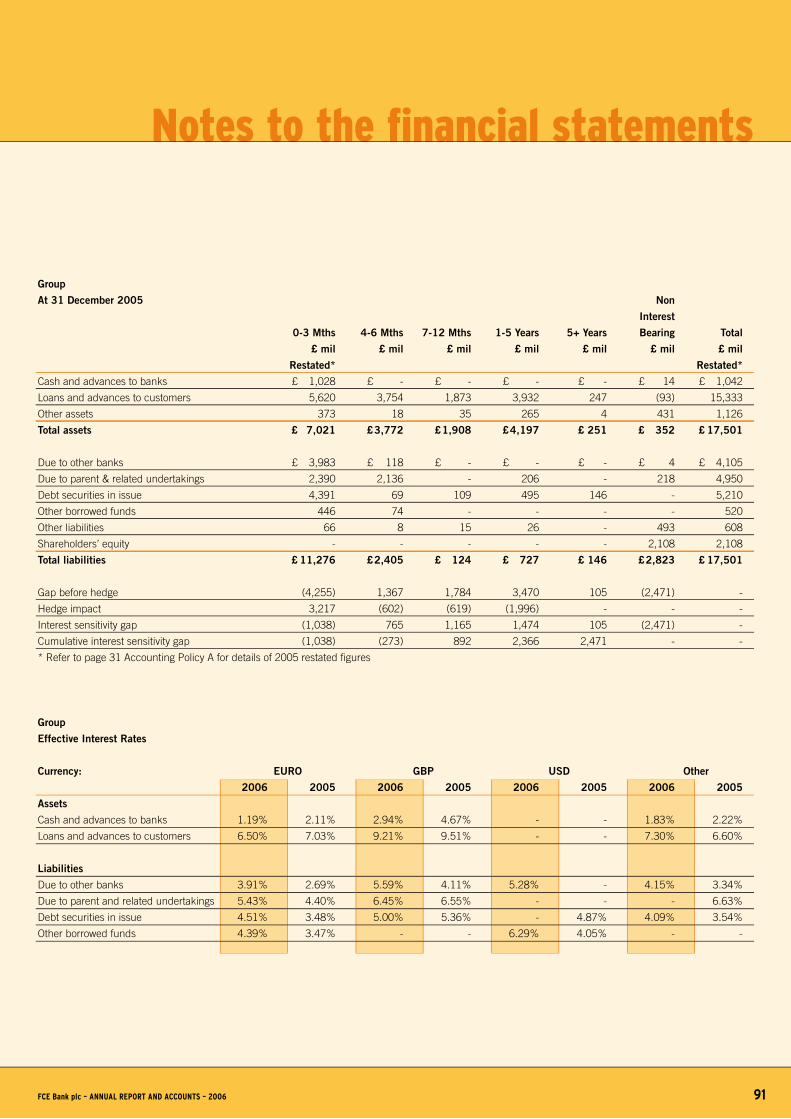
Notes to the financial statements
Group
At 31 December 2005 Non
Interest
0-3 Mths 4-6 Mths 7-12 Mths 1-5 Years 5+ Years Bearing Total
£ mil £ mil £ mil £ mil £ mil £ mil £ mil
Restated* Restated*
Cash and advances to banks £ 1,028 £ - £ - £ - £ - £ 14 £ 1,042
Loans and advances to customers 5,620 3,754 1,873 3,932 247 (93) 15,333
Other assets 373 18 35 265 4 431 1,126
Total assets £ 7,021 £ 3,772 £ 1,908 £ 4,197 £ 251 £ 352 £ 17,501
Due to other banks £ 3,983 £ 118 £ - £ - £ - £ 4 £ 4,105
Due to parent & related undertakings 2,390 2,136 - 206 - 218 4,950
Debt securities in issue 4,391 69 109 495 146 - 5,210
Other borrowed funds 446 74 - - - - 520
Other liabilities 66 8 15 26 - 493 608
Shareholders’ equity - - - - - 2,108 2,108
Total liabilities £ 11,276 £ 2,405 £ 124 £ 727 £ 146 £ 2,823 £ 17,501
Gap before hedge (4,255) 1,367 1,784 3,470 105 (2,471) -
Hedge impact 3,217 (602) (619) (1,996) - - -
Interest sensitivity gap (1,038) 765 1,165 1,474 105 (2,471) -
Cumulative interest sensitivity gap (1,038) (273) 892 2,366 2,471 - -
* Refer to page 31 Accounting Policy A for details of 2005 restated fi gures
Group
Effective Interest Rates
Currency: EURO GBP USD Other
2006 2005 2006 2005 2006 2005 2006 2005
Assets
Cash and advances to banks 1.19% 2.11% 2.94% 4.67% - - 1.83% 2.22%
Loans and advances to customers 6.50% 7.03% 9.21% 9.51% - - 7.30% 6.60%
Liabilities
Due to other banks 3.91% 2.69% 5.59% 4.11% 5.28% - 4.15% 3.34%
Due to parent and related undertakings 5.43% 4.40% 6.45% 6.55% - - - 6.63%
Debt securities in issue 4.51% 3.48% 5.00% 5.36% - 4.87% 4.09% 3.54%
Other borrowed funds 4.39% 3.47% - - 6.29% 4.05% - -
FCE Bank plc – ANNUAL REPORT AND ACCOUNTS – 2006 �1
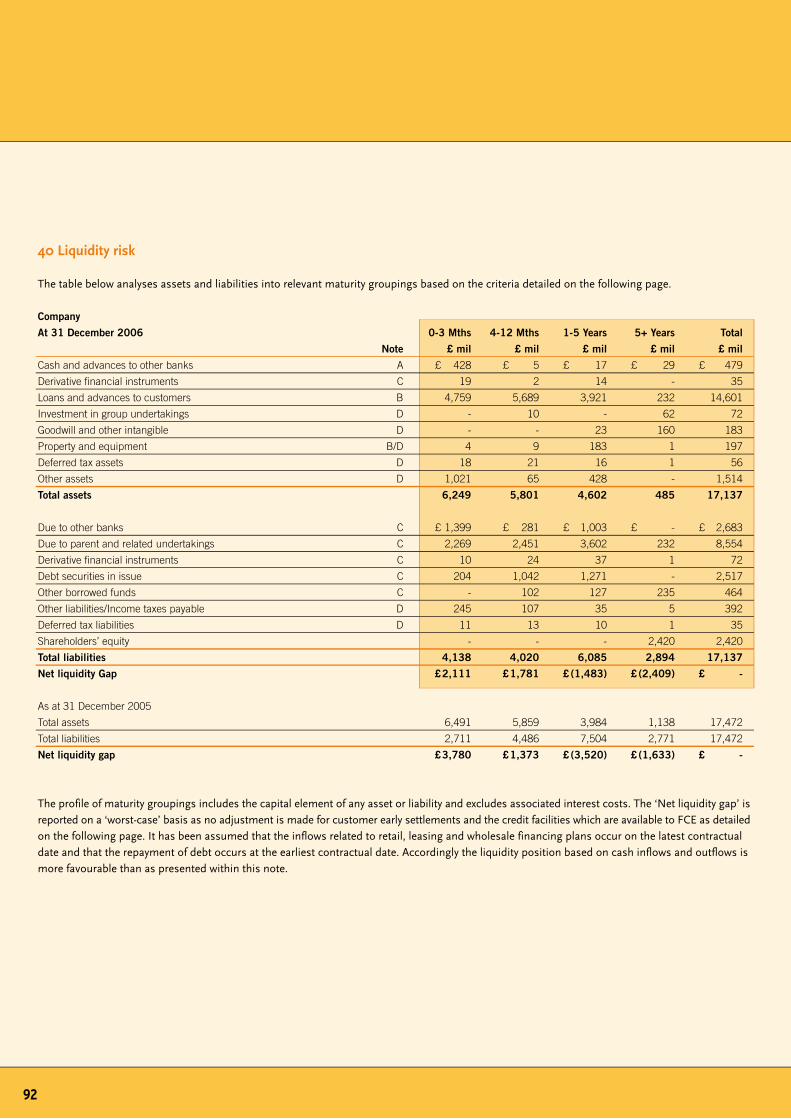
�2
40 Liquidity risk
The table below analyses assets and liabilities into relevant maturity groupings based on the criteria detailed on the following page.
Company
At 31 December 2006 0-3 Mths 4-12 Mths 1-5 Years 5+ Years Total
Note £ mil £ mil £ mil £ mil £ mil
Cash and advances to other banks A £ 428 £ 5 £ 17 £ 29 £ 479
Derivative financial instruments C 19 2 14 - 35
Loans and advances to customers B 4,759 5,689 3,921 232 14,601
Investment in group undertakings D - 10 - 62 72
Goodwill and other intangible D - - 23 160 183
Property and equipment B/D 4 9 183 1 197
Deferred tax assets D 18 21 16 1 56
Other assets D 1,021 65 428 - 1,514
Total assets 6,249 5,801 4,602 485 17,137
Due to other banks C £ 1,399 £ 281 £ 1,003 £ - £ 2,683
Due to parent and related undertakings C 2,269 2,451 3,602 232 8,554
Derivative financial instruments C 10 24 37 1 72
Debt securities in issue C 204 1,042 1,271 - 2,517
Other borrowed funds C - 102 127 235 464
Other liabilities/Income taxes payable D 245 107 35 5 392
Deferred tax liabilities D 11 13 10 1 35
Shareholders’ equity - - - 2,420 2,420
Total liabilities 4,138 4,020 6,085 2,894 17,137
Net liquidity Gap £ 2,111 £ 1,781 £ (1,483) £ (2,409) £ -
As at 31 December 2005
Total assets 6,491 5,859 3,984 1,138 17,472
Total liabilities 2,711 4,486 7,504 2,771 17,472
Net liquidity gap £ 3,780 £ 1,373 £ (3,520) £ (1,633) £ -
The profile of maturity groupings includes the capital element of any asset or liability and excludes associated interest costs. The ‘Net liquidity gap’ is reported on a ‘worst-case’ basis as no adjustment is made for customer early settlements and the credit facilities which are available to FCE as detailed on the following page. It has been assumed that the inflows related to retail, leasing and wholesale financing plans occur on the latest contractual date and that the repayment of debt occurs at the earliest contractual date. Accordingly the liquidity position based on cash inflows and outflows is more favourable than as presented within this note.
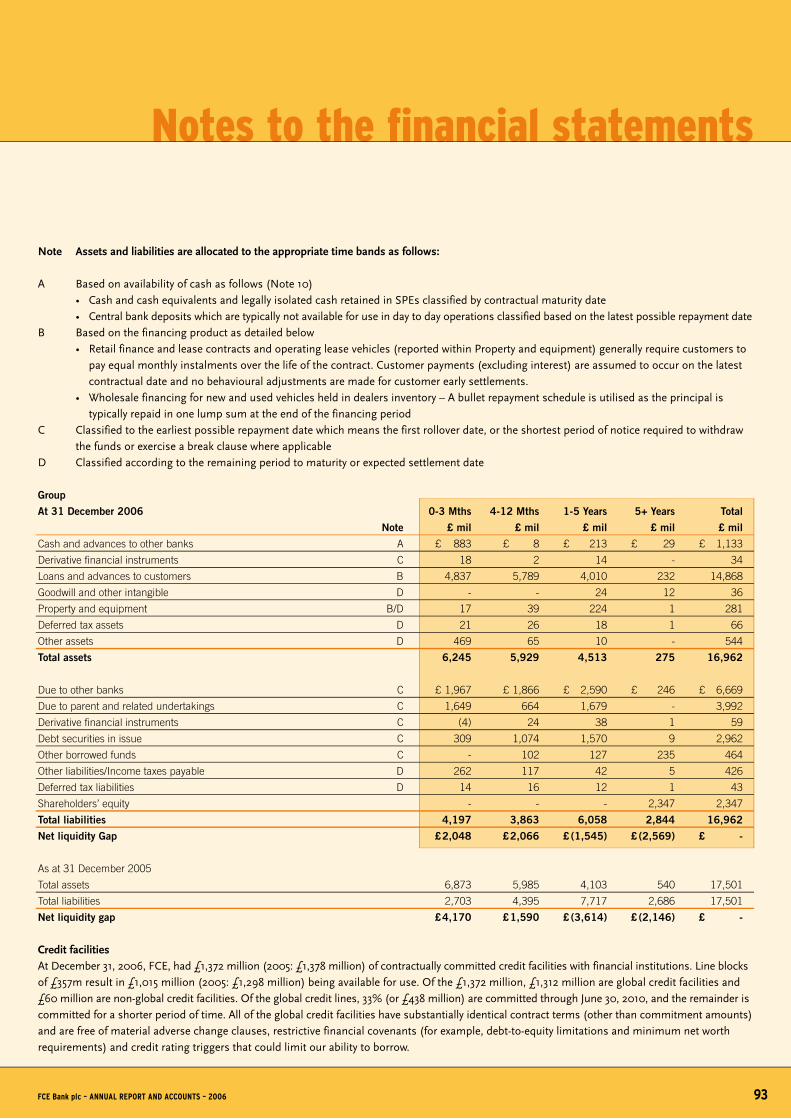
Notes to the financial statements
FCE Bank plc – ANNUAL REPORT AND ACCOUNTS – 2006 �3
Note Assets and liabilities are allocated to the appropriate time bands as follows:
A Based on availability of cash as follows (Note 10) • Cash and cash equivalents and legally isolated cash retained in SPEs classified by contractual maturity date • Central bank deposits which are typically not available for use in day to day operations classified based on the latest possible repayment date B Based on the financing product as detailed below • Retail finance and lease contracts and operating lease vehicles (reported within Property and equipment) generally require customers to pay equal monthly instalments over the life of the contract. Customer payments (excluding interest) are assumed to occur on the latest contractual date and no behavioural adjustments are made for customer early settlements. • Wholesale financing for new and used vehicles held in dealers inventory – A bullet repayment schedule is utilised as the principal is typically repaid in one lump sum at the end of the financing periodC Classified to the earliest possible repayment date which means the first rollover date, or the shortest period of notice required to withdraw the funds or exercise a break clause where applicableD Classified according to the remaining period to maturity or expected settlement date
Group
At 31 December 2006 0-3 Mths 4-12 Mths 1-5 Years 5+ Years Total
Note £ mil £ mil £ mil £ mil £ mil
Cash and advances to other banks A £ 883 £ 8 £ 213 £ 29 £ 1,133
Derivative financial instruments C 18 2 14 - 34
Loans and advances to customers B 4,837 5,789 4,010 232 14,868
Goodwill and other intangible D - - 24 12 36
Property and equipment B/D 17 39 224 1 281
Deferred tax assets D 21 26 18 1 66
Other assets D 469 65 10 - 544
Total assets 6,245 5,929 4,513 275 16,962
Due to other banks C £ 1,967 £ 1,866 £ 2,590 £ 246 £ 6,669
Due to parent and related undertakings C 1,649 664 1,679 - 3,992
Derivative financial instruments C (4) 24 38 1 59
Debt securities in issue C 309 1,074 1,570 9 2,962
Other borrowed funds C - 102 127 235 464
Other liabilities/Income taxes payable D 262 117 42 5 426
Deferred tax liabilities D 14 16 12 1 43
Shareholders’ equity - - - 2,347 2,347
Total liabilities 4,197 3,863 6,058 2,844 16,962
Net liquidity Gap £ 2,048 £ 2,066 £ (1,545) £ (2,569) £ -
As at 31 December 2005
Total assets 6,873 5,985 4,103 540 17,501
Total liabilities 2,703 4,395 7,717 2,686 17,501
Net liquidity gap £ 4,170 £ 1,590 £ (3,614) £ (2,146) £ -
Credit facilitiesAt December 31, 2006, FCE, had £1,372 million (2005: £1,378 million) of contractually committed credit facilities with financial institutions. Line blocks of £357m result in £1,015 million (2005: £1,298 million) being available for use. Of the £1,372 million, £1,312 million are global credit facilities and £60 million are non-global credit facilities. Of the global credit lines, 33% (or £438 million) are committed through June 30, 2010, and the remainder is committed for a shorter period of time. All of the global credit facilities have substantially identical contract terms (other than commitment amounts) and are free of material adverse change clauses, restrictive financial covenants (for example, debt-to-equity limitations and minimum net worth requirements) and credit rating triggers that could limit our ability to borrow.
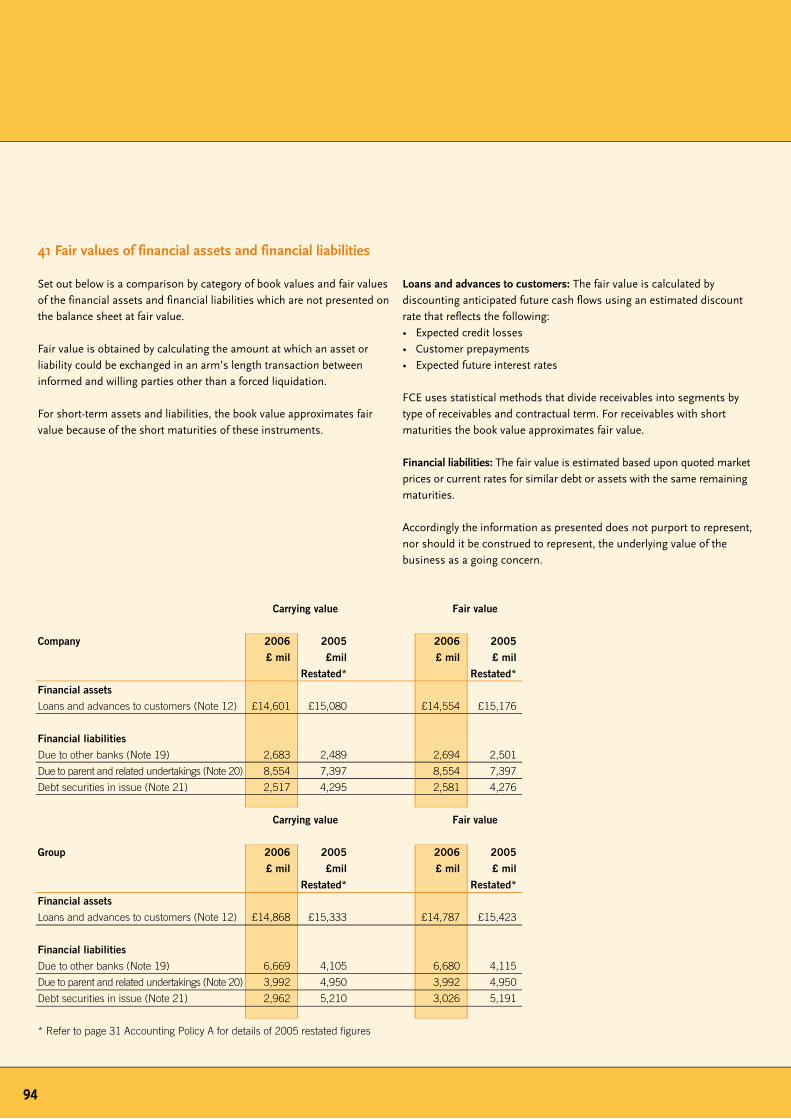
��
41 Fair values of financial assets and financial liabilities
Set out below is a comparison by category of book values and fair values of the financial assets and financial liabilities which are not presented on the balance sheet at fair value.
Fair value is obtained by calculating the amount at which an asset or liability could be exchanged in an arm’s length transaction between informed and willing parties other than a forced liquidation.
For short-term assets and liabilities, the book value approximates fair value because of the short maturities of these instruments.
Loans and advances to customers: The fair value is calculated by discounting anticipated future cash flows using an estimated discount rate that reflects the following:• Expected credit losses • Customer prepayments• Expected future interest rates
FCE uses statistical methods that divide receivables into segments by type of receivables and contractual term. For receivables with short maturities the book value approximates fair value.
Financial liabilities: The fair value is estimated based upon quoted market prices or current rates for similar debt or assets with the same remaining maturities.
Accordingly the information as presented does not purport to represent, nor should it be construed to represent, the underlying value of the business as a going concern.
Carrying value Fair value
Company 2006 2005 2006 2005
£ mil £mil £ mil £ mil
Restated* Restated*
Financial assets
Loans and advances to customers (Note 12) £14,601 £15,080 £14,554 £15,176
Financial liabilities
Due to other banks (Note 19) 2,683 2,489 2,694 2,501
Due to parent and related undertakings (Note 20) 8,554 7,397 8,554 7,397
Debt securities in issue (Note 21) 2,517 4,295 2,581 4,276
Carrying value Fair value
Group 2006 2005 2006 2005
£ mil £mil £ mil £ mil
Restated* Restated*
Financial assets
Loans and advances to customers (Note 12) £14,868 £15,333 £14,787 £15,423
Financial liabilities
Due to other banks (Note 19) 6,669 4,105 6,680 4,115
Due to parent and related undertakings (Note 20) 3,992 4,950 3,992 4,950
Debt securities in issue (Note 21) 2,962 5,210 3,026 5,191
* Refer to page 31 Accounting Policy A for details of 2005 restated fi gures
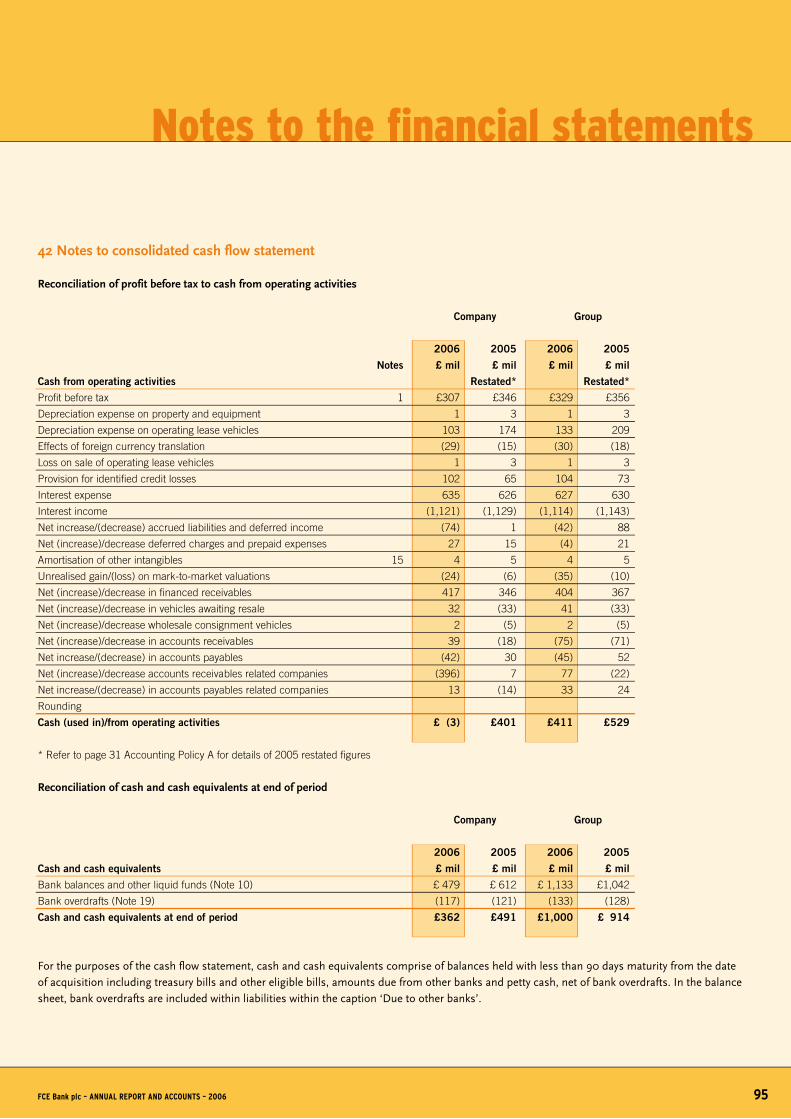
Notes to the financial statements
42 Notes to consolidated cash flow statement
Reconciliation of profit before tax to cash from operating activities
Company Group
2006 2005 2006 2005
Notes £ mil £ mil £ mil £ mil
Cash from operating activities Restated* Restated*
Profit before tax 1 £307 £346 £329 £356
Depreciation expense on property and equipment 1 3 1 3
Depreciation expense on operating lease vehicles 103 174 133 209
Effects of foreign currency translation (29) (15) (30) (18)
Loss on sale of operating lease vehicles 1 3 1 3
Provision for identified credit losses 102 65 104 73
Interest expense 635 626 627 630
Interest income (1,121) (1,129) (1,114) (1,143)
Net increase/(decrease) accrued liabilities and deferred income (74) 1 (42) 88
Net (increase)/decrease deferred charges and prepaid expenses 27 15 (4) 21
Amortisation of other intangibles 15 4 5 4 5
Unrealised gain/(loss) on mark-to-market valuations (24) (6) (35) (10)
Net (increase)/decrease in financed receivables 417 346 404 367
Net (increase)/decrease in vehicles awaiting resale 32 (33) 41 (33)
Net (increase)/decrease wholesale consignment vehicles 2 (5) 2 (5)
Net (increase)/decrease in accounts receivables 39 (18) (75) (71)
Net increase/(decrease) in accounts payables (42) 30 (45) 52
Net (increase)/decrease accounts receivables related companies (396) 7 77 (22)
Net increase/(decrease) in accounts payables related companies 13 (14) 33 24
Rounding
Cash (used in)/from operating activities £ (3) £401 £411 £529
* Refer to page 31 Accounting Policy A for details of 2005 restated figures
Reconciliation of cash and cash equivalents at end of period
Company Group
2006 2005 2006 2005
Cash and cash equivalents £ mil £ mil £ mil £ mil
Bank balances and other liquid funds (Note 10) £ 479 £ 612 £ 1,133 £1,042
Bank overdrafts (Note 19) (117) (121) (133) (128)
Cash and cash equivalents at end of period £362 £491 £1,000 £ 914
For the purposes of the cash flow statement, cash and cash equivalents comprise of balances held with less than 90 days maturity from the date of acquisition including treasury bills and other eligible bills, amounts due from other banks and petty cash, net of bank overdrafts. In the balance sheet, bank overdrafts are included within liabilities within the caption ‘Due to other banks’.
FCE Bank plc – ANNUAL REPORT AND ACCOUNTS – 2006 �5

43 Other information
Domicile: United Kingdom (UK).
Legal form:The Company is a regulated bank and is authorised as a deposit taking business and insurance intermediary under the Financial Services and Markets Act of 2000 and is regulated by the UK Financial Services Authority. The Company also holds a standard license under the UK Consumer Credit Act of 1974 and other licenses to conduct financing business in other European locations. In addition to the UK the Company operates through branches in 15 other European countries having exercised pass-port rights to undertake regulated activities in these countries pursuant to the Banking Consolidation and Insurance Mediation Directives.
Country of registration:England and Wales
Registered office:Central Office – Eagle Way, Brentwood, Essex, CM13 3AR. Registered in England and Wales no 772784.
The Company has seven UK subsidiaries (listed below) which share the same registered office as the Company:
Automotive Finance LimitedFCE Leasing (Holdings) LimitedFCE Leasing LimitedFord Automotive Leasing LimitedJaguar Financial Services LimitedMeritpoint LimitedPrimus Automotive Financial Services Limited
The registered office of the remaining UK subsidiary is as follows:Volvo Car Finance LimitedGlobe Park,Marlow,Buckinghamshire,SL7 1YQ
In addition to the UK subsidiaries listed above the Company has subsidiaries in the Czech Republic, Finland (where it also has a branch), Hungary and Poland – refer to European operating locations for addresses of the Company’s European branches and subsidiaries.
Nature of operations and principal activities: FCE’s primary business is to support the sale of Ford and affiliated manufacturer’s vehicles in Europe through the respective dealer networks. A variety of retail, leasing and wholesale finance plans are provided in which the Company and its subsidiaries operate.
In European markets, FCE offers most of our products and services under the Ford Credit/Bank, Volvo Car Finance, Land Rover Financial Services, Jaguar Financial Services and Mazda Credit/Bank brands – refer to European Operating Locations for further details. The Company through its Worldwide Trade Financing (WTF) division provides financing to importers and distributors in countries where typically there is no established local Ford presence. WTF currently provides finance in over 70 countries. In addition there are private label operations in some European markets.
Immediate parent undertaking: FCE’s immediate parent undertaking is Ford Credit International Inc. (FCI). FCI does not produce consolidated accounts being wholly owned by, and consolidated into the accounts of Ford Motor Credit Company (FMCC).
Ultimate parent undertaking:The ultimate parent undertaking and controlling party is Ford Motor Company (Ford). All three companies (Ford, FCI and FMCC) are incorporated in the United States of America.
Copies of the consolidated accounts for FMCC and Ford may be obtained from Ford Motor Company (US), The American Road, Dearborn, Michigan 48121, United States of America.
�6
Notes to the financial statements

Web site addresses /European operating locations
Additional data Web site addresses
FCE Bank plc. • Annual report and accounts http://www.fcebank.com (English, Spanish and Italian versions) or http://www.fordfinancialeurope.com
Ford Motor Company (Ultimate Parent Company) including: http://www.ford.com/en/company/investorInformation/• Annual report• Financial results• Securities and Exchange Commission (SEC) filings
Ford Motor Credit Company including: http://www.fordcredit.com/investorcenter• SEC Form 10K Annual report• SEC Form 10-Q Quarterly reports• Quarterly Financial results announcements• Ford Credit public asset-backed securities transactions
Luxembourg’s Stock Exchange which includes www.bourse.lu• Euro Medium Term Note Base Prospectus (refer to Note 21 ‘Debt securities in issue’)
Web site addresses
Additional data and web resources, including those listed below can be obtained from the following web site addresses:
FCE Bank plc – ANNUAL REPORT AND ACCOUNTS – 2006 �7
Location Address Additional Trading Styles Branch/Subsidiary Registration No.
AUSTRIA Ford Bank Austria Zweigniederlassung der FCE Bank plc, JFS, LRFS, M, VCF FN 133 621b Fuerbergstrasse 51, Postfach 2, A-5020 Salzburg
BELGIUM* FCE Bank plc, Hunderenveldlaan 10, B-1082 Brussels JFS, LRFS, VCF, M BE450.853.723
BRITAIN FCE Bank plc, Central Office, Eagle Way, Brentwood, JFS, LRFS, M, VCF 772784 Essex CM13 3AR (For a full list of UK subsidiaries refer to Note 43)
CZECH REPUBLIC FCE Credit, s.r.o., Karolinská 654/2, 186 00 Prague 8 VCF 25615564
DENMARK FCE Bank plc, Borupvang 5 D-E, 2750 Ballerup VCF, R, M 0405
FINLAND FCE Bank plc, Taivaltie 1B, 01610 Vantaa + P 585.293 Volvo Car Finance Limited, Taivaltie 1 B, 01610 Vantaa VCF, R 372.996
FRANCE FCE Bank plc, Succursale France, JFS, LRFS, M, P, VCF SIREN 392 315 776 – RCS Versailles 34 Rue De La Croix De Fer, Saint-Germain-en-Laye, 78174
European operating locations
In addition to providing retail and wholesale finance for Ford vehicles, the Company’s European branches and subsidiaries have established additional finance facilities and associated trading styles for Ford affiliated manufacturers in Europe as indicated and detailed in the key on the next page.

��
Location Address Additional Trading Styles Branch/Subsidiary Registration No.
GERMANY Ford Bank Niederlassung der FCE Bank plc, Zentrale, HRB 29668 Josef-Lammerting-Allee 24-34, 50933 Köln
Mazda Bank Niederlassung der FCE Bank plc, + HRB 49511 Hitdorfer Strasse 73, 51371 Leverkusen
Jaguar Financial Services Niederlassung der FCE Bank plc, + HRB 32871 Josef-Lammerting-Allee 24-34, 50933 Köln
Land Rover Financial Services Niederlassung der FCE Bank plc, + HRB 35233 Josef-Lammerting-Allee 24-34, 50933 Köln
GREECE FCE Bank plc, 4 Konstantinoupoleos Ave & St Gonata, VCF 33806/06/B/95/21 12133 Peristeri, Athens
HUNGARY++ FCE Credit Hungary Zrt/FCE Services Szolgáltató Kft, VCF 01-10-043187 (Credit) 1023 Budapest, Árpád, Fejedelem utja 26-28 01-09-698746 (Services)
IRELAND++ FCE Bank plc, 6th floor, Hume House, Pembroke Road, LRFS, VCF, HFS, M E3282 Ballsbridge, Dublin 4
ITALY FCE plc/FCE spa, Via Andrea Argoli 54, 00143 Rome JFS, LRFS, P, M, VCF 5209
NETHERLANDS FCE Bank plc, JFS, LRFS, M, VCF 2369 Amsteldijk 216/217, Postbus 795, 1000 AT, Amsterdam
Volvo Car Finance Netherlands, VCF + - Stationsweg 2, NL-4153 RD Beesd
NORWAY FCE Bank Norsk Avdeling Av Utenlandsk Foretak, LRFS, P, VCF, M, R 968018124 Pb 514, 1411 Kolbotn
POLAND FCE Credit Poland S.A./FCE Bank Polska S.A., VCF, JFS, LRFS FCE Credit–KRS No 0000079486 Aleje Jerozolimskie 181, PL-02-222, Warsaw FCE Bank–KRS No 0000046004
PORTUGAL FCE Bank plc, Rua Rosa Araujo 2, 6th floor, LRFS, M 4336 Parish of Coração de Jesus, 1250-195 Lisbon
SPAIN FCE Bank plc Sucursal en España, calle Caléndula, 13, JFS, LRFS, M, P, VCF 0218 28109 Alcobendas, Madrid SWEDEN FCE Bank plc (England) Bankfilialen i Sverige, M, JFS**, LRFS** 516401-9712 Rävebergsvägen, 405 31 Göteborg
SWITZERLAND FCE Bank plc (Swiss Branch), Geerenstrasse 10, M, VCF CH-020.9.000.633-0 CH-8304 Wallisellen
All locations use Ford Financial as an additional trading style. Ford Credit is commonly used through most European locations. In many locations Business Partner, a full service leasing product, is provided by a third party.
Key to Trading Styles (t/a = trading as):JFS = Jaguar Financial Services; LRFS = Land Rover Financial Services; P = PRIMUS (non Ford affiliated), R = Renault; VCF = Volvo Car Finance; M = Mazda Credit/Mazda Bank; HFS = Henry Ford & Son Finance+Ford vehicle financing is not undertaken by this location as it is provided by FCE/Ford Bank Branch within that country++ In Hungary and Ireland retail finance is provided by a third party*Also conducts business in Luxembourg; ** additional trading styles to be launched later in 2007
European operating locations (continued)
European operating locations


FCE Bank plcANNUAL REPORTAND ACCOUNTS 2006for the year ended December 31, 2006