FCC Test Report No.: RF170503C46 Page No. 2 / 30 Report Format Version: 6.1.1 Table of Contents...
30
Report No.: RF170503C46 Page No. 1 / 30 Report Format Version: 6.1.1 FCC Test Report Report No.: RF170503C46 FCC ID: JEH-QNT1-01XX Test Model: QR1000 Received Date: May 03, 2017 Test Date: May 17, 2017 ~ May 24, 2017 Issued Date: Jun. 13, 2017 Applicant: NCR Corporation Address: 2651 Satellite Blvd, Duluth. GA 30096 USA Issued By: Bureau Veritas Consumer Products Services (H.K.) Ltd., Taoyuan Branch Lab Address: No. 47-2, 14th Ling, Chia Pau Vil., Lin Kou Dist., New Taipei City, Taiwan ( R.O.C ) Test Location: No. 19, Hwa Ya 2nd Rd, Wen Hwa Tsuen, Kwei Shan Hsiang, Taoyuan Hsien 333, Taiwan, R.O.C. This report is for your exclusive use. Any copying or replication of this report to or for any other person or entity, or use of our name or trademark, is permitted only with our prior written permission. This report sets forth our findings solely with respect to the test samples identified herein. The results set forth in this report are not indicative or representative of the quality or characteristics of the lot from which a test sample was taken or any similar or identical product unless specifically and expressly noted. Our report includes all of the tests requested by you and the results thereof based upon the information that you provided to us. You have 60 days from date of issuance of this report to notify us of any material error or omission caused by our negligence, provided, however, that such notice shall be in writing and shall specifically address the issue you wish to raise. A failure to raise such issue within the prescribed time shall constitute your unqualified acceptance of the completeness of this report, the tests conducted and the correctness of the report contents. Unless specific mention, the uncertainty of measurement has been explicitly taken into account to declare the compliance or non-compliance to the specification. The report must not be used by the client to claim product certification, approval, or endorsement by TAF or any government agencies.
Transcript of FCC Test Report No.: RF170503C46 Page No. 2 / 30 Report Format Version: 6.1.1 Table of Contents...

Report No.: RF170503C46 Page No. 1 / 30 Report Format Version: 6.1.1
FCC Test Report
Report No.: RF170503C46
FCC ID: JEH-QNT1-01XX
Test Model: QR1000
Received Date: May 03, 2017
Test Date: May 17, 2017 ~ May 24, 2017
Issued Date: Jun. 13, 2017
Applicant: NCR Corporation
Address: 2651 Satellite Blvd, Duluth. GA 30096 USA
Issued By: Bureau Veritas Consumer Products Services (H.K.) Ltd., Taoyuan Branch
Lab Address: No. 47-2, 14th Ling, Chia Pau Vil., Lin Kou Dist., New Taipei City, Taiwan ( R.O.C )
Test Location: No. 19, Hwa Ya 2nd Rd, Wen Hwa Tsuen, Kwei Shan Hsiang, Taoyuan Hsien 333, Taiwan, R.O.C.
This report is for your exclusive use. Any copying or replication of this report to or for any other person or entity, or use of our name or trademark, is permitted only with our prior written permission. This report sets forth our findings solely with respect to the test samples identified herein. The results set forth in this report are not indicative or representative of the quality or characteristics of the lot from which a test sample was taken or any similar or identical product unless specifically and expressly noted. Our report includes all of the tests requested by you and the results thereof based upon the information that you provided to us. You have 60 days from date of issuance of this report to notify us of any material error or omission caused by our negligence, provided, however, that such notice shall be in writing and shall specifically address the issue you wish to raise. A failure to raise such issue within the prescribed time shall constitute your unqualified acceptance of the completeness of this report, the tests conducted and the correctness of the report contents. Unless specific mention, the uncertainty of measurement has been explicitly taken into account to declare the compliance or non-compliance to the specification. The report must not be used by the client to claim product certification, approval, or endorsement by TAF or any government agencies.

Report No.: RF170503C46 Page No. 2 / 30 Report Format Version: 6.1.1
Table of Contents Release Control Record .................................................................................................................................. 3 1 Certificate of Conformity ........................................................................................................................... 4 2 Summary of Test Results ........................................................................................................................... 5
2.1 Measurement Uncertainty ..................................................................................................................... 5 2.2 Modification Record .............................................................................................................................. 5
3 General Information ................................................................................................................................... 6 3.1 General Description of EUT .................................................................................................................. 6 3.2 Description of Test Modes ..................................................................................................................... 7
3.2.1 Test Mode Applicability and Tested Channel Detail .................................................................... 7 3.3 Description of Support Units ................................................................................................................. 9
3.3.1 Configuration of System under Test ........................................................................................... 9 3.4 General Description of Applied Standards ............................................................................................ 9
4 Test Types and Results ............................................................................................................................ 10 4.1 Radiated Emission Measurement ....................................................................................................... 10
4.1.1 Limits of Radiated Emission Measurement .............................................................................. 10 4.1.2 Test Instruments ........................................................................................................................ 11 4.1.3 Test Procedures ........................................................................................................................ 12 4.1.4 Deviation from Test Standard ................................................................................................... 12 4.1.5 Test Set Up ............................................................................................................................... 13 4.1.6 EUT Operating Conditions ........................................................................................................ 13 4.1.7 Test Results .............................................................................................................................. 14
4.2 Conducted Emission Measurement .................................................................................................... 21 4.2.1 Limits of Conducted Emission Measurement ........................................................................... 21 4.2.2 Test Instruments ....................................................................................................................... 21 4.2.3 Test Procedures ........................................................................................................................ 22 4.2.4 Deviation from Test Standard ................................................................................................... 22 4.2.5 Test Setup ................................................................................................................................. 22 4.2.6 EUT Operating Conditions ........................................................................................................ 22 4.2.7 Test Results .............................................................................................................................. 23
4.3 Frequency Stability ............................................................................................................................. 25 4.3.1 Limits of Frequency Stability Measurement ............................................................................. 25 4.3.2 Test Setup ................................................................................................................................. 25 4.3.3 Test Instruments ....................................................................................................................... 25 4.3.4 Test Procedure ......................................................................................................................... 25 4.3.5 Deviation fromTest Standard .................................................................................................... 25 4.3.6 EUT Operating Conditions ........................................................................................................ 25 4.3.7 Test Result ................................................................................................................................ 26
4.4 20 dB Bandwidth ................................................................................................................................. 27 4.4.1 Limits of 20 dB Bandwidth Measurement ................................................................................. 27 4.4.2 Test Setup ................................................................................................................................. 27 4.4.3 Test Instruments ....................................................................................................................... 27 4.4.4 Test Procedures ........................................................................................................................ 27 4.4.5 Deviation from Test Standard ................................................................................................... 27 4.4.6 EUT Operating Conditions ........................................................................................................ 27 4.4.7 Test Results .............................................................................................................................. 28
5 Pictures of Test Arrangements................................................................................................................ 29 Appendix – Information on the Testing Laboratories ................................................................................ 30

Report No.: RF170503C46 Page No. 3 / 30 Report Format Version: 6.1.1
Release Control Record
Issue No. Description Date Issued
RF170503C46 Original Release Jun. 13, 2017

Report No.: RF170503C46 Page No. 4 / 30 Report Format Version: 6.1.1
1 Certificate of Conformity
Product: NCR Silver Quantum
Brand: NCR Corporation
Test Model: QR1000
Sample Status: Production Unit
Applicant: NCR Corporation
Test Date: May 17, 2017 ~ May 24, 2017
Standards: 47 CFR FCC Part 15, Subpart C (Section 15.225)
47 CFR FCC Part 15, Subpart C (Section 15.215)
ANSI C63.10:2013
The above equipment has been tested by Bureau Veritas Consumer Products Services (H.K.) Ltd.,
Taoyuan Branch, and found compliance with the requirement of the above standards. The test record, data
evaluation & Equipment Under Test (EUT) configurations represented herein are true and accurate accounts
of the measurements of the sample’s EMC characteristics under the conditions specified in this report.
Prepared by :
, Date: Jun. 13, 2017 Evonne Liu / Specialist
Approved by :
, Date: Jun. 13, 2017
David Huang / Project Engineer

Report No.: RF170503C46 Page No. 5 / 30 Report Format Version: 6.1.1
2 Summary of Test Results
47 CFR FCC Part 15, Subpart C (Section 15.225, 15.215)
FCC Clause Test Item Result Remarks
15.207 Conducted emission test Pass Meet the requirement of limit. Minimum passing margin is -11.89 dB at 0.49400 MHz.
15.225 (a) The field strength of any emissions within the band 13.553-13.567 MHz Pass
Meet the requirement of limit. Minimum passing margin is -50.06 dB at 13.561 MHz.
15.225 (b) The field strength of any emissions
within the bands 13.410-13.553 MHz and 13.567-13.710 MHz
Pass Meet the requirement of limit.
15.225 (c) The field strength of any emissions
within the bands 13.110-13.410 MHz and 13.710-14.010 MHz
Pass Meet the requirement of limit.
15.225 (d) The field strength of any emissions
appearing outside of the 13.110-14.010 MHz band
Pass Meet the requirement of limit. Minimum passing margin is -4.62 dB at 86.26 MHz.
15.225 (e) The frequency tolerance Pass Meet the requirement of limit.
15.215 (c) 20dB Bandwidth Pass Meet the requirement of limit.
15.203 Antenna Requirement Pass No antenna connector is used.
2.1 Measurement Uncertainty
Where relevant, the following measurement uncertainty levels have been estimated for tests performed on the EUT as specified in CISPR 16-4-2:
Measurement Frequency Expended Uncertainty (k=2) (±)
Conducted Emissions at mains ports 150 kHz ~ 30 MHz 2.44 dB
Radiated Emissions up to 1 GHz 30 MHz ~ 200 MHz 2.93 dB
200 MHz ~1000 MHz 2.95 dB
Radiated Emissions above 1 GHz 1 GHz ~ 18 GHz 2.26 dB 18 GHz ~ 40 GHz 1.94 dB
2.2 Modification Record
There were no modifications required for compliance.

Report No.: RF170503C46 Page No. 6 / 30 Report Format Version: 6.1.1
3 General Information
3.1 General Description of EUT
Product NCR Silver Quantum Brand NCR Corporation Test Model QR1000 Status of EUT Production Unit
Power Supply Rating 12.0 Vdc (adapter) 7.2 Vdc (Li-ion battery)
Modulation Type ASK Operating Frequency 13.56 MHz Antenna Type Loop Antenna Accessory Device Refer to Note Data Cable Supplied Refer to Note
Note: 1. The EUT contains following accessory devices.
Product Brand Model Description
Adapter DELTA ELECTRONICS, INC. DPS-65VB
I/P: 100-240 Vac, 50/60 Hz, 2 A O/P: 12 Vdc, 5.417 A 1.2m non-shielded cable with 1 core 1.8m non-shielded power cable w/o core
Battery GLW Quantum 7.2 Vdc, 10400 mAh EMV Module Ingenico RP457 --
2. The above EUT information is declared by manufacturer and for more detailed features description, please refer to the manufacturer's specifications or user's manual.

Report No.: RF170503C46 Page No. 7 / 30 Report Format Version: 6.1.1
3.2 Description of Test Modes
One channel was provided to this EUT: Channel Frequency (MHz)
1 13.56
3.2.1 Test Mode Applicability and Tested Channel Detail
EUT Configure
Mode
Applicable To Description
RE PLC FS EB - √ √ √ √ -
Where RE: Radiated Emission PLC: Power Line Conducted Emission FS: Frequency Stability EB: 20 dB Bandwidth measurement
Radiated Emission Test:
Pre-Scan has been conducted to determine the worst-case mode from all possible combinations between available modulations, data rates and antenna ports (if EUT with antenna diversity architecture).
Following channel(s) was (were) selected for the final test as listed below. EUT
Configure Mode
Available Channel Tested Channel Modulation Type Axis
- 1 1 ASK Z
Power Line Conducted Emission Test:
Pre-Scan has been conducted to determine the worst-case mode from all possible combinations between available modulations, data rates and antenna ports (if EUT with antenna diversity architecture).
Following channel(s) was (were) selected for the final test as listed below. EUT
Configure Mode
Available Channel Tested Channel Modulation Type Axis
- 1 1 ASK Z
Frequency Stability:
This item includes all test value of each mode, but only includes spectrum plot of worst value of each mode.
Pre-Scan has been conducted to determine the worst-case mode from all possible combinations between available modulations, data rates and antenna ports (if EUT with antenna diversity architecture).
Following channel(s) was (were) selected for the final test as listed below. EUT
Configure Mode
Available Channel Tested Channel Modulation Type Axis
- 1 1 ASK Z

Report No.: RF170503C46 Page No. 8 / 30 Report Format Version: 6.1.1
20 dB Bandwidth:
This item includes all test value of each mode, but only includes spectrum plot of worst value of each mode.
Pre-Scan has been conducted to determine the worst-case mode from all possible combinations between available modulations, data rates and antenna ports (if EUT with antenna diversity architecture).
Following channel(s) was (were) selected for the final test as listed below. EUT
Configure Mode
Available Channel Tested Channel Modulation Type Axis
- 1 1 ASK Z
Test Condition:
Applicable To Environmental Conditions Input Power Tested By RE 25 deg. C, 65 % RH 120 Vac, 60 Hz Gavin Wu FS 25 deg. C, 65 % RH 7.2 Vdc Wayne Lin
PLC 25 deg. C, 65 % RH 120 Vac, 60 Hz Getaz Yang EB 25 deg. C, 68 % RH 7.2 Vdc Wayne Lin

Report No.: RF170503C46 Page No. 9 / 30 Report Format Version: 6.1.1
3.3 Description of Support Units
The EUT has been tested as an independent unit together with other necessary accessories or support units.
3.3.1 Configuration of System under Test
3.4 General Description of Applied Standards
The EUT is a RF Product. According to the specifications of the manufacturer, it must comply with the requirements of the following standards: FCC Part 15, Subpart C (15.225) FCC Part 15, Subpart C (15.215) ANSI C63.10-2013 All test items have been performed and recorded as per the above standards. NOTE: The EUT has been verified to comply with the requirements of FCC Part 15, Subpart B, Class B (DoC).
The test report has been issued separately.
*Test Table
(Power from AC Adapter)
EUT

Report No.: RF170503C46 Page No. 10 / 30 Report Format Version: 6.1.1
4 Test Types and Results
4.1 Radiated Emission Measurement
4.1.1 Limits of Radiated Emission Measurement The field strength of any emissions within the band 13.553-13.567 MHz shall not exceed 15,848 microvolts/meter at 30 meters. The field strength of any emissions within the bands 13.410-13.553 MHz and 13.567-13.710 MHz shall not exceed 334 microvolts/meter at 30 meters. The field strength of any emissions within the bands 13.110-13.410 MHz and 13.710-14.010 MHz shall not exceed 106 microvolts/meter at 30 meters. The field strength of any emissions appearing outside of the 13.110-14.010 MHz band shall not exceed the general radiated emission limits in § 15.209.
Frequencies (MHz)
Field Strength (microvolts/meter)
Measurement Distance (meters)
0.009 ~ 0.490 2400/F (kHz) 300
0.490 ~ 1.705 24000/F (kHz) 30
1.705 ~ 30.0 30 30
30 ~ 88 100 3
88 ~ 216 150 3
216 ~ 960 200 3
Above 960 500 3
NOTE: 1. The lower limit shall apply at the transition frequencies. 2. Emission level (dBuV/m) = 20 log Emission level (uV/m). 3. For frequencies above 1000 MHz, the field strength limits are based on average detector, however, the
peak field strength of any emission shall not exceed the maximum permitted average limits, specified above by more than 20 dB under any condition of modulation.

Report No.: RF170503C46 Page No. 11 / 30 Report Format Version: 6.1.1
4.1.2 Test Instruments
Description & Manaufacturer
Model No. Serial No. Date of Calibration Due Date of Calibration
Test Receiver Agilent N9038A MY51210203 Feb. 17, 2017 Feb. 16, 2018
Spectrum Analyzer Agilent N9010A MY52220314 Dec. 16, 2016 Dec. 15, 2017
Spectrum Analyzer ROHDE & SCHWARZ FSU43 101261 Dec. 13, 2016 Dec. 12, 2017
BILOG Antenna SCHWARZBECK VULB9168 9168-472 Dec. 26, 2016 Dec. 27, 2017
HORN Antenna SCHWARZBECK BBHA 9120 D 9120D-969 Dec. 12, 2016 Dec. 13, 2017
HORN Antenna SCHWARZBECK BBHA 9170 9170-480 Dec. 14, 2016 Dec. 13, 2017
Preamplifier EMCI EMC 012645 980115 Oct. 21, 2016 Oct. 20, 2017
Preamplifier EMCI EMC 184045 980116 Oct. 21, 2016 Oct. 20, 2017
Preamplifier EMCI EMC 330H 980112 Oct. 21, 2016 Oct. 20, 2017
Power Meter Anritsu ML2495A 1232002 Sep. 08, 2016 Sep. 07, 2017
Power Sensor Anritsu MA2411B 1207325 Sep. 08, 2016 Sep. 07, 2017
RF signal cable HUBER+SUHNNER SUCOFLEX 104 309219/4
2950114 Oct. 21, 2016 Oct. 20, 2017
RF signal cable HUBER+SUHNNER SUCOFLEX 104 250130/4 Oct. 21, 2016 Oct. 20, 2017
RF Coaxial Cable Worken 8D-FB Cable-Ch10-01 Oct. 21, 2016 Oct. 20, 2017
Software BV ADT
E3 6.120103 NA NA NA
Antenna Tower MF MFA-440H NA NA NA
Turn Table MF MFT-201SS NA NA NA
Antenna Tower &Turn Table Controller MF
MF-7802 NA NA NA
Note: 1. The calibration interval of the above test instruments is 12 months and the calibrations are
traceable to NML/ROC and NIST/USA. 2. The test was performed in HwaYa Chamber 10. 3. The horn antenna and preamplifier (model: EMC 184045) are used only for the measurement of
emission frequency above 1 GHz if tested. 4. The FCC Site Registration No. is 690701. 5. The IC Site Registration No. is IC7450F-10.

Report No.: RF170503C46 Page No. 12 / 30 Report Format Version: 6.1.1
4.1.3 Test Procedures
a. The EUT was placed on the top of a rotating table 0.8 meters above the ground at a 3 meters semi-anechoic chamber. The table was rotated 360 degrees to determine the position of the highest radiation.
b. The EUT was set 3 meters away from the interference-receiving antenna, which was mounted on the top of a variable-height antenna tower.
c. Height of receiving antenna is varied from one meter to four meters above the ground to determine the maximum value of the field strength. Both horizontal and vertical polarizations of the antenna are set to make the measurement.
d. For each suspected emission, the EUT was arranged to its worst case and then the antenna was tuned to heights from 1 meter to 4 meters and the rotatable table was turned from 0 degrees to 360 degrees to find the maximum reading.
e. The test-receiver system was set to Peak Detect Function and Specified Bandwidth with Maximum Hold Mode.
f. If the emission level of the EUT in peak mode was lower than the limit specified, then testing could be stopped and the peak values of the EUT would be reported. Otherwise the emissions would be re-tested one by one using peak, quasi-peak or average method as specified and then reported in a data sheet.
NOTE: 1. The resolution bandwidth and video bandwidth of test receiver/spectrum analyzer is 120 kHz for
Quasi-peak detection at frequency below 1 GHz. 2. The resolution bandwidth of test receiver/spectrum analyzer is 1 MHz and video bandwidth is 3 MHz for
Peak detection at frequency above 1 GHz. 3. The resolution bandwidth of test receiver/spectrum analyzer is 1 MHz and the video bandwidth is ≥ 1/T
(Duty cycle < 98 %) or 10 Hz (Duty cycle > 98 %) for Average detection (AV) at frequency above 1 GHz. 4. All modes of operation were investigated and the worst-case emissions are reported.
4.1.4 Deviation from Test Standard
No deviation.

Report No.: RF170503C46 Page No. 13 / 30 Report Format Version: 6.1.1
4.1.5 Test Set Up
Frequency range 9k~30MHz:
Frequency range 30~1000MHz:
For the actual test configuration, please refer to the attached file (Test Setup Photo). 4.1.6 EUT Operating Conditions
a. Placed the EUT on the testing table. b. Set the EUT under transmission condition continuously at specific channel frequency.
3m

Report No.: RF170503C46 Page No. 14 / 30 Report Format Version: 6.1.1
4.1.7 Test Results
No non-compliance noted: KDB 937606 OATS and Chamber Correlation Justification - Base on FCC 15.31 (f) (2): measurements may be performed at a distance closer than that specified in the regulations; however, an attempt should be made to avoid making measurements in the near field. - OATs and chamber correlation testing had been performed and chamber measured test result is the worst case test result.

Report No.: RF170503C46 Page No. 15 / 30 Report Format Version: 6.1.1
EUT Test Condition Measurement Detail
Channel Channel 1 Frequency Range 13.553 ~ 13.567 MHz
Input Power 120 Vac, 60 Hz Detector Function Quasi-Peak
Environmental Conditions
25 deg. C, 65 % RH Tested By Gavin Wu
Antenna Polarity & Test Distance: Loop Antenna Open at 3 m
Frequency (MHz)
Emission Level
(dBuV/m)
Read Level
(dBuV)
Limit (dBuV/m)
Margin (dB)
Antenna Factor (dB/m)
Cable Loss (dB)
Preamp Factor (dB)
Antenna Height (cm)
Table Angle
(Degree) Remark
13.561 73.94 77.32 124 -50.06 37.67 0.31 41.36 100 0 Peak
REMARKS: 1. Emission level(dBuV/m)=Raw Value(dBuV) + Correction Factor(dB/m) 2. Correction Factor(dB/m) = Antenna Factor (dB/m) + Cable Factor (dB)
– Pre-Amplifier Factor(dB) 3. The other emission levels were very low against the limit.
4. Margin value = Emission level – Limit value. 5. Above limits have been translated by the formula
The measured field strength was extrapolated to distance 30 meters, using the formula that the limit of field strength varies as the inverse distance square (40dB per decade of distance) Example: 13.56 MHz = 15848 uV/m 30m = 84 dBuV/m 30m = 84+20log(30/3)2 3m = 124 dBuV/m

Report No.: RF170503C46 Page No. 16 / 30 Report Format Version: 6.1.1
EUT Test Condition Measurement Detail
Channel Channel 1 Frequency Range 13.553 ~ 13.567 MHz
Input Power 120 Vac, 60 Hz Detector Function Quasi-Peak
Environmental Conditions
25 deg. C, 65 % RH Tested By Gavin Wu
Antenna Polarity & Test Distance: Loop Antenna Close at 3 m
Frequency (MHz)
Emission Level
(dBuV/m)
Read Level
(dBuV)
Limit (dBuV/m)
Margin (dB)
Antenna Factor (dB/m)
Cable Loss (dB)
Preamp Factor (dB)
Antenna Height (cm)
Table Angle
(Degree) Remark
13.561 69.9 73.28 124 -54.1 37.67 0.31 41.36 100 360 Peak
REMARKS: 1. Emission level(dBuV/m)=Raw Value(dBuV) + Correction Factor(dB/m) 2. Correction Factor(dB/m) = Antenna Factor (dB/m) + Cable Factor (dB)
– Pre-Amplifier Factor(dB) 3. The other emission levels were very low against the limit.
4. Margin value = Emission level – Limit value. 5. Above limits have been translated by the formula
The measured field strength was extrapolated to distance 30 meters, using the formula that the limit of field strength varies as the inverse distance square (40dB per decade of distance) Example: 13.56 MHz = 15848 uV/m 30m = 84 dBuV/m 30m = 84+20log(30/3)2 3m = 124 dBuV/m

Report No.: RF170503C46 Page No. 17 / 30 Report Format Version: 6.1.1
EUT Test Condition Measurement Detail
Channel Channel 1 Frequency Range Below 30 MHz
Input Power 120 Vac, 60 Hz Detector Function Quasi-Peak
Environmental Conditions
25 deg. C, 65 % RH Tested By Gavin Wu
Antenna Polarity & Test Distance: Loop Antenna Open at 3 m
Frequency (MHz)
Emission Level
(dBuV/m)
Read Level
(dBuV)
Limit (dBuV/m)
Margin (dB)
Antenna Factor (dB/m)
Cable Loss (dB)
Preamp Factor (dB)
Antenna Height (cm)
Table Angle
(Degree) Remark
27.121 24.38 29.78 69.54 -45.16 35.55 0.38 41.33 100 360 Peak
REMARKS:
1. Emission Level(dBuV/m) = Raw Value(dBuV) + Correction Factor(dB/m) 2. Correction Factor(dB/m) = Antenna Factor(dB/m) + Cable Factor(dB)
– Pre-Amplifier Factor (dB) 3. The other emission levels were very low against the limit. 4. Margin value = Emission Level – Limit value

Report No.: RF170503C46 Page No. 18 / 30 Report Format Version: 6.1.1
EUT Test Condition Measurement Detail
Channel Channel 1 Frequency Range Below 30 MHz
Input Power 120 Vac, 60 Hz Detector Function Quasi-Peak
Environmental Conditions
25 deg. C, 65 % RH Tested By Gavin Wu
Antenna Polarity & Test Distance: Loop Antenna Close at 3 m
Frequency (MHz)
Emission Level
(dBuV/m)
Read Level
(dBuV)
Limit (dBuV/m)
Margin (dB)
Antenna Factor (dB/m)
Cable Loss (dB)
Preamp Factor (dB)
Antenna Height (cm)
Table Angle
(Degree) Remark
27.121 23.82 29.22 69.54 -45.72 35.55 0.38 41.33 100 0 Peak
REMARKS:
1. Emission Level(dBuV/m) = Raw Value(dBuV) + Correction Factor(dB/m) 2. Correction Factor(dB/m) = Antenna Factor(dB/m) + Cable Factor(dB)
– Pre-Amplifier Factor (dB) 3. The other emission levels were very low against the limit. 4. Margin value = Emission Level – Limit value

Report No.: RF170503C46 Page No. 19 / 30 Report Format Version: 6.1.1
EUT Test Condition Measurement Detail
Channel Channel 1 Frequency Range Below 1000 MHz
Input Power 120 Vac, 60 Hz Detector Function Quasi-Peak
Environmental Conditions
25 deg. C, 65 % RH Tested By Gavin Wu
HORIZONTAL
VERTICAL

Report No.: RF170503C46 Page No. 20 / 30 Report Format Version: 6.1.1
Antenna Polarity & Test Distance: Horizontal at 3 m
Frequency (MHz)
Emission Level
(dBuV/m)
Read Level
(dBuV)
Limit (dBuV/m)
Margin (dB)
Antenna Factor (dB/m)
Cable Loss (dB)
Preamp Factor (dB)
Antenna Height (cm)
Table Angle
(Degree) Remark
85.29 29.72 52.31 40 -10.28 8.22 0.93 31.74 138 263 Peak 183.26 36.75 56.78 43.5 -6.75 10.53 1.23 31.79 127 355 Peak 272.5 34.36 52.63 46 -11.64 12.14 1.56 31.97 101 261 Peak 429.64 30.83 44.96 46 -15.17 15.93 1.95 32.01 104 113 Peak 648.86 36.16 45.64 46 -9.84 20.2 2.35 32.03 130 90 Peak 669.23 37.6 46.58 46 -8.4 20.44 2.4 31.82 114 176 Peak
Antenna Polarity & Test Distance: Vertical at 3 m
Frequency (MHz)
Emission Level
(dBuV/m)
Read Level
(dBuV)
Limit (dBuV/m)
Margin (dB)
Antenna Factor (dB/m)
Cable Loss (dB)
Preamp Factor (dB)
Antenna Height (cm)
Table Angle
(Degree) Remark
40.67 34.35 51.17 40 -5.65 13.55 0.65 31.02 128 229 Peak 86.26 35.38 57.99 40 -4.62 8.23 0.94 31.78 100 148 Peak 205.57 32.49 53.24 43.5 -11.01 9.6 1.32 31.67 130 251 Peak 273.47 31.95 50.17 46 -14.05 12.17 1.56 31.95 125 302 Peak 489.78 34.1 46.68 46 -11.9 17.12 2.07 31.77 135 79 Peak 648.86 31.58 41.06 46 -14.42 20.2 2.35 32.03 120 83 Peak
REMARKS: 1. Emission Level = Read Level + Antenna Factor + Cable Loss - Preamp Factor
Margin value = Emission level – Limit value.

Report No.: RF170503C46 Page No. 21 / 30 Report Format Version: 6.1.1
4.2 Conducted Emission Measurement
4.2.1 Limits of Conducted Emission Measurement
Frequency (MHz) Conducted Limit (dBuV)
Quasi-peak Average
0.15 - 0.5 66 - 56 56 - 46
0.50 - 5.0 56 46
5.0 - 30.0 60 50
Note: 1. The lower limit shall apply at the transition frequencies. 2. The limit decreases in line with the logarithm of the frequency in the range of 0.15 to 0.50 MHz. 3. All emanations from a class A/B digital device or system, including any network of conductors and
apparatus connected thereto, shall not exceed the level of field strengths specified above.
4.2.2 Test Instruments
Description & Manufacturer
Model No. Serial No. Date Of
Calibration Due Date Of Calibration
Test Receiver ROHDE & SCHWARZ ESCI 100613 Nov. 21, 2016 Nov. 20, 2017
RF signal cable (with 10dB PAD) Woken
5D-FB Cable-cond1-01 Dec. 22, 2016 Dec. 21, 2017
LISN/AMN ROHDE & SCHWARZ (EUT)
ESH3-Z5 835239/001 Mar. 10, 2017 Mar. 09, 2018
LISN/AMN ROHDE & SCHWARZ (Peripheral)
ESH3-Z5 100311 Jul. 28, 2016 Jul. 27, 2017
Software ADT
BV ADT_Cond_ V7.3.7.3 NA NA NA
NOTE: 1. The calibration interval of the above test instruments is 12 months and the calibrations are
traceable to NML/ROC and NIST/USA. 2. The test was performed in HwaYa Shielded Room 1. 3. The VCCI Site Registration No. is C-2040.

Report No.: RF170503C46 Page No. 22 / 30 Report Format Version: 6.1.1
4.2.3 Test Procedures
a. The EUT was placed 0.4 meters from the conducting wall of the shielded room with EUT being connected to the power mains through a line impedance stabilization network (LISN). Other support units were connected to the power mains through another LISN. The two LISNs provide 50 ohm/50 uH of coupling impedance for the measuring instrument.
b. Both lines of the power mains connected to the EUT were checked for maximum conducted interference. c. The frequency range from 150 kHz to 30 MHz was searched. Emission levels under (Limit – 20 dB) was
not recorded. NOTE: The resolution bandwidth and video bandwidth of test receiver is 9 kHz for quasi-peak detection (QP)
and average detection (AV) at frequency 0.15 MHz - 30 MHz.
4.2.4 Deviation from Test Standard
No deviation.
4.2.5 Test Setup
Note: 1.Support units were connected to second LISN.
2.Both of LISNs (AMN) are 80 cm from EUT and at least 80
from other units and other metal planes
Vertical Ground
Reference Plane
40cm
80cm
Test Receiver
Horizontal Ground
Reference Plane
EUT
LISN
For the actual test configuration, please refer to the attached file (Test Setup Photo).
4.2.6 EUT Operating Conditions
a. Placed the EUT on the testing table. b. Set the EUT under transmission condition continuously at specific channel frequency.
Report No.: RF170503C46 Page No. 23 / 30 Report Format Version: 6.1.1
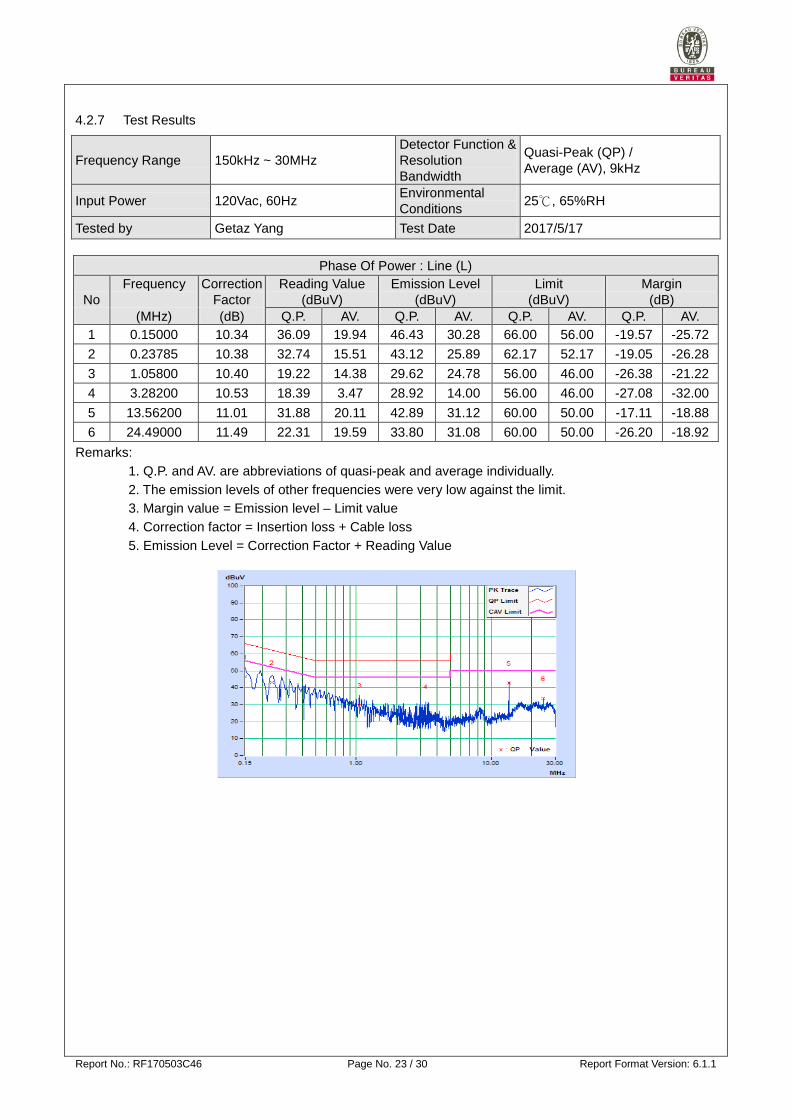
4.2.7 Test Results
Frequency Range 150kHz ~ 30MHz Detector Function & Resolution Bandwidth
Quasi-Peak (QP) / Average (AV), 9kHz
Input Power 120Vac, 60Hz Environmental Conditions 25℃, 65%RH
Tested by Getaz Yang Test Date 2017/5/17
Phase Of Power : Line (L)
No Frequency
Correction
Factor Reading Value
(dBuV) Emission Level
(dBuV) Limit
(dBuV) Margin
(dB) (MHz) (dB) Q.P. AV. Q.P. AV. Q.P. AV. Q.P. AV. 1 0.15000 10.34 36.09 19.94 46.43 30.28 66.00 56.00 -19.57 -25.72 2 0.23785 10.38 32.74 15.51 43.12 25.89 62.17 52.17 -19.05 -26.28 3 1.05800 10.40 19.22 14.38 29.62 24.78 56.00 46.00 -26.38 -21.22 4 3.28200 10.53 18.39 3.47 28.92 14.00 56.00 46.00 -27.08 -32.00 5 13.56200 11.01 31.88 20.11 42.89 31.12 60.00 50.00 -17.11 -18.88 6 24.49000 11.49 22.31 19.59 33.80 31.08 60.00 50.00 -26.20 -18.92
Remarks: 1. Q.P. and AV. are abbreviations of quasi-peak and average individually. 2. The emission levels of other frequencies were very low against the limit. 3. Margin value = Emission level – Limit value 4. Correction factor = Insertion loss + Cable loss 5. Emission Level = Correction Factor + Reading Value

Report No.: RF170503C46 Page No. 24 / 30 Report Format Version: 6.1.1
Frequency Range 150kHz ~ 30MHz Detector Function & Resolution Bandwidth
Quasi-Peak (QP) / Average (AV), 9kHz
Input Power 120Vac, 60Hz Environmental Conditions 25℃, 65%RH
Tested by Getaz Yang Test Date 2017/5/17
Phase Of Power : Neutral (N)
No Frequency
Correction
Factor Reading Value
(dBuV) Emission Level
(dBuV) Limit
(dBuV) Margin
(dB) (MHz) (dB) Q.P. AV. Q.P. AV. Q.P. AV. Q.P. AV. 1 0.15000 10.10 36.15 22.40 46.25 32.50 66.00 56.00 -19.75 -23.50 2 0.19367 10.14 34.53 17.86 44.67 28.00 63.88 53.88 -19.21 -25.88 3 0.36544 10.16 28.59 10.05 38.75 20.21 58.60 48.60 -19.85 -28.39 4 0.49400 10.16 27.69 24.05 37.85 34.21 56.10 46.10 -18.25 -11.89 5 3.28200 10.30 21.10 5.30 31.40 15.60 56.00 46.00 -24.60 -30.40 6 13.56200 10.69 31.98 20.14 42.67 30.83 60.00 50.00 -17.33 -19.17
Remarks: 1. Q.P. and AV. are abbreviations of quasi-peak and average individually. 2. The emission levels of other frequencies were very low against the limit. 3. Margin value = Emission level – Limit value 4. Correction factor = Insertion loss + Cable loss 5. Emission Level = Correction Factor + Reading Value

Report No.: RF170503C46 Page No. 25 / 30 Report Format Version: 6.1.1
4.3 Frequency Stability
4.3.1 Limits of Frequency Stability Measurement
The frequency tolerance of the carrier signal shall be maintained within +/- 0.01 % of the operating frequency over a temperature variation of –20 degrees to 50 degrees C at normal supply voltage, and for a variation in the primary supply voltage from 85 % to 115% of the rated supply voltage at a temperature of 20 degrees C.
4.3.2 Test Setup
4.3.3 Test Instruments
Refer to section 4.1.2 to get information of above instrument.
4.3.4 Test Procedure
a. The EUT was placed inside the environmental test chamber and powered by nominal DC voltage. b. Turned the EUT on and coupled its output to a spectrum analyzer. c. Turned the EUT off and set the chamber to the highest temperature specified. d. Allowed sufficient time (approximately 30 min) for the temperature of the chamber to stabilize then turned
the EUT on and measured the operating frequency after 2, 5, and 10 minutes. e. Repeated step 2 and 3 with the temperature chamber set to the lowest temperature. f. The test chamber was allowed to stabilize at +20 degree C for a minimum of 30 minutes. The supply
voltage was then adjusted on the EUT from 85 % to 115 % and the frequency record.
4.3.5 Deviation fromTest Standard
No deviation.
4.3.6 EUT Operating Conditions
a. Placed the EUT on the testing table. b. Set the EUT under transmission condition continuously at specific channel frequency.
Spectrum Analyzer
DC Power Supply
Temperature Chamber

Report No.: RF170503C46 Page No. 26 / 30 Report Format Version: 6.1.1
4.3.7 Test Result
Frequency Stability Versus Temperature
Temp. (℃)
Power Supply (Vdc)
0 Minute 2 Minute 5 Minute 10 Minute
Measured Frequency
Frequency Drift
Measured Frequency
Frequency Drift
Measured Frequency
Frequency Drift
Measured Frequency
Frequency Drift
(MHz) % (MHz) % (MHz) % (MHz) %
50 7.2 13.560058 0.00043 13.560047 0.00035 13.560056 0.00041 13.560059 0.00044
40 7.2 13.560036 0.00027 13.560022 0.00016 13.560024 0.00018 13.560044 0.00032
30 7.2 13.559972 -0.00021 13.559968 -0.00024 13.559955 -0.00033 13.559964 -0.00027
20 7.2 13.560055 0.00041 13.560038 0.00028 13.560038 0.00028 13.560055 0.00041
10 7.2 13.560041 0.00030 13.560043 0.00032 13.560042 0.00031 13.560038 0.00028
0 7.2 13.559964 -0.00027 13.559955 -0.00033 13.559962 -0.00028 13.559969 -0.00023
-10 7.2 13.560036 0.00027 13.560031 0.00023 13.560035 0.00026 13.560022 0.00016
-20 7.2 13.559944 -0.00041 13.559946 -0.00040 13.559929 -0.00052 13.559934 -0.00049
-30 7.2 13.560057 0.00042 13.560054 0.00040 13.560042 0.00031 13.560063 0.00046
Frequency Stability Versus Voltage
Temp. (℃)
Power Supply (Vdc)
0 Minute 2 Minute 5 Minute 10 Minute
Measured Frequency
Frequency Drift
Measured Frequency
Frequency Drift
Measured Frequency
Frequency Drift
Measured Frequency
Frequency Drift
(MHz) % (MHz) % (MHz) % (MHz) %
20
8.2 13.560056 0.00041 13.560038 0.00028 13.560035 0.00026 13.560052 0.00038
7.2 13.560055 0.00041 13.560038 0.00028 13.560038 0.00028 13.560055 0.00041
6.6 13.560055 0.00041 13.560037 0.00027 13.560039 0.00029 13.560055 0.00041

Report No.: RF170503C46 Page No. 27 / 30 Report Format Version: 6.1.1
4.4 20 dB Bandwidth
4.4.1 Limits of 20 dB Bandwidth Measurement
The 20 dB bandwidth shall be specified in operating frequency band. 4.4.2 Test Setup
Refer to section 4.1.5.
4.4.3 Test Instruments
Refer to section 4.1.2 to get information of above instrument.
4.4.4 Test Procedures
The bandwidth of the fundamental frequency was measured by spectrum analyzer with 1 kHz RBW and 3 kHz VBW. The 20 dB bandwidth is defined as the total spectrum the power of which is higher than peak power minus 20 dB.
4.4.5 Deviation from Test Standard
No deviation.
4.4.6 EUT Operating Conditions
a. Placed the EUT on the testing table. b. Set the EUT under transmission condition continuously at specific channel frequency.

Report No.: RF170503C46 Page No. 28 / 30 Report Format Version: 6.1.1
4.4.7 Test Results
20 dBc Point (Low) 20 dBc Point (High) Operating Frequency Band
(MHz) Pass / Fail
13.558557692MHz 13.561153846 MHz 13.553~13.567 Pass
Spectrum Plot Of Value
Att 5 dB
A
Ref 87 dBµV
Center 13.56 MHz Span 20 kHz2 kHz/
SWT 20 ms
*
*
RBW 1 kHzVBW 3 kHz
3DB
1 APVIEW
-10
0
10
20
30
40
50
60
70
801
Marker 1 [T1 ] 73.50 dBµV 13.559903846 MHz
2
Marker 2 [T1 ] 53.45 dBµV 13.558557692 MHz
3
Marker 3 [T1 ] 53.57 dBµV 13.561153846 MHz
D1 73.5 dBµV
D2 53.5 dBµV
Date: 23.MAY.2017 01:43:54

Report No.: RF170503C46 Page No. 29 / 30 Report Format Version: 6.1.1
5 Pictures of Test Arrangements
Please refer to the attached file (Test Setup Photo).

Report No.: RF170503C46 Page No. 30 / 30 Report Format Version: 6.1.1
Appendix – Information on the Testing Laboratories
We, Bureau Veritas Consumer Products Services (H.K.) Ltd., Taoyuan Branch, were founded in 1988 to provide our best service in EMC, Radio, Telecom and Safety consultation. Our laboratories are accredited and approved according to ISO/IEC 17025. If you have any comments, please feel free to contact us at the following: Linko EMC/RF Lab Tel: 886-2-26052180 Fax: 886-2-26051924
Hsin Chu EMC/RF/Telecom Lab Tel: 886-3-6668565 Fax: 886-3-6668323
Hwa Ya EMC/RF/Safety Tel: 886-3-3183232 Fax: 886-3-3270892
Email: [email protected] Web Site: www.bureauveritas-adt.com
The address and road map of all our labs can be found in our web site also. --- END ---