Faulty Measurements and Shaky Tools: An Exploration into ...
144
Portland State University Portland State University PDXScholar PDXScholar Dissertations and Theses Dissertations and Theses Summer 8-27-2013 Faulty Measurements and Shaky Tools: An Faulty Measurements and Shaky Tools: An Exploration into Hazus and the Seismic Exploration into Hazus and the Seismic Vulnerabilities of Portland, OR Vulnerabilities of Portland, OR Brittany Ann Brannon Portland State University Follow this and additional works at: https://pdxscholar.library.pdx.edu/open_access_etds Part of the Geophysics and Seismology Commons, Urban, Community and Regional Planning Commons, and the Urban Studies and Planning Commons Let us know how access to this document benefits you. Recommended Citation Recommended Citation Brannon, Brittany Ann, "Faulty Measurements and Shaky Tools: An Exploration into Hazus and the Seismic Vulnerabilities of Portland, OR" (2013). Dissertations and Theses. Paper 1410. https://doi.org/10.15760/etd.1410 This Thesis is brought to you for free and open access. It has been accepted for inclusion in Dissertations and Theses by an authorized administrator of PDXScholar. Please contact us if we can make this document more accessible: [email protected].
Transcript of Faulty Measurements and Shaky Tools: An Exploration into ...

Portland State University Portland State University
PDXScholar PDXScholar
Dissertations and Theses Dissertations and Theses
Summer 8-27-2013
Faulty Measurements and Shaky Tools: An Faulty Measurements and Shaky Tools: An
Exploration into Hazus and the Seismic Exploration into Hazus and the Seismic
Vulnerabilities of Portland, OR Vulnerabilities of Portland, OR
Brittany Ann Brannon Portland State University
Follow this and additional works at: https://pdxscholar.library.pdx.edu/open_access_etds
Part of the Geophysics and Seismology Commons, Urban, Community and Regional Planning
Commons, and the Urban Studies and Planning Commons
Let us know how access to this document benefits you.
Recommended Citation Recommended Citation Brannon, Brittany Ann, "Faulty Measurements and Shaky Tools: An Exploration into Hazus and the Seismic Vulnerabilities of Portland, OR" (2013). Dissertations and Theses. Paper 1410. https://doi.org/10.15760/etd.1410
This Thesis is brought to you for free and open access. It has been accepted for inclusion in Dissertations and Theses by an authorized administrator of PDXScholar. Please contact us if we can make this document more accessible: [email protected].

Faulty Measurements and Shaky Tools: An Exploration into Hazus and the Seismic
Vulnerabilities of Portland, OR
by
Brittany Ann Brannon
A thesis submitted in partial fulfillment of the
requirements for the degree of
Master of Urban Studies
Thesis Committee:
James Strathman, Chair
Carl Abbott
David Banis
Portland State University
2013

i
Abstract
Events or forces of nature with catastrophic consequences, or “natural disasters,” have
increased in both frequency and force due to climate change and increased urbanization
in climate-sensitive areas. To create capacity to face these dangers, an entity must first
quantify the threat and translate scientific knowledge on nature into comprehensible
estimates of cost and loss. These estimates equip those at risk with knowledge to enact
policy, formulate mitigation plans, raise awareness, and promote preparedness in light of
potential destruction. Hazards-United States, or Hazus, is one such tool created by the
federal government to estimate loss from a variety of threats, including earthquakes,
hurricanes, and floods. Private and governmental agencies use Hazus to provide
information and support to enact mitigation measures, craft plans, and create insurance
assessments; hence the results of Hazus can have lasting and irreversible effects once the
hazard in question occurs. This thesis addresses this problem and sheds light on the
obvious and deterministic failings of Hazus in the context of the probable earthquake in
Portland, OR; stripping away the tool’s black box and exposing the grim vulnerabilities it
fails to account for.
The purpose of this thesis is twofold. First, this thesis aims to examine the critical flaws
within Hazus and the omitted vulnerabilities particular to the Portland region and likely
relevant in other areas of study. Second and more nationally applicable, this thesis
intends to examine the influence Hazus outputs can have in the framing of seismic risk by
the non-expert public. Combining the problem of inadequate understanding of risk in
Portland with the questionable faith in Hazus alludes to a larger, socio-technical situation

ii
in need of attention by the academic and hazard mitigation community. This thesis
addresses those issues in scope and adds to the growing body of literature on defining
risk, hazard mitigation, and the consequences of natural disasters to urban environments.

iii
Acknowledgments
It took less than six minutes for a tornado to ravage my home town; taking with it my
home, high school, and many of the surroundings I held dear. This EF5 tornado met
Parkersburg, IA on Sunday, May 25, 2008 at 4:59pm, exactly one week after I graduated
high school. Five years later, Parkersburg has returned to vibrancy, and has rebuilt itself
beautifully. Yet scars remain. Half of the town has deformed or nonexistent trees. Some
residents have chosen not to rebuild, or did not have sufficient insurance money to restore
their homes properly. Non-physical, psychological scars also permeate Parkersburg
dwellers. Residents, including myself, still feel anxiety when a storm siren goes off, or
when witnessing similar tornado disasters in other Midwestern towns. Lives were altered
and fears were realized on that sunny day.
Sadly, these events are increasing in frequency and magnitude. Parkersburg is not a
unique case. Forces of climate change continue to alter weather patterns and cause
destruction in towns, cities, homes, and neighborhoods; all beloved areas assumed to be
immune to destruction by their inhabitants. Thus planning for these disasters is of
extreme importance in the mitigation process; a process that I would like to see
improved.
I do not want to thank Mother Nature for leading me here, but I do acknowledge the
influence she has had in my life. I would not be the person I am now were it not for that
fateful day. Adversity is a strong motivator, and I have been driven accordingly.
I would also like to thank the beautiful people that have inspired, motivated, and
supported me throughout this process. I thank my mother for her passion and my father

iv
for his rationality; both traits I have discovered in myself and extremely grateful for.
Their love and care cannot be described in words, and I am eternally indebted to their
sponsorship. Thank you to my siblings, who have kept me sane for the past twenty-three
years, and provided me with fantastic role models to look up to. Lastly, my indescribable
friends that were there with me on that fateful day and are my rocks in life – Abby, Sam,
and Jordan – their camaraderie continues to amaze me. I am incredibly blessed.
Lastly, I would like to acknowledge all those affected by natural disasters. The pain that
is felt in these events is indescribable. I hope that the future will be brighter; that we can
mitigate these events, reduce their effect, and realize the impact climate change and
knowledge perception has on mitigation efforts. The prosperity of future generations
depends on it.

v
Table of Contents
Abstract ................................................................................................................................ i
List of Figures ................................................................................................................... vii
List of Tables ................................................................................................................... viii
Introduction ...................................................................................................................... viii
I. Problem .................................................................................................................... 1
II. Organization and Methods ....................................................................................... 5
III. Relevance ............................................................................................................. 7
IV. Conclusion ............................................................................................................ 8
Chapter 1: Conceptualizing Risk ...................................................................................... 10
I. Hazards and Risk: A Theoretical Review .............................................................. 11
II. Decrease Risk and Increase Resilience .................................................................. 20
III. Modeling Risk According to Economic Metrics................................................ 24
IV. Conclusion .......................................................................................................... 28
Chapter 2: Geology, Earthquakes and Building Resilience in Oregon ............................. 29
I. The Evolution of National Earthquake Knowledge ............................................... 29
II. A Brief Earthquake Lesson .................................................................................... 35
III. Pacific Northwest Earthquake Awareness ......................................................... 37
IV. Precarious Predictions ........................................................................................ 47
V. The Built Environment vs. the Environment: Mitigating Structural Risk ............. 52
VI. Taking Action – Local, State, and National Policy on Earthquake Risk ........... 57
VII. Conclusion .......................................................................................................... 65
Chapter 3: Hazus as a Tool ............................................................................................... 67
I. Hazus History......................................................................................................... 67
II. Current HAZUS Earthquake Model ...................................................................... 70
a. General Scope .................................................................................................... 70
b. Hazus Inventory Data ......................................................................................... 75
III. Hazus Methods ................................................................................................... 81
a. Potential Earth Science Hazards ........................................................................ 82

vi
b. Direct Physical Damage – Building Stock, Essential Facilities, Transportation,
and Utility Lifeline Systems ...................................................................................... 84
c. Indirect Physical Damage – Hazards Resulting from Earthquakes.................... 88
d. Direct Loss – Casualties and Displacement ....................................................... 90
e. Direct and Indirect Economic Losses................................................................. 96
IV. Conclusion ........................................................................................................ 103
Chapter 4: Hazus Critique and Analysis ......................................................................... 105
I. Data ...................................................................................................................... 106
II. Additional Hazards .............................................................................................. 110
III. Measuring Casualties ....................................................................................... 116
IV. Conclusion ........................................................................................................ 121
Conclusion ...................................................................................................................... 124

vii
List of Figures
Figure 2.1 Organizations and Functions within NEHRP…………………………….34
Figure 2.2 Lithosphere descent……………………………………………………….36
Figure 2.3 Extent of Earthquake Awareness in Oregon, 1987……………………….39
Figure 2.4 Extent of Earthquake Awareness in Oregon, 1987……………………….40
Figure 2.5 The Movement of Juan de Fuca…………………………….…………….43
Figure 2.6 Plates Around the World………………………………………………….42
Figure 2.7 Local Faults in Portland, OR……………………………………………...45
Figure 2.8 Ariel View of Portland Faults……………………………………………..46
Figure 2.9 Japan as Oregon’s Mirror…………………………….……………………49
Figure 3.1 Hazus Methodology…………………………….…………………………75
Figure 3.2 Hazus Casualty Event Tree Model…………………………….…………..93

viii
List of Tables
Table 3.1 Hazus Modules and Outputs………………………………………………..74
Table 3.2 2000 Census Data…………………………….……………………………..80
Table 3.3 Injury Levels Calculated in Hazus…………………………….…………….92
Table 3.4 User-Supplied Inputs for Calculating Economic Loss……………………..101

1
Introduction
I. Problem
The city of Portland, Oregon is facing a looming threat from nature in the form of an
earthquake. This earthquake threatens multiple cities and locations within the Pacific
Northwest due to the region’s placement atop the Cascadian Subduction Zone. This zone
comprises of the most dangerous fault lines in the United States, running 600 miles from
northern California, along the Oregon and Washington Coast, and into Canada (Montoya
2011). The state of Oregon is estimated to have a 10% chance of a magnitude 9
earthquake over the next 50 years, and a 37% chance of a magnitude 8 or less in the same
time period (OPB 2012). In addition to the Cascadian threat, the city of Portland was
built upon three shallow faults that coincidentally cut beneath the most populated parts of
the city. Geologists estimate the local faults to be less of a threat, yet still necessitate
cause for concern (Rojas-Burke 2011).
Due anxiety has arisen among residents and government officials alike in response to
these estimations. The potential danger to human life and the built environment are hard
to imagine, yet necessary to consider. Some of the harrowing facts on Portland’s
vulnerabilities are as follows:
Portland currently has approximately 1200 unreinforced masonry buildings, all of
which would likely collapse in the instance of a large earthquake. Many of these
buildings include schools, businesses, and homes (OPB 2012).
Roughly half of downtown Portland is on potentially liquefiable soils (OPB
2012).

2
Forty percent of Portland’s schools are prone to collapse in the case of an 8.0-
magnitude quake (Montoya 2011).
Portland is a city of bridges, many of which are likely to collapse unless properly
retrofitted in the near future (Montoya 2011).
These facts, among many others, are but a few of the reasons to be concerned about the
risk from the inevitable quake. Earthquakes cause unimaginable destruction and leave
lasting economic, social, and psychological scars on residents and cities.
Portland’s earthquake risk embodies extreme uncertainty, however. The randomness of
earthquakes and incomplete geographic knowledge both globally and within Portland
completely negates the ability to predict these events and their precise effect on the built
environment. Accordingly, the governing bodies in Portland have expressed their concern
and taken action to raise awareness among residents and businesses in hopes of
countering the uncertainty and reduce vulnerabilities. Grassroots organizations have also
played an important role in communicating seismic risk and lobbying for increased state
effort.
It is impossible for politicians, grassroots members, stakeholders, and the public at large
to adequately comprehend the risks at hand. Understanding seismic threats to cities
requires intricate and esoteric knowledge on seismicity, geology, and engineering. Thus
tools exist to combine and translate these threads of knowledge into tangible numbers
understood by the greater public. Problems arise, however, when the tools estimating loss
are grossly inaccurate and fail to account for all hazards.

3
The tool most commonly employed by government agencies and others to assess and
communicate risk is the ArcGIS extension “Hazards-United States,” or more commonly
known as Hazus. This tool is a nationally applicable standardized methodology that
contains models for estimating potential losses from earthquakes, floods, and hurricanes
(FEMA 2012b). Hazus was first developed in the 1990’s exclusively for earthquakes and
has been expanded to include other hazards within the past ten years. The scope of this
thesis pertains only to the earthquake model, yet many of the details, methodologies, and
criticisms could apply to the other hazards.
Specifically, Hazus is a computational algorithm built around an input-output
transactions table and incorporates numerous loss accounting principles (Cochrane 2004).
Algorithms in Hazus operate using complex formulas according to the magnitude of
quake, location of fault line, time of day, and day of the week (FEMA 2012). The
complexities of these algorithms, details on each factor, and examination into missing or
unnecessary factors will be elaborated upon and explored in subsequent chapters.
In the context of an earthquake, Hazus will produce estimates such as the following:
Structural repair costs ($ per square foot) for the region’s buildings;
Non-structural repair costs ($ per square foot) for all occupancies;
Value of building contents as a percentage of building replacement value of
overall occupancies;
Business inventory damage as a function of damage state for agricultural,
commercial, and industrial occupancies.
Many beneficial outputs are provided through Hazus. Plans and insurance assessments
for neighborhoods, cities, states, and other geographic regions are created based off of the

4
tool’s outputs and estimations, thus the information Hazus provides is understandably
powerful. Yet further inquiry must be performed. Concern arises over the effectiveness of
the tool, especially given the Office of Management and Budget rating of Hazus as
merely “moderately effective” at estimating hazard risk (Moffatt and Laefer 2009).
Therefore it is left to be wondered how Hazus received this rating, why it is inadequate at
estimating risk to the built environment, and which vulnerabilities it fails to account for.
The inaccuracy of Hazus is especially concerning given the “black box” status allotted to
it by planners and government agencies. Tools such as Hazus are often accused by
scholars as being “black-boxed” due to the tendency of users to place complete trust in
complicated tools and neglect to question their potential faults or weaknesses. As noted
by Bastrom et al. (2006), private, local, and federal agencies use Hazus to provide
financial information and support regarding earthquake mitigation measures; hence the
results of Hazus can have lasting and irreversible effects once the earthquake in question
occurs. This thesis addresses this problem and sheds light on the obvious and
deterministic failings of Hazus, thereby stripping away the black box and exposing the
grim vulnerabilities it fails to account for.
The purpose of this thesis is twofold. First, to examine the critical flaws within Hazus and
the omitted vulnerabilities in the tool that are particular to the Portland region and likely
relevant in other regions. Second and more nationally applicable, this thesis intends to
examine the influence Hazus outputs can have in the framing of seismic risk by the non-
expert public. Combining the problem of inadequate understanding of risk in Portland
with the questionable faith in Hazus alludes to a larger, socio-technical situation in need

5
of attention by the academic and hazard mitigation community. This thesis will address
those issues in scope and add to the growing body of literature on defining risk, hazard
mitigation, and the consequences of environmental hazards within urban environments.
The questions asked by the thesis are as follows: (1) How is seismic risk perceived by the
public and how does the framing of risk affect their decisions? (2) Is Hazus an accurate
tool for assessing and communicating risk? (3) What vulnerabilities does Hazus fail to
account for in the Portland region and how adequately has Portland addressed these
risks? These questions have guided the research and analytic process employed in this
thesis, and serve as overarching parameters for the study’s scope.
II. Organization and Methods
This thesis is an exploration into the technological success and failure of Hazus, with
specific attention given to the tool’s ability to account for all risks and vulnerabilities
within the Portland Metro region. A mixed methods approach was used for analysis, with
each chapter building upon information presented prior. Research for this thesis was
performed using content analysis of existing sources, and supplemented by interviews
with relevant personnel.
Examination on risk assessment performed by other scholars has not been as
comprehensive as the analysis set forth here. To further investigate Hazus, the methods
employed will synthesize previous literature, and incorporate measures and assessments
that are both qualitative and quantitative in nature. Therefore the thesis has been divided
into four distinct parts according to method and necessary objectives.

6
Chapter 1 of the thesis presents a sound review of hazard mitigation literature and risk
theory. Multiple sources were consulted for the literature review, including books, peer-
reviewed articles, government publications, and non-governmental organization reports.
The topic of resiliency is presented to shed light on the buzzword’s increasing importance
in disaster mitigation efforts and risk awareness. Lastly, the use of economic loss as a
metric to communicate risk is explored as pretext for discussion and analysis of Hazus.
These elements are necessary in order to build a foundation for the subsequent
exploration of risk within Portland and Oregon.
Chapter 2 provides a historical overview of the evolution of earthquake knowledge and
policy in Portland and Oregon. This information was gathered through research of
geologic text, existing historical accounts, academic literature, and archival research
within Oregon historical records. This chapter also provides an account of national, state,
and local seismic policy relevant to the Portland region to link earthquake knowledge and
awareness with legislative and grassroots action. This background information is vital in
the assessment of Hazus for three reasons. First, the geologic and seismic information
grants essential scientific perspective to understanding the danger earthquakes pose to the
built environment. Second, a basic understanding of geologic knowledge is necessary to
comprehend the schemes employed by Hazus to model nature’s anticipated behavior.
Lastly, information on policy and historical awareness of earthquake hazards in Portland
is necessary to analyze the factors that influence public risk perception and political
mitigation efforts.

7
The information on geologic and seismic knowledge given in Chapter 2 provides context
and structure for understanding the models used in Hazus, presented in Chapter 3. This
chapter was built through an extensive review of the 700+ page Hazus software
handbook, and required translating the handbook from purely geologic and engineering
speak and into a non-expert, readable, and summarized format. The chapter was also
supplemented by literature on Hazus, risk estimation, and modeling methods. The
complete analysis of the handbook is essential to this thesis, as it allowed exploration into
the inadequacies of the software and the ability of these inadequacies to have adverse
effects on the model’s output.
An analytic lens is turned to the Hazus software in Chapter 4 to assess its practicality as a
tool for policymakers and planners. The analysis presented in Chapter 4 incorporates
literature on seismic hazards, information from recent earthquakes, and Portland-specific
vulnerabilities to test against the gaps discovered in Hazus. This is essential to the hazard
estimation process and communication of risk, as failing to account for specific elements
prevents complete understanding of a region’s vulnerabilities. Thus the final synthesis
combines analyses from a variety of sources to derive a conclusion on Hazus, its
effectiveness in communicating risk, and Portland’s status as a seismically vulnerable
city.
III. Relevance
The risks posed to society by nature are obvious, yet our methods for preparing for those
risks and preventing maximum damage must be continuously questioned. Questions must

8
be asked to the holders of the knowledge, tools, and power to prepare the greater public
and ensure the ultimate amount of safety. Portland, along with the greater United States,
must realize the power embedded in planning for the known risks. The use of Hazus and
mapping in this process has had a profound effect on mitigation and risk assessment in
the past twenty years, and will continue to affect a region’s response and recovery as
disasters increase in frequency and magnitude. Therefore the questioning of this tool is of
vital importance to the academic realm, disaster management field, and safety of the
greater public.
This thesis will add to the growing field of risk theory, science and technology studies,
emergency management, and hazard preparation in multiple ways. The unprecedented
analysis of Hazus on a conceptual level will shed light on the tool’s functionality and
failures while providing information to those using it both in Portland and across the
nation. Equally important is the examination of particular vulnerabilities in Portland that
Hazus fails to account for and communicate to the public. The conclusions presented in
this thesis are thus valuable in both a theoretical and practical sense.
IV. Conclusion
It is unnecessary to repeat the statistics and fear-mongering hypotheses on Portland’s
pending earthquake. It is, however, absolutely necessary to realize the power embedded
in hazard framing mechanisms and the neglect of governing structures to adequately
prepare for natural disasters. A whole host of strategies converge to help society and
cities better prepare for a range of risk. A community’s capacity to be prepared for,

9
respond to, and recover from these horrendous events depends on the actions of
institutions and their efforts to equip communities with necessary information and
support.
No city can become disaster proof. Steps can be taken, however, to assure that
governments, residents, and the built environment are conscious of the pending dangers
and act in the best way to minimize that danger. Hazus is but one of the tools agencies
use to influence mitigation decisions and quantify potential danger, casualties, and cost.
In reality, the worth of the human lives and cities threatened by natural disaster risk is
monetarily immeasurable and impossible to completely safeguard. I can only hope that
the exploration provided in this thesis can contribute to our understanding of natural
disasters in order to move forward in protecting what we can, and realizing the dangers in
the unknowable.

10
Chapter 1: Conceptualizing Risk
The attempts to quantify the impact of nature on humans range from purely theoretical
notions of risk and natural destruction to scientific laws that cement nature’s wielding
capabilities. The realm of disaster planning and risk assessment attempts to merge the
fields of human interaction with the laws of nature through the use of geological and
meteorological knowledge, assessment of the built environment, and the study of human
behavior and patterns.
A variety of scholarly fields have been involved in studying these phenomena, including,
but not limited to, geography, sociology, systems science, psychology, earth science,
urban studies, and economics. The methods employed in each field vary on the spectrum
of qualitative vs. quantitative, thereby typically making most work interdisciplinary in
scope. The research and production of new knowledge on this topic is intended for
policy-makers as they attempt to create resilient and disaster ready entities. Accordingly,
tools to aid in the preparation and resiliency-building process have been produced by
various academics and agencies with the hope of preventing loss prior to environmental
disasters and improving mitigation methods after destructive events occur. Hazards-
United States, or more commonly known as Hazus, is one such tool used to translate the
multiple variables contributing to risk into logical estimations of cost, casualties, and
effects to the region of study.
This chapter introduces literature regarding the theoretical notions of risk, the attempts to
build “resiliency” to combat risk in the built environment, and the framings used to

11
communicate risk to the general public. This exploration is necessary to provide a
conceptual background and justification for the thesis.
I. Hazards and Risk: A Theoretical Review
The following section will discuss the means by which “risk” to the built environment is
defined according to literature produced by a variety of disciplines including urban
studies, sociology, psychology, and economics. The variety of fields required to study
risk is necessary due to the multifaceted nature of natural disasters and the effects they
have on society. This section examines natural disaster risk by stratifying it according to
individual, collective, and state perceptions. The levels of risk perception are important to
consider due to their ability to influence disaster response and recovery.
The literature on perceived risk and its impact upon policymakers can be separated into
three strands as defined by Jasanoff (1999). The first form of critique is taken in a
positivist light and assesses the bureaucratic-rationalistic policy implications of risk,
seeing it as a tangible by-product of actually occurring natural and social processes. The
second explanation of risk grounds itself in scientific knowledge, proposing that liberal
and pluralistic solutions can be formed by combining knowledge with action. Finally, risk
is critiqued by scholars in a constructivist manner through examining the relationship
between knowledge and power in the use of risk mitigation strategies (Jasanoff 1999).
These three strands differ in a theoretical sense with respect to the nature of
environmental knowledge and also in their prescriptions for linking knowledge to
political action. The differences in defining risk are important to note due to the potential

12
framing of risk by policymakers, planners, and scholars and their influence on the
public’s perception of the hazard at hand.
Jasanoff’s first strand of risk, that produced by the intersection of nature and the built
environment, has been defined and elaborated on in Charles Perrow’s 1984 book, Normal
Accidents. Perrow terms the end occurrence from risk as an “eco-system accident”. These
“accidents” are a result of an interaction of systems thought of as independent, but in
reality are dependent upon each other within the built environment due to the tight
coupling between human-made and natural systems. Risk in this sense is purely physical,
as it focuses on interactions between the nature and the built environment.
Jasanoff’s second strand of risk, on the combination of knowledge and action, has taken
particular interest in the realm of sociology. May (2001), observed that determining
levels of risk is a value judgment that requires some form of collective decision making
and knowledge of relevant risk considerations, technical details, and costs. Individual
knowledge on a hazard will influence perception, perception of the hazard will influence
preemptive action, and action determines ability to cope with a hazard if and when it
occurs.
Yet substantial action to reduce risk may depend more on local politics and power than
on the technical measures of earthquake risk noted in the first strand, or individual
actions noted in the second (Bostrom, Turaga, and Ponomariov 2006). Thus Jasanoff’s
last strand of risk, regarding hazard knowledge and power to act on that knowledge, must
be considered. Past disasters and events present this strand exceptionally well. For

13
example, state knowledge on hazard risk has been used to enact evictions or forced action
regardless of the uncertainty of the hazard. Zeiderman (2011) takes particular notice of
eviction methods in the city of Bogota, Columbia. His analysis notes how 10,715
properties within Bogota’s slum districts were forced to move as a result of the city
planners’ perceived landslide risk (Zeiderman 2012). Similarly, Davis, in his 2007 book,
Planet of Slums, notes the gargantuan slums of the world’s largest cities and how these
cities have evicted the urban poor in the name of building natural disaster resilience or
decreasing risk. Forced evictions are extreme cases of the negative and unjust actions that
can occur as a result of misinformed information through hazard estimation tools such as
Hazus.
Scholars within the field of science, technology, and society (STS) studies have only
recently studied the power relationships involved with disaster planning. Their research
highlights the lack of academic study on disaster science, expertise on risk planning, and
the knowledge of the two in shaping the built environment. As noted by Fortun and
Frickel (2012), the failure of the academic community to question the holders of risk
knowledge in planning is disconcerting. The academic realm could contribute to this field
and have great relevance in understanding how technoscientific knowledge, experts
holding this knowledge, and institutions interpreting the knowledge prepare for and
respond to catastrophic events (Fortun and Frinkel 2012). This relationship is currently of
questionable status and in need of additional study. Fortun and Frinkel note, “Given the
critical role of technoscientific expertise in assisting governments and communities to
better understand the nature of disaster events, honing effective responses to disaster, and

14
reducing social vulnerabilities to disaster, this mismatch arguably constitutes a form of
inequality that can have profound geopolitical, economic, and humanitarian impacts.”
The impacts Fortun and Frinkel warn of range from the forced evictions in Bogota to
under-preparation in Katrina; both of which have lasting and irreversible consequences
on the communities affected.
In a perfect world, all governments would do everything in their capacity to protect their
residents from the risk embedded in nature. In reality, governments and citizens are
constrained by a variety of factors that prevent them from fostering a danger-free society.
They must prioritize and weigh risk in light of particular constraints. May (2001) notes
that determining risk is a judgment requiring the following: participative and collective
decision-making; knowledge of the relevant risk and technical details; and costs and
benefits to establish meaningful standards to countering risk (May 2001). In this context,
earthquake mitigation policy is constrained by low public perception and understanding,
high upfront costs, uncertain benefits of mitigation actions, lack of technical and financial
resources, competing interests among stakeholders, and differences in the values of the
population (Bostrom, Turaga, and Ponomariov 2006). As a result of incomplete
knowledge and competing interests, decisions to enact policy are NOT made through the
explicit expression of concern for consequences. Rather, decisions are made with regard
to a given context and set of options constrained by available resources and attitudes,
thereby revealing a level of acceptable consequences. A community’s vulnerability can
be considered a function of wealth, since the mitigation choices will be framed as a
question of how much safety the community or region can afford.

15
Scale must also be considered when analyzing risk. The perception of risk on a societal
and public welfare level varies substantially from the perception of risk by individuals.
Specifically, individual preparation for earthquakes calls for purchasing of earthquake
insurance, performing household seismic upgrades, and creating family-based mitigation
plans. In the context of an earthquake, individuals sometimes have economic incentives
to reduce losses, but the calculus of decision making is such that a host of perceptual
factors alter their rationality (May 2001). The collective level scale for preparation and
risk mitigation, at the very least, calls for minimum seismic safety standards
communicated in building codes, strategic mitigation plans produced by emergency
management bureaus, and promotion of basic seismic safety and awareness. These efforts
done at the collective scale will signal to individuals the importance of the risk at hand.
Yet disconnect exists between the effect of mass, state initiated measures and those done
by the individual. Most often, the elements most endangering the public can only be
overcome or mitigated by government will. For example, the seismic capacity of a
locality’s public utilities and infrastructure can only be improved through large and
expensive infrastructure improvements. Thus enacting influential risk reduction strategies
presents a collective action problem, since individuals will not have the capacity to make
the improvements unless they unite to persuade the government to take action. Despite
the heightened benefit of massive, state-oriented improvements, governments will choose
to push preparedness and risk mitigation onto the individual level due to the high upfront
costs and uncertain benefits. Soft strategies to build individual resiliency are promoted

16
instead (i.e. storing personal water supplies or safety kits), as they are cheaper and require
fewer resource commitments from the state.
The divide between hard and soft strategies was demonstrated unambiguously in
Portland, OR through a survey performed by Flynn (1999). Flynn found strong support
for the suggestion that the city provide “better public earthquake information programs”
and “better community emergency preparedness.” Conversely, the majority of
respondents opposed the idea of mandatory strengthening of privately owned buildings.
This implies that individuals prefer grand soft solutions to mitigating risk as opposed
more expensive and physical initiatives such as seismic upgrades that would be more
expensive yet have a larger impact on safety in the long-run (Flynn et al. 1999). The
public can therefore be expected to have varying support for mitigation and risk reduction
strategies according to their perception of the risk at hand and price tag of the strategies
proposed.
Steinberg, in the 2000 book Acts of God: The Unnatural History of Natural Disasters in
America, elaborates on the problems of collective action to persuade government policy
from a historical standpoint. His narrative details the divide between holders of risk
knowledge at the governance level, and the decision to disregard that knowledge despite
its ability to influence the effects of natural disasters. He notes how natural calamities do
not just happen, but are produced through a chain of human choices on multiple levels
and natural occurrences, and Steinberg questions these relationships in a chronicle of
various cities. As he notes, “The constrained vision of responsibility, and the belief that
disasters stem solely from random natural forces, is tantamount to saying that they lie

17
entirely outside human history, beyond our influence, beyond moral reason, and beyond
control.” (T. Steinberg 2006). Steinberg places a large amount of blame on the
government’s ignorance and inability to act or remove risk from the public, and sees the
individual-level strategies as inadequate to risk reduction.
Wetmore (2007) highlighted the lack of individual vs. state oriented accountability and
coordination in the status of New Orleans pre and post Katrina. Each level of actors
perceived the city’s risk differently, thus their actions did not cohesively form into a
successful mitigation and recovery plan. Westmore states, “Contemporary societies have
not developed a good sense of how to deal with distributed responsibilities that are a
necessary part of any complex system.”(Wetmore 2007). As noted, the responsibilities of
the state, local, and federal levels of government are palpably different than those taken at
the individual level, especially in a post-disaster situation.
The manifestation of personal vs. societal risk perception on the individual side is
supremely evident in the decision to purchase insurance in anticipation of an earthquake.
This topic has gathered considerable attention by economists due to the unique and
uncertain environment that individuals must operate in (Palm 1995). For example, some
individuals may choose to forego insurance and take on the risk of a major catastrophe by
assuming disaster assistance will come from the federal government or a non-
governmental organization. Others may not see a large risk, and underestimate their true
loss probability (Picard 2008). To purchase insurance, a consumer must be seen as
assessing the probability of loss distributions for each risk and deciding if the presented
policy warrants its premium (Johnson and Hershey 1993).

18
Johnson and Hershey (1993) divide the insurance decision into three components: the risk
itself, the policy premium, and the benefit. In regards to the risk itself, for most hazards, a
standard insurance company will have a portfolio where the risk is typically shifted
across a large number of people, for a variety of independent events, and diversified over
different risk categories. This is not necessarily true in the case of insuring catastrophic
events. Massive catastrophes can cost upwards of $100 billion and sink the entire
portfolio of an insurance company. Thus risk itself is high for the providers.
For the purchasers of earthquake insurance, perceived risk itself is entirely dependent on
the purchaser’s disposition. Consumers do not make insurance choices rationally, even
when it is subsidized and priced far below its actuarially fair value, as with flood
insurance. Whether they see the earthquake as a given natural hazard, a low-probability
event, a consequence of their own building location, or as a substantial threat will
ultimately influence their perception of risk and decision to purchase insurance (Shaw, K.
S. H. Kobayashi, and M. Kobayashi 2004). Mostly, purchase of insurance is completely
detached from any realistic measure of seismic risk or geologic knowledge that is likely
to be familiar to home owners (Kunreuther 1996). This research infers that consumers
tend to act on fear as opposed to geologic data explicitly warning them of a future
catastrophe.
Individuals choose their level of acceptable risk through their decision to participate in
risk-reduction efforts such as purchasing insurance, performing seismic retrofits, or
creating personal mitigation plans. Insurance decisions reveal a level of acceptable
consequences, and demonstrate how mitigation and preparatory decisions are made with

19
regard to a given context and a given set of options (Bostrom, Turaga, and Ponomariov
2006). Decisions are made at the governance level with the same structure in mind. High
upfront costs, uncertain benefits of costly mitigation actions, competing financial
interests, and differences in stakeholder values define the context and given set of
options. Large risk mitigation strategies can therefore be inferred as a function of wealth,
requiring the community to define how much safety they can afford (Bostrom, Turaga,
and Ponomariov 2006). Thus the constrained budgets of governments coupled with
competing demands prevent optimal mitigation strategies from being realized.
The effect of risk perception and affordable safety on disaster planning and responsibility
also applies in a historical perspective. Collier and Lakoff (2006) highlight the
monumental shift from exclusively local and state based disaster coordination to federal
government involvement and accountability. National safety became a greater concern in
light of post-WWII national security strategies, thus the national government’s
heightened perception of risk allowed for greater attention to be paid to natural disasters
(Collier and Lakoff 2008). Specifically, the use of vulnerability mapping involved a new
form of knowledge about urban life and the risks nature poses to residents. The federal
government had a greater amount of resources at their disposal, and was able to use
techniques of imaginative enactment to generate knowledge about events whose
likelihood could not be known but whose consequences could be catastrophic. This
paradigm shift in judging risk is essential to natural disaster mitigation and Hazus
evolution, as it allowed governing bodies to communicate risk on a nationally applicable
scale through a centralized unit.

20
This section has reviewed the theoretical barriers to enacting risk-reducing strategies on
an individual and collective level. Power, knowledge, communication of risk, and state
involvement all have a substantial role in defining a community’s disaster disposition,
and contribute to its capacity to manifest action. Most recently, the manifestations to
reduce risk are quantified as metrics for “building resilience” in a community. This
phenomenon will be outlined in the proceeding section, and is useful to consider within
the context of this thesis due to the term’s unrestrained use in hazard mitigation.
II. Decrease Risk and Increase Resilience
The process of mitigating risk has been termed as “building resilience” by many scholars,
urban planners, politicians, and the greater public. In the most basic form, “resiliency” is
used as a metaphor to describe the ability for a system to absorb a shock and bounce back
into a new normalcy. Initially applied in the physical and natural sciences, “resiliency”
has since been used to describe the adaptive capacities of individuals, human
communities, and larger societies (Norris et. al. 2008). Outside of academia, policy-
makers have used the term on local, national, and global scales for various reasons.
Potential resiliency-related policy includes promoting sustainable development, effective
water policy, energy efficiency, and ensuring preparedness against shocks such as natural
disasters, terrorism, economic crisis, and other forms of disruption. Whether the policy is
initiated to ensure resilience against anticipatory or completely unexpected events,
“building resilience” has nevertheless become a noble crusade in global context. Hence it
is assumed that promotion and initiation of resiliency-related policy will increase future
sustainability and adaptability and decrease recovery time and suffering.

21
Historically, the concept of resilience has been most applied in the realm of psychology,
as it was used to describe an individual’s “process of, capacity for, or outcome of
successful adaptation despite challenging or threatening circumstances” (Matsen, Best,
and Garmezy 1990). Having heightened resilience in a given situation allows for fluid
response to change and possession of “adaptive capacities,” or resources with dynamic
attributes. The term “adaptive capacities” is important in examining resilience, as it has
taken on various connotations and roles in the preparation and response process.
According to Klein et al. (2002), “adaptive capacity” is defined as the ability to plan,
prepare for, facilitate and implement adaption options. Factors determining a group or
society’s adaptive capacity include its economic wealth, technology and infrastructure,
the information, knowledge, and skills it possesses, the nature of its institutions, its
commitment to equity, and its social capital (Smit and Wandel 2006). Building resilience
and possessing adaptive capacities implies that people, groups, and societies are
dependent upon certain assets or resources in responding to crises. This dependency
relates to communities and individuals whose social order, livelihood, and stability are a
direct function of their resource production and localized economy (Machlis 1990). Thus
the physical and mental resources available prior to and following instances of shock will
have a direct impact on the population involved.
Varying definitions of resilience are also found in the policy realm. Thus applying the
multiple uses to global policy requires consideration of many different variables. Adger
(2000) contextualizes the indicators of socially constructed resilience through two
overarching premises. The first premise is the nature of economic growth, and the

22
stability and distribution of income among populations or persons within an environment.
In the context of environmental risks and hazards, economic stability is directly tied to
the variance in an environment, or whether certain natural events, such as droughts,
floods, or diseases on agricultural systems are more likely. The stability of livelihoods
can be directly tied to economic well-being and an overall stable economy. Formal sector
employment, crime rates, demographic factors, and other culturally defined variables all
are taken into consideration in the building of resilience in this form (Adger 2000). It is
important to note that resilience is not a one-size-fits-all concept, therefore the ability to
build resiliency within the context of a given culture is vital to its success. Adger’s
second theme is defined through demographic make-up. The rate of mobility and
migration within a given population can determine their state of resilience. Yet this is
also specific to a population and type of migration, as significant population movement
can be evidence of instability or stability. Such flows of resources and demographic
composition can help to reduce particular dependency upon a specific resource and thus
enhance resiliency in the context of a disaster (Adger 2000).
As highlighted, global, national, and local actors have assumed resilience to be an
optimal solution to many of their problems. Yet the notion of “resilience” has not gone
without scrutiny on the academic front. According to O’Hare and White (2013),
“Resiliency is matched neither by certainty regarding its definition nor by agreement
regarding its application through policy and practice” (O’Hare and White 2013). The
April 2013 special edition of Planning, Practice, and Research devoted an entire special
edition to critiquing resilience in its various forms, and the academics have uncovered

23
many flaws in resilience promotion. The combination of studies concluded that there is a
series of disconnects between three key areas--meaning, policy milieu, and place – all of
which are brought into sharp focus by the integrative, political, and special dimensions of
planning (O’Hare and White 2013). Thus resilience planning is often divorced from
meaning and is abstracted from the realities of the world of practice. This causes
resilience planning to succumb to ambiguity and results in the failure to connect with
practical solutions.
In addition to ambiguity, the overtly positive narrative of “resiliency” has replaced
negative discussions of climate change and vulnerability, according to McEvoy,
Funfgeld, and Bosomworth (2013). Their analysis suggests that this shift could have
unanticipated consequences, such as allowing the harsh realities of climate change to
escape the minds of the public in favor of abstract notions that promote false or absent
strengthening.
Davoudi, Brooks, and Mehmood approach resiliency by stratifying it into a four-
dimensional framework: persistence, adaptability, transformability, and preparedness.
The dimensions are stratified further according to three broad perspectives: engineering
ecological, and evolutionary. The researchers discovered that engineering (persistence
focused) interpretations dominate policy expressions, which ultimately fail to explore
alternative features at different temporal and physical scales (Davoudi, Brooks, and
Mehmood 2013). Thus the words spoken and plans drafted in promotion of resiliency
could very likely result in ineffective decisions and empty promises.

24
Unfortunately, resiliency is swiftly on track to becoming a cliché in the same manner as
“sustainability”. While “sustainability” was pushed, promoted, and jargonized by
governments, businesses, and organizations, the word became, according to the Centre
for Policy Studies, “a vacuous buzzword” whose “very looseness and lack of clarity
makes it a perfect prefix for any activity where approval is being sought.” (Jamieson
2009). Resiliency has not achieved the same amount of overt criticism or standard of
cliché as of yet, but it is undoubtedly headed in the same direction of ambiguity. For
example, Time magazine published an article entitled “Resiliency, Inc.”, and claims that
“’Resilience’ has become the new buzzword inside the Pentagon. It’s shorthand for “our
Army’s too small to fight the wars we’ve been fighting.” (Thompson 2012). Thus the
word is becoming questionable in many spheres beyond disaster management and should
be used with caution.
This section has provided a review of literature on the utility of “resiliency” in a disaster
mitigation context. The narrative of resiliency has many positive connotations and may
be useful to communicate political concern over threatening environments. The trajectory
of the term’s practical value is not positive, however, as nebulous and unwarranted use of
the term has diluted its value and allowed for intense and justified critique by the
academic community. The proceeding section examines another metric of hazard
mitigation in the form of economic risk.
III. Modeling Risk According to Economic Metrics

25
Defining conceptual and numeric forms of risk is exceptionally difficult for the academic
and policy community. The previous sections have elaborated on attempts to
conceptualize risk by individuals and collective entities, as well as through buzzwords
used to rally the public into action. Economic loss is another important risk-framing
mechanism requiring consideration. Specifically, economic risk resulting from natural
disasters has been a concern of the insurance industry and government for an extended
period of time, but is increasingly being recognized as an important part of urban
planning and business strategies for risk control and reduction (Tseng and Chen 2011).
Economic risk must be examined prior to Hazus analysis given the economic loss models
and outputs that the tool provides.
To successfully examine the varying definitions of economic risk, an employment of
Jasanoff’s metrics for the broader term of “risk” can also apply to “economic risk”. The
academic realm has taken a careful analytic eye to the framing of economic risk by
policymakers, planners, and other relevant persons. Most definitions fall within
Jasanoff’s first and second categories, and are relevant to prescription of policy after the
assessment of the known risk. Many of the economic risk definitions tend to employ the
word “resiliency” or “economic resilience” when examining the disaster scenarios to
assess a region’s preparedness. Resiliency in an economic sense can be roughly defined
as the ability to cushion or mute potential monetary losses from a natural hazard, and can
be applied to individual firms, households, institutions, and the economy as a whole
(Rose 2004).

26
Recent trends in national natural disaster policy show an increasing emphasis on the
mitigation of prospective losses in order to determine which risk-reduction strategies
should be employed to save the most amount of money if the event occurs. This
information is of significant importance to emergency planners, civil protection services,
local government agencies, and reinsurers, as well as global organizations such as the
United Nations and World Bank (Erduran and Lindholm 2012). In addition to
organizational use, the monetary estimates allow residents of the risk-prone area or
building to translate their personal risk from the abstract (i.e. you will possibly have
structural damage) to reality (i.e. you will lose $50,000 in structural damage).
Thus it is useful for policy-makers to have a grasp of the potential losses and fund risk-
management strategies accordingly. Yet, as this thesis attests, no loss estimation
methodology is perfect. The specific processes used by Hazus, the user capabilities, and
input data substantially affect the output. Rose (2004) highlights the varying approaches
in hazard estimation and asserts that the sounder the data, the more reliable and
accurately reflective the results. The type and source of data used can vary drastically
from using sources of primary data (i.e. questionnaires, interviews, and telephone
surveys), secondary data (government agencies, philanthropic organizations, and private
companies), or independent research. Statistical data, macroeconomic models,
deterministic simulation analysis, and stochastic simulation analysis also exist to assess
risk (Rose 2004). Hazus uses purely quantitative data to measure economic risk, which as
will be explored in Chapters 3 and 4, can be beneficial or harmful to the overall output.

27
Cochrane (2004) highlights the problems with using economic loss as a metric for
calculating risk. His assessment concluded most problems to stem from double counting,
failure to clearly identify an accounting stance, ignoring non-market losses, confusion as
to whether post disaster economic trends are a product of the event or some other
unrelated factor, and the employment of too limited of a timeframe (Cochrane 2004).
Furthermore, variables such as the loss of leisure, a sense of place, historic
monuments/cultural assets, and governmental services have monetary values as well, but
are never included in these types of assessments produced through tools such as Hazus.
The decision to calculate for direct vs. indirect losses has the largest effect on the output
of a risk-estimation study. For example, an earthquake may cause a building to collapse,
with the direct losses arising from building replacement costs and inventory losses - all
related to physical materials. Indirect losses, however, are considered on a long-term
basis and can include measurements of lost profit upstream and downstream to the
businesses hit in the building. Insurance to account for these indirect and costly losses is
lacking, and leads to hampered recovery and misperception of risk. Methods exist,
however, to measure the potential loss. More detail on the methods employed by Hazus
will be explored in Chapter 3.
Assessment tools such as Hazus provide information to allow the at-risk parties to see the
hazards either as legitimate or unworthy of their attention. Measurement tools can
therefore make a substantial difference in defining the metric for risk characterization and
enactment of risk-reduction strategies. As noted, performing risk-reduction strategies and
enacting policy is a function of wealth, or the amount of safety that a community can

28
afford given the variety of interests at play. Damage estimates provided by Hazus will
explicitly influence these decisions by providing cost estimates and influencing
stakeholder perception. If the model does not account for the full spectrum of loss,
however, certain parties will be disinterested and fail to take proper steps to mitigate the
hazard at hand. Thus the accuracy of the models is of absolute importance in assessing
risk.
IV. Conclusion
This chapter has provided a review of literature surrounding risk, resiliency, and
economic values as a metric for risk in relation to natural disasters. These topics offer
conceptual background for proceeding analyses of hazard knowledge in the Portland area,
the use of Hazus in measuring risk, and the consequences of failing to account for all
vulnerabilities within a region. The next chapter will examine the history of geologic
knowledge in order to give a rounded understanding of the variables that should be
accounted for in analyzing seismic hazards and their prominence in Portland, OR.

29
Chapter 2: Geology, Earthquakes and Building Resilience in Oregon
Conceptualizing and predicting earthquakes is a relatively recent phenomenon. Until the
twentieth century, the sporadic nature of earthquakes and inability for scientists to travel
globally and communicate in a rapid manner prevented the field from being closely
examined. The knowledge on earthquakes and the geology behind them has progressed
significantly in the past forty years. This chapter describes how present geologic
knowledge on earthquakes developed in a national and Pacific Northwest context. The
two tracks of knowledge are related, yet distinct in their realization of risk to the relative
locations, and each uniquely nonlinear in their contributions to geologic knowledge.
First, the chapter will provide information on the history of national support for
earthquake research and the role of government in managing earthquake knowledge. An
overview of plate tectonics will be offered to give context to the present-day known risks
and the variables to be accounted for when assessing risk. The chapter will then give a
historical account of the consciousness of seismic risk in the Pacific Northwest to set a
framework for assessing Portland’s current status of preparedness. Finally, this chapter
overview the policies produced in response to the risks. This information is important to
consider prior to discussions on Hazus, its history, the assumptions behind the tool, and
disaster loss models in general.
I. The Evolution of National Earthquake Knowledge
Various factors in the 1960s allowed for the advancement of seismic and geologic
knowledge. First, the establishment of the Worldwide Standardized Seismograph

30
Network (WWSSN) significantly added to the ability to monitor earthquake activity (R.
Yeats, Sieh, and Allen 1997). The purpose of the WWSSN in 1961 was twofold: first and
more publicized, to monitor geologic movement, and second, more discretely important,
to detect underground nuclear weapons testing by the Soviet and Chinese governments
(R. S. Yeats 1998). Thus the Worldwide Seismograph Network (WWSSN) was born and
built across the world in the name of geology and national security.
While the WWSSN was in place in 1960, national attention was not drawn to reducing
earthquake hazards until the 1964 Good Friday Alaskan earthquake (Mileti and
Fitzpatrick 1993). Earthquakes were common in California and happened infrequently in
other various parts of the United States, yet a singular approach to deal with earthquakes
was not formulated by the federal government up until that point. Because of the slim
scientific knowledge, earthquakes were designated as a freak occurrence and
hypothesized to occur anywhere in the United States. California in particular, with
observable high seismic activity, repeatedly pronounced earthquakes as invariable and
not particular to the state in order to rationalize the continued development and discount
the region’s seismic past and future risk (T. Steinberg 2006). The 1964 Alaskan
earthquake was cause for concern, as the horrendous devastation that occurred in the
sparsely populated Alaskan countryside demonstrated the potential for enormous losses
in other parts of the United States (Hamilton 2003). Thus the opportunity for American
people to see earthquake damage through their television screens and national media
undoubtedly contributed to increased public awareness and outcry for governmental
research on these bizarre events.

31
In response to the public call, President Lyndon B. Johnson directed the National
Academy of Sciences (NAS) to conduct a comprehensive study of the Alaskan disaster,
the first time in national history that a multidisciplinary approach was used to investigate
a damaging earthquake. As of that time, geologic knowledge was not advanced, as a 1966
panel chaired by the USGS noted, “All areas of the United States experience earthquakes
at some time and no area should be considered as free of potential earthquake hazard.”
Additionally, the 1966 panel stated that “many moderate, a few severe, and probably one
great earthquake can be expected within the United States between now and the year
2000. Billions of dollars in damage may be expected and loss of life may be hundreds to
thousands.” (Mileti and Fitzpatrick 1993). The organization and panel’s comments on
potential earthquake damage demonstrate the scientific ignorance and lack of knowledge
on earthquake science.
The United States substantially increased research and funding for geologic pursuits over
the twenty years following the Alaskan Good Friday earthquake. Most of these efforts,
however, were done under separate bureaucratic or ad hoc organizations. The
competition among disciplines and between agencies, combined with the waning concern
after the Alaskan earthquake, contributed to a lack of budgetary attention to the
earthquake threat (Hamilton 2003). Thus the mangled coordination and uncertainty of
earthquake events, their estimated location, and the science behind it prevented national
insurance policies and localized state awareness from ensuing in the United States.
As outlined thus far, the fragmented studying of earthquakes in the 1960’s and 1970’s by
the federal government prevented national earthquake policy from being produced.

32
However, the ability to monitor seismic activity on a global basis allowed for the Theory
of Plate Tectonics to reach fruition in the 1960s. Geologists were able to produce this
theory with improved knowledge on earthquakes and crustal movements, largely due to
the WWSSN. This theory states that the earth’s surface consists of a series of tectonic
plates. Each plate consists of the crust and the lithosphere, or more rigid part of the upper
mantle containing all of the world’s earthquakes, all of which is underlain by the weaker
asthenosphere zone (R. Yeats, Sieh, and Allen 1997). With this theory in place geologists
could begin to explore the exact location of the separate plates, eventually leading them
to discover more information on seismic activity and risk.
It was not until 1977, however, that the Earthquake Hazard Reduction Act of 1977 was
enacted. This act established the National Earthquake Hazards Reduction Program
(NEHRP). The initial objectives of NEHRP included the following (R. S. Yeats 1998):
Retrofit existing buildings, especially critical facilities such as nuclear power
plants, dams, hospitals, schools, public utilities, and high-occupancy buildings;
Design a system for predicting earthquakes and for identifying, evaluating, and
characterizing seismic hazards;
Upgrade building codes and developing land-use policies to consider seismic risk;
Disseminate warnings of an earthquake and organizing emergency services after
an earthquake;
Educate the public, including state and local officials, about the earthquake threat,
including the identification of locations and buildings that are particularly
susceptible to earthquakes;
33
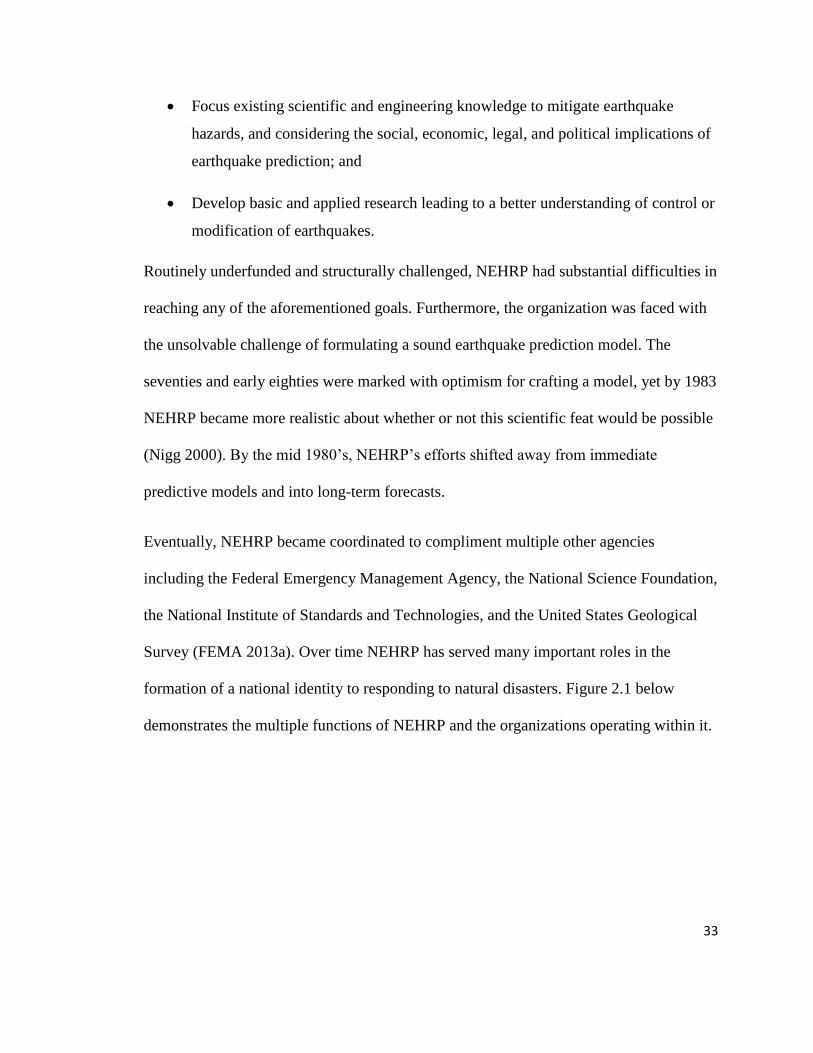
Focus existing scientific and engineering knowledge to mitigate earthquake
hazards, and considering the social, economic, legal, and political implications of
earthquake prediction; and
Develop basic and applied research leading to a better understanding of control or
modification of earthquakes.
Routinely underfunded and structurally challenged, NEHRP had substantial difficulties in
reaching any of the aforementioned goals. Furthermore, the organization was faced with
the unsolvable challenge of formulating a sound earthquake prediction model. The
seventies and early eighties were marked with optimism for crafting a model, yet by 1983
NEHRP became more realistic about whether or not this scientific feat would be possible
(Nigg 2000). By the mid 1980’s, NEHRP’s efforts shifted away from immediate
predictive models and into long-term forecasts.
Eventually, NEHRP became coordinated to compliment multiple other agencies
including the Federal Emergency Management Agency, the National Science Foundation,
the National Institute of Standards and Technologies, and the United States Geological
Survey (FEMA 2013a). Over time NEHRP has served many important roles in the
formation of a national identity to responding to natural disasters. Figure 2.1 below
demonstrates the multiple functions of NEHRP and the organizations operating within it.

34
Figure 2.1 Organizations and Functions within NEHRP (FEMA 2013b)
As shown above, the United States Geological Survey (USGS) performs earthquake
research under NEHRP and receives the largest portion of its funding. The USGS pursues
four general goals in the contribution to earthquake knowledge: 1) understanding what
happens at the earthquake source; 2) determining the potential for future earthquakes; 3)
predicting the effects of earthquakes; and 4) developing applications for earthquake
search results (R. S. Yeats 1998). Therefore the progress of the USGS can play a major
role in the progression of earthquake knowledge, establishing earthquake policy, and
fostering awareness of given hazards.
This section has outlined the political structures that have set earthquake research
agendas and furthered seismic awareness on a national level. The creation of NEHRP
provided substantial progress in the pursuit of geological knowledge on earthquakes and
how to properly prepare for them. The establishment of an umbrella agency to monitor

35
earthquake activity, centralize the study of and advancements in seismic knowledge,
coordinate recovery activities, and distribute federal funding helped to elevate the status
of geologic epistemology and give value to their warnings to the greater public. This
information is useful in the examination of Hazus and consideration of seismic risk
awareness.
II. A Brief Earthquake Lesson
The previous section explained the progression of earthquake knowledge on an
organizational level. The following section will present a basic framework on the
geologic nature of earthquakes. It is of absolute importance to have a basic understanding
of the science behind earthquake risk in order to critique the tools that attempt to model
the phenomena’s behavior.
As shown in Figure 2.2 below, the most common earthquakes are caused due to the
descent of the lithosphere into the asthenosphere. The standard premise of earthquake
theory asserts that as new crust is made and plates shift, old crust must be destroyed at the
same rate as plate creation, as the Earth must remain the same size throughout time (R. S.
Yeats 1998). Determining plate movement is done by observing change in the Earth’s
magnetic field preserved in oceanic crust and by drilling core holes in the deep-ocean
floor to determine the age of the oldest sediment overlaying the basaltic crust at various
places (R. Yeats, Sieh, and Allen 1997).

36
Figure 2.2 Lithosphere Descent (USGS 2012)
The epicenter of an earthquake is defined as the point on the surface of the earth that is
directly above the focus, or place within the earth where the earthquake rupture starts.
The discovery of epicenters and investigation into soil type has substantially helped to
further earthquake knowledge. Prior to seismographs, the epicenter was generally
assumed to be the place where the damage was the greatest. Geologists eventually
discovered, however, the degree of damage to be more strongly influenced by near-
surface ground conditions and by the progression of the fault rupture than by proximity to
the epicenter (R. Yeats, Sieh, and Allen 1997). The type of soil a building, city, or larger
area sits upon has more of an impact on damage inflicted than proximity to the epicenter.
Generally, harder soil equates to less damage. This is due to the way waves travel
through soil. The soft soils will amplify the seismic waves, which results in much more
vigorous shaking than would be expected at a rock site (R. S. Yeats 1998).
Soil will provide the highest amount of risk when it is sandy, soft, or weak in nature.
Geologists equate a high level of unstable soil, also known as liquefaction, to Jell-O,
claiming that buildings that stand upon Jell-O have a harder time staying intact than

37
buildings atop rock. Liquefaction is defined as the act or process of transforming any
substance into a liquid. In a geologic sense, liquefaction refers to the time in which a
saturated soil loses substantial amount of strength due to high excess pore-water pressure
generated by and accumulated during strong earthquake ground shaking. This type of
vulnerability is the hardest to structurally mitigate and typically provides the most
amount of threat to regions.
This section has noted the advancement of earthquake knowledge and risk that
accompanies geologic and seismic tendencies. Despite the increasing amount of
information, no substantial method has been developed to seriously predict earthquakes.
Geologists know that tectonic plates will move, but there is no underlying theory stating
explicitly why they move as they do. The absence of this information is the greatest
hindrance in allowing geologists to holistically understand earthquakes. Elaboration on
this problem will be explored in later sections of this chapter.
III. Pacific Northwest Earthquake Awareness
The previous sections have presented the evolution of geologic knowledge on a national
scale. Undoubtedly, the slow progression of this knowledge contributed to unnecessary
fear for those in non-hazardous areas, as well as lack of awareness of risk in areas of high
seismicity. Most of the Pacific Northwest and Portland in particular, were blindly
unaware of their earthquake risk until the 1980’s, making the region very late to the
earthquake awareness game. Sporadic minor earthquakes in British Columbia and
Washington allowed for geologists to realize the possibility, but no serious work to

38
search for seismic risk within the region was done until the 1980s. Up until then,
geologists believed the Cascadian region to have the lowest instrumental, geographic, and
historical distribution of earthquakes, also known as seismicity, of any subduction zone
on the margin of the Pacific Ocean, and insisted that the near faults posed no major risk
to the populated cities in the Northwestern US. At the time, geologists insisted that the
Cascadian fault was so different from other similar zones and thus shouldn’t be
considered worrisome (Monroe 1987a). Furthermore, the lack of national recordkeeping
on seismic activity prevented the region from knowing whether or not a serious
earthquake occurred in the past 300 years. Geologists, therefore, were skeptical of serious
seismic risk in the Oregonian region.
The start of Oregon’s large wake-up call came to the Pacific Northwest in the early
1980s. In 1983 John Adams, a New Zealand geologist, while working for the Geological
Survey of Canada stated that there may be an earthquake hazard in the Pacific Northwest.
Adams discovered this by comparing old US highway survey marker level lines with
recent ones and found substantial changes in the relative elevation of these monuments,
thereby providing evidence of the slow buildup of tectonic strain (R. S. Yeats 1998).
Adams’ findings, however, were mostly ignored by the public and greater scientific
community and were not considered to be substantial evidence for concern.
Further progress came in 1984 with a published comparison of the Cascadian Subduction
Zone to others around the world. This study, performed by Tom Heaton and Hiroo
Kanamori from the California Institute of Technology, found the Cascadian Subduction
Zone to be comparable in risk to other subduction zones which have had earthquakes

39
Figure 2.3 Extent of Earthquake Awareness in
Oregon, 1987
greater than magnitude 8 within the past century. Despite this announcement, many were
still very skeptical about the risk of a major earthquake in the Pacific Northwest.
Finally, to quell the rumors in the
scientific community, the Oregon
Academy of Sciences held a
scientific workshop in February
of 1987 entitled, “Is there a major
earthquake hazard in Oregon or
not?” This conference was
attended by both supporters and
skeptics of a major Cascadian
fault. The atmosphere at the
conference was “electric” and the
presentations by proponents
eventually won over the skeptics, marking a paradigm change in thinking about
earthquakes in the region (R. S. Yeats 1998). A reporter from the Oregonian was in
attendance and relayed the paradigm shift to the greater public.

40
Figure 2.4 Extent of Earthquake Awareness in Oregon,
1987 (Monroe 1987b)
This Oregonian article, published on February 26, 1987, provided readers with
introductory information on the seismic risk in Oregon. The Oregonian newspaper clips
presented in Figures 2.3 and 2.4 portrayed to the Oregon public the estimated location of
the Juan de Fuca plate and fault lines in Oregon. The author also included dramatic
descriptions of the 1985 Mexico City earthquake, noting that Oregonians felt relief at the
time of that earthquake because
they believed “it can’t happen
here” (Monroe 1987b). The article
attests to the uncertainty of
earthquake risk, but also notes that
most of Oregon’s buildings were
designed and built at a time when
Oregon was thought to be one of
the lowest earthquake-hazard zones
in the country. Monroe realizes
public and scientific disconnect by
noting the lack of seismic
knowledge “despite the fact that
the state is sandwiched between
two earthquake-prone areas –
California and the Puget Sound.”
(Monroe 1987a).

41
A later article, published on December 17, 1987, presented the facts on Oregonian risk,
noting that muddy marsh banks, land deformation, computer models, and statistics
suggest that the Northwest should prepare for a big jolt. These warnings, however, were
accompanied by a cautionary remark from seismologist Thomas Heaton, “All these
pieces don’t nail the coffin, but certainly they would be pretty hard to explain without
earthquakes.”(Monroe 1987b). Other skeptics at the meeting noted that sediments are
lubricating Northwest subduction and preventing strain from building up, thereby
providing evidence against a large Cascadian fault. Thus a concrete agreement could not
be reached between scientists, confusing the public at large and preventing political
address of the issue.
Debates over the specificities of the potential Oregon quake continued into the 1990s. A
particular concern was of the historical patterns of the Cascadian fault. Academic debates
were held on whether the geologic evidence pointed a “decade or two of terror” in the
form of many small Cascadian earthquakes, or an “instant of catastrophe” (R. Yeats,
Sieh, and Allen 1997). Much of the debate subsided with the publication of research by
Jim Savage and his colleagues of the USGS in 1991. Savage and his team performed
repeated measurements of surveying benchmarks around Seattle, in Olympic National
Park, and at the Hanford Nuclear Reservation in Washington. Following prolonged
observation, they concluded these networks showed the crust to be slowly deforming by
built up elastic strain. The team additionally concluded that there were no minor
earthquakes or “decade of terror” in the subduction zone. Evidence was provided to
determine the subduction zone to be completely locked, thus strain will build up along

42
the zone at 1.6 inches per year until the zone eventually ruptures in a massive earthquake
(R. S. Yeats 1998).
Skeptics remained despite the aforementioned geologic evidence. The closing
confirmation of a single, large Cascadian quake was provided from across the Pacific,
surprisingly enough. Historical accounts of an eighteenth century Japanese tsunami and
tree-ring dating were discovered in the mid-nineties to provide the much-needed
historical anecdotes for geologists. Japanese records at five different coastal sites stated
that on January 27 and 28, 1700, a tsunami hit the coast and produced waves as high as 9
feet. Process of elimination by geologists concluded this tsunami to be a direct result of a
singular Cascadian quake (Satake et al. 1996). Furthermore, computer models concluded
this wave to be a result of a magnitude 9 quake, as a magnitude 8 would not have left a
noticeable tsunami in Japan. The final concluding evidence of a large rupture was
provided through trees on the coast of northern Oregon and Washington. The trees were
sampled at the core, cross dated, and checked for irregularities in growth that indicate
seismic shaking disturbances. This team of researchers concluded a serious disturbance in
growth to have occurred between the growing seasons of 1699 and 1700, and that their
analyses gives independent evidence for a subduction earthquake that could be related to
the historical tsunami of January 1700 (Jacoby, Bunker, and Benson 1997).
With written historical anecdotes and tree rings to supplement the geologic evidence,
geologists and seismologists finally agree with a fair degree of confidence on the
movements of Juan de Fuca and its potential impact on Oregon. They maintain that new
oceanic crust is being created at the Juan de Fuca Ridge in such a way that the Pacific and

43
Juan de Fuca plates are spreading apart at a rate slightly faster than 2 inches (60 mm) per
year, and that Juan de Fuca is moving towards and beneath the stable North American
continent at a little less than 2 inches (45 mm) per year (R. S. Yeats 1998). Figure 2.5
below displays the movement of the Juan de Fuca as it slides beneath the North American
plate.
Figure 2.5 The Movement of Juan de Fuca (OSSPAC 2013)
Figure 2.6 on the proceeding page is provided to give context to the Juan de Fuca Plate in
relation to the other lithospheric plates of the world. The Juan de Fuca plate sits directly
to the left of the North American Plate, which extends all of the way across the United
States and Canada and into the middle of the Atlantic Ocean. The Juan de Fuca Plate lies

44
off of the Pacific Northwest Coast and is slightly smaller than Washington and Oregon
taken together.
The uncertainty of Juan de Fuca is commented on by Yeats (1998): “We know much less
about how the motion of the Juan de Fuca Plate with respect to North America is
distributed between the subduction zone itself and the active crustal faults east of the
plate boundary…if we knew the rates of movement on the crustal faults as well as we do
the rates of plate motion, we would be much further along in forecasting the future
behavior of crustal faults and of the Cascadian subduction zone as a whole.” (R. S. Yeats
1998). In non-geologic speak, Yeats is commenting on the difficulty in knowing how
much strain needs to be built, and in what direction, before a major quake occurs.
Figure 2.6 Plates Around the World (R. S. Yeats 1998)

45
Figure 2.7 Local Faults in Portland, OR (Hill and Crombie 2001)
Oregon and the greater Northwest have many reasons to be concerned over Juan de Fuca.
The possible rupture of this plate will cost, at least, an estimated $30 billion dollars for
the state of Oregon alone and wreak havoc on the residents of the area. Portland,
specifically, is estimated to lose at least $17.43 billion in building stock, according to a
Hazus pilot study performed in 1997. Problems with this estimation will be explored in
subsequent chapters on estimating economic losses. For now, this section will focus on
the specific faults and geologic hazards unique to the city of Portland.
According to Yeats, et al., downtown Portland is next to the Portland Hills Fault
extending along the foot of the Portland Hills, as shown in Figure 2.7 below. This fault is
approximate 30 miles long and actually is a complex fault zone containing multiple
fractures (Hill and Crombie 2001). The Oatfield and East Bank Faults also run within the
city limits, and
the three faults
are essentially
parallel to one
another.
Geologists are
yet debating
the riskiness of
these faults,
however, and
were initially

46
Figure 2.8 Ariel View of Portland Faults (Rojas-Burke 2011)
skeptical of the faults’ seismicity due to the lack of geomorphic expressions on the land
surface and scarcity of historic record (Liberty, Hemphill-Haley, and Madin 2003a).
Eventually, evidence in favor of a heightened activity level for the faults was provided in
2001 following geologic observation during construction at the Rowe Middle School in
Portland. Geologist Ian Madin spotted deformed soil layers and speculated that the faults
ruptured approximately 10,000 years ago, thus recent enough to be noted as “active” (Hill
and Crombie 2001).
Geologic publications on the Portland Hills Fault prior to discovery of active seismicity
reiterate the implications that prediction, scientific knowledge, and its influence on
planning and development can have on a region. Specifically, Yeats, et al., state in 1998,
prior to the active discovery, “The [Portland Hills Faults] can be marked on the maps of
areas being considered for urban development, and developers, local government, and
potential buyers can
make up their own
minds about the
potential for fault
rupture” (R. S. Yeats
1998). This statement,
in light of the discovery
of activity in the
Portland Hills, supports
the notion that risky

47
and dangerous development can occur without complete knowledge on a given hazard.
The discovery under the Rowe Middle School, in combination with additional tests, has
allowed geologists to suggest that the Portland metropolitan region is historically the
most seismically active region in Oregon (Liberty, Hemphill-Haley, and Madin 2003b).
The faults are much shallower in the earth when compared to the larger, more damaging
faults such as Juan de Fuca, discussed previously. Although the largest earthquakes occur
along the subduction zone, deep earthquakes occur within the Juan de Fuca Plate, these
smaller, more focused hazards exist from the shallow earthquakes (<25 km deep) in the
upper crust of the North American plate (Liberty, Hemphill-Haley, and Madin 2003b).
The consequences of the smaller earthquakes are not as dire on a state-wide level, but
have the potential to cause a considerable amount of damage to the Portland metropolitan
region. The strength of buildings, infrastructure, and type of soil these fixtures sit upon
will unquestionably have a massive impact on Portland’s amount of damage.
IV. Precarious Predictions
The preceding sections have highlighted the major reasons for Oregon and Portland
residents to have concerns. An earthquake or multiple earthquakes are undoubtedly
coming. Yet the exact timing of the “big one” and smaller, more local quakes remains a
puzzling mystery. The previous sections have explained the evolution of seismic
knowledge in a national and Oregonian context. The information presented has
highlighted some of the missing gaps in earthquake knowledge. The largest gap,
arguably, centers on the ability to predict earthquakes. It is not enough to simply point

48
out the fault lines and warn people accordingly. The variability of earthquake hazards
relies greatly upon the timeframes provided by geologists for fault rupture and the built
environment that is susceptible to damage. The following section will describe the
difficulty in defining these risks from geologic, governance, structural, and residential
perspectives. Defining risk for the Pacific Northwest according to scholarly literature,
geologic knowledge, and governmental perspectives will highlight the variance between
the groups.
It is first important to note the seriousness of this issue in light of recent events. The
inability of geologists to predict earthquakes and warn the public properly has gathered a
considerable amount of attention in the past year. The increased attention is a direct result
of an earthquake in L’Aquila, Italy on April 6, 2009. This earthquake killed more than
300 people in L’Aquila, and injured approximately 1,600. As a result, the scientists who
knew of the earthquake threat have been convicted with manslaughter for failing to
adequately communicate the risk of a possible earthquake (Clark 2012). This group of
scientists, known as “The Seven,” met one week prior to the earthquake to assess whether
a sequence of small earthquakes recently shaking the town indicated a heightened risk of
a large, destructive tremor in the near future (Sarewitz 2012).
According to New Scientist, the scientists were not charged specifically for failing to
predict the earthquake, as many geologists and scientists fear, but rather failing to
communicate the risk of an earthquake. New Scientist notes how the scientists were
employed by the Italian government to assess earthquake risk and communicate them to
the government and public. The scientists, however, left the communication job to a civil

49
protection official with no specialist knowledge of seismology. This specialist then gave
a grossly inaccurate reflection of the situation, telling the public, “The scientific
community tells us there is no danger, because there is an ongoing discharge of energy.
The situation looks favorable.” ("Italian Earthquake Case…" 2012).
The Italian earthquake trial brought hazard and natural disaster prediction into a
completely new realm. The realization that scientists could be convicted with
manslaughter for having bad public relations instills fear into the minds of scientists and
possibly discourages further study of disaster phenomena. Regardless, this case alludes to
a larger epistemological problem of scientifically defining risk and presenting that risk to
the public.
The uncertainty of a Cascadian fault rupture causes both under preparation and excessive
dramatization of the risk. It is understandable for people to underprepare given geologists
Figure 2.9 Japan as Oregon’s Mirror

50
predict the fault to rupture anytime in the next three hundred years, and because Portland
has not experienced a serious earthquake in the past. Conversely, in light of this seismic
realization and geologic relationship, Oregon and the greater Cascadian Zone have been
dramatically deemed as a “geologic mirror image of northern Japan.” (OSSPAC 2013).
Figure 2.9 below, created by Dan Coe at DOGAMI demonstrates the similar placement
of each location along the Pacific fault. The decision to equate these two areas
communicates to the public that similar devastation that occurred in Japan could indeed
happen in Portland.
Despite the difficulty involved in understanding geologic timeframes, demands for
earthquake and other climactic predictions from scientists have increased (Oreskes 2000).
This has led to an explosive growth in models, including Hazus, and the reliance of
models on questionable or unproven scientific knowledge. Prediction is important,
however, as it serves two important goals. First, prediction has come to occupy a position
of scientific authority and legitimacy, thus if prediction matches an event, public support
for scientific theory increases. Second, prediction is needed as a potential guide for
decision making (Sarewitz and Pielke 2000). Akin to risk and damage estimations,
predictions provide the necessary ammunition for enacting policy to reduce risk to a
given hazard and give accreditation to a given scientific body of knowledge. Transferring
policy discourse away from politics and morality and onto science allows for political
risk to be reduced and rationality to be increased (Sarewitz and Pielke 2000). Prediction
to serve political goals must be precluded with caution, however, as Oreskes notes, “If
the value of predictions is primarily political or social (rather than epistemic) then we

51
may need to be explicit about the uncertainties on the theory or model that produced
them.” (Oreskes 2000).
Uncertain and faulty models have wreaked havoc on the geologic community. Many false
predictions have been made that have caused the public to question science and geology.
In the past, scientists have claimed to have discovered the means to predict quakes on
specific dates, notified the press, received large public attention, and scared many
accordingly. For example, Brian Brady of the US Bureau of Mines created an earthquake
“clock” that would provide the precise time, place, and magnitude of a forthcoming
quake based on his laboratory studies of rock fracture (Cowen 1981). Brady forecasted a
large earthquake off the coast of Central Peru to occur on June 28, 1981 at a magnitude
greater than 9. While the National Earthquake Prediction Evaluation Council rejected his
claim, officials at the Office of Foreign disaster were on Brady’s side (R. S. Yeats 1998).
The estimated earthquake date came and went with no shaking involved, thereby proving
Brady’s prediction to be off-base and contributing to the discrediting of future earthquake
predictions. As the Christian Science Monitor noted in 1981, “This would be merely an
interesting scientific dispute were not the public safety involved.” The only scientifically
validated earthquake prediction ever made in the United States was made in 1985
following an extensive scientific peer-review, with a 95 percent probability that there
would be a moderate-sized earthquake on the Parkfield segment of the San Andreas Fault
in central California at some time over an eight year period (Sarewitz 2012). This
prediction did not come true in Parkfield, and contributed to increasing frustration in the

52
geologic community, as causing mass hysteria in hopes of furthering the field of geologic
knowledge or advancing one’s career and reputation is questionable.
This section has highlighted the difficulties involved in predicting earthquakes, and why
having accurate predictions could be useful for policymakers and the public at large. The
inability to have precise earthquake estimates hinders the public from fully realizing their
risk, and forces ambiguity and extreme uncertainty into scientific knowledge, often
invalidating scientific conjectures in the public eye. Cost estimates, policy, and
campaigns are therefore intended to raise awareness for the unknown in light of
uncertainty.
V. The Built Environment vs. the Environment: Mitigating Structural Risk
The previous sections have articulated the known seismic hazards within the Pacific
Northwest and Portland, the destruction these faults could cause, and the problems that
stem from epistemic gaps in seismic knowledge. This section will explain the risk that the
built environment can expect given the various factors influencing its seismic health. Not
only is seismic risk important to consider when contemplating human safety, but it also
plays a role in several important real-estate decision-making processes. For example,
buyers must consider seismic design of new structures, seismic rehabilitation of existing
buildings, and decisions regarding the purchase of earthquake insurance. Structural risk
can therefore impact both the value of a building prior to an earthquake, and, more
importantly, play a determining role in the survival of dwellers and recovery time of the
region as a whole.

53
Generally, a structure’s seismic health depends on two overarching, simplified factors:
the ground below it, and the materials used to make it. Proximity to the fault lines
obviously has a substantial impact on risk, yet additional soil variables must be
considered when assessing structural risk. Seismologists and engineers consider three
specific and different earthquake-related problems to be associated with surface sites: 1)
amplification of seismic waves by soft surficial deposits; 2) liquefaction of near-surface
sediments; and 3) landslides (R. S. Yeats 1998).
First, seismic waves are amplified in soft foundation materials, which results in more
vigorous shaking than would be expected on a rock surface. Higher frequency waves tend
to affect smaller buildings, while low frequency, elongated waves tend to affect tall high
rises at a heightened rate. Second, the liquefaction risk of an area is entirely dependent
upon soil quality and type, which can turn the soil to mush and cause “ground failure”.
This problem generally affects buildings in a manner that cannot be easily reduced
through seismic upgrades and codes. Lastly, landslides affect hilly or mountainous terrain
and the buildings that reside on them. Earthquakes less than 5.5 in magnitude generally
generate dozens of landslides, while earthquakes greater than magnitude 8 generate
thousands (R. S. Yeats 1998). Thus buildings that rest upon liquefiable and landslide
prone soil can generally expect greater damage.
Structural components play a large role in a building’s seismic health and can
substantially affect how the building fares in ground-shaking conditions. As previously
noted, scientific knowledge on earthquakes was not formally articulated and monitored
until the 1960’s. Yet within the United States, the awareness of earthquakes as a frequent

54
occurrence was prevalent in states such as California. This allowed for mild, but
insufficient, adaptation to building codes and form in areas of high seismicity.
Architectural and structural knowledge on preferred building codes and structural
resiliency became articulated and more effective as time passed. California, as a result of
being the most seismically active state in the nation, developed the strictest building
codes and became a national reference for structurally sound buildings.
Generally, brittle structures and single-story buildings with large parts of their walls not
tied together are known to behave poorly in earthquakes. Buildings such as these
typically are constructed out of unreinforced masonry or have nonductile concrete-frames
with weak, unconfined columns. Oregon generally began using earthquake-safe concrete
masonry (CMU) after 1970, unbeknownst to designers that this material was improving
the building’s seismic performance in light of earthquake threats. Thus Hazus, along with
other tools, tend to generalize structures built prior to 1970 as being more dangerous than
those built after. These materials were also used prior to 1970, but were used in
conjunction with unreinforced masonry, steel, and wood.
Owners of unreinforced buildings have been given options to improve their structures.
Walls may be strengthened by infill walls, bracing, external buttresses, addition of
exterior or interior frames, or by base isolation (R. S. Yeats 1998). In light of national
pressure, Oregon adopted a statewide building code that mandated mild seismic
resistance for new construction in 1974. It was not until 1993, however, that Oregon
building codes changed to require design that would accommodate shaking from a
Cascadian subduction zone quake, almost doubling the earthquake forces used in earlier

55
codes (OSSPAC 2013). The Oregon Structural Specialty Code mandated that new
building designs must incorporate seismic provisions, as many buildings built before
1994 are not considered able to withstand shaking from earthquakes (DOGAMI 2010).
Unfortunately, the only specific state requirements for upgrading presently dangerous
older buildings are enforced after the event of an earthquake.
While new codes exist to improve safety for new buildings, tens of thousands of older
buildings remain unsafe and at risk of causing serious damage to the public. The State of
Oregon has received criticism in the past for neglecting to upgrade their buildings, many
of which house children, elderly, and a lot of people in general. In 2002, Ballot Measures
21 and 22 allowed, but not explicitly granted, for approximately $1.2 billion of state
bonds to be offered for seismic upgrades to public schools and emergency facilities. It
was not until 2009, however, that the Seismic Rehabilitation Grant Program provided $30
million in state bond funds to begin seismic mitigation of schools and emergency
facilities. The state hopes that by 2022 seismic mitigation will be completed for all
emergency facilities, and by 2032, seismic mitigation will be completed for public high-
occupancy schools. Currently half of Oregon schools, 649 buildings total, face a high or
very high risk of collapse in a strong quake, or are constructed of materials not designed
to withstand shaking (Wolf 2011).
Buildings at risk that are not emergency facilities or schools must fare on their own to
perform seismic retrofits. The 2012 Oregon Resilience Plan specifically recommends the
state to develop mandates, tax credits, and other incentives to require or strongly
encourage building owners and tenants to properly brace and anchor deficient

56
nonstructural elements within their buildings. No incentives or subsidies currently exist
for business to perform upgrades, but measures are being considered at the state level to
allow business to receive credits and initiate a star rating system similar to LEED for
buildings to be rated as resilient (Yu, K. personal communication, April 5, 2013).
Hopefully future policy and codes will enable Portland and Oregon to improve their
earthquake resistant profile.
Seismic upgrades are not cheap. There is a major cost tradeoff, as upgrading seismic
resistance may add up to 5 percent of the cost of a new building, and the increase is
higher for retrofitting existing buildings (R. Yeats, Sieh, and Allen 1997). According to
the Oregonian, seismic upgrades can cost about $3 to $4.50 per square foot of basement
or crawl space, with the typical retrofit costing between $3,000 and $6,000 total
(Hunsberger 2010). Other estimates for larger structures have placed the cost per square
foot at $9 to $10, with nonductile concrete frame structures costing two to three times
higher (R. S. Yeats 1998).
The seismic risk of a location is sometimes reflected in the real estate values of the
properties residing in that area. This observation is more prominent in California than in
Oregon, but is useful to consider if Oregon were to begin experiencing more frequent
quakes. According to Porter, et al., economic seismic risk to properties is assessed every
time a property changes hands, thus the best time to bring about seismic-risk mitigation
measures for properties is at the time of sale. Anecdotal evidence, however, suggests that
these are missed opportunities: risk is typically not mitigated, even in more vulnerable
buildings (Porter, Beck, and Shaikhutdinov 2004). Thus disconnect can be observed

57
between owners, buyers, and the public at large in building codes and decisions to
seismically upgrade. This phenomena and problem of taking action in light of the
earthquake problem will be explored in the proceeding section.
VI. Taking Action – Local, State, and National Policy on Earthquake Risk
Awareness of possible earthquakes is high in some communities, but concern is not. This
is problematic because concern motivates action, but awareness does not. Thus while
many in Portland may be aware of the earthquake risk, the lack of concern will prevent
residents from performing necessary seismic upgrades or rallying the government to
improve infrastructure. Furthermore, support for earthquake awareness policies may
depend more on local politics and resources than on technical measures of earthquake
risk provided by Hazus and more general geological assessments. The following section
examines government efforts to raise awareness and concern, as well as reduce risk. The
section will begin with a generalized observation on earthquake policies and then move
to specific policies enacted in the Portland region.
Earthquake policies can be regulatory (as in mandatory building codes), based on
different incentives (tax relief development rights, etc.), or based on information
reporting (disclosure requirements). Different levels of government do not share the same
responsibilities due to the variety of roles that each level plays in regulating and/or
providing services for a given population (Bostrom, Turaga, and Ponomariov 2006). For
example, the national government provides the majority of influence in post-disaster
funds. Conversely, the local government will attempt to promote personal awareness and

58
housing policies to foster resilience and build capacity. A mix of players and forces is
therefore involved in the hazard mitigation process.
Adoption of elaborate mitigation policies and agendas is constrained heavily by several
factors. As previously noted, low public perceptions of earthquake risk prevent pressure
from being applied to governmental entities. Tangibly, the high upfront costs and
uncertain benefits of soft mitigation actions, such as raising awareness on a general level,
make these difficult to enact, as it is impossible to measure the exact cost-benefit ratio of
such efforts. The ability to measure and quantify benefits is further compounded by the
basic lack of technical and financial resources. Tight budgets on all levels of government
leave little room for building resiliency or providing resources for the public to
independently reduce their seismic risk. For example, the Oregon Resiliency Plan was
written and organized completely pay-free, and the seismic assessments involved were
already established and provided by DOGAMI.
Lastly, just as the public’s concern with earthquakes varies, stakeholders’ and
policymakers’ perceptions have a large effect on whether or not a risk measures are
implemented (Bostrom, Turaga, and Ponomariov 2006). Typically, earthquake mitigation
efforts will be prioritized on local agendas when an earthquake event occurs within close
proximity to the relative location. Once again, the Oregon Resiliency Plan falls into this
theory, as its creation was mandated after outcry from the legislature following the
Japanese earthquake of 2011(OSSPAC 2013). Yet this is not enough. It is not sound to
expect the relative governments to act only when a tragedy happens elsewhere.

59
Despite this mismatch in perception, policy exists to help build resiliency prior to an
earthquake, as well as mitigate risk following an event. Many of these polices have been
influenced by Hazus, including the Oregon Resiliency Plan, hence it is useful to review
the relevant influential policies that could influence Portland and have a lasting effect on
the city’s ability to respond to an earthquake. The proceeding paragraphs give an
overview of these policies.
As outlined earlier in this chapter, the national government has played a large role in
funding seismologic research and furthering earthquake awareness. The National
Earthquake Hazards Reduction Program (NEHRP) leads the federal government’s efforts
to reduce the fatalities, injuries, and property losses caused by earthquakes. Most of
NEHRP’s implementation activities are conducted through FEMA’s ability to prepare
and sponsor a variety of published materials that help various group leaders learn about
and use the research conducted by NEHRP (NEHRP 2009). Accordingly FEMA
maintains several grant programs to help state and local governments plan and implement
earthquake mitigation methods. Training for first responders and other state and local
government personnel involved in responding to natural and man-made disasters is also
performed by FEMA. Lastly, FEMA provides substantial support following major
disasters, with a flexible structure that enables local disaster recovery managers to
operate in a unified and collaborative manner. FEMA’s support efforts are organized
according to the following six functions and associated agencies:
Community Planning and Capacity Building Recovery Support – FEMA
Economic Recovery Support – U.S. Department of Commerce

60
Health and Social Services Recovery Support Function – U.S. Department of
Health and Human Services
Housing Recovery Support Function – U.S. Department of Housing and Urban
Development
Infrastructure Systems Recovery Support Function – U.S. Army Corps of
Engineers
Natural and Cultural Resources Recovery Support Function – U.S. Department of
Interior
As this list displays, the nationally provided support for a region following a serious
event entails multiple actors. Together, these Recovery Support Functions help facilitate
local stakeholder participation and promote intergovernmental partnerships to enable
recovery.
In moving from national to regional, the Cascadia Region Earthquake Workgroup
(CREW) operates under FEMA’s banner, and meets quarterly to produce planning guides
and other resources, respond to media requests for information and expertise, and
maintain a gateway website to the many community, state, and federal resources devoted
to earthquake hazards and how to plan for them (CREW 2011). The CREW organization
most recently produced multiple roundtable meetings to provide resources for business
people to discuss their concerns and improve their current level of preparedness. CREW
has done minimal outreach in addition to the aforementioned activities. Yet these
connections could prove necessary in the instance of a major Cascadian quake, as
previously established regional connections could be utilized.

61
In moving from the regional to state level of governance, the Oregon Office of
Emergency Management (OOEM) serves to oversee the state’s planning, preparing, and
response mechanisms. This department has the responsibility of coordinating the
partnerships between public and private organizations, administer grants related to
emergency program management and emergency services for the state, enforce
compliance requirements of federal and state agencies for receiving funds and conducting
designated emergency functions, and perform other duties related to emergency
management.
OOEM currently oversees the aforementioned Seismic Rehabilitation Grant Program to
provide funding for the seismic rehabilitation of critical public buildings, particularly
public schools and emergency services facilities. This program was launched in 2009 and
authorized $22.5 million in state treasury bonds for eligible buildings to be retrofitted to
standards set by the American Society for Civil Engineers. Sixteen schools and eleven
emergency service buildings have been completed as of April 2013. Each project cost
approximately $500,000, thereby limiting the available funds and making the grant
process competitive. Unfortunately, approximately 649 schools remain in high or very
high risk of collapse in a strong quake, or are constructed of materials not designed to
withstand shaking (Wolf 2011). Grassroots groups such as the Oregon Parents for Quake-
Resistant Schools exist in Oregon to raise awareness to this threatening problem, yet the
serious risk remains.
The Oregon Department of Geology and Mineral Industries (DOGAMI) operates as the
geologic information gathering bureau for the state of Oregon. Initially created in 1937 as

62
an independent state agency, it has evolved from its early focus on mining to become
Oregon’s major source of information to help Oregonians understand and prepare for a
wide variety of hazards (DOGAMI 2013). The department creates geologic and hazard
maps to help inform Oregonians understand the risks faced from earthquakes, tsunamis,
landslides, and other hazards. A five-member governing board of citizens is appointed by
the Governor and confirmed by the Senate to set policy and oversee general operations in
order to guide DOGAMI’s mission and objectives.
The City of Portland’s Bureau of Emergency Management (PBEM) has also played a
large role in preparing Portland for the potential quake. PBEM provides a vast amount of
information and resources for the residents of Portland, and occasionally holds seismic
upgrading workshops across the city. The bureau must also update the Portland Natural
Hazard Mitigation Plan every five years in order to prepare for a variety of natural
hazards. In regards to earthquakes, the plan hopes to focus on critical infrastructure
strengthening of water, sewer, and energy facilities (Rueter 2010).
In addition to the Oregon Office of Emergency Management and DOGAMI, the state of
Oregon has provided direct guidance and centralization for the enactment of earthquake
policy in 1991 with the introduction of Senate Bill 96. This bill created the Oregon
Seismic Safety Policy Advisory Commission (OSSPAC), which serves to positively
influence decisions and policies regarding pre-disaster mitigation of earthquake and
tsunami hazards, increase public understanding of hazard, risk, exposure, and
vulnerability through events and other outreach, and to be responsive to the new studies

63
and/or issues raised around earthquakes and tsunamis (OOEM 2013). This group operates
with the following goals in mind:
Develop and influence policy at the federal, state and local levels;
Facilitate improved public understanding and encouraging identification of risk;
Support research and special studies;
Support appropriate mitigation;
Support response and recovery; and
Support and assist in the coordination of a grant program for the disbursement of
funds for seismic rehabilitation of schools and emergency facilities.
As previously noted, OSSPAC delivered the Oregon Resiliency Plan in February 2013.
This document provided a state-wide plan for building resiliency and will hopefully fuel
the enactment of additional policy and action by the state government to increase seismic
awareness and decrease risk. OSSPAC created this plan with the help of DOGAMI and
150 other stakeholders throughout the state. Four scenario impact zones (Eastern, Valley,
Coastal, and Tsunami) were identified and assessed to determine the likely impacts of a
magnitude 9.0 Cascadian earthquake and tsunami. Specific attention was given to the
amount of time required to restore each sector’s necessary functions if the earthquake
were to strike under present conditions. This information could then be used to create
timeframes for restoration and recovery post-earthquake.
The Oregon Resiliency Plan is of extreme relevance to this thesis for its use of Hazus in
its assessment of Oregonian risk. The plan has provided the necessary ammunition for

64
those calling for greater resilience in Oregon by claiming findings listed above, largely
calculated through the use of Hazus. The Plan fails to mention the methodologies or
assumptions behind Hazus, despite the frequent use in calculating the harrowing
estimates. As will be explored in Chapter 3 and 4, the use of this software in the
Resiliency Plan and other assessments can be critiqued.
The notable assessments and findings of the Oregon Resiliency Plan are as follows:
Fatalities ranging from 1,250 to more than 10,000.
At least $30 billion in direct and indirect economic loss.
Debris totaling to 10 million tons, or 1 million dump truck loads.
Complete destruction of 24,000 buildings.
Extensive damage of 85,000 buildings requiring months to years of repair.
Approximately 27,600 displaced households.
An extremely vulnerable liquid fuel supply.
Resilience gaps that could lead to decades of economic and population decline, in
effect, a “lost generation” of Oregonian residential prosperity.
To reduce the vulnerabilities, the Plan insists that Oregon follow the following four
recommendations: 1) undertake comprehensive assessments of key structures and
systems that underpin Oregon’s economy; 2) launch a sustained program of capital
investment in public structures such as schools and transportation systems; 3) provide
incentives for seismic upgrades and resilience; and 4) upgrade Oregon’s public policies to
raise individual awareness and improve mitigation strategies to bring services and
necessities to effected individuals following an event.

65
Progress is slowly being made on implementing the recommendations, according to
discussions with Kent Wu, the Chair and Structural Engineer Stakeholder of the project.
The Oregon State Legislature held a hearing on the plan on March 14 to approve the plan,
and future meetings will be held in order to decide on specific strategies for its
implementation. According to Mr. Wu, plans for creating incentives for businesses to
perform seismic upgrades are in the works, as well as a “resilience rating system” akin to
LEED accreditation. Mr. Wu also spoke of legislative interest in replicating the San
Francisco Earthquake Hazard Mapping Act, which requires responsible planning
agencies to approve only projects within seismic hazard zones following a site-specific
investigation to determine if the hazard is present (CGS 2007). Acts such as these serve
to protect the public against hazards that are not readily visible.
Additional time is needed before the Resiliency Plan can take full effect through enacted
legislation and additional publicity. In the meantime, a considerable amount of
grassroots-led events and non-governmental groups have served to raise awareness
among Oregonian residents. These groups are valuable to increasing resilience despite
their lack of real power to create or change policy. Listing and detailing all of the groups
is outside of the scope of this thesis, yet is important to note of their existence. These
groups use information generated from Hazus and reported in various governmental
reports such as the Resiliency Plan, therefore the accuracy of the tool can affect their
perception and efforts.
VII. Conclusion

66
This chapter has given a wide overview of the history of earthquake research and
knowledge, the evolution of Pacific Northwest seismic awareness, the difficulties in
making predictions, and the ability of the federal, Oregonian, and Portland government to
mitigate the known risks. Each component is of considerable importance in the current
state of earthquake awareness and state of resilience. This information is also noteworthy
in the context of Hazus for two reasons. First, the scientific knowledge on earthquakes,
what causes them, and their effects on the built environment, are explicitly woven into
the Hazus model. Thus it is necessary to understand the science that helped form the
model and create its necessity. Second, it is worthy to make note of the present structures
affecting mitigation activity and the state of preparation within the region, as these
variables can also have a lasting effect on the damage inflicted upon the region, or the
estimated losses in Hazus. Thus the information presented provides context for the
examination and assessment of Hazus in the proceeding chapters.

67
Chapter 3: Hazus as a Tool
The previous chapters have presented the topic of risk on a theoretical level, the real
seismic hazards that contribute to Portland’s risk, and the actions that have been taken by
the government to mitigate the risk. This chapter builds upon the previous two by
providing specific information on Hazus, the loss estimation tool used to assess risk in a
given region. To explore Hazus as a tool, this chapter first provides an overview on the
history of Hazus to give context to the tool’s current state. The chapter then describes the
specific details of Hazus, including its inputs, inventory data, methodologies, and outputs.
The information required to build this chapter was gathered from reading the 700 page
“Hazus – MH 2.1 Technical Manuel,” noting relevant details, and translating them into a
readable format suitable for non-experts. The chapter will only examine Hazus as it is
used for earthquakes. While the tool is also used for other natural hazards, the scope of
this thesis and research question relates specifically to earthquakes and the risk they pose
to the built environment.
I. Hazus History
National earthquake loss estimation officially began with the 1972 National Oceanic and
Atmospheric Agency study for the San Francisco, California region (Kircher, Whitman,
and Holmes 2006). Approximately thirty assessments were performed following the San
Francisco study and prior to the creation of Hazus, with each varying in methodology,
assumptions, and approaches. As noted in Chapter 2, geologic and seismic knowledge
progressed slowly until the 1970s, thereby contributing to varying estimation
methodologies and inputs. Furthermore, the lack of methodological standardization in

68
risk models prevented comparisons to be performed across regions, and contributed to
confusion amongst insurance assessors.
The federal government eventually countered this confusion and used its organizational
and monetary resources to begin a national standardization for methodologies and
assessments. In 1989, FEMA, in conjunction with the National Academy of Sciences,
released the report “Estimating Losses from Future Earthquakes,” thereby giving roots to
Hazus and providing steam for further collaboration (Kircher, Whitman, and Holmes
2006). This report listed a set of guidelines for conducting loss studies, laid the
groundwork for a loss methodology structure, and provided necessary momentum for
methodology development.
Three years later, FEMA entered into a cooperative agreement with NEHRP and the
National Institute of Building Sciences (NIBS), a congressionally authorized nonprofit
organization established to serve as an interface between government and the private
sector. Their goal was to develop a nationally applicable standardized methodology for
estimating potential earthquake losses on a regional basis. NIBS organized an eight-
member Project Work Group (PWG) consisting of earthquake experts to provide
technical oversight and an eighteen-member Project Oversight Committee (POC) to
represent user interest in the earthquake community. Together, these two groups defined
the components of the loss estimation methodology, and prepared a detailed standardized
list of desired methodology outputs according to their expertise (Kircher, Whitman, and
Holmes 2006).

69
NIBS also contracted a joint venture between Risk Management Solutions, Inc. (RMS) of
Melno Park, California and the California Universities for Research in Earthquake
Engineering (CUREE) to identify and evaluate the potential of existing studies for use in
developing the standardized loss estimation methodology (Schneider and Schauer 2006).
Accordingly, RMS and a group of thirty earthquake experts developed the earthquake
loss estimation methodology using exiting literature and damage data from Northridge,
Loma Prieta, and other earthquakes (Kircher, Whitman, and Holmes 2006).
By combining the methodology from RMS, the desired outputs from the POC, and
technical oversight from PWG, Hazus was born. The first release of the Hazus
earthquake model occurred in 1997, and has since been revised multiple times (Schneider
and Schauer 2006). The initial model included substantial methodological and data
achievements, including the adoption of USGS hazard maps, use of census tracts as the
most detailed reference unit for a study site, use of national databases to make the model
nationally applicable, development of occupancy and structural building classification
systems, the use of spectrum-capacity analysis for determining building damage, and
development of models for determining casualties, shelter requirements, debris, and
indirect economic loss. All of the aforementioned variables set precedence for subsequent
nationally applicable hazard estimation models produced by private agencies.
Multiple changes have been made since the inception of Hazus and its first release in
1997. Within two years of its completion, significant improvements and updates were
made to the software to fix bugs and compatibility issues. The most notable change,
arguably, is the adaptation of Hazus to work exclusively with the ArcGIS software

70
platform. This change allowed users to be more flexible in their study area and relative
inputs, thereby producing more accurate outputs. The other notable change is the
extension of loss estimation for other hazards. Flood and wind loss estimate capability
was added in 2004. In Spring 2010, Hazus released the 2.0 version complete with
hurricane storm surge risk analysis capability (Berman 2011). Future releases will include
tsunami estimates, and possibly tornado estimates.
Hazus users totaled approximately 1,700 users prior to addition for floods and hurricanes
(Schneider and Schauer 2006). Numbers are expected to increase substantially with the
release of the software in an online format. The online format is not included in the scope
of analysis, but could undoubtedly affect the accessibility, user count and ease of use.
II. Current HAZUS Earthquake Model
The following section provides an overview of the software and methodology used and
examines the datasets provided in the software’s inventory. Each module will be explored
in detail to provide groundings for the proceeding chapter’s analysis. Lastly, this section
examines the results and outputs provided by Hazus, thereby examining the tool in full
scope. The most recent version of the software released in 2012, Hazus - MH 2.1, will be
the prime focus of this analysis. This analysis will also exclusively focus on the use of
Hazus for earthquake hazards. Hazus applied to estimation for floods, hurricanes, and
other events will not be considered, although many of the methodologies and inputs are
similar.
a. General Scope
71
Hazus is a loss estimation tool that attempts to combine explicitly geologic and seismic
knowledge of the built environment with engineering tools and data that can assess loss.
The software can be used for three broad applications: emergency preparedness,
mitigation, and response and recovery. First, Hazus aids in developing emergency
response plans by providing necessary estimates for temporary housing needed by those
rendered homeless, potential debris, emergency medical services from injuries, and
evacuation/emergency route clearance. Response exercises can then be performed with
these estimates in mind.
Second, mitigation can be strengthened through the tool’s output by identifying “at-risk”
structures, communities, and land parcels. This information can provide evidence for the
adoption and enforcement of hazard resistant building codes and upgrades, as well as
project at-risk areas for land-use planning processes. Planning and emergency
management bureaus can assess the level of readiness and preparedness to deal with
disasters and target at risk communities for mitigation improvement accordingly.
Lastly, Hazus can aid in the creation of post-disaster damage assessment. This can be
done by fostering response planning for critical transportation outages, identifying critical
infrastructure, creating recovery action plans, and aiding in long-term economic recovery
planning. Users can then modify inputs to account for projected upgrading of vulnerable
infrastructure to discover the positive effects that these improvements can have. This
information will allow users to allocate resources for the most effective and efficient
upgrades.

72
There are three general types of Hazus users according to the software guidebook. First,
the “Default Data Analyst,” who performs an analysis mostly on the input data provided
with the methodology. This user does not need extensive technical knowledge nor does
their analysis include the following important pieces of information: damage or loss due
to liquefaction, landslide or surface fault rupture, damage or loss due to tsunamis, and
seiche or dam failure. This user receives the most basic information, and since their data
may not be as complete or accurate, the outputs may not be preferable. This level of
analysis is typically very granular, and the results from this process should serve only as a
baseline for further analysis (Ng 2010).
The second and most common user is defined as the “User-Supplied Data Analyst”. This
user requires a more extensive inventory data collection processes and analytical effort.
The typical purpose of this user is to generate the best estimates of earthquake damage
and loss by employing consultants to assist in implementation of certain methods. This
type of Hazus user will also employ default inventory data. Unfortunately, this user also
does not have the capacity to include all available and updated information in the
analysis, depending on the experts consulted and data included. According to the
guidebook, this user also needs approximately one to six months to obtain all of the
necessary input for this type of analysis.
The final user of Hazus is the “Advanced Data and Models Analyst”. This user
incorporates results from engineering and economic studies carried out using methods
and software not included with the methodology. This user will need typically six months
to two years to complete the analysis. These users employ the software on a very specific

73
level, and will likely be examining one component of the overall hazard assessment, such
as effects of ground shaking on a hospital or the additional safety that could result from
updated water infrastructure. This type of expert-user will likely modify or substitute the
model parameters and/or equations relevant to a given hazard.
On the most basic level, performing an analysis in Hazus typically proceeds as follows:
1. Define the geographic area of analysis;
2. Define the hazard
3. Overlay inventory and provided data
4. Estimate damage
5. Estimate losses and needs
To perform the above tasks, the following six primary components (modules) are used:
Potential Earth Science Hazards – Ground shaking and site effects;
Inventory – classification system, default databases, data collection and handling;
Direct Damage – general building stock, essential facilities, transportation and
utility lifeline systems;
Induced Damage – inundation, fire flowing, hazmat release, debris;
Direct Loss – economic loss, causalities, shelter requirements, loss of function;
Indirect economic loss – long term effects of direct impacts
Table 3.1 on the following page presents the outputs of Hazus from each module. Figure
3.1 on the Page 72 presents the basic structure of Hazus, and should be used as a
reference for the entire chapter. As the figure displays, all of the modules mentioned
above are interdependent of one another, thereby providing users with a very large
amount of information to work with.

74
Module Outputs
Direct Damage
General Building Stock
Essential Facilities
Transportation Systems
Utility Systems
Induced Damage
Inundation
Fire Following (limited)
Hazardous Materials Release
(limited)
Debris Generation (limited)
Direct Losses
Cost of Structural Damage
Income Loss
Casualties
Shelter Needs
Indirect Losses
Supply Shortages
Sales Decline
Opportunity Costs
Economic Loss
Table 3.1 Hazus Modules and Outputs

75
Figure 3.1 Hazus Methodology (FEMA 2012a)
b. Hazus Inventory Data
The Hazus software includes a substantial database with a nationwide inventory of
persons, buildings and facilities, transportation systems, utility systems, and hazardous
material (hazmat) facilities. The proceeding sub-section will examine the data provided

76
in the Hazus-MH software. This is important to note as it is used by all user levels and
can thereby significantly affect outputs.
Hazus includes three types of inventory data: aggregate, site-specific, and hazard-
specific. Aggregate data represents inventory that is common across all hazard models
and includes demographics (i.e. age, income, ethnicity, ownership, and gender) and
general building stock. Site specific data includes independent points representing
various facilities and systems of inventory (i.e. hospitals and other essential facilities).
Hazard-specific data includes building inventory and mapping schemes uniquely defined
for each of the hazards (Ng 2010).
The general building stock includes residential, commercial, industrial, agricultural,
religious, government, and educational buildings. The database includes square footage
by occupancy, full replacement value by occupancy, building count by occupancy,
general occupancy mapping, and demographics of residents. The inventory was
developed from multiple government sources, including the Census Bureau and
Department of Energy, as well as private sources such as the firm Dun and Bradstreet,
which was used to acquire demographics for commercial buildings and businesses.
Square footage for different occupancies of buildings is also included. Buildings are then
categorized into structural categories according to five general characteristics, listed
below:
Structural parameters affecting structural capacity and response. This includes the
building’s basic structural system (type of frame), height, and seismic design
criteria;

77
Nonstructural elements affecting nonstructural damage;
Occupancy, affecting casualties, business interruption, and contents damage;
Regional building practices, such as codes; and
Variability of building characteristics within the classification.
These buildings are then grouped according to seven occupancy groups: residential,
commercial, industrial, religion/nonprofit, government, education, and lifelines. The
seven groups are stratified further into thirty-three specific classes according to square
footage inventory. The data collected on building stock is then rolled up and computed at
the centroid of the census tract to simplify analysis.
Essential facility loss estimations are considered separately from those listed above.
These buildings include hospitals, fire stations, police stations, and schools – all essential
to mitigation and recovery efforts. The inventory data for these buildings is dated from
2000-2003, and provided from the American Hospital Association, InfoUSA, Inc.,
National Center for Education Statistics, and the US Department of Education. The
module for these special buildings is slightly different than others since its purpose is to
determine the expected loss of functionality as opposed to explicit monetary losses. Users
are encouraged to include the number of hospital beds and fire trucks to improve
accuracy. Detailed analysis of recovery time and resources available to the community
will be then computed according to structural components of the building and seismic
effects. To calculate general economic losses, users are instructed to move the essential
facilities into the analysis of total building stock and disregard their functional purpose.

78
High Potential Loss Facilities and Hazardous Material Facilities are also given their own
specific categories, and are considered to be buildings likely to cause extremely high
losses if damaged. High Potential Loss Facilities include nuclear power plants, dams, and
some military installations. Hazardous Material (Hazmat) Facilities include buildings
with an inventory of toxic, radioactive, flammable, explosive, or reactive substances that
can pose significant hazards and a unique risk to the surrounding environment. Damage
from these materials can vary depending on the type and quantity of substance released,
meteorological conditions, and timeliness and effectiveness of emergency response.
Hazus inventory provides the geographical location of the facilities, but damage and loss
estimation calculations are not performed. The handbook notes that significant casualties
or property damage could occur from a small number or even a single hazardous
materials release induced by an earthquake. Further elaboration on the problems of
avoiding analysis of hazmat and high potential loss facilities is examined in Chapter 4.
Transportation systems provided by Hazus 2000 inventory include highways, roadways,
bridges, tunnels, railways, light rail, bus, ports, ferries, and airports. During the creation
of a study area, transportation system geometries from feature classes are transferred to a
geodatabase for users. For some of the transportation systems, classification is based on
whether the equipment is anchored or designed with special seismic tie-downs or
tiebacks. Unanchored equipment refers to equipment designed with no special
considerations. These inputs are generally classified to allow for differentiation between
components with substantially different damage and loss characteristics.
The inventory data for lifeline utility systems includes the following:

79
Potable water: pipelines, water treatment plants, wells, storage tanks, and
pumping stations
Waste water: pipelines, waste water treatment plants, and lift stations
Oil: pipelines, refineries, pumping plants, and tank farms
Natural gas systems: pipelines and compressor stations
Electric power: substations, distribution circuits, generation plants, and
transmission towers
Communication: telephone central offices.
This data is stored in feature classes and tables, and is used to consider problems and
losses caused by infrastructure damage.
Default demographic data is gathered from the 2000 Census and reported by census tract,
and includes data on all census tracts in the United States. The demographic data was
collected from the Census Bureau, and describes characteristics of the population
including age, income, housing, and ethnic origin. A total of twenty-nine census fields of
direct importance to assessing risk were placed in the provided Hazus database. Data is
aggregated to the census tract level following the mining of the software’s inventory and
user modifications. Direct social and economic losses are then calculated by the modules.
Specific data fields and their use in the modules are presented in Figure 3.2 below.

80
Table 3.2 2000 Census Data Included in Hazus (FEMA 2012a)
Lastly, users are encouraged to provide their own indirect economic loss data according
to the user’s assessment of possible change in demand and supply of products, change in

81
employment, and change in tax revenues. Users can also specify the levels of potential
increase in imports and exports, supply and product inventories, and unemployment rates.
These data could increase accuracy in the economic loss modules. Conversely, the
additional data could contribute to varying outputs in economic loss modules, as not all
users will be able to provide this data into the software.
It is unknown how often the Hazus inventory database is updated. This is especially
important when analyzing larger areas, and as will be discussed in Chapter 4. Database
problems can also arise when considering uncategorical structures, new features to
generalized areas, seismic upgrades, or demolition. Following collection of data, Hazus
will calculate building replacement costs and other estimations for the study area
depending on the degree of damage expected through the Potential Earth Science Hazards
(PESH) algorithms. The methods for determining these figures will be explored in the
proceeding section.
III. Hazus Methods
The previous section presented an overview of all inventory data provided within the
Hazus software. This section provides detail on the methodology used in Hazus 2.1 to
estimate potential earth science hazards (PESH), direct physical damage, indirect
physical damage, direct loss, and indirect loss. These modules are important to consider
in this analysis as the utilization and specification of each module will have a substantial
influence on the output and associated costs and lost estimations. This section outlines

82
each module and its respective output, and is organized in sub-sections according to
module and generation type.
Hazus allows users to have freedom in determining the amount of influence that each
module and risk factor can have in the region of study. For example, a user may wish to
ignore induced damage when computing direct losses or to study the effect of proposed
code changes upon losses to buildings without having to consider lifelines (Kircher,
Whitman, and Holmes 2006). Other users may want to ignore buildings and explicitly
examine lifelines or casualty estimates.
Figure 3.1 on page 71 presents the Hazus methodology in a generalized format. As the
figure displays, the software begins at the top with determining “Potential Earth Science
Hazards”, or how the ground will react to a quake, then moves to calculate the amount of
damage to be expected. The following subsections will detail each method employed by
Hazus.
a. Potential Earth Science Hazards
The Potential Earth Science Hazards (PESH) category generally includes estimations for
ground motion, ground failure (liquefaction, landslides, and surface fault rupture) and
seiche (enclosed body of water swaying). The outputs from this module provide an
understanding of how the ground and natural elements will act in a quake, thereby
allowing for analysis on the built environment to be performed.
Ground motion is characterized by the amount of spectral response anticipated, the peak
ground acceleration, and peak ground velocity of a given area. The user is able to define

83
the spatial distribution of ground motion with three options. First, users could employ the
USGS’s National Seismic Hazard Maps, revised most recently in 2008 to reflect recent
earthquake science and building codes. Second, users could use the methodology innate
in the Hazus software, which provides maps for eight probabilistic hazard levels.
Estimates are generated in the form of GIS-based contour maps and location specific
demands and are stored in relational databases. Lastly, users could supply their own
ground motion map created through other means. These maps must be compatible with
Hazus in a pre-defined digital format and reflect soil amplification.
A census tract’s ground motion properties are simplified to the centroid of that tract.
Ground shaking is then calculated according to one of three scenarios: (1) deterministic
calculation, or when the user specifies a scenario earthquake magnitude and location; (2)
probabilistic maps, supplied with Hazus, or (3) the user’s own maps created outside of
Hazus. For the deterministic calculation, users select their preferred attenuation function,
or how the seismic waves will move through the crust and fault type. In lieu of a user-
provided soil map, Hazus will assume a standardized soil at all sites or allow the user to
manually modify the soil type based on five pre-determined categories. Ground shaking
is calculated according to geologic-inspired algorithms. Users with specific seismic or
engineering expertise are able to modify the variables, i.e. attenuation, according to their
desired analysis.
Specific inputs are required for each type of ground failure. Liquefaction requires a
geologic map with the soil age, depositional environment, and material characteristics of
the geologic units, a groundwater depth map, and magnitude of earthquake. Landslide

84
analysis requires a geologic map, a topographic map, and a map with ground water
conditions, as well as the earthquake magnitude. Lastly, surface fault rupture requires the
surface trace location of the active faults that are postulated to rupture during the scenario
earthquake.
Ground failure is considered following determination of shaking, and can come in the
form of liquefaction, landslides, and surface fault rupture. According to the Hazus
handbook, the evaluation of the hazard includes the probability of the hazard occurring
and the resulting ground displacement. A liquefaction susceptibility rating is assigned to
each soil type based on age, dispositional environment, and material type for a particular
mapped geologic unit. The ratings are then applied to the census tracts and later
considered in the building evaluations.
With the combined information entered into the model, Hazus will produce an aerial
depiction map with the estimated permanent ground deformations from liquefaction and
landsliding. Fault rupture will be considered in the overall output of damage and not
produce an output map. As with other PESH modeling, qualified experts can refine the
methods to prepare improved estimates of ground failure. These users are typically
geotechnical experts with sufficient expertise in ground failure prediction.
b. Direct Physical Damage – Building Stock, Essential Facilities, Transportation,
and Utility Lifeline Systems
The proceeding sub-section will describe the methods used to calculate direct physical
damage from earthquakes to the built environment in a given area. As outlined in Chapter

85
2, damage to a building depends on magnitude and proximity to faults, ground shaking
and failure, and the structure of a building. The previous section explained the methods
for determining expected geologic and ground activity in an earthquake. With this
information, two primary functions are used by Hazus to measure the direct physical
damage. First, fragility curves describe the probability of reaching or exceeding different
states of damage given building response to the ground failure and shaking. Second,
building capacity curves determine peak building response according to the building
categories outlined in Section II.
Additional inputs are encouraged in order to perform detailed, building-specific analysis.
As previously mentioned, Hazus provides a massive database of buildings. Users running
the tool on specific sites that are smaller than the provided census tracts are directed to
use more specific datasets on their area of analysis (i.e. for a small neighborhood,
company headquarters, school district, etc.). The additional inputs required to determine
damage comprise of model building type, including height, and seismic design level that
represents the building or group of buildings of interest, and will prevent the tool from
generalizing to the census tract level. The ground response spectrum at the site of interest
is also required, and can be determined within the specific parameters of the small site of
analysis, or extrapolated onto the site from the centroid of the census tract area.
The output of this analysis will provide the user with the estimate of the cumulative
probability of being in, or exceeding, each damage state for the given level of ground
shaking or failure. The outputs are then used directly as inputs to induced physical
damage and direct economic and social loss modules. The Handbook states there could

86
be a problem with this method, however, by noting the curves to be more reliable as
predictors of damage for large, rather than small, population groups, such as the school
district, building compound, or neighborhood. Specific facilities should consult a
seismic/structural engineering expert for a reliable prediction of damage. The problems
associated with this flaw are explored in Chapter 4.
The ground shaking and liquefaction estimates provided in the PESH module combined
with the building response estimations allow Hazus to estimate casualties and injuries due
to structural damage, monetary due to building damage, monetary losses from business
interruption, social impacts, and other economic and social effects. The methodology
then categorizes losses in four generalized ranges: Slight, Moderate, Extensive, and
Complete. Explicit descriptions of individual building responses are not available due to
the inability to describe building damage as a continuous function. Rather, Hazus will
provide descriptors of each type of damage according to building type are provided
following analysis.
In addition to shaking, Hazus accounts for building damage due to ground failure
(liquefaction). Generally, damage to a building due to ground failure will contribute only
to extensive and complete states of damage, thus Hazus places the affected buildings into
states of either undamaged or severely damaged, as buildings rarely escape liquefaction
without serious impairment. The methodologies for ground shaking are more detailed due
to the extreme variance in building response to shaking, and the effect that shaking
duration can have on a building. Shaking duration is assumed to be a function of

87
earthquake magnitude and is described qualitatively as either short, less than magnitude
5.5, moderate, from magnitude 5.5 to 7.5, or long, at magnitude greater than 7.5.
It is necessary to look beyond the general building stock when calculating damage. To
address this, Hazus provides users with the ability to calculate damage for essential
facilities, transportation, and utilities. These variables are of critical importance in order
to treat those affected, reduce direct loss, begin repairs, and reinvigorate the economy
following an event.
Calculating loss and damage for essential facilities (hospitals, fire stations, etc.) requires
additional inputs beyond the standard data provided in the Hazus inventory. Specific
model building type and seismic design level are necessary to calculate the essential
facility’s response. The guidebook notes that performance of essential facilities is not
expected to be better than a typical building of the same structural type, but should be
explicitly examined in a separate analysis.
Transportation systems include highways, roadways, bridges, tunnels, railways, light rail,
bus, ports, ferries, and airports. The category “utility systems” includes potable water,
waste water, oil (crude and refined), natural gas, electric power, and communication. The
geographical location of these items and their specific classification is required to
calculate damage. The module will then provide users with the direct repair costs of each
component and the number of days required before full restoration based off of ground
shaking and failure. The components are then classified into five damage states: none,
slight/minor, moderate, extensive, and complete damage.

88
High potential loss facilities must be considered outside of general building stock as well,
but for separate reasons. These facilities require elevated seismic and engineering
expertise due to the extreme damage and destruction these buildings can cause. Hazus
does not account for these facilities due to the extreme variance in response. Additional
information on the risks these buildings cause and how Hazus accounts fails to account
for them will be explored and critiqued in Chapter 4.
c. Indirect Physical Damage – Hazards Resulting from Earthquakes
Harm to an area extends beyond explicit damage induced by shaking, soil failure, and
inundation. Earthquakes can trigger a host of risky events such as fires, debris wreckage,
landslides, and tsunamis. The Hazus methodology accounts for many of these events,
with greater attention and detail given according to the user’s provided inputs. The
following sub-section will examine the module for calculating these hazards produced by
inundation, fires, and hazmat release.
Inundation can occur from tsunamis (seismic sea waves), seiches (sloshing effects in
lakes and bays), or dam/levee failure. The Hazus guidebook notes that the failure of a
single dam or levee could result in large losses, and therefore a site-specific analysis
should be done instead of using the tool. Hazus will compute the potential exposure to
earthquake-caused inundation by identifying potential sources of flooding by overlaying
existing inundation maps with other data. Losses resulting from these hazards are
excluded, however, which could present a problem if users do not assume these structures
to be vulnerable and ignore the risk inherent in these hazards.

89
Earthquakes also produce serious fire hazards, and previous earthquakes have shown how
losses from fire can sometimes outweigh the total losses caused by the earthquake, such
as the collapse of buildings or disruption of lifelines (Ren 2004). Factors affecting the
severity of post-earthquake fires include but are not limited to: ignition sources, types and
density of fuel, weather conditions, functionality of water systems, and the ability of fire
fighters to suppress the fires. Ignition rates for use in Hazus were determined according
to an empirical statistical analysis and examining fires started following seven
earthquakes in California. Spread rates account for the direction of spread, wind velocity,
and fire resistance of structures. The model then accounts for suppression of the fire by
the fire department, assuming it isn’t damaged beyond repair, according to the timeline of
discovery, reporting, arrival, control, and suppression.
The Hazus model for assessing fire damage is weak, and the guidebook notes that “the
model is still considered to be a technology which is in the maturing process.” (FEMA
2012a). This weakness is due to the high variability in readiness of local fire departments
and the types and functionality of water systems following an earthquake, according to
the guidebook. Regardless, the “fire following earthquake” results provide an estimate of
the number of serious fire ignitions that require fire department response after a scenario
earthquake, an estimate of the total burned area, and an estimate of the population and
building exposure affected by the fire. With this information, users could study the
effects of building more fire stations and improving immediate post-earthquake response
to detect and suppress fires. Users can then decide which activities can be performed to
reduce risk and evaluate the cost-effectiveness of each option.

90
The release of hazardous materials is another serious event that can result from
earthquakes. Hazardous materials refer to usable or wasted chemicals, reagents, or
substances that exhibit physical or health hazards. The methodology for determining loss
is restricted to identifying the location of the facilities that contain hazardous material
(hazmat) which could lead to a significant immediate demand on health care and
emergency response facilities, such as large toxic releases, fires, or explosions. The
Hazus guidebook stresses that assessing risk and damage requires expert opinion, thus
users of the software should look elsewhere. As will be noted in Chapter 4, the neglect of
Hazus to include this presents many systemic problems.
Lastly, Hazus accounts for debris by splitting it into two categories. First, debris that falls
into large pieces, such as steel members or reinforced concrete elements, which require
special treatment to break into smaller pieces before being hauled away. The second type
of debris includes smaller pieces made of materials such as brick, wood, glass, building
contents, and other materials. The estimates for this model are based on observations of
damage that have occurred in past earthquakes, and estimates of the weights of structural
and nonstructural elements.
d. Direct Loss – Casualties and Displacement
Estimating potential casualties for any destructive event is not an easy task. An
extraordinary host of scenarios can occur following an earthquake that can impact the
casualty and injury rates. Potential direct physical damage from earthquakes and indirect

91
physical damage from fires, inundation, hazmat releases, and other random events all
threaten the built environment and affect the loss potential.
To approach this sensitive topic, Hazus created a methodology based on the assumption
that there is a strong correlation between building damage and the number of causalities
and severity of injuries. The handbook notes a lack of precedence in casualty estimation
as well as a lack of data regarding earthquake related casualties according to building
type and the “casualty generating mechanism” causing injury and death. The gaps in data
prevent the most accurate model and estimation from being produced.
Regardless of the limited scope, Hazus will provide casualty and injury estimations by
considering variables such as occupancy potential, collapse and non-collapse
vulnerability of the building stock, time of the earthquake occurrence, and spatial
distribution of the damage. The output of the module consists of a breakdown by injury
severity and casualty rate calculated at the census tract level. The levels of injuries are
presented in Table 3.3 below. The four-level injury scale represents a compromise
between the demands of the medical community in order to plan their response and the
ability of the engineering community to provide the required data.

92
Table 3.3 Injury Levels Calculated in Hazus (FEMA 2012a)
Additional variables and data are required of the user prior to running the module. Users
are provided three different time options:
Earthquake striking at 2:00 a.m. (nighttime scenario)
Earthquake striking at 2:00 p.m. (daytime scenario)
Earthquake striking at 5:00 p.m. (commute time scenario)
The different scenarios are chosen to reflect the highest number of casualties that could
be expected for the population at home, at work/school, and during rush hour. The
population for each census tract is distributed into six basic groups: residential,
commercial, educational, industrial, commuting, and hotel. Population distribution is
inferred from the data provided by the Census Bureau and Dun and Bradstreet. Inherent
error is possible in the data but not accounted for in the module’s calculation. Users are,
however, able to make modifications to the default information considering improved
knowledge.

93
The other modules in Hazus provide the ground and structural conditions necessary to
estimate the losses. The following default casualty rates are then provided:
Indoor casualty rates for structural damage by model building type according to
level of structural damage, with or without structural collapse;
Outdoor casualty rates for structural damage by model building type according to
level of structural damage; and
Commuter casualty rates by bridge for the complete damage state.
Casualties are calculated using a casualty event tree beginning with the initial event
(earthquake scenario) and following the possible course of events leading to loss of life or
injuries. Figure 3.2 on the proceeding page provides a conceptual example of the figure
trees considered in the module. Thus the number of occupants killed is a product of the
number of occupants of the building at the time of the earthquake and the probability of
an occupant being killed.
Figure 3.2 Hazus Casualty Event Tree Model (FEMA 2012a)

94
The Hazus guidebook notes it is possible for differing levels of earthquake preparedness,
such as the effectiveness of the emergency medical system and the training of the public
in personal protective measures such as “duck and cover,” might cause casualty rates to
differ. Casualty patterns according to people who evacuate collapsed buildings either
before or immediately after the collapse is also difficult to quantify since most post-
earthquake reconnaissance efforts do not take note of this information when treating
patients.
Casualties may also occur due to outdoor falling hazards such as damaged parapets,
loosened bricks, broken window glass, signage, awnings, or non-structural panels. In the
United States, casualties due to outdoor falling hazards have been caused primarily by
falling unreinforced masonry, yet it is noted that people outside of buildings are less
likely to be injured or killed than those inside. For example, 20 out of 185 people killed
in the Loma Prieta earthquake were outside (Wagner 1996). This earthquake occurred in
a relatively suburban and rural area, thus it is quite possible for a given earthquake to
occur at a time of day and in a densely built-up locale where relatively more exterior
casualties would occur. Hazus assumes, however, that those who manage to evacuate are
neither killed nor receive life threatening injuries. The problems associated with the
assumptions in the casualty model will be explored in Chapter 4.
The displacement of persons due to loss of housing habitability can have a substantial
effect on the ability of an area to recover following an earthquake. Hazus accounts for
this loss and realizes that many households may need alternative short-term shelter
provided by family, friends, renting apartments or houses, or public shelters provided by

95
relief organizations such as the Red Cross, Salvation Army, and others. The estimates
provided by Hazus can be extremely beneficial to emergency planners in order to plan for
short-term housing needs and project long-term impacts on the housing stock. As such,
the module provides two estimates. First, Hazus provides an estimate of displaced
households due to the loss of habitability, calculated directly from damage inflicted on
the residential occupancy inventory and the loss of water and power. Second, an estimate
is provided to account for the number of people requiring only short term shelter.
Displaced households accounts only for homes affected due to ground shaking or failure,
and neglects to account for fire, inundation, or hazmat release. Users are advised to
perform specific, targeted assessments on areas to account for these types of losses.
As with the other modules, users can modify the default existing data based on improved
information on the housing stock of the region of assessment. The estimated number of
displaced people is then calculated by combining the number of uninhabitable dwelling
units due to actual structural damage and the number of units perceived to be
uninhabitable by occupants. The guidebook notes that approximately 80 percent of pre-
disaster homeless will seek public shelter and that approximately one-third of those in
public shelter come from residences with little or no structural damage. Methods to
account for these residents are not provided.
The population is stratified in the model according to race and nationality due to the
assumption that Hispanic populations from Central America and Mexico tend to be more
concerned about reoccupying buildings than other groups, and therefore their residency in
assistance housing will be longer. The guidebook states, “This tendency appears to be

96
because of the fear of collapsed buildings instilled from past disastrous Latin American
earthquakes…” and also notes, “Such tendencies will probably expand to all ethnic
groups should a large number of casualties occur.” (FEMA 2012a). Users can also add
weights to account for age and ownership, as young families tend to seek shelter in a
larger proportion than other age groups due to lower per capita income.
As noted, long-term housing recovery can have a significant impact on a region.
Following an earthquake, long-term needs are accommodated by importing mobile
homes, reductions in vacancy rates, net emigration from an area, and eventual repair or
reconstruction of the housing units. Replacement of permanent housing is subject to
normal market and financial forces, thus low-income housing is the last type of housing
to be replaced. Examples from the Loma Prieta and Northridge earthquakes show that
housing recovery times span a wide range and are typically far longer than might be
estimated from typical planning rules of thumb. Replacement of housing tends to be very
dependent on settlement of insurance claims, federal disaster relief, the effectiveness of
smaller contractors, and the financial viability of the home or apartment owner. Hazus
attempts to account for the variability in replacement by stratifying houses according to
socio-economic status, then projecting replacement cost by estimating “an appropriate
mix of construction classes” classified as economy, average, custom, and luxury, then
estimating replacement costs accordingly. Actions taken by the state and local
government could expedite and reduce costs of the process, but rebuilding usually takes
longer than most commercial, industrial, and institutional entities.
e. Direct and Indirect Economic Losses

97
Prior to Hazus, loss estimation studies generally limited the consideration of loss to
estimates of the required repair and replacement of the given building stock. Hazus goes
beyond the former methods by providing estimates of the associated loss of building
contents and inventory in addition to the structural and nonstructural repair costs caused
by building damage. The direct economic loss estimates are considerably powerful and
useful for communicating risk to the public, setting insurance rates, and crafting
mitigation strategies. The “Indirect Economic Losses” module includes additional
estimates for losses accrued from lack of functionality, such as business interruption and
rental income losses. The “Direct Economic Losses” module thus explicitly focuses on
losses resulting from physical damage.
To calculate economic effects, commercial buildings are stratified according to sector
type. Using the sector as an indicator, the methodology will project default values for
each business’s recovery and interruption time. Hazus then uses the building data
provided to produce estimations for relocation expenses, inventory losses, loss of
proprietors’ income, rental income losses for businesses, relocation cost, and recovery
costs. Relocation costs are incurred when the level of building damage is such that the
building or portions of the building are unusable while repairs are being made. Hazus
limits its scope to determining disruptions costs and the cost of renting temporary space.
Relocation expenses are a function of the floor area, the rental costs per day per square
foot, disruption costs, the expected days of loss of function for each damage state, the
type of occupancy, and the structural damage state itself.

98
Direct losses due to transportation and utility systems are also considered but are limited
to the cost of replacement or repairing damage to the lifeline system. Loss estimates are
not given for high potential loss facilities or hazmat stores. Thus the “Direct Economic
Losses” module is considerably limited. The guidebook notes, “The real socio/economic
picture is much more complex: economic impacts may have major societal effects on
individuals or discrete population groups, and there may be social impacts that ultimately
manifest themselves in economic consequences.” (FEMA 2012a). These correlations
between damage and long-term loss are hard to discern, quantify, and model due to
unavailable data and complexity of issues. Yet these additional burdens and losses must
be considered despite their complexity due to the considerable amount of influence they
can have on a community. For example, losses from business interruption and lack of
building space to operate in may cause significant unemployment in the region and have
a lasting effect on the region’s prosperity. Thus estimates to account for losses from
business interruption and job losses could provide mitigation planners with tools to plan
for resources needed following an event.
Indirect economic losses include losses that are not directly related to the physical
components of the area of study, hence their “indirect” title. Hazus limits indirect
economic loss calculations to businesses, and excludes losses that could occur for
residential home damage. Accounting for indirect economic losses requires the user to
think of potential losses from induced supply shortages (forward linkages) and demand
reductions (backward linkages). Forward linking businesses rely on regional customers to
purchase their output while backward-linked businesses rely on regional suppliers to

99
provide their inputs. Both are equally vulnerable to earthquakes. Businesses will have
three options: 1) secure additional supplies from outside regions (imports); 2) obtain
additional supplies from the undamaged factory (excess capacity); and 3) draw from
other business’s unsold stock. Hazus does not deal with the varying outcomes of business
decisions, as it is impossible to unquestionably know individual business response,
despite the impact these decisions will have on long-term economic recovery.
Study regions for the Indirect Economic Loss module may consist of single counties,
several counties comprising a metropolitan area, or lower levels of aggregation such as
census tracts. The estimates will be most accurate, however, when applied to areas with
cohesive economic tendencies, as Hazus can then meaningfully represent the region’s
economic structure. Additionally, focusing this module on small census tracts may
misrepresent the relationship between place of work and place of residence, as many
people do not work in their census tract.
Timelines are provided at various levels of temporal resolution for the fifteen year period
following the earthquake to project short and long-term economic effects. Weekly time
intervals are used for the first two months. Monthly intervals are then used between
month two and twenty four. Lastly, annual evaluations are used from year two to fifteen.
The timelines provide useful estimations for recovery planning.
Hazus will use an input-output model to trace inter-industry ripple effects. Input-output
modeling traces the flows of goods and services among industries and from industries to
households, governments, investments, and exports. The trade flows indicate how much
100
of each industry’s output is comprised of its regional suppliers’ products, as well as the
inputs of labor, capital, imported goods, and the services of government. The model can
be manipulated to reveal the economy’s interconnectedness in terms of direct transactions
and dependencies between businesses and the built environment. Critics claim that this
type of modeling is insensitive to price changes, technological improvements, and the
potential for input substitution at any given point in time. Regardless, the creators of
Hazus have assumed this method to be the best for estimating damage and recovery time.
The Indirect Economic Loss module is linked to other modules through three channels in
which damage is introduced. First, building damage will cause loss of function and
thereby cut output. Hazus accounts for this by creating specific modules for each type of
occupancy class (i.e. agriculture, mining, manufacturing, service, etc.). Second, Hazus
considers the stimulus effect caused by post-disaster spending on reconstruction, repair,
and replacement of damaged buildings and their cotenants. Lastly, the reconstruction
inputs for transportation and utility lifeline damage will also provide a stimulus effect and
is accounted for in Hazus accordingly. Reconstruction spending, financed by both private
and public initiatives, exerts a powerful influence on indirect loss and recovery time;
therefore it is crucial for this factor to be accounted for in the module.
To create the most accurate indirect economic loss estimates possible, users are
encouraged to provide the variables listed in Table 3.4 below.

101
Table 3.4 User-Supplied Inputs for Calculating Economic Loss (FEMA 2012a)
The model was built considering patterns from previous disasters, suggesting the
following: 1) normal spending patterns are not significantly altered post-disaster; 2) the
workforce is highly mobile, particularly in the construction sector; and 3) relative prices

102
do not change appreciably. If excess demand is detected, the algorithm will check to see
if sufficient capacity exists in the relative sector.
The output of this module is released in two reports. The first provides users with the
percent and level of indirect economic impact for the study region economy in terms of
employment and income effects for a region that receives outside aid after the disaster.
The second report will provide the percent and level of indirect economic impact for the
study region’s economy in terms of employment and income effects for a region that does
NOT receive outside aid.
The guidebook also suggests the following alterations that could be considered and
incorporated into the overall loss:
1. Expand the number of industries to better reflect building classes and individual
lifelines (i.e. beyond the standard agricultural, mining, construction, etc.
categories).
2. Investigate the implications of how shortages and surpluses are addressed. It is
assumed in the module that producers will look to regional excess capacities, yet
local producers may look to imports as a source of replacement. Performing
survey research on the area businesses to ascertain how producers might actually
respond.
3. Make parameter values sector specific, instead of having supply and demand be
identical across all sectors.
4. Approximate price effects. Significant relative price changes generally do not
occur due to the illegality of price gouging, but can happen for certain goods
regardless.
5. Extend the model to assess indirect loss/gain incurred by surrounding regions and
the national economy. Demands elsewhere may suffer as a result of federal
money being directed to disaster zones.

103
Lastly, the Hazus guidebook also instructs users to consider the long term national effects
of providing disaster assistance. As with households, governments cannot escape the
financial implications of increased spending for disaster relief. Additional debt must be
taken on to provide assistance and make repairs, thereby forcing budgetary decisions to
compensate for the additional payments. The Hazus guidebook notes that the government
will need to choose to raise taxes, cut low-priority programs, curtail services, or amass
additional debt, shifting the burden onto future taxpayers. Thus from a national stance,
indirect losses can be measured by deriving the regional indirect impacts, adjusted for the
liability the Federal government incurs in providing disaster relief, and for offsetting
increases in outputs elsewhere.
Most analyses are not done on a national level, thus this type long-term, indirect
economic effect is not accounted for. Yet the amount of disaster assistance provided by
the federal government will undoubtedly influence the indirect economic effects of a
region. For example, a higher rate of unemployment could cause normal household
demands to erode, thereby decreasing demand for many products and services from areas
of the nation unaffected by the event. Thus while Hazus is useful to provide localized
impact of an earthquake, the national forces that help determine the region’s economic
loss, recovery, and general well-being should not be overlooked.
IV. Conclusion
This section and chapter has presented the Hazus tool and the multiple modules that lie
within the software. As a review, the following modules and their inputs/outputs have
been presented:

104
1. Potential Earth Science Hazards – ground motion and failure;
2. Direct Physical Damage – general building stock, essential and high potential
loss facilities, lifelines, transportation systems, and utilities;
3. Indirect Physical Damage – inundation, fire, hazardous material release, and
debris;
4. Direct Loss – building stock, casualties, and displacement; and
5. Economic Loss – direct and indirect.
The calculations are performed using both data provided by the Hazus inventory and
through sources acquired by the user. As this chapter shows, Hazus users have many
options in performing an analysis. The outstanding number of variables, data inputs,
calculations, and outputs that are embedded within and produced through Hazus attest to
the tool’s power.
Yet, as the following chapter will attest, Hazus is not perfect. Furthermore, the black-
boxing of Hazus and the data assumptions within it attest to multiple problems in the
proclamation of its results. FEMA does not do a standard review of all Hazus
productions. The sheer complexity of the tool and individual decisions during use
prevents a systematic review of existing reports from occurring, thus it is likely that many
outputs could be questionable and/or invalidated with further examination. Thus raising
awareness of the tool’s major shortcomings and the potential abuse of its outputs is the
soundest form of analysis possible for the scope of this thesis.

105
Chapter 4: Hazus Critique and Analysis
As noted thus far, society’s perception of risk and its ability to act to reduce that risk is
dependent upon a variety of variables. Seismic risk in the context of Portland has been
heavily influenced by the history of earthquake knowledge and the region’s late
awareness of its own seismic threat. This thesis has demonstrated how translating the
knowledge on seismic risk from purely geologic speak and into monetary, casualty, or
structural damage estimates is required in order to promote awareness and enact change.
Several lines of evidence and research presented demonstrate the influential power of risk
frameworks on society’s judgment of acceptable risk. Essentially, tools such as Hazus
create cognitive shortcuts; these shortcuts then influence personal judgments and actions;
and a region’s state of damage and recovery is effected if and when the disaster occurs
according to decisions made prior (Bostrom, Turaga, and Ponomariov 2006). Failure to
communicate the hazards and provide necessary shortcuts results in detrimental
consequences two parties: first, for the public at large, as greater casualties and economic
loss occur from lack of preparedness; and second, for the holders of the hazard
knowledge, as demonstrated by the five scientists charged with manslaughter in
L’Aquita, Italy. Thus Hazus plays a vital role in this process by communicating the
complexities of esoteric geologic knowledge and the built environment into simple,
understandable numbers for the greater public.
Explicit power is therefore embedded in the tool’s outputs. The consequences of Hazus
being seriously wrong on a given estimation could cause the relative population to be
unaware of their own risk and grossly underprepared. As noted, predicting the

106
consequences of earthquakes to the built environment and societies is of significant
importance for local and national emergency planners, civil protection services,
governmental agencies, and reinsurers, as well for global organizations as United Nations
and the World Bank; thus the potential for a tool to have varying outputs should be a
large concern of users, researchers, and policymakers alike (Erduran and Lindholm
2012). This chapter will examine the major flaws noted in the Hazus system according to
the literature, user comments, and personal examination.
This analysis is done in the context of Portland, with special attention given to the gaps in
the tool that do not account for Portland-specific vulnerabilities. Many of these criticisms
could likely be applied to other regions with similar seismic problems or environmental
vulnerabilities. The chapter will first examine the problems with inaccurate or outdated
data provided in the Hazus database or user inputs, then consider the tool’s failed ability
to include multiple variables that are vital to the risk estimation process and are of
particular concern to the Portland region. Finally, attention will be given to the inability
of Hazus to account for casualties, and the impact of casualty information on public
perception.
I. Data
The quality of data used in any model influences the accuracy of the model’s output.
Incorrect, outdated, or mismatched values are likely to occur in many, if not all, modeling
and estimation techniques, and are particularly dangerous in input-output modeling

107
methods, as data quality is crucial to results (Okuyama 2007). To address this problem,
the Hazus technical manual states the following:
“Uncertainties are inherent in any loss estimation methodology – arising in part
from incomplete scientific knowledge concerning earthquakes and their effects
upon buildings and facilities. They also result from the approximations and
simplifications that are necessary for comprehensive analyses. Incomplete or
inaccurate inventories of the built environment, demographics, and economic
parameters add to the uncertainty.” (FEMA 2012a)
This statement from FEMA insists that inaccurate or varying estimations are largely the
fault of the software user. The software handbook does not, however, divulge into the
likely errors that could occur from using incorrect data provided in the Hazus inventory.
It is unlikely for all users to bring all of their own data into the program due to the sheer
quantity of data required to produce most outputs. Thus the deference to potentially
inaccurate data is problematic for multiple reasons.
First, the inventory data on building stock, lifelines, and transportation systems is likely
to be considerably outdated. The building inventory provided in Hazus is stocked with
data from 2000, currently making it thirteen years old. In the context of Portland,
hundreds of buildings have been built in the residential, office, and industrial sectors in
the past thirteen years. A large portion of these buildings are located within the Pearl
District, which sits atop highly liquefiable soil, according to Yumei Wang of the Oregon
Department of Geology and Mineral Industries (OPB 2012). For example, according to
RLIS data provided by Portland State University, approximately 200 buildings have been
built or restructured in the Pearl District in between the years of 2000-2011, all of which

108
would not be accounted for in the Hazus inventory. Utility lines and transportation
infrastructure were also built to accommodate the new growth, which Hazus inventory
will also miss.
Seismic updates to existing buildings or infrastructure could also have occurred within
the gap between data collection and Hazus operation. The software classifies the
transportation systems according to their seismic strength, or whether the equipment is
anchored down or not. Thus changes in the study region’s composition will possibly lead
to a considerably inaccurate estimate of loss and damage.
The decision to of Hazus to generalize buildings to the centroid of the census tract is also
a large flaw. The guidebook states, “The entire composition of the general building stock
within a given census tract is lumped at the center of the census tract.” (FEMA 2012a)
Buildings are classified and grouped according to a set of pre-defined building classes,
allowing damage and loss prediction models to be developed for the average
characteristics of the total population of buildings within each class. This can be
problematic for the study area when considering non-categorical buildings, buildings that
have recently lost or gained tenants, seismic upgrades, new buildings, or demolition of
old buildings. Hazus will not be able to capture a fully accurate loss estimate if a census
tract’s building composition is comprised of buildings that are in reality unrelated to the
pre-determined categories, or if the tract has changed through the aforementioned means.
On a smaller, building-by-building analysis, the guidebook suggests users defer to
seismic/structural engineering expertise to estimate specific building damage, as the

109
models are “more reliable as predictors of damage for large, rather than small, population
groups.” The discouraging of Hazus use on specific buildings alludes to two problems:
first, the stark differences between buildings prevents the Hazus algorithm from being
adequately accurate across all types of buildings; and second, the multitude of users that
disregard this section and use the software on a small number of buildings or
considerably small region are likely to be unacceptably wrong. There is no way to
account for these cases, however, as the FEMA department administering Hazus does not
review each user’s projections.
In addition to flawed data for buildings, transportation systems, and utilities, Hazus users
could neglect to provide updated census data. The inventory was built with data from the
2000 Census, thereby excluding any migration into or out of the region of study. This is
troublesome, as additional persons contribute to higher density, additional economic loss,
displacement, and casualties. According to data provided by the U.S. Census Bureau, the
City of Portland has gained approximately 70,000 people from 2000 to 2011. Other cities,
especially in regions of high seismic activity along the West Coast, have also witnessed
substantial population changes. Therefore, a user equipped exclusively with 2000
inventory data will be considerably inaccurate when projecting losses. Population growth
and change has undoubtedly occurred in other regions of Hazus analysis, and users
should take caution when mining the software’s inventory.
Hazus also uses population data to acquire demographic composition of an area to
provide a more accurate assessment of loss and housing requirements. The inventory data
is provided as a generalization to the census block level, yet it is likely that the census

110
blocks have changed in composition, thereby affecting the relocation, economic loss, and
homeless estimates generated in the model. This is especially important to consider in
light of the software’s decision to stratify census block residents according to race. As
noted in Chapter 3, Hazus assumes all Hispanic populations will reside within temporary
housing for longer periods of time. This assumption is made based off of the rationale
that Hispanics have lasting memories instilled from past disastrous Latin American
earthquakes. Hazus assumes these tendencies for all ethnic groups, yet provides no
justification or literature to support this assumption. Areas with higher proportions of
minorities will appear to be more costly due to their preference to stay in temporary
housing for longer periods of time. A negative perception of the communities will be
reinforced as a result of the higher cost assumptions. Furthermore, the tool makes the
decision to stratify users by age or ownership status optional, even though both options
appear to have more of an effect on temporary housing decisions than race. Thus regional
composition changes and illegitimate projections of housing tendencies and economic
loss should be considered when performing an analysis.
This section has demonstrated the inaccuracies likely to occur with outdated and inexact
data. The modeling and algorithms could be perfect within the software, yet inaccurate
data will completely invalidate the study, and fail to be a legitimate reflection of the
region. Users of Hazus are hopefully aware of the affect inaccurate data can have on their
loss estimations, and take this into consideration before presenting their findings.
II. Additional Hazards

111
The previous section highlighted the serious problems with using inaccurate data to
estimate loss. The failure to use accurate data is a major problem for most modeling
schemes. The proceeding section will examine a Hazus-specific problem: failure to
account for hazards that are a byproduct of earthquakes. Fires, flooding, volcanos, and
hazardous material (hazmat) are a few of the consequential events that are not fully
considered in the model, yet often cause more damage to an area. This section will
examine this failure and the affect it can have on the overall output, users’ perception of
risk, and neglect in policy solutions as a result of unaccounted for risk.
The most concerning secondary hazard is the incomplete methodology to calculate losses
from fires. Hazus will provide users with estimates describing the number of ignitions,
total burned area, population exposed to the fires, and building value consumed by the
fire, yet the guidebook notes the fire coverage to be incomplete. The software will not
provide estimates of household displacement, direct economic loss, and indirect
economic loss. In turn, these values will not be included in the study area’s overall
damage, casualty, and economic loss estimates. The Hazus guidebook suggests users
examine these separately through the assistance of experts, thus making this estimate an
additional monetary and time cost for the user and inhibiting their ability to generate a
complete picture of expected loss.
Failing to include fires in the estimates is misleading and erroneous, as fires resulting
from earthquakes can often outweigh the total losses from direct damage caused by an
earthquake. Academic research has shown fires following earthquakes in Japan and North
America to be a major factor for post-earthquake damage in the twentieth century. For

112
example, over 203 acres (approximately 70 U.S. city blocks) of urban land and 5,500
buildings were consumed by fires in the 1995 Kobe Earthquake. The Kobe fires resulted
from the incomplete performance of the water system, the traffic congestion, and the
building density of the city. Despite this loss, little attention has been given to reducing
post-earthquake fires through individual building design or urban design (Mousavi,
Bagchi, and Kodur 2008). Thus a gap exists on the damage estimation end to account for
losses from fire and relay the information to relevant persons with the ability to mitigate
and reduce the fire risk.
According to literature on post-earthquake fires, factors that influence a fire hazard
following an earthquake include construction material type, building usage and amenities,
loss of water supply for extinguishing fires, response time of occupants and emergency
crews that might be affected by obstructed access and insufficient resources, and
architectural configuration including improper building separation (Mousavi, Bagchi, and
Kodur 2008). In attempt to account for the fire-related variables, the Hazus database will
provide the number of fire stations, number of engines at each fire station, and
geographical location of the station. The user is also provided with optional inputs
including wind speed, wind direction, and speed of fire trucks after earthquakes. These
optional variables are certainly difficult to assess independently, and expert opinion may
not suffice. For example, generalizing the speed of fire trucks is one critical input that
could impact human life, building damage, and overall well-being of an area. Thus there
is not a sufficient match between variables that affect fire damage according to the
literature and variables Hazus accounts for.

113
The ability for firefighters to sufficiently respond in Portland post-quake is largely a
question of the fire station’s building seismic capacity and the status of the transportation
network’s infrastructure (buildings, roads, etc.). Specifically, Portland’s neighboring
suburb of Vancouver, Washington, has five of their ten fire stations housed in
unreinforced masonry buildings, thus rendering their trucks useless in the case of a large
earthquake (Albrecht 2011). The stations within Portland are mostly structurally sound,
yet could suffer damage depending on the quake’s strength (OPB 2012). The inability of
Vancouver’s trucks to respond to damaged buildings will undoubtedly cause strain on the
entire region’s mitigation effort. Hazus will not be able to account for the entirety of
strain, especially given that an analysis on Portland would exclude neighboring
Vancouver in the state of Washington. The effect of damaged roads or bridges on fire
truck transportation is also excluded; both factors that would have a significant effect on
response time. Users hopefully take this into consideration when using the tool, and
account for these vulnerabilities accordingly.
An estimate of casualties from post-earthquake fires is also excluded from the casualty
module. The Hazus guidebook asserts these types of casualties to have a low probability
historically, yet recent earthquakes provide opposing evidence. For example,
approximately 700 Kobe residents were lost in fires following the devastating 1995
earthquake (Horwich 2012). In March 2011, Japan lost approximately 165 residents to
fire in the great Tohoku earthquake. Lastly, approximately 115 residents of Christchuch,
New Zealand perished in fires as a result of the February 2012 earthquake (Bayer 2012).
These accounts provide evidence that fires from earthquakes must be taken seriously

114
when estimating potential damages. The failure to do so may result in surprise and under-
preparation by fire departments and emergency bureaus when earthquakes hit, as was
demonstrated in Christchurch. Additional detail on the miscalculation of casualties is
provided in Section IV.
As noted by Mousavi et al., (2008), the availability of water has a profound effect on the
amount of fire damage within a region. Portland’s post-quake water availability is
particularly vulnerable due to the region’s outdated water infrastructure. According to the
Portland Bureau of Emergency Management (PBEM), the Portland water system is
susceptible to earthquake shaking which will damage water pipelines, reduce water
flow/pressure, inhibit firefighting abilities, and threaten public health. Some of the water
infrastructure is more than one hundred years old and at a high risk of damage from a
seismic event. The PBEM Earthquake Response Appendix also notes that the Portland
Water Bureau supplies water to more than 800,000 retail and wholesale facilities, thereby
implying major economic losses to occur from loss of water (PBEM 2012). Hazus does
not consider the increase in fire damage resulting from the lack of water for suppression
or the long term effects of water-loss on a region. Again, this prevents Hazus from
accounting for a holistic picture of indirect economic damage. With this in mind, Hazus
is considerably lacking in estimating the long-term effects resulting from post-earthquake
fires.
Economic loss caused by inundation and release of hazardous materials (hazmat) is also
not considered. The handbook requests the user to undertake specific studies to estimate
these losses despite the substantial damage they could cause. For example, a 6.8

115
magnitude earthquake in the Nisqually Valley, Washington, caused a number of hazmat
releases, including a leak and explosion of a natural gas line, release of asbestos, metal
plating solution, and petroleum. Liquefaction of the fill material underlying the storage
facility contributed to the release of these materials, affecting the storage facility as well
as several others nearby that were severely damaged and subsequently abandoned
(Santella and L. J. Steinberg 2011). Similar incidences occurred in the Loma Prieta and
Northridge earthquakes in California that damaged the region and caused due concern
among residents.
The evacuation and demolition of buildings affected by a serious hazmat release certainly
contributes to the region’s economic loss and recovery. The inability to account for this is
highly problematic in the context of Portland due to the city’s large number of industrial
facilities situated directly atop liquefiable soil. PBEM comments on this vulnerability in
the city’s Earthquake Response Appendix by noting:
“Portland’s critical energy infrastructure, including high voltage electricity
transmission, fuel pipelines, tank farms, ports and facilities, is concentrated along
the Willamette River in the Northwest Industrial and Swan Island areas. Much of
the existing infrastructure was constructed prior to current seismic safety
specifications and many of the petroleum storage tanks, piers, marine docks and
buildings are inadequately hardened. This area consists primarily of artificial fill
and is vulnerable to liquefaction and lateral spreading. The concentration of
facilities and hazardous materials in this area has the potential to produce
damaging cascading effects including fires from ruptured natural gas and fuel
lines, hazardous material releases and debris blockage of the Willamette River.”

116
The PBEM’s concern highlights the immense danger and potential economic loss for the
Portland region that Hazus fails to account for. The damage that could occur to the
industrial region is unimaginable and difficult to estimate, yet necessary in order to
communicate risk, enact serious solutions to reducing vulnerability, and optimally
prevent long-term economic loss. PBEM Director Carmen Merlo also expressed concern
over the industrial region’s vulnerable gas, hazmat, and water supply lines and storage
facilities in an interview conducted as research for this thesis, and noted that her
department realizes the extreme vulnerability and are looking at strategies for risk
reduction. Portland is not currently undergoing any review of these problems to discover
solutions, and public knowledge of this vulnerability is very low, thereby preventing apt
outcry from Portland residents to enact change.
The noted secondary effects of earthquakes unaccounted or under-accounted for in the
loss estimation modules should be of serious concern to users communicating the results
of Hazus to the public. The inability to translate these hazards into loss estimations
prevents residents from fully comprehending the risk at hand. The simple verbal
warnings and prophecies from emergency management officials do not suffice in
communicating the risk that fires, water unavailability, and hazmat release could cause.
This section has uncovered these failings of Hazus and vulnerabilities within Portland.
Hopefully additional action will be taken to reduce the risk and raise awareness.
III. Measuring Casualties

117
Modeling potential casualties and injuries from hazards is difficult due to the lack of a
systemic and consistent source of hazard mortality data. A lack of academic research
from engineering, hazard mitigation, and urban planning fronts also contributes to light
information on causes of casualties, thereby preventing strategies for casualty reduction
from properly developing (Peek-Asa et al. 1998). The Hazus guidebook acknowledges
the scholarly gap by noting, “Available data often have insufficient information about the
type of structure in which casualties occurred and the casualty generating mechanism.
Thus an attempt to develop very sophisticated models based on such data is neither
feasible nor reliable.” (FEMA 2012a).
Chapter 3 outlined the methodology employed by Hazus to estimate casualties. The
available literature on casualty estimation varies from the Hazus model assumptions,
however. Bostrom, Turaga, and Ponomariov (2006) note that potential injuries and deaths
from earthquake related building collapses are likely to be valued differently depending
on factors such as the following:
1. Whether the building is presented as one of many, and what other attributes are
evaluated at the same time;
2. The relative emphasis given various causal factors in the description of the
collapse, for example whether the building was up to code at the time of input into
the database and analysis;
3. Who might be injured and die, as value of statistical life is contingent on age; and
4. Recent experience, which helps to anchor the frame of reference for evaluating
consequences (Bostrom, Turaga, and Ponomariov 2006).

118
The four factors provide a basis for reflection and critique on the Hazus casualty
estimation methodology. Bostrom’s second factor regarding a building’s seismic code
status is particularly relevant to the Hazus critique, as data provided in the Hazus
inventory and user-provided data are often outdated and missing a considerable amount
of building specificities. This is especially true in estimations of large regions, such as the
State of Oregon or the entire Cascadian region.
Bostrom’s third factor, age, is also in disagreement with the Hazus methodology. A meta-
analysis performed by Shoaf, et al., found that age is an influential variable that should be
considered when performing injury and casualty estimations. They noted that a range of
cultural factors, such as who sleeps where, are a major explanation of differential
mortality observed across vulnerable sub-populations. For example, in the Kobe, Japan
earthquake, over half of all fatalities were for people over sixty years old. Many of these
fatalities were a result the elderly’s residence preference for the ground floor of a
building; an area that tends to result in higher mortality than higher floors (Shoaf et al.
1998). Thus the failure to include age in the casualty module and rely exclusively on a
building’s composition may result in an inaccurate count. Furthermore, estimates
stratified by age may be beneficial to communicate and target specific groups for
mitigation efforts. Hazus only considers age in regard to those under the age of 16 and
whether or not the resident will be attending school.
The casualty module also excludes other causes of death that could substantially affect
the overall toll. Many secondary causes of injury or loss include heart attacks, car
accidents, and power failure which cause failure of a respirator or other necessary

119
medical devise. Incidents during the post-earthquake search and rescue or post-
earthquake clean-up and construction activities, such as electrocution or explosion, could
also occur. Lastly, secondary casualties could result from tsunami, landslides,
liquefaction, fault rupture, dam failures, fires or hazardous material releases. To account
for these possibilities, if the user is concerned, the guidebook suggests the user simply
“initiate specific studies directed towards the problem,” and does not provide advisable
alternatives.
A final critique on estimation of casualties concerns the ability to access hospitals. First,
Hazus is unable to account for the essential facility locations in relation to the facility’s
accessibility by the greater public. For example, if a hospital is unreachable due to
blocked roads from debris, liquefaction, or broken bridges, it is likely that many of the
injured will be unable to seek necessary care. This is a problem in Portland due to the
location of its hospitals and seismic vulnerabilities of the structures. The PBEM is aware
of these risks and notes, “All of the area hospitals are vulnerable to seismic damage
which would result in a diminished ability to meet the healthcare needs of the region.”
(PBEM 2012). Furthermore, a few of Portland’s major hospitals lie on the west side of
the Willamette River, rendering them inaccessible to the majority of the population living
on the east side. This vulnerability cannot be accounted for in Hazus despite the large risk
it poses to the city.
The casualty projections made by Hazus are therefore questionable in their reliability,
which is a significant problem due to the tendency for the public to fixate on casualty
estimates as a measure for risk. Carmen Merlo, Director of the Portland Bureau of

120
Emergency Management, also noted in an interview for this thesis that the casualty
estimates provided in Hazus would not be something her department would publicize or
trust due to the potential inaccuracies. In contrast, the Oregon Resiliency Plan blatantly
states the Hazus projected casualties resulting from a major Cascadian quake. The plan
estimates deaths ranging from 650 to 5,000, with another 600 to 5,000 deaths resulting
from a tsunami (OSSPAC 2013). This announcement sent shockwaves into Oregon and
across the nation due to the high estimates and scare tactics. A host of articles produced
locally and nationally proclaimed the estimation of fiscal and personal loss, thereby
instilling fear and concern into readers and the communities at risk. This scare tactic is
considered useful by some for communicating seismic awareness and encouraging
residents to personally improve their seismic safety activities. There is warrant for
concern, however, if these estimates are grossly off base.
As outlined, the use of the Hazus casualty estimates is skewed for four overarching
reasons. First, the lack of empirical studies and data examining causes of earthquake
casualties precedes and prevents a fully accurate model from being produced. Second, the
inability to account for the entire population in the inventory data forces and inaccurate
reflection of current occupancy rates in the building stock. Third, Hazus does not stratify
building occupants according to age, which would provide greater accuracy and
communicate risk with an ability to strategically target mitigation efforts. Lastly, the
failure of Hazus to account for casualties caused by car accidents, heart attacks, and
power failure reduces the accuracy of the projected death toll. This combination of
factors, in conjunction with the potential for the estimates to be grossly mishandled and

121
misinterpreted by the public at large, provide evidence to potentially invalidate the entire
module.
Modules and tools used to estimate casualties will never provide a perfect fatality count
or reflection of the study region. Regardless, the emotional tie to human life embeds these
estimations with attention-grabbing power. For example, the Oregon Resilience Plan’s
casualty and monetary loss estimations inspired dozens of articles with titles such as
“Hurricane Sandy Will Be Dwarfed by an Earthquake,” “Scientists warn Oregon
legislators of cataclysm when earthquake, tsunami strike,” and “Scientists predict
thousands will die from earthquake expected anytime on US West Coast.” As noted,
these attention-grabbing titles serve to often serve to scare the public into preparedness
and increase readership, as opposed to actually equipping the readers with knowledge on
increasing their seismic safety. It is also likely that the sensationalist articles and casualty
estimates could have a reverse effect by causing residents to adopt apathetic attitudes
given the stark projection of the situation. Thus these estimations must be taken with a
grain of salt, and providers of the information must take caution when relaying it to the
public.
IV. Conclusion
This chapter considered the largest flaws in the Hazus software and the impact these
inaccuracies could have in the context of Portland, Oregon. As noted, loss estimations aid
to establish public desire for minimum seismic safety standards, and provide necessary
evidence to promote seismic safety, typically framed as establishing “acceptable risks”

122
from the perspective of society. Hazus outputs will present the current standard of
acceptable risks and project the information to the public for their interpretation, thereby
providing ammunition to the public’s pleas to increase mitigation activities. By not
accounting for many of the most hazardous aspects of Portland’s environment, Hazus is
failing to provide the public with firmer estimates for loss, thereby weakening the case
for additional mitigation efforts. Furthermore, Hazus is weakened by failing to reflect the
current environment of the study region by using outdated data and misinformed building
categories.
Additional problems are likely to exist in Hazus that remain outside of the scope of this
thesis or require specific technological knowledge to assess. Furthermore, the migration
of Hazus onto an online platform will likely be accompanied by additional or exacerbated
flaws in data management, hazard exclusion, and casualty estimation. Regardless, the
critiques presented here will stand as substantial to furthering the loss estimation process.
This examination is important due to the black-boxing of tools such as Hazus, and the
public’s tendency to take the outputs of these tools at literal value. Thus additional
knowledge on the tool’s failings is intended to provide clarity for those interpreting the
values, and realize the power Hazus holds in shaping public opinion in light of these
flaws.
It must be noted that regardless of the discovered flaws, models can never be perfect. The
randomness of human activity, natural forces, and response capacity is in constant flux.
Each disaster is unique, and exactly the same hazard will never occur again, thus the
outputs are not a forecast, but rather, a suggestion of what might happen (Okuyama

123
2007). Models therefore are limited by uncertainty, and are sequestered to focusing on
behaviors and responses according to previous events, using probability as a guide for
future occurrences.
Specifically, it has been noted that the simplicity of input-output models such as Hazus to
model economic loss creates a set of limitations, including linearity, rigid structure with
respect to input and import substitutions, a lack of explicit resource constraints, and a
lack of response to price changes (Rose 2004). While this is not optimal given the
seriousness of the outputs and blind, unquestioning technological trust in models, these
mechanisms must exist and continue to be used to enhance knowledge and prevent
catastrophe.

124
Conclusion
The primary goal of hazard estimation tools is to equip stakeholders, policymakers, and
the public at large with knowledge on threats to the built environment. Failing to
communicate nature-induced risks would be to partake in vindictive and shrewd behavior
by the fault of governments, organizations, and all holders of this knowledge. In addition
to raising awareness, communicating risk and providing heuristics for public
understanding is of vital necessity to build support for policy, infrastructure
improvement, and personal risk-reduction strategies. Thus it is hoped that universal
understanding of the natural threats facing communities, cities, and nations can allow for
greater cooperation and participatory action in order to assure a resilient and safe future
for every person.
As this thesis has shown, problems arise when the risks and threats are not accurately
estimated nor communicated properly. The late awareness of seismic risk in the Portland
region has prevented the region from having seismically fit buildings and infrastructure,
thereby putting the region at a serious disadvantage when compared to other at-risk cities
such as Seattle and San Francisco, both of which have had longer periods of seismic risk
awareness. This problem has been reflected in the sheer number of buildings, bridges,
and other elements in Oregon that are going to face serious destruction in an earthquake
due to their lacking seismic capacity.
In general, sheer complexity of an event may produce epistemic uncertainty, even if more
knowledge about that event is found, as in the context of Portland and its recently
discovered hazards. Earthquake risk embodies uncertainty, as the randomness of these

125
events completely negates the ability to accurately predict them. The uncertainty of the
exact date of a Juan de Fuca rupture prevents realistic solutions and upgrades from
occurring, as it is easier for stakeholders to procrastinate than develop concrete solutions
to these problems. Rather, to counter the uncertainty and promote change, tools
estimating loss for these events are produced. These estimations tell the public “We don’t
know when the damage will occur, but we know how much the price tag will be.”
Thus while scientific geologic knowledge fails to provide specific time estimations,
engineering, structural, and social knowledge on the built environment and it’s response
to known geologic hazards fills the void in communicating risk to the public. Hazus
translates the combined hazard estimation knowledge into real numbers – numbers of
people dying, of businesses closing, and of economic peril. Providing these stark visuals
to a non-expert public is the only way to overcome uncertainty and enact change.
The state of Oregon and city of Portland has remained blissfully ignorant in enacting
earthquake policy despite the awareness of respective seismic risks. The state in
particular has finally committed to reducing risk only after a Hazus assessment was
performed this year in the Oregon Resilience Plan. The policy repercussions of this plan
have not reached fruition due its newness. However, the commitment by the Oregonian
legislature and outcry by the public following realization of Oregon’s risk provides hope
for the enactment of substantial risk-reduction strategies.
The research and assessment provided in this thesis has shown how Hazus and the
information it produces to be considerably powerful yet potentially inaccurate. This was

126
shown in Chapter 4 through three substantial critiques: outdated or imprecise data,
unaccounted hazards, and casualty errors. These combined flaws justify the Office of
Budget and Management’s ineffective rating, and suggests that users take caution when
using the tool and relaying the outputs to the greater public.
The likelihood of Hazus outputs to be inaccurate and misused is high. Users must counter
this by realizing the clout embedded in the outputs and the consequences that arise from
the rallied knowledge. The public will make decisions according to perceptions shaped
by Hazus. These decisions can ultimately influence their survival and recovery from an
earthquake. Thus the lasting and irreversible effects of Hazus outputs should be treated
with sensitivity by its users, policymakers, and others with full awareness of the risks at
hand.
Preparedness for disasters requires knowledge. As noted, a population will never be fully
prepared to face all potential disasters. Cities will continue to come up with innovative
and meaningful strategies to cope with unprecedented disaster risk and climate change,
and hopefully provide knowledge to resources to the vulnerable population. A new era of
disaster preparation has dawned in this way; the built environment must continuously
adapt to unsuspecting or unanticipated situations. Hazus helps to model those situations
and generate the necessary effects in spite of uncertainty.
Yet there is a need for sensitivity and analysis in projecting loss and risk knowledge. This
thesis has demonstrated how the frameworks used to define risk now will have an effect
on mitigation efforts and recovery later. This was demonstrated in the evolution of

127
Portland’s seismic awareness, how this evolution has affected the region’s capacity to
deal with earthquakes and created extreme vulnerability. The uncertainty initially
experienced in the 1980’s prevented mitigation action and seismic restructuring from
taking place, and hindered full understanding and awareness from occurring on a public
level. Furthermore, the results provided by Hazus in the past year through the Oregon
Resilience Plan have finally given legislators the necessary push to begin enacting
substantial changes and policy solutions to raise awareness and build resiliency in
Oregon.
The tendency for users and the public to grant Hazus black-box status is worrisome, as
this tool will be used to craft decisions that affect a community’s capacity to cope with
and recover from disasters. This thesis has also demonstrated the substantial problems
within the black box of Hazus arising from unreliable and outdated data, missing hazards,
and erroneous casualty calculations; all of which seriously affect the reliability of the
tool, and null accuracy and usefulness as a predictor of loss.
Horrendous disasters will continue to occur nationally and globally to demonstrate
nature’s unyielding capabilities and inglorious destruction. Accordingly, Hazus will
continue to grow in use and adopt additional hazard modeling methods to reflect the
growing threats to the built environment. I can only hope for Hazus users to realize the
immense power imbedded in their outputs, and retain sensitivity in relaying the
information to the general, uninformed public. The livelihood of the built environment
and its residents depend on it.

128
Works Cited
Adger, W.N. 2000. “Social and ecological resilience: are they related?” Progress in
Human Geography 24(3): 347–364.
http://phg.sagepub.com/cgi/doi/10.1191/030913200701540465 (February 12, 2013).
Albrecht, Bob. 2011. “Five-alarm fears.” The Columbian.
http://www.columbian.com/news/2011/apr/11/five-alarm-fears/.
Bayer, Kurt. 2012. “Fire chiefs failed to cope with Christchurch earthquake - report.”
New Zealand Herald.
http://www.nzherald.co.nz/nz/news/article.cfm?c_id=1&objectid=10841368.
Berman, Eric. 2011. 33–34 FEMA’s HAZUS Program. Seattle, WA.
http://www.multibriefs.com/briefs/nsps/acsm254pp3334.pdf.
Bostrom, Ann, Rama Mohana R. Turaga, and Branco Ponomariov. 2006. “Earthquake
Mitigation Decisions and Consequences.” Earthquake Spectra 22(2): 313–327.
http://earthquakespectra.org/doi/abs/10.1193/1.2190668 (December 1, 2012).
CGS. 2007. Seismic Hazards Mapping Act. San Francisco: California Geological Survey.
http://www.conservation.ca.gov/cgs/shzp/Pages/SHMPAct.aspx.
Clark, Stuart. 2012. “From Galileo to the L’Aquila earthquake: Italian science on trial.”
The Guardian. http://www.guardian.co.uk/science/across-the-
universe/2012/oct/24/galileo-laquila-earthquake-italian-science-trial.
Cochrane, Hal. 2004. “Economic loss: myth and measurement.” Disaster Prevention and
Management 13(4): 290–296.
http://www.emeraldinsight.com/10.1108/09653560410556500 (October 28, 2012).
Collier, Stephen J, and Andrew Lakoff. 2008. “Distributed preparedness: the spatial logic
of domestic security in the United States.” Environment and Planning D: Society
and Space 26(1): 7–28. http://www.envplan.com/abstract.cgi?id=d446t (October 29,
2012).
Cowen, Robert C. 1981. “An earthquake warning has been discounted: now Peru can
relax.” Christain Science Monitor.
http://www.csmonitor.com/1981/0304/030426.html.
CREW. 2011. “About CREW.” Cascadia Region Earthquake Workgroup.
http://www.crew.org/about-crew (April 10, 2013).

129
Davoudi, Simin, Elizabeth Brooks, and Abid Mehmood. 2013. “Evolutionary Resilience
and Strategies for Climate Adaptation.” Planning Practice and Research (May): 1–
16. http://www.tandfonline.com/doi/abs/10.1080/02697459.2013.787695 (May 2,
2013).
DOGAMI. 2010. “Oregon’s Earthquake Risk and Resiliency.” Cascadia.
http://www.oregongeology.com/sub/quarpub/CascadiaWinter2010.pdf.
———. 2013. “General Department Information.” History and General Operations.
http://www.oregongeology.org/sub/portoff/portoffice.htm (April 2, 2013).
Editorial. 2012. “Italian earthquake case is no anti-science witch hunt.” NewScientist.
http://www.newscientist.com/article/dn22416-italian-earthquake-case-is-no-
antiscience-witchhunt.html.
Erduran, Emrah, and Conrad Lindholm. 2012. “A Critical Look at the Use of Design
Spectrum Shape for Seismic Risk Assessment.” Earthquake Spectra 28(4): 1711–
1721. http://earthquakespectra.org/doi/abs/10.1193/1.4000086 (April 8, 2013).
FEMA. 2012a. Hazus –MH 2.1. http://www.fema.gov/library/viewRecord.do?id=5120.
———. 2012b. “HAZUS: The Federal Emergency Management Agency’s (FEMA's)
Methodology for Estimating Potential Losses from Disasters.”
http://www.fema.gov/hazus.
———. 2013a. “National Earthquake Hazards Reduction Program.”
http://www.fema.gov/national-earthquake-hazards-reduction-program (February 23,
2013).
———. 2013b. “National Earthquake Hazards Reduction Program.”
Flynn, James, Paul Slovic, C. K. Mertz, and Cathie Carlisle. 1999. “Public Support For
Earthquake Risk Mitigation In Portland, Oregon.” Risk Analysis 19(2): 205–216.
http://doi.wiley.com/10.1111/j.1539-6924.1999.tb00400.x.
Fortun, Kim, and Scott Frinkel. 2012. “Making a case for disaster science and technology
studies.” An STS Forum on Fukushima.
http://fukushimaforum.wordpress.com/online-forum-2/online-forum/making-a-case-
for-disaster-science-and-technology-studies/ (November 13, 2012).
Hamilton, Robert M. 2003. “Milestones in Earthquake Research.” Geotimes.
http://www.agiweb.org/geotimes/mar03/comment.html.

130
Hill, Richard L., and Noelle Crombie. 2001. “A discovery at a middle school is the first
direct proof that the Portland Hills Fault could generate an earthquake.” The
Oregonian. http://www.oregongeology.org/sub/earthquakes/PortHillsFault.htm.
Horwich, George. 2012. “Economic Lessons of the Kobe Earthquake *.” 48(3): 521–542.
Hunsberger, Brent. 2010. “Earthquake insurance? A good bet.” The Oregonian.
http://blog.oregonlive.com/finance/2010/03/earthquake_insurance_a_good_be.html.
Jacoby, GC, DE Bunker, and BE Benson. 1997. “Tree-ring evidence for an AD 1700
Cascadia earthquake in Washington and northern Oregon.” Geology.
http://geology.gsapubs.org/content/25/11/999.short (March 27, 2013).
Jasanoff, S. 1999. “The Songlines of Risk.” Environmental Values 8(2): 135–152.
http://openurl.ingenta.com/content/xref?genre=article&issn=0963-
2719&volume=8&issue=2&spage=135.
Johnson, EJ, and J Hershey. 1993. “Framing, probability distortions, and insurance
decisions.” Journal of risk and ….
http://www.springerlink.com/index/x535827t2m525776.pdf (March 21, 2013).
Kircher, Charles a., Robert V. Whitman, and William T. Holmes. 2006. “HAZUS
Earthquake Loss Estimation Methods.” Natural Hazards Review 7(2): 45–59.
http://ascelibrary.org/doi/abs/10.1061/%28ASCE%291527-
6988%282006%297%3A2%2845%29.
Kunreuther, Howard. 1996. “Mitigating disaster losses through insurance.” Journal of
Risk and Uncertainty 12(2-3): 171–187.
http://link.springer.com/10.1007/BF00055792.
Liberty, Lee M., Mark a. Hemphill-Haley, and Ian P. Madin. 2003a. “The Portland Hills
Fault: uncovering a hidden fault in Portland, Oregon using high-resolution
geophysical methods.” Tectonophysics 368(1-4): 89–103.
http://linkinghub.elsevier.com/retrieve/pii/S0040195103001525 (April 5, 2013).
———. 2003b. “The Portland Hills Fault: uncovering a hidden fault in Portland, Oregon
using high-resolution geophysical methods.” Tectonophysics 368(1-4): 89–103.
Machlis, Gary E. 1990. “Timber, minerals and social change: an exploratory test of two
resource dependent communities.” Rural Sociology 55(3): 411.
Matsen, A.S., K. Best, and N. Garmezy. 1990. “Resilience and Development:
Contributions from the Study of Children who Overcame Adversity.” Development
and Psychopathology 2: 425–444.

131
May, Peter J. 2001. “Societal Perspectives about Earthquake Performance: The Fallacy of
‘Acceptable Risk’.” Earthquake Spectra 17(4): 725–737.
http://earthquakespectra.org/doi/abs/10.1193/1.1423904 (April 8, 2013).
Mileti, Dennis S., and Colleen Fitzpatrick. 1993. The Great Earthquake Experiment: Risk
Communication and Public Action. Boulder, CO: Westview Press, Inc.
Moffatt, Stuart, and Debra Laefer. 2009. “An Open-Source Vision for HAZUS.” Journal
of Computing in Civil Engineering (February): 1–2.
http://ascelibrary.org/doi/pdf/10.1061/(ASCE)CP.1943-5487.0000022 (December 2,
2012).
Monroe, Linda Roach. 1987a. “Great NW Quake: future or fantasy?” The Oregonian:
G1–G3.
———. 1987b. “Scientists fear big jolt can happen in Oregon.” The Oregonian: E1–E3.
Montoya, Kacey. 2011. “Portland bridges are likely not ready for 9.0 quake.” KOIN
Local News. http://www.koinlocal6.com/news/local/story/Portland-bridges-likely-
not-ready-for-9-0-quake/qcjPWX5JXUG4_tQKxlbDdA.cspx.
Mousavi, Shahab, Ashutosh Bagchi, and Venkatesh K.R. Kodur. 2008. “Review of post-
earthquake fire hazard to building structures.” Canadian Journal of Civil
Engineering 35(7): 689–698.
http://www.nrcresearchpress.com/doi/abs/10.1139/L08-029 (April 8, 2013).
NEHRP. 2009. “Background & History.” About Us.
http://www.nehrp.gov/about/history.htm (March 1, 2013).
Ng, Peter. 2010. HAZUS-MH Data Extractor (Beta Version 1.0) User’s Guide.
Nigg, Joanne M. 2000. “Predicting Earthquakes: Science, Pseudoscience, and Public
Policy Paradox.” In Prediction: Science, Decision Making, and the Future of
Nature, eds. Daniel Sarewitz, Roger A. Pielke, and Radford Byerly. Island Press, p.
135–157.
O’Hare, Paul, and Iain White. 2013. “Deconstructing Resilience: Lessons from Planning
Practice.” Planning Practice and Research (April 2013): 1–5.
http://www.tandfonline.com/doi/abs/10.1080/02697459.2013.787721 (May 1,
2013).
Okuyama, Yasuhide. 2007. “Economic Modeling for Disaster Impact Analysis: Past,
Present, and Future.” Economic Systems Research 19(2): 115–124.
http://www.tandfonline.com/doi/abs/10.1080/09535310701328435 (June 18, 2013).

132
OOEM. 2013. “OSSPAC.” Oregon Office of Emergency Management.
http://www.oregon.gov/omd/oem/pages/osspac/osspac.aspx (April 15, 2013).
OPB, Oregon Public Broadcasting. 2012. “How Would Portland Fare in An Earthquake?”
http://www.opb.org/news/article/how-would-portland-fare-earthquake/.
Oreskes, Naomi. 2000. “Why Predict? Historical Perspectives on Prediction in Earth
Science.” In Prediction: Science, Decision Making, and the Future of Nature, eds.
Daniel Sarewitz, Roger Pielke, and Radford Byerly. Island Press, p. 23–40.
OSSPAC. 2013. “The Oregon Resilience Plan.” (February).
Palm, Risa. 1995. Earthquake Insurance: A Longitudinal Study of California
Homeowners. Boulder, CO: Westview Press, Inc.
PBEM. 2012. City of Portland Earthquake Response Appendix. Portland, OR.
http://www.portlandoregon.gov/pbem/article/382005.
Peek-Asa, C, J F Kraus, L B Bourque, D Vimalachandra, J Yu, and J Abrams. 1998.
“Fatal and hospitalized injuries resulting from the 1994 Northridge earthquake.”
International journal of epidemiology 27(3): 459–65.
http://www.ncbi.nlm.nih.gov/pubmed/9698136.
Picard, Pierre. 2008. “Natural Disaster Insurance and the Equity-Efficiency Trade-Off.”
Journal of Risk and Insurance 75(1): 17–38.
http://onlinelibrary.wiley.com/doi/10.1111/j.1539-6975.2007.00246.x/full (March
20, 2013).
Porter, Keith a., James L. Beck, and Rustem Shaikhutdinov. 2004. “Simplified
Estimation of Economic Seismic Risk for Buildings.” Earthquake Spectra 20(4):
1239–1263. http://earthquakespectra.org/doi/abs/10.1193/1.1809129 (October 28,
2012).
Ren, a. Z. 2004. “The Simulation of Post-Earthquake Fire-Prone Area Based on GIS.”
Journal of Fire Sciences 22(5): 421–439.
http://jfs.sagepub.com/cgi/doi/10.1177/0734904104042440 (April 13, 2013).
Rojas-Burke, Joe. 2011. “Comparing Portland’s quake risk to that of devistated
Christchurch, New Zealand.” The Oregonian.
http://www.oregonlive.com/environment/index.ssf/2011/02/comparing_portlands_q
uake_risk.html.
Rose, Adam. 2004. “Defining and measuring economic resilience to disasters.” Disaster
Prevention and Management.

133
http://www.emeraldinsight.com/journals.htm?articleid=871056&show=abstract
(January 30, 2013).
Rueter, Patty. 2010. “Portland Natural Hazard Mitigation Plan 2010.”
Santella, Nicholas, and Laura J. Steinberg. 2011. “Accidental Releases of Hazardous
Materials and Relevance to Terrorist Threats at Industrial Facilities.” Journal of
Homeland Security and Emergency Management 8(1).
http://www.degruyter.com/view/j/jhsem.2011.8.issue-1/1547-7355.1809/1547-
7355.1809.xml (May 9, 2013).
Sarewitz, Daniel. 2012. “The L’Aquila Earthquake and the Importance of Scientists
Saying ‘I Don’t Know’.” Slate: Future Tense.
Sarewitz, Daniel, and Roger Pielke. 2000. “Prediction as a Science and Policy.” In
Prediction: Science, Decision Making, and the Future of Nature, eds. Daniel
Sarewitz, Roger Pielke, and Radford Byerly. Island Press, p. 11–22.
Satake, Kenji, K Shimazaki, Y Tsuji, and K Ueda. 1996. “Time and size of a giant
earthquake in Cascadia inferred from Japanese tsunami records of January 1700.”
Nature 379: 246–249.
http://www.nature.com/nature/journal/v379/n6562/abs/379246a0.html (March 27,
2013).
Schneider, Philip J., and Barbara a. Schauer. 2006. “HAZUS—Its Development and Its
Future.” Natural Hazards Review 7(2): 40–44.
http://ascelibrary.org/doi/abs/10.1061/%28ASCE%291527-
6988%282006%297%3A2%2840%29.
Shaw, Rajib, Koichi Shiwaku Hirohide Kobayashi, and Masami Kobayashi. 2004.
“Linking experience, education, perception and earthquake preparedness.” Disaster
Prevention and Management 13(1): 39–49.
http://www.emeraldinsight.com/10.1108/09653560410521689 (March 21, 2013).
Shoaf, K I, H R Sareen, L H Nguyen, and L B Bourque. 1998. “Injuries as a result of
California earthquakes in the past decade.” Disasters 22(3): 218–35.
http://www.ncbi.nlm.nih.gov/pubmed/9753812.
Smit, Barry, and Johanna Wandel. 2006. “Adaptation, adaptive capacity and
vulnerability.” Global Environmental Change 16(3): 282–292.
http://linkinghub.elsevier.com/retrieve/pii/S0959378006000410 (February 12,
2013).

134
Steinberg, Ted. 2006. Acts of God: The Unnatural History of Natural Disasters in
America. 2nd ed. New York, NY: Oxford University Press.
Tseng, Chun-Pin, and Cheng-Wu Chen. 2011. “Natural disaster management
mechanisms for probabilistic earthquake loss.” Natural Hazards 60(3): 1055–1063.
http://link.springer.com/10.1007/s11069-011-9889-2 (May 3, 2013).
USGS. 2012. “Understanding Plate Motions.”
http://pubs.usgs.gov/gip/dynamic/understanding.html (May 5, 2013).
Wagner, R. M. 1996. “A Case-Control Study of Risk Factors for Physical Injury During
the Mainshock of the 1989 Loma Prieta earthquake in the County of Santa Cruz,
California.” John Hopkins University.
Wetmore, Jameson M. 2007. “Distributing Risks and Responsibilities: Flood Hazard
Mitigation in New Orleans.” Social Studies of Science 37(1): 119–126.
Wolf, Edward. 2011. “Oregon’s best-kept secret? Seismic grants an unsung bright spot in
Oregon's gloomy spring.” Oregonian.
http://www.oregonlive.com/opinion/index.ssf/2011/04/oregons_best-
kept_secret_seism.html.
Yeats, Robert S. 1998. Living with Earthquakes in the Pacific Northwest. Corvallis, OR:
Oregon State University Press.
Yeats, RS, KE Sieh, and CR Allen. 1997. The geology of earthquakes. New York, NY:
Oxford University Press.
Zeiderman, Austin. 2012. “On shaky ground: the making of risk in Bogotá.” Environment
and Planning A 44(7): 1570–1588. http://www.envplan.com/abstract.cgi?id=a44283
(October 28, 2012).