Fault/Horizon Interpretation Using - West Virginia...
22
SynPAK Tutorial Exercise I Version 7.0 By Seismic Micro-Technology, Inc.
Transcript of Fault/Horizon Interpretation Using - West Virginia...
SynPAK Tutorial Exercise I
Version 7.0
By Seismic Micro-Technology, Inc.

SynPAK Tutorials 7.0 Synthetics Exercise I •••• i
Contents
Contents.......................................................................................................... i
Introduction ...................................................................................................1
SYNPAK PARAMETERS ............................................................................. 1 T-D Chart............................................................................................................................. 2
Velocity................................................................................................................................ 2
Density................................................................................................................................. 4
Reference Log...................................................................................................................... 5
Wavelets .............................................................................................................................. 6
SYNTHETIC DISPLAY............................................................................... 14

SynPAK Tutorial 7.0 Synthetics Exercise I •••• 1
Introduction This tutorial guides you through the creation of a synthetic seismogram. The examples shown here are from the Sooner Demo dataset included in your 7.0 CD.
The objectives of this tutorial are to show you how to:
• Select parameters needed to generate a synthetic seismogram
• Generate a wavelet to convolve with the Acoustic Impedance log
• Display a synthetic seismogram in SynPAK

SynPAK Tutorial 7.0 Synthetic Exercise I •••• 1
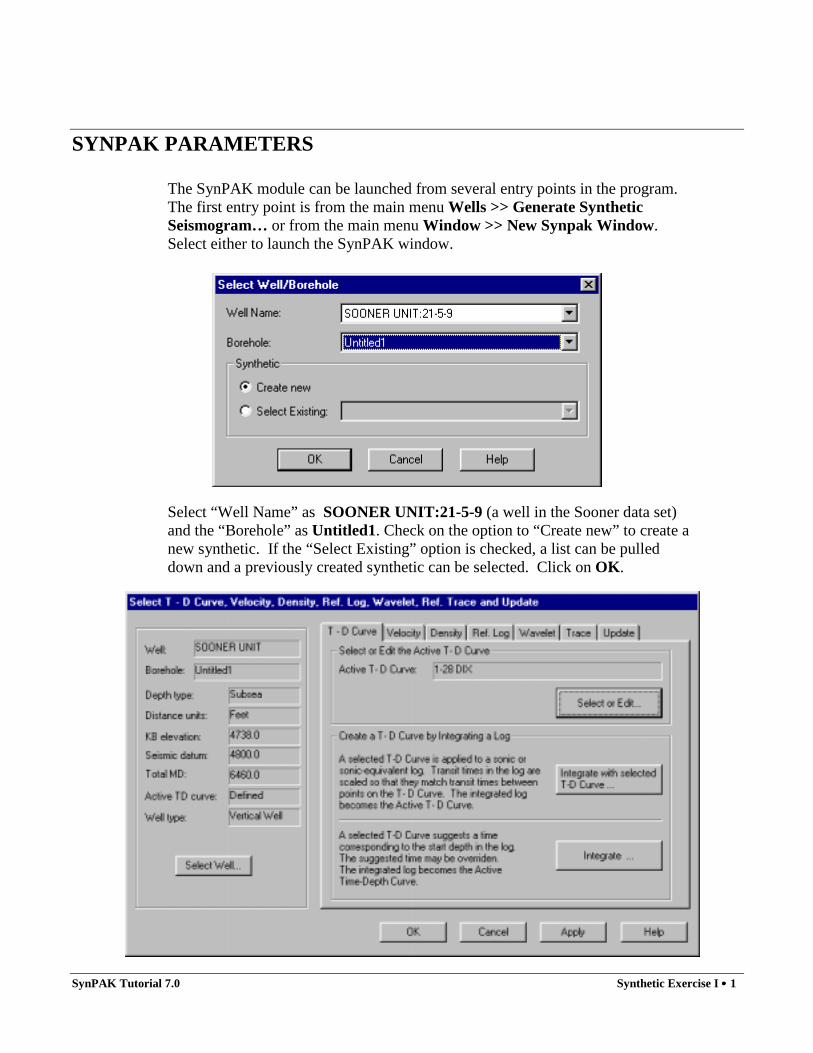
SYNPAK PARAMETERS
The SynPAK module can be launched from several entry points in the program. The first entry point is from the main menu Wells >> Generate Synthetic Seismogram… or from the main menu Window >> New Synpak Window. Select either to launch the SynPAK window.
Select “Well Name” as SOONER UNIT:21-5-9 (a well in the Sooner data set) and the “Borehole” as Untitled1. Check on the option to “Create new” to create a new synthetic. If the “Select Existing” option is checked, a list can be pulled down and a previously created synthetic can be selected. Click on OK.
2 •••• SynPAK Tutorials 7.0 Synthetics Exercise I
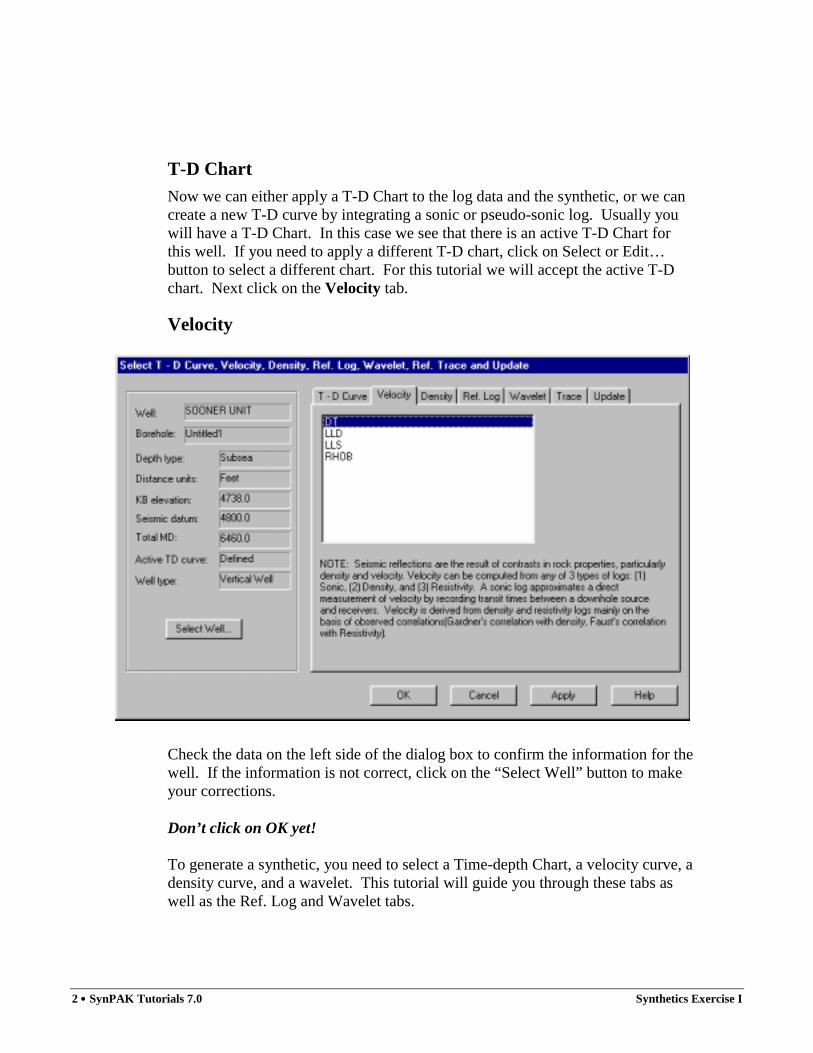
T-D Chart Now we can either apply a T-D Chart to the log data and the synthetic, or we can create a new T-D curve by integrating a sonic or pseudo-sonic log. Usually you will have a T-D Chart. In this case we see that there is an active T-D Chart for this well. If you need to apply a different T-D chart, click on Select or Edit… button to select a different chart. For this tutorial we will accept the active T-D chart. Next click on the Velocity tab.
Velocity
Check the data on the left side of the dialog box to confirm the information for the well. If the information is not correct, click on the “Select Well” button to make your corrections. Don’t click on OK yet! To generate a synthetic, you need to select a Time-depth Chart, a velocity curve, a density curve, and a wavelet. This tutorial will guide you through these tabs as well as the Ref. Log and Wavelet tabs.
SynPAK Tutorial 7.0 Synthetic Exercise I •••• 3
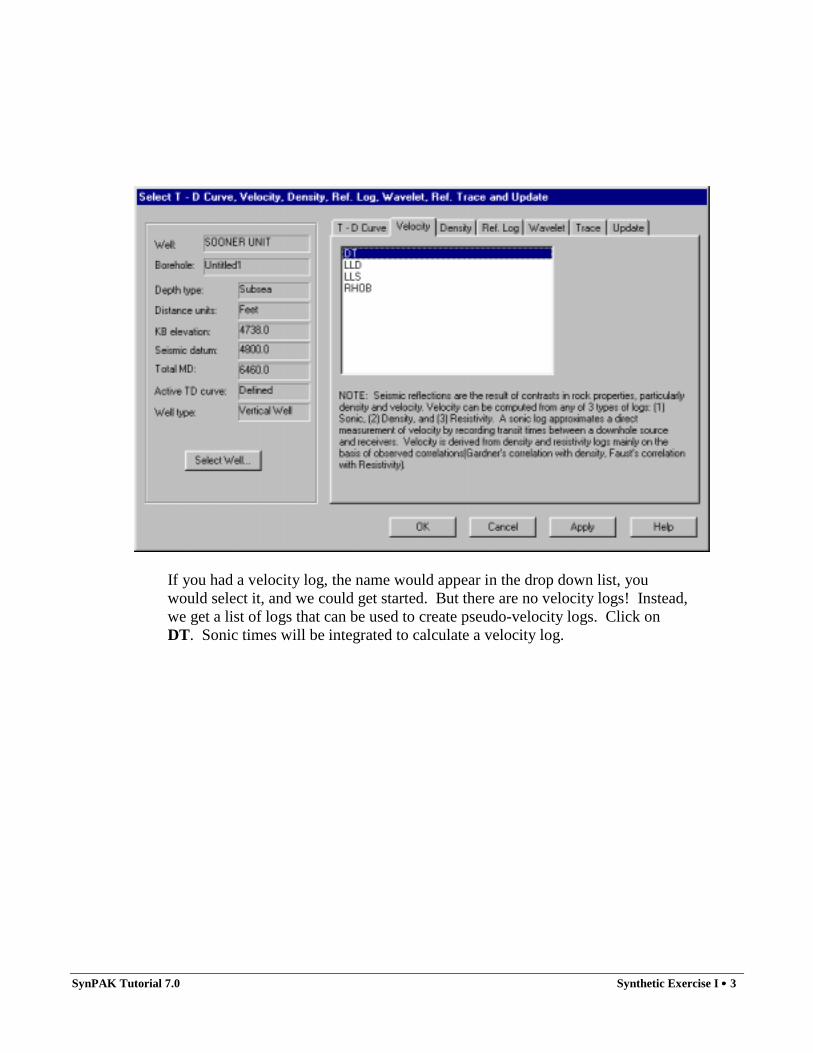
If you had a velocity log, the name would appear in the drop down list, you would select it, and we could get started. But there are no velocity logs! Instead, we get a list of logs that can be used to create pseudo-velocity logs. Click on DT. Sonic times will be integrated to calculate a velocity log.
4 •••• SynPAK Tutorials 7.0 Synthetics Exercise I
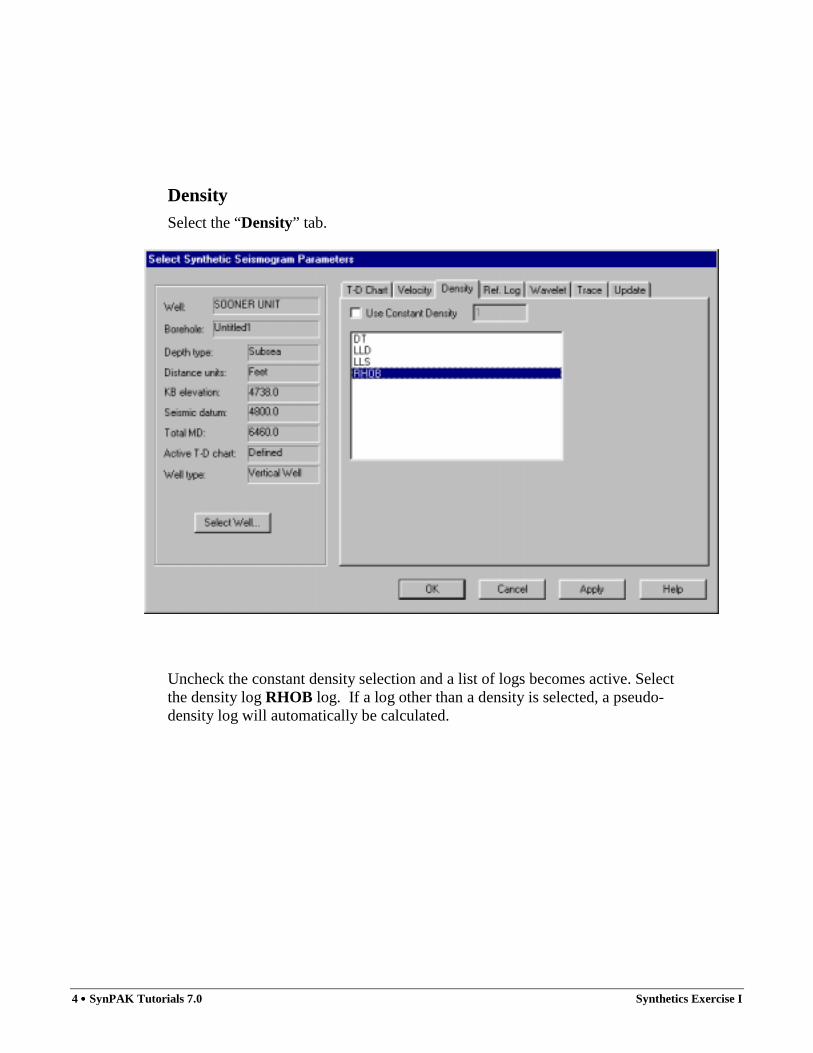
Density Select the “Density” tab.
Uncheck the constant density selection and a list of logs becomes active. Select the density log RHOB log. If a log other than a density is selected, a pseudo-density log will automatically be calculated.
SynPAK Tutorial 7.0 Synthetic Exercise I •••• 5
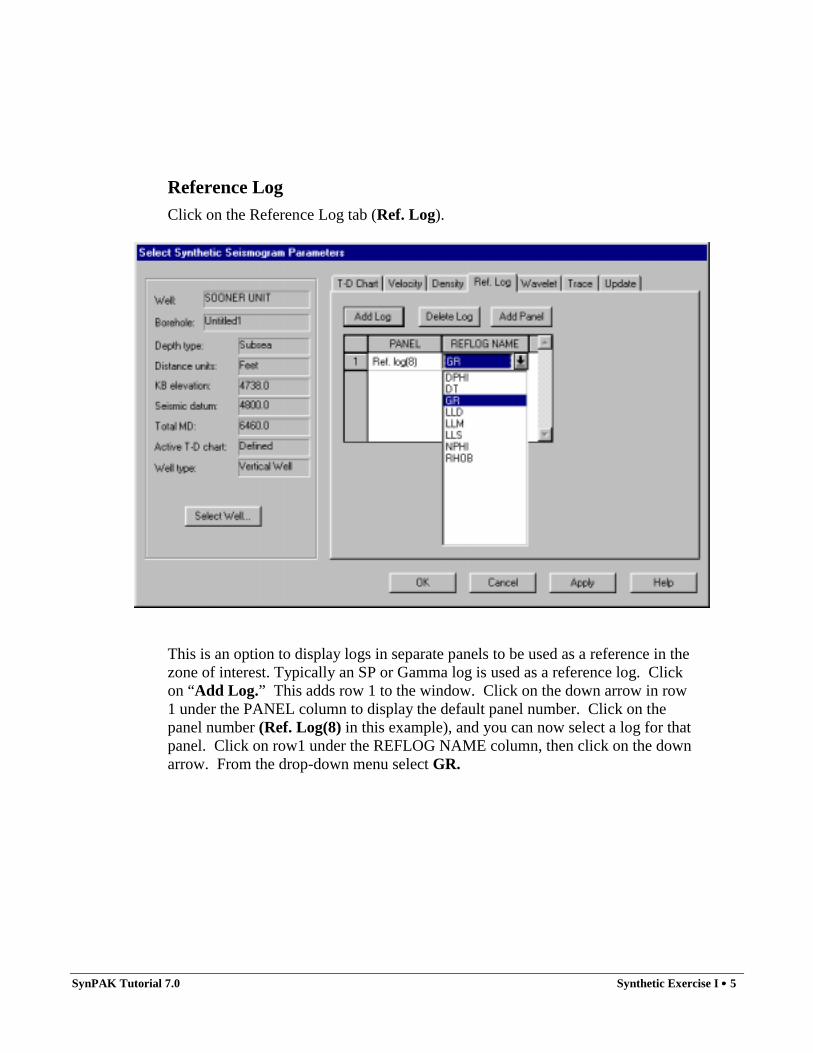
Reference Log Click on the Reference Log tab (Ref. Log).
This is an option to display logs in separate panels to be used as a reference in the zone of interest. Typically an SP or Gamma log is used as a reference log. Click on “Add Log.” This adds row 1 to the window. Click on the down arrow in row 1 under the PANEL column to display the default panel number. Click on the panel number (Ref. Log(8) in this example), and you can now select a log for that panel. Click on row1 under the REFLOG NAME column, then click on the down arrow. From the drop-down menu select GR.
6 •••• SynPAK Tutorials 7.0 Synthetics Exercise I
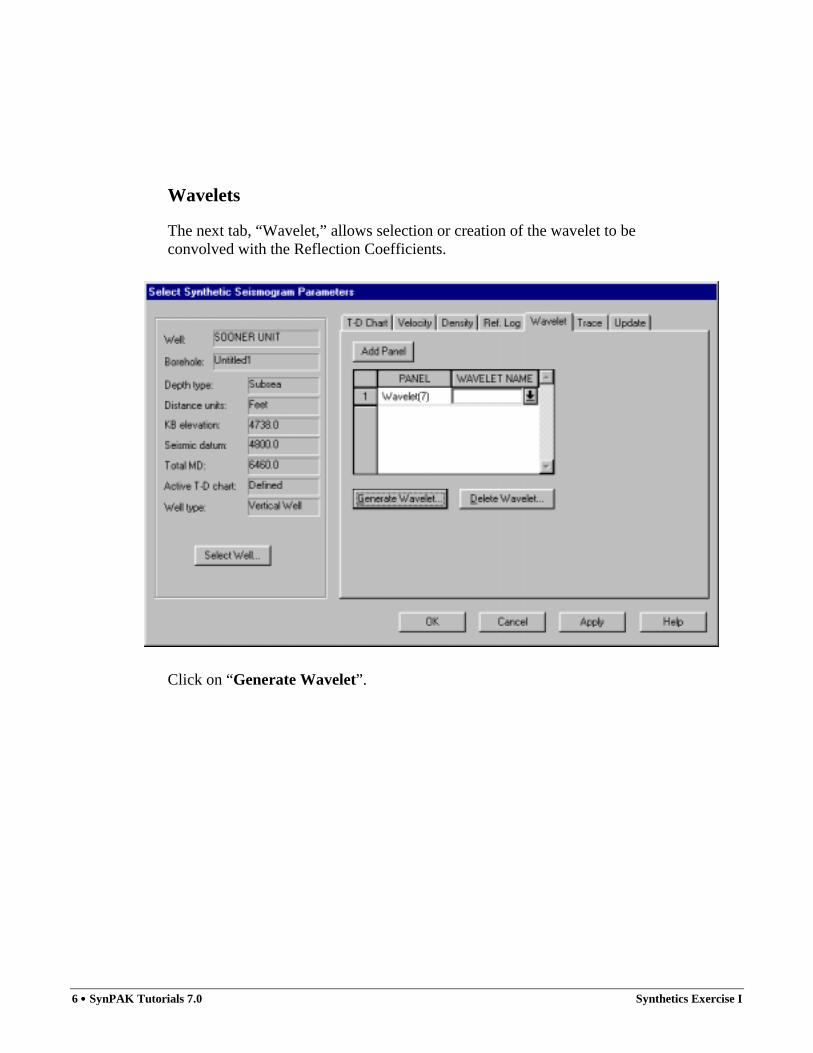
Wavelets
The next tab, “Wavelet,” allows selection or creation of the wavelet to be convolved with the Reflection Coefficients.
Click on “Generate Wavelet”.
SynPAK Tutorial 7.0 Synthetic Exercise I •••• 7
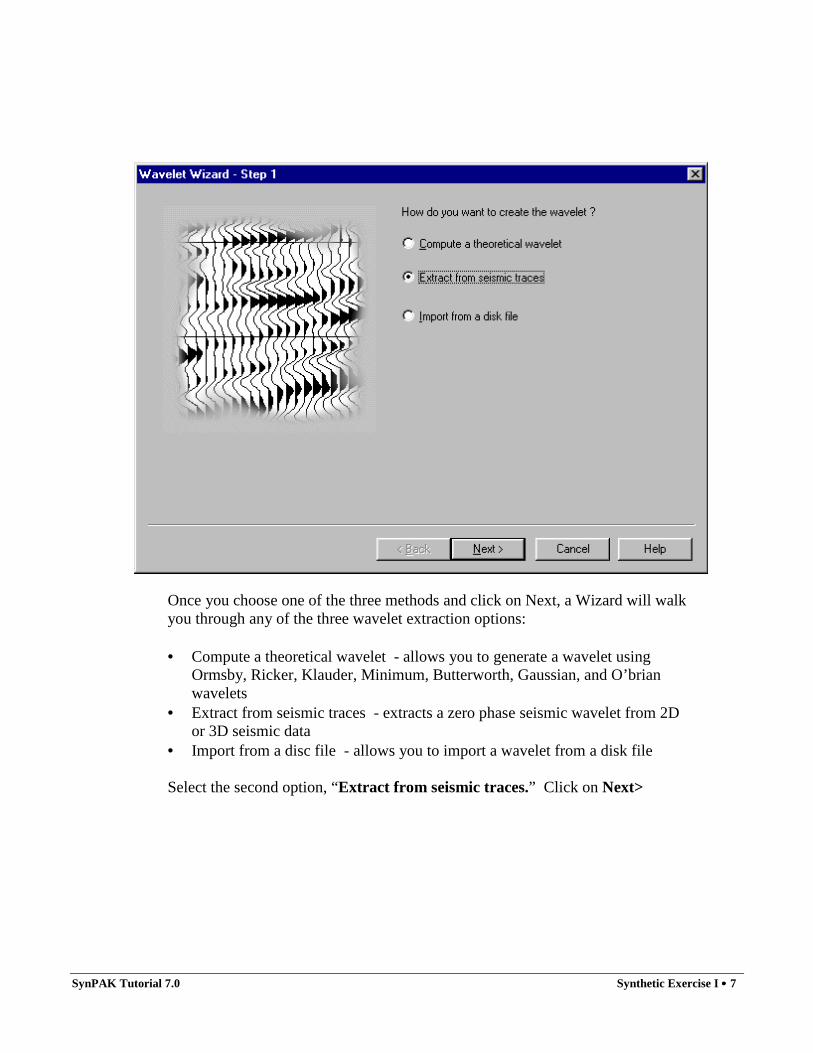
Once you choose one of the three methods and click on Next, a Wizard will walk you through any of the three wavelet extraction options: • Compute a theoretical wavelet - allows you to generate a wavelet using
Ormsby, Ricker, Klauder, Minimum, Butterworth, Gaussian, and O’brian wavelets
• Extract from seismic traces - extracts a zero phase seismic wavelet from 2D or 3D seismic data
• Import from a disc file - allows you to import a wavelet from a disk file Select the second option, “Extract from seismic traces.” Click on Next>
8 •••• SynPAK Tutorials 7.0 Synthetics Exercise I
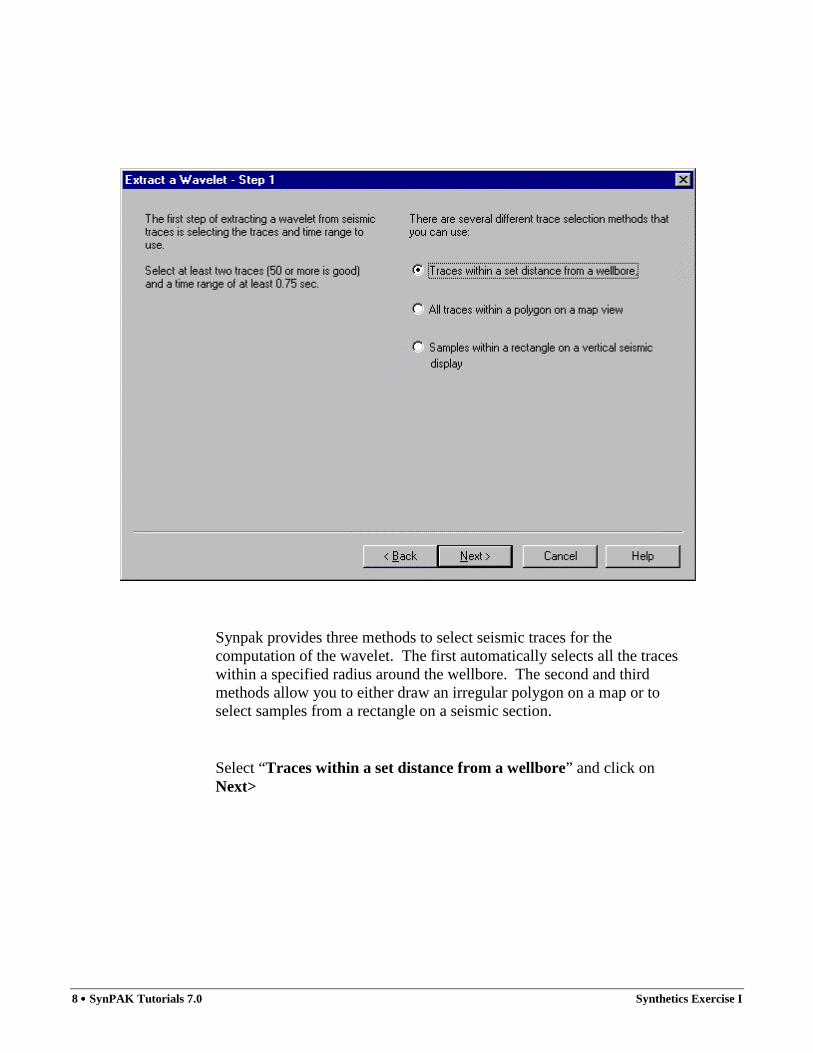
Synpak provides three methods to select seismic traces for the computation of the wavelet. The first automatically selects all the traces within a specified radius around the wellbore. The second and third methods allow you to either draw an irregular polygon on a map or to select samples from a rectangle on a seismic section. Select “Traces within a set distance from a wellbore” and click on Next>
SynPAK Tutorial 7.0 Synthetic Exercise I •••• 9
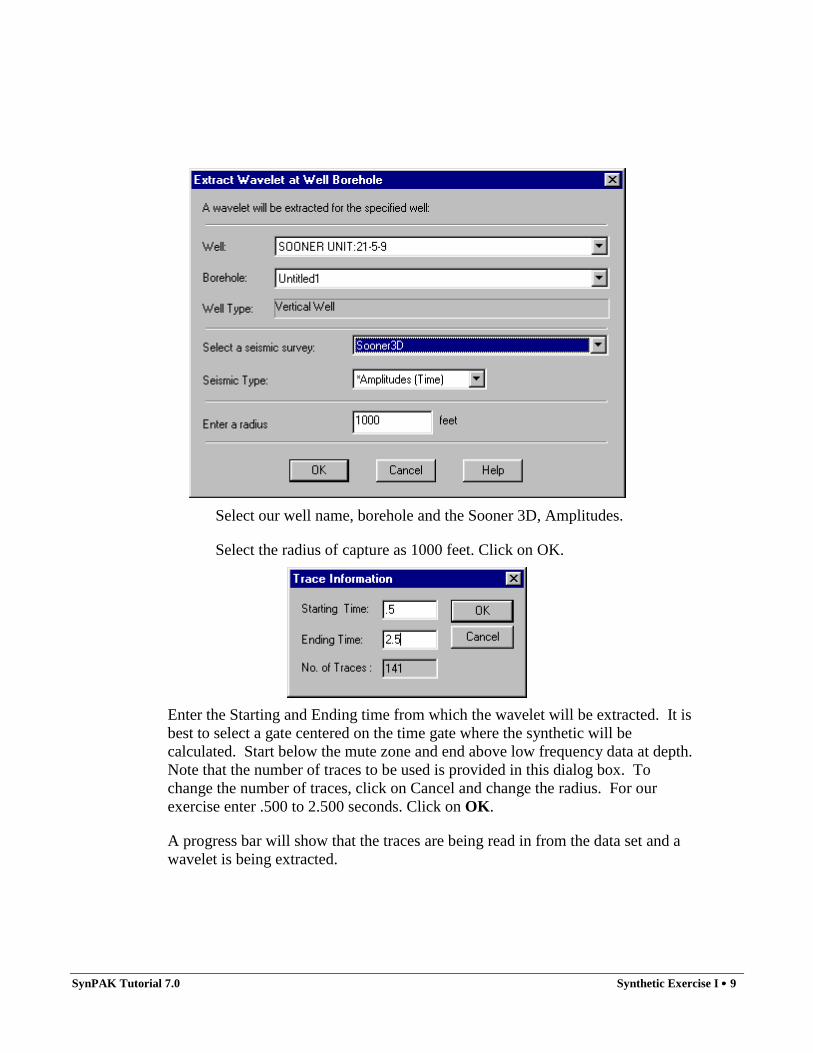
Select our well name, borehole and the Sooner 3D, Amplitudes.
Select the radius of capture as 1000 feet. Click on OK.
Enter the Starting and Ending time from which the wavelet will be extracted. It is best to select a gate centered on the time gate where the synthetic will be calculated. Start below the mute zone and end above low frequency data at depth. Note that the number of traces to be used is provided in this dialog box. To change the number of traces, click on Cancel and change the radius. For our exercise enter .500 to 2.500 seconds. Click on OK.
A progress bar will show that the traces are being read in from the data set and a wavelet is being extracted.
10 •••• SynPAK Tutorials 7.0 Synthetics Exercise I
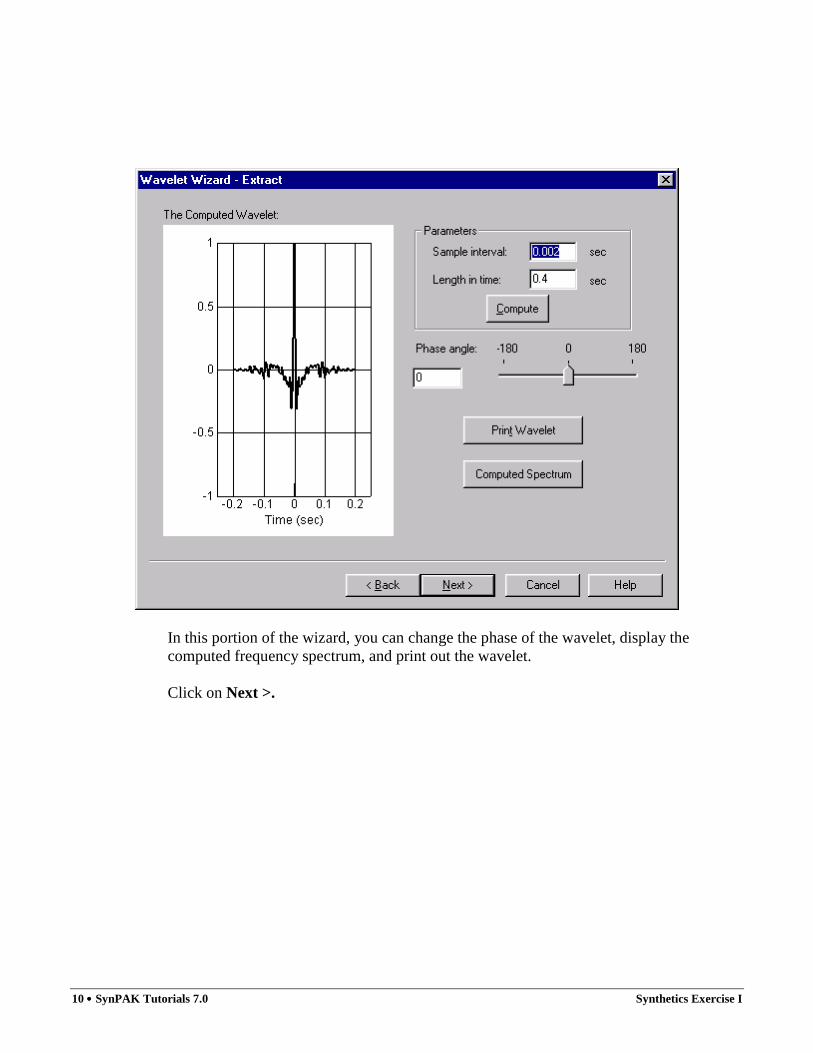
In this portion of the wizard, you can change the phase of the wavelet, display the computed frequency spectrum, and print out the wavelet. Click on Next >.
SynPAK Tutorial 7.0 Synthetic Exercise I •••• 11
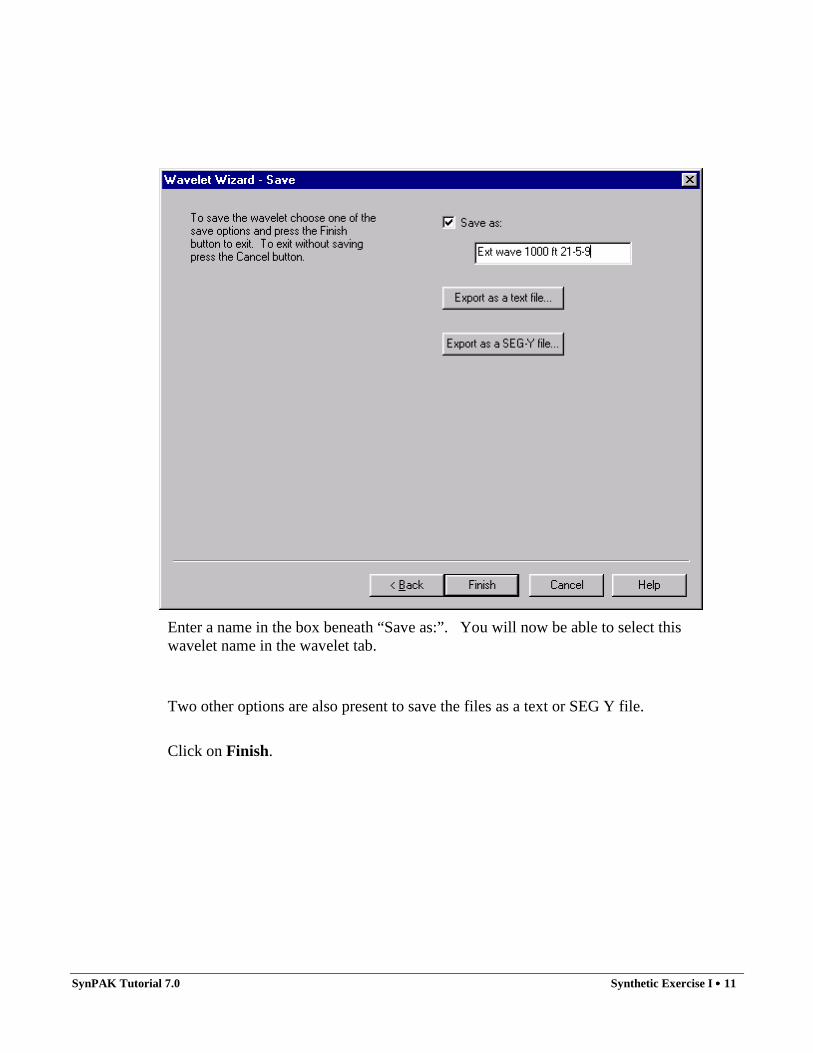
Enter a name in the box beneath “Save as:”. You will now be able to select this wavelet name in the wavelet tab.
Two other options are also present to save the files as a text or SEG Y file.
Click on Finish.
12 •••• SynPAK Tutorials 7.0 Synthetics Exercise I
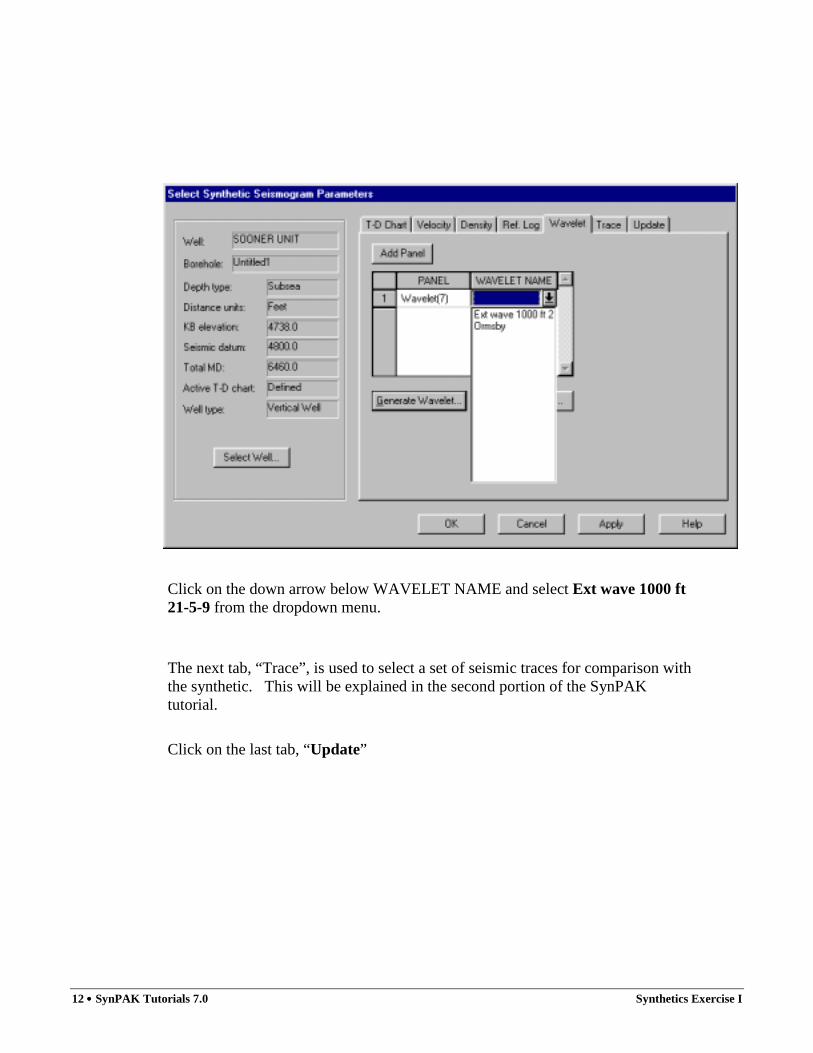
Click on the down arrow below WAVELET NAME and select Ext wave 1000 ft 21-5-9 from the dropdown menu.
The next tab, “Trace”, is used to select a set of seismic traces for comparison with the synthetic. This will be explained in the second portion of the SynPAK tutorial.
Click on the last tab, “Update”
SynPAK Tutorial 7.0 Synthetic Exercise I •••• 13
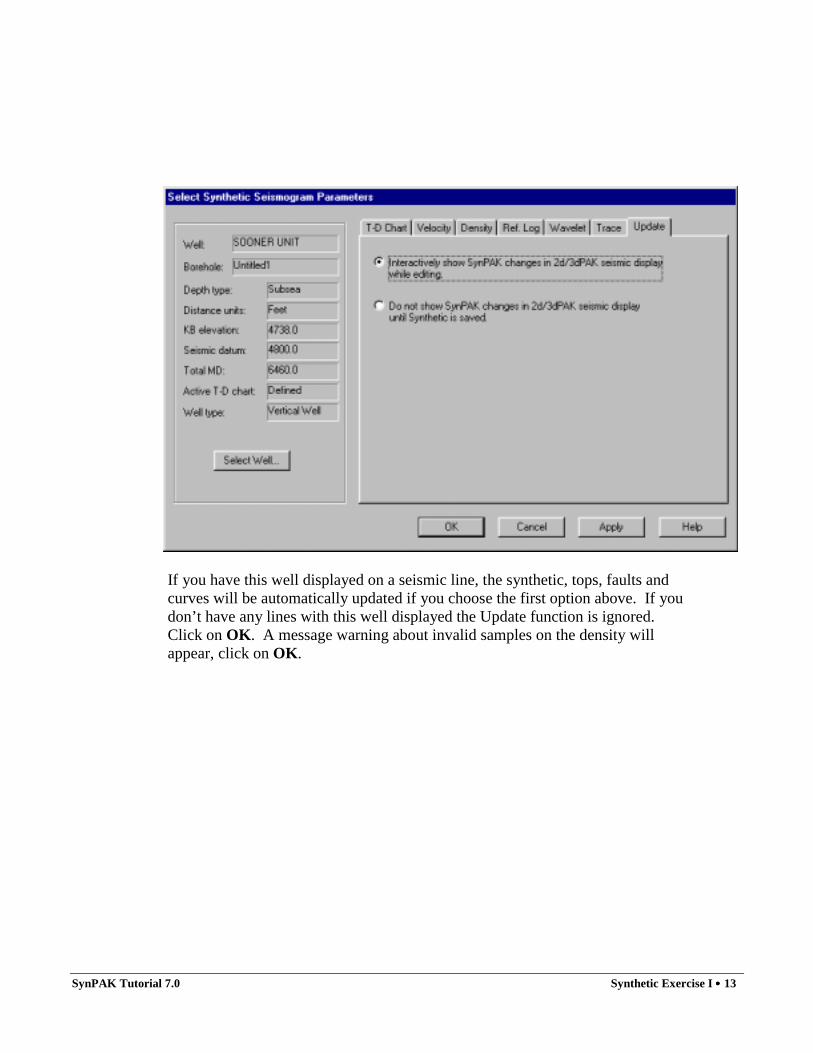
If you have this well displayed on a seismic line, the synthetic, tops, faults and curves will be automatically updated if you choose the first option above. If you don’t have any lines with this well displayed the Update function is ignored. Click on OK. A message warning about invalid samples on the density will appear, click on OK.
14 •••• SynPAK Tutorials 7.0 Synthetics Exercise I
SYNTHETIC DISPLAY
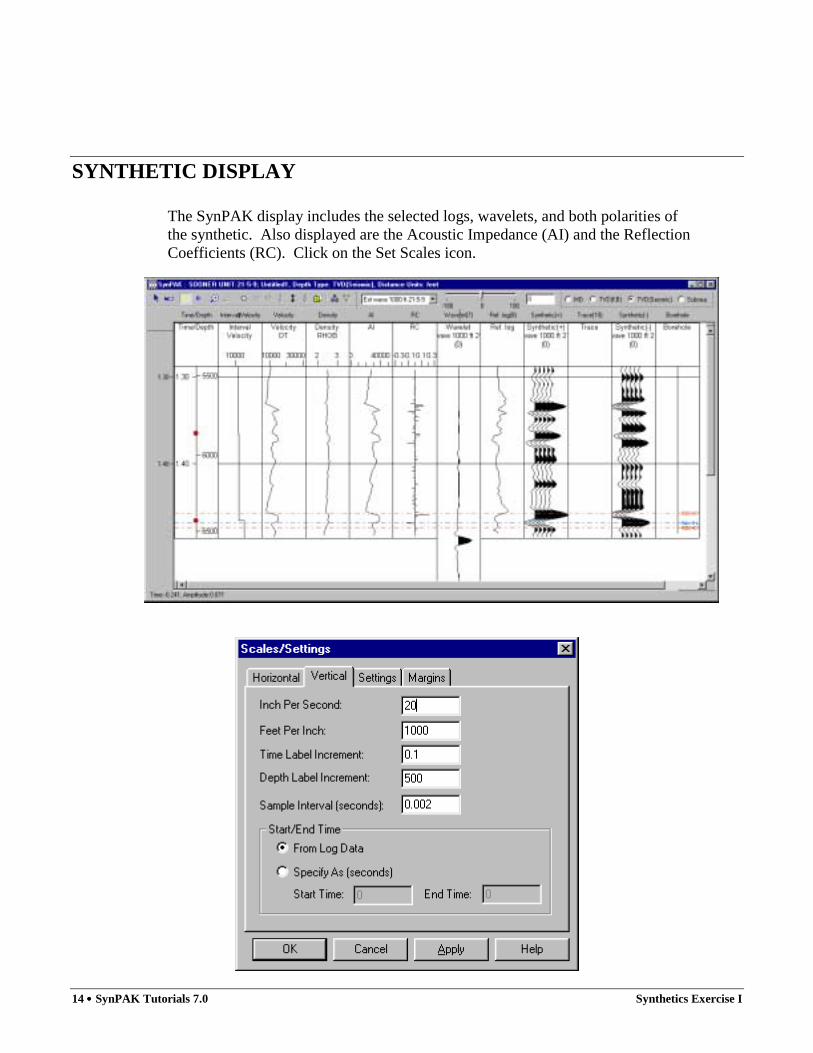
The SynPAK display includes the selected logs, wavelets, and both polarities of the synthetic. Also displayed are the Acoustic Impedance (AI) and the Reflection Coefficients (RC). Click on the Set Scales icon.
SynPAK Tutorial 7.0 Synthetic Exercise I •••• 15
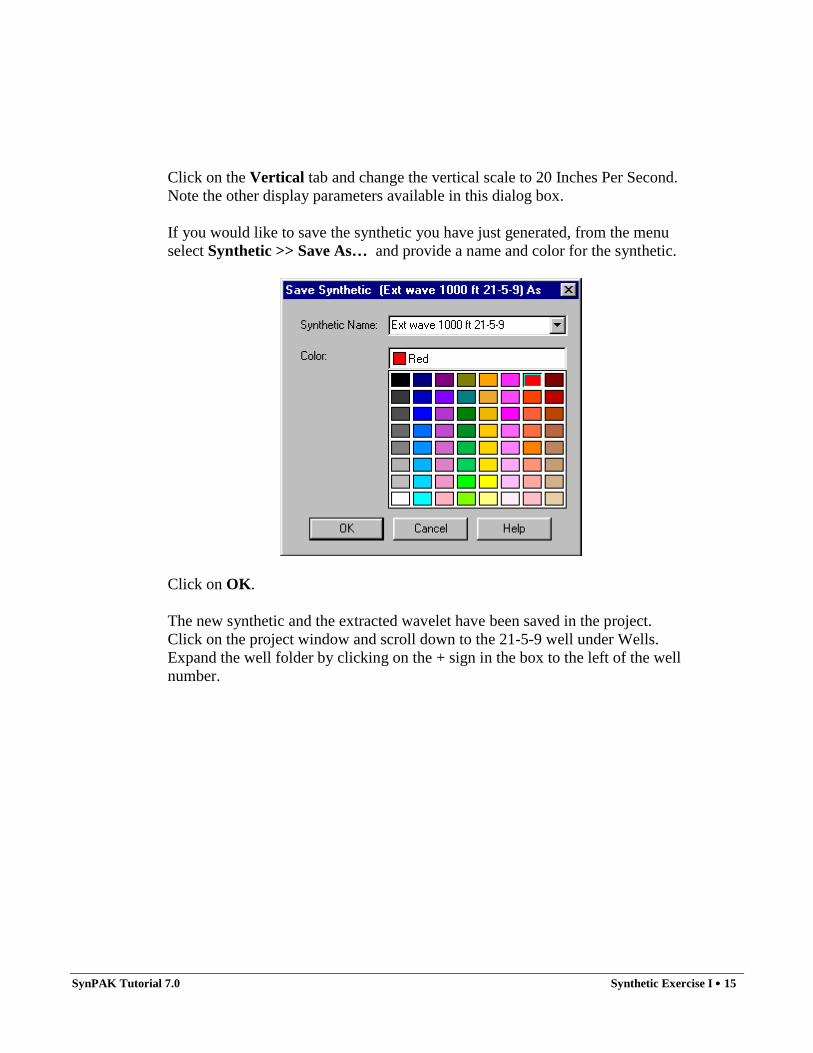
Click on the Vertical tab and change the vertical scale to 20 Inches Per Second. Note the other display parameters available in this dialog box. If you would like to save the synthetic you have just generated, from the menu select Synthetic >> Save As… and provide a name and color for the synthetic.
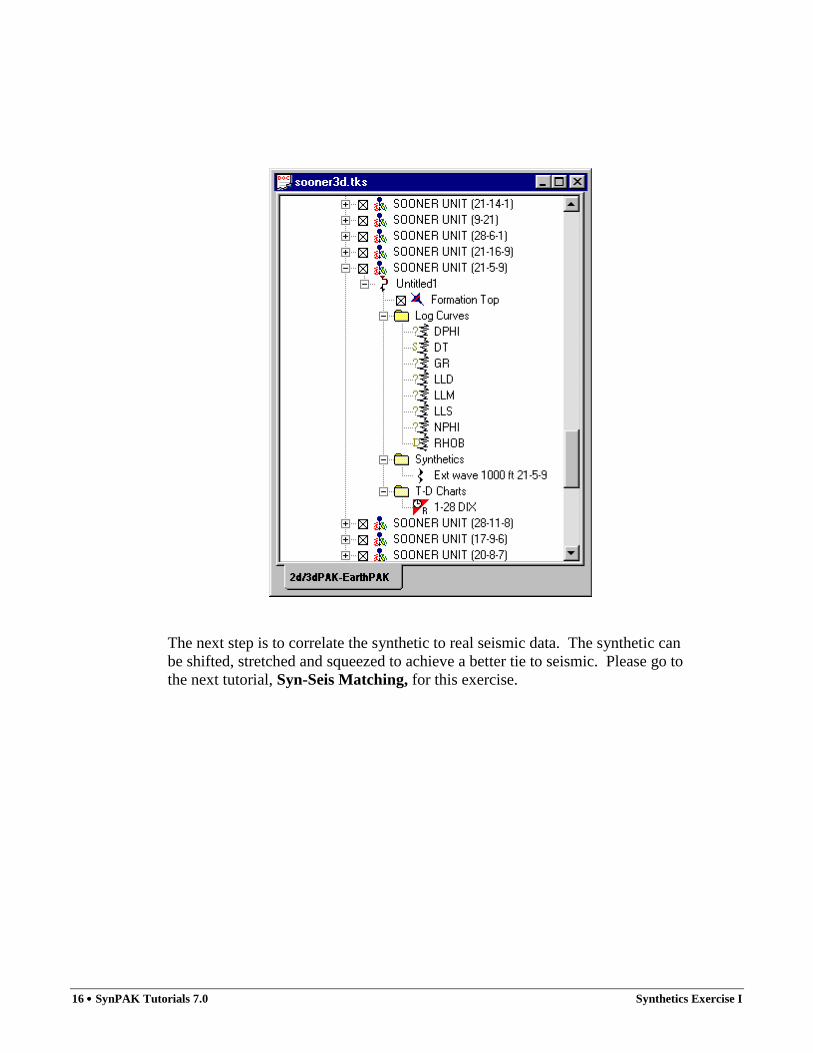
Click on OK. The new synthetic and the extracted wavelet have been saved in the project. Click on the project window and scroll down to the 21-5-9 well under Wells. Expand the well folder by clicking on the + sign in the box to the left of the well number.
16 •••• SynPAK Tutorials 7.0 Synthetics Exercise I
The next step is to correlate the synthetic to real seismic data. The synthetic can be shifted, stretched and squeezed to achieve a better tie to seismic. Please go to the next tutorial, Syn-Seis Matching, for this exercise.