Fault Tree Training – Course Notes - System safetyissc2015.system-safety.org/T05_...
149
Fault Tree Training – Course Notes Copyright © 2015 Isograph Limited All rights reserved. This document and the associated software contains proprietary information which is protected by copyright and may not be copied in whole or in part except with the prior written permission of Isograph. The copyright and the foregoing restrictions on the copyright extends to all media in which this information may be preserved. Isograph makes no representations or warranties of any kind whatsoever with respect to this document and its associated software. Isograph disclaims all liabilities for loss of damage arising out of the possession, sale, or use of this document or its associated software. 1
Transcript of Fault Tree Training – Course Notes - System safetyissc2015.system-safety.org/T05_...
Fault Tree Training – Course Notes
Copyright © 2015 Isograph Limited
All rights reserved. This document and the associated software contains proprietary information which is protected by copyright and
may not be copied in whole or in part except with the prior written permission of Isograph. The copyright and the foregoing restrictions
on the copyright extends to all media in which this information may be preserved.
Isograph makes no representations or warranties of any kind whatsoever with respect to this document and its associated software.
Isograph disclaims all liabilities for loss of damage arising out of the possession, sale, or use of this document or its associated software.
1
©2015 Isograph Inc.
An Introduction
Fault Tree Analysis
Reliability Workbench 1–1
©2015 Isograph Inc.
An Introduction
Joe Belland, Isograph Inc.
Fault Tree Analysis
Reliability Workbench 1–2
2
©2015 Isograph Inc.
Isograph
� Founded in 1986
� Nuclear industry
� Off-the-shelf PRA tool
� Products
� Fault Trees, simulation, optimization, prediction
Reliability Workbench 1–3
©2015 Isograph Inc.
Me
� Joined Isograph in 2003
� Background in Math/Comp Sci
� Support, training, development
Reliability Workbench 1–4
3
©2015 Isograph Inc.
This Presentation
� Overview of Fault Tree methods
� Includes examples from RWB
� Not in-depth look at Isograph’s FT
� Sept 15-16, Alpine, UT
� Oct 6-7, Detroit, MI
Reliability Workbench 1–5
©2015 Isograph Inc.
Fault Tree Software
� Examples from Reliability Workbench
� http://isograph.com/download
� Password: weaverham
Reliability Workbench 1–6
4
©2015 Isograph Inc.
IntroductionChapter 1
Reliability Workbench 1–7
©2015 Isograph Inc.
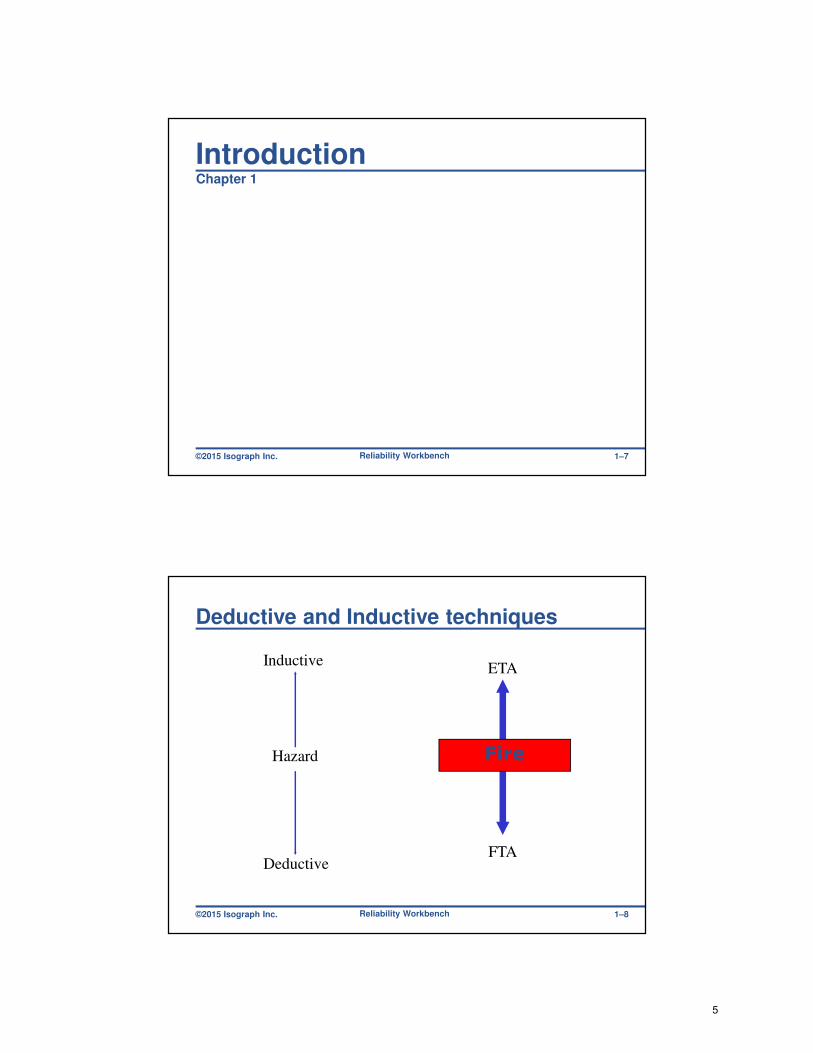
Deductive and Inductive techniques
Inductive
Deductive
Hazard
ETA
FTA
Fire
Reliability Workbench 1–8
5
©2015 Isograph Inc.
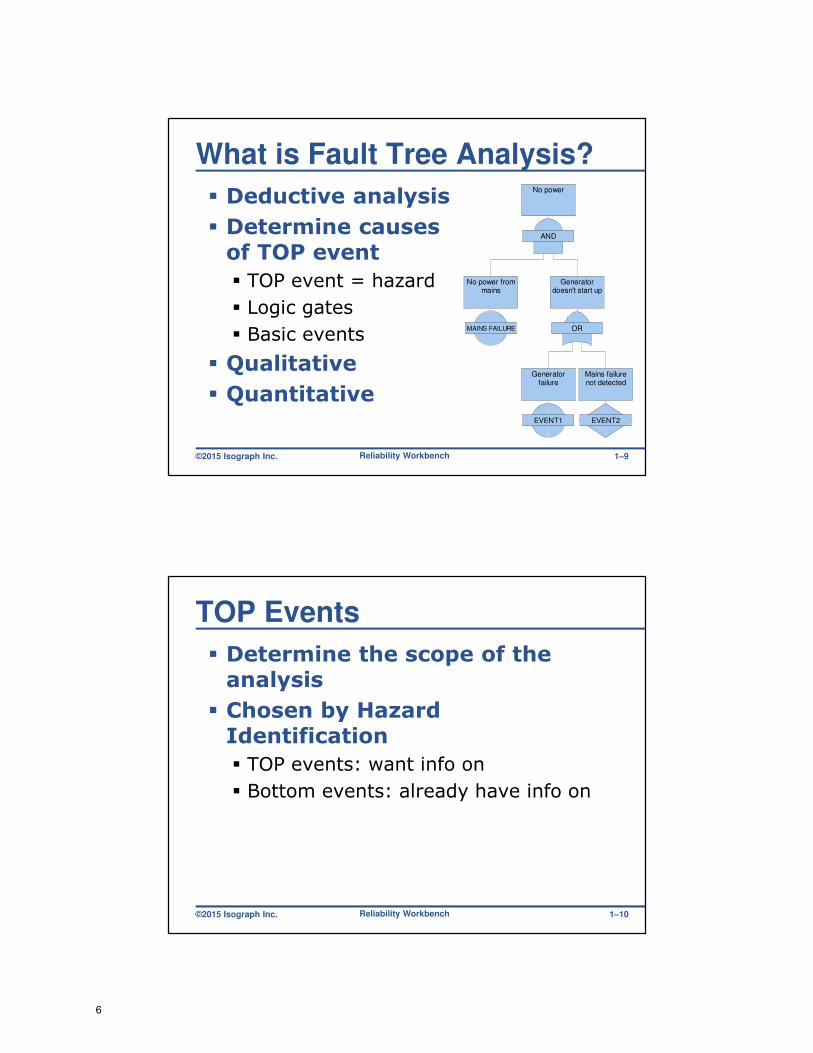
What is Fault Tree Analysis?
� Deductive analysis
� Determine causes of TOP event
� TOP event = hazard
� Logic gates
� Basic events
� Qualitative
� Quantitative
AND
No power
OR
Generatordoesn't start up
MAINS FAILURE
No power frommains
EVENT1
Generatorfailure
EVENT2
Mains failurenot detected
Reliability Workbench 1–9
©2015 Isograph Inc.
TOP Events
� Determine the scope of the analysis
� Chosen by Hazard Identification
� TOP events: want info on
� Bottom events: already have info on
Reliability Workbench 1–10
6
©2015 Isograph Inc.
Typical Basic Events
� Pump failure
� Temperature controller failure
� Switch fails closed
� Operator does not respond
� Crash or unexpected failure of Software routine
Reliability Workbench 1–11
©2015 Isograph Inc.
Typical TOP Events
� Loss of hydraulics in airplane
� Total loss of production
� Fire protection system unavailable
� Car does not start
� Toxic emission
� Aerial refuelling system fails to transfer fuel at the proper rate
Reliability Workbench 1–12
7
©2015 Isograph Inc.
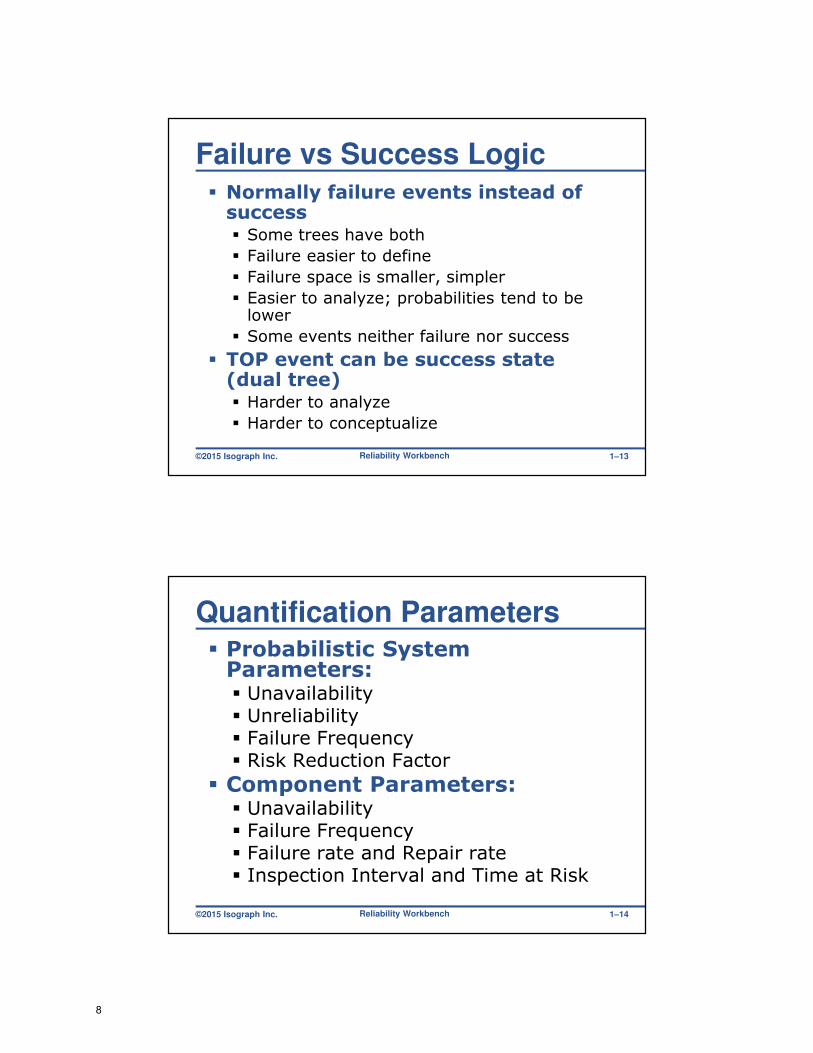
Failure vs Success Logic� Normally failure events instead of success� Some trees have both
� Failure easier to define
� Failure space is smaller, simpler
� Easier to analyze; probabilities tend to be lower
� Some events neither failure nor success
� TOP event can be success state (dual tree)� Harder to analyze
� Harder to conceptualize
Reliability Workbench 1–13
©2015 Isograph Inc.
Quantification Parameters� Probabilistic System Parameters:� Unavailability� Unreliability� Failure Frequency� Risk Reduction Factor
� Component Parameters: � Unavailability� Failure Frequency� Failure rate and Repair rate� Inspection Interval and Time at Risk
Reliability Workbench 1–14
8

©2015 Isograph Inc.
Failure Rate
� Component failure rate (probability per unit time)
Fa
ilu
re r
ate
Burn in Useful life Wear out
Reliability Workbench 1–15
©2015 Isograph Inc.
Constant failure rate
� Analytical methods assume constant failure rate
� Real-life components age: non-constant failure rate
� Underlying assumption that preventive maintenance flattens failure rate curve
� (Generally speaking, of course)
� Weibull failure model
� Markov analysis
Reliability Workbench 1–16
9
©2015 Isograph Inc.
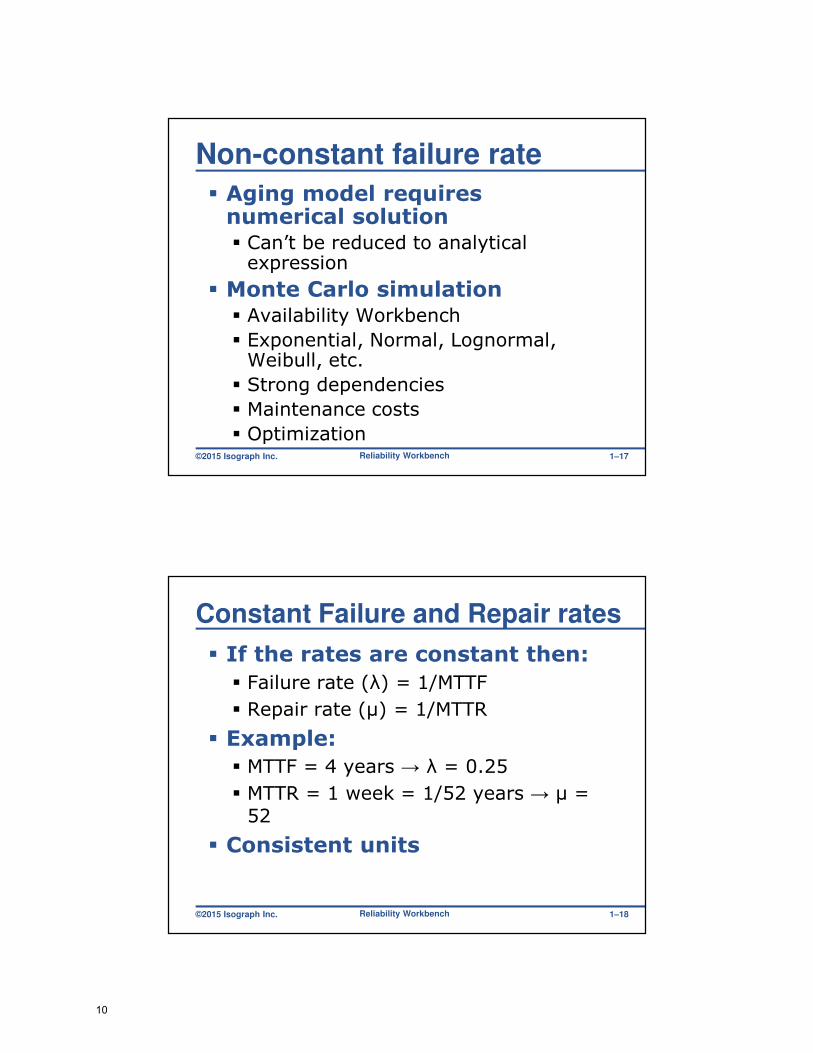
Non-constant failure rate
� Aging model requires numerical solution� Can’t be reduced to analytical
expression
� Monte Carlo simulation� Availability Workbench
� Exponential, Normal, Lognormal, Weibull, etc.
� Strong dependencies
� Maintenance costs
� OptimizationReliability Workbench 1–17
©2015 Isograph Inc.
Constant Failure and Repair rates
� If the rates are constant then:
� Failure rate (λ) = 1/MTTF
� Repair rate (µ) = 1/MTTR
� Example:
� MTTF = 4 years → λ = 0.25
� MTTR = 1 week = 1/52 years → µ =
52
� Consistent units
Reliability Workbench 1–18
10

©2015 Isograph Inc.
Unavailability Q(t)
� Unavailability: not operating at time t� Continuously operating systems
� Unavailability: does not work on demand � Safety/standby system
� PFD
� Unavailability per flight hour: Q(T)/T� Used in aerospace/ISO 26262
Reliability Workbench 1–19
©2015 Isograph Inc.
Unreliability F(t)
� Probability of failure over time
� Prob. that system fails between time 0 and time t
� Prob. that system fails over given time period
� Non-repairable systems
� Probability of catastrophic event
� Warranty costs
Reliability Workbench 1–20
11
©2015 Isograph Inc.
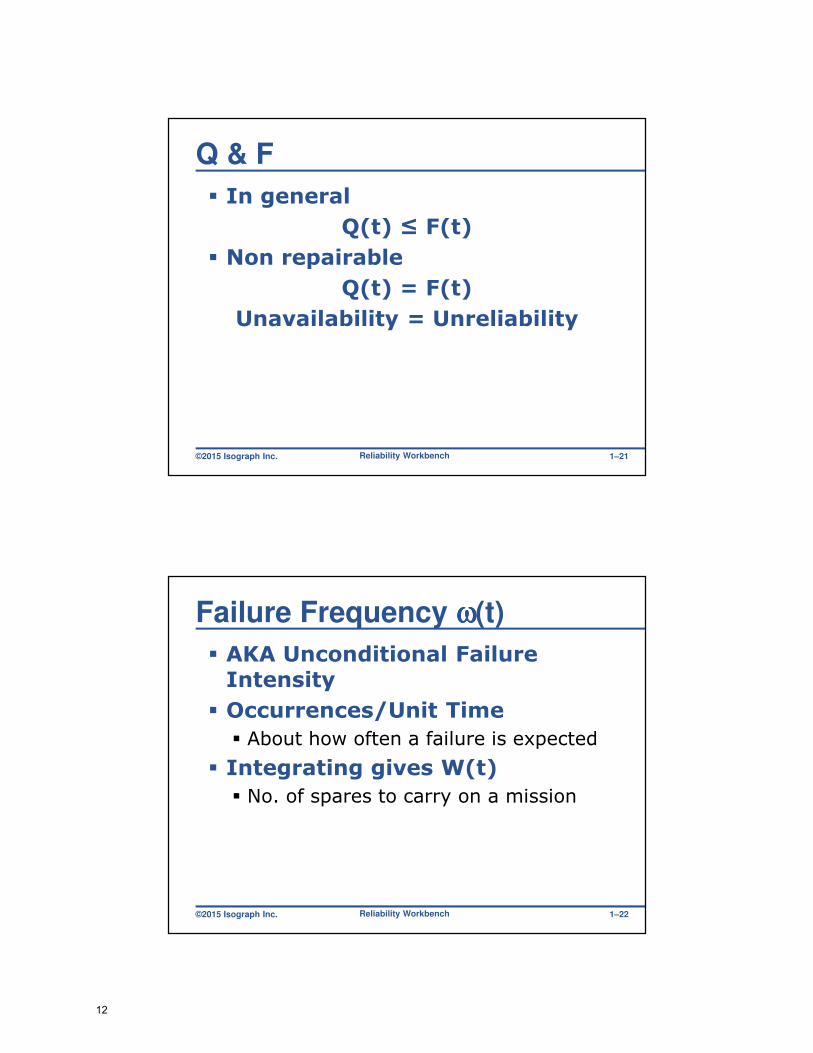
Q & F
� In general
Q(t) ≤ F(t)
� Non repairable
Q(t) = F(t)
Unavailability = Unreliability
Reliability Workbench 1–21
©2015 Isograph Inc.
Failure Frequency ωωωω(t)
� AKA Unconditional Failure Intensity
� Occurrences/Unit Time
� About how often a failure is expected
� Integrating gives W(t)
� No. of spares to carry on a mission
Reliability Workbench 1–22
12
©2015 Isograph Inc.
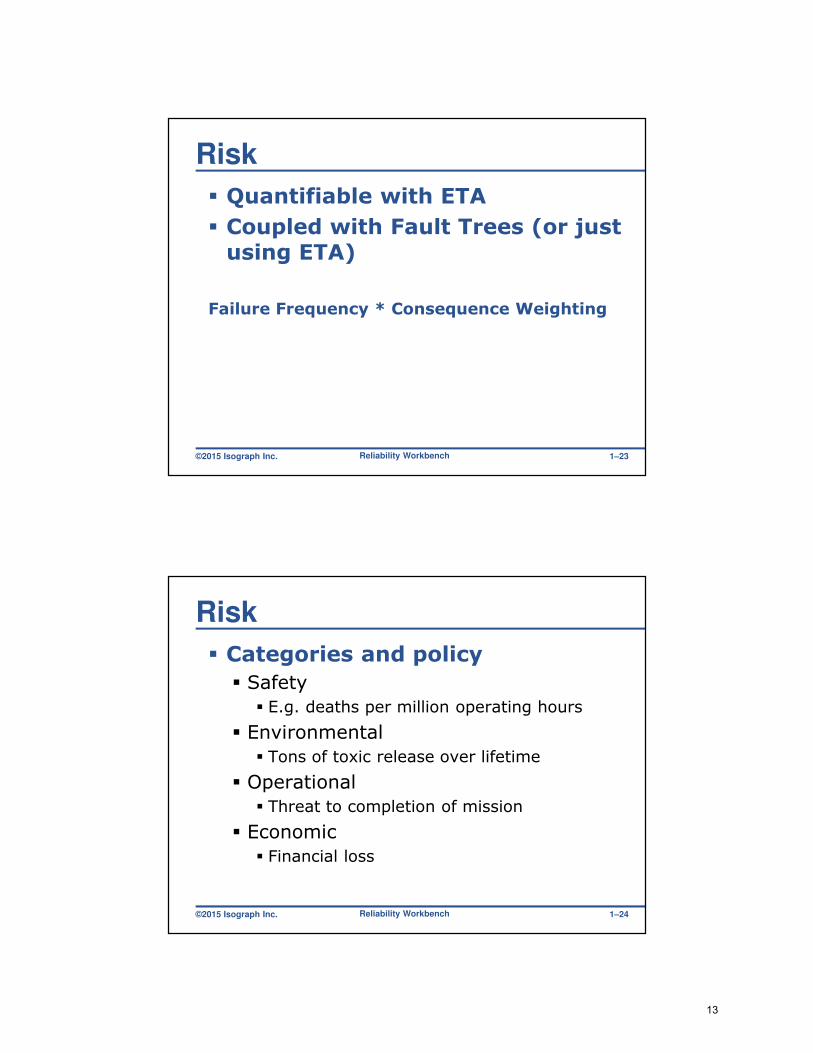
Risk
� Quantifiable with ETA
� Coupled with Fault Trees (or just using ETA)
Failure Frequency * Consequence Weighting
Reliability Workbench 1–23
©2015 Isograph Inc.
Risk
� Categories and policy
� Safety
� E.g. deaths per million operating hours
� Environmental
� Tons of toxic release over lifetime
� Operational
� Threat to completion of mission
� Economic
� Financial loss
Reliability Workbench 1–24
13

©2015 Isograph Inc.
Risk policy (acceptable risk)
� Aerospace� deaths per flight hour
� Automotive� controllability of vehicle
� Railway� deaths per train miles
� Space� operational risk
� Pharmaceutical� human risk
Reliability Workbench 1–25
©2015 Isograph Inc.
Risk Reduction Factor
� How much each protection layer lowers risk
� Reciprocal of Qmean
� Current risk ÷ risk policy = required further RRF
Reliability Workbench 1–26
14
©2015 Isograph Inc.
End of Chapter 1
� Summary
� FT is deductive hazard analysis
� Graphically shows logical relationship between TOP and Basic events
� Qualitative/quantitative
� Constant rates
� Unavailability/Unreliaiblity/Frequency
� Risk
Reliability Workbench 1–27
15
©2015 Isograph Inc.
Fault Tree ConstructionChapter 2
Reliability Workbench 2–1
©2015 Isograph Inc.
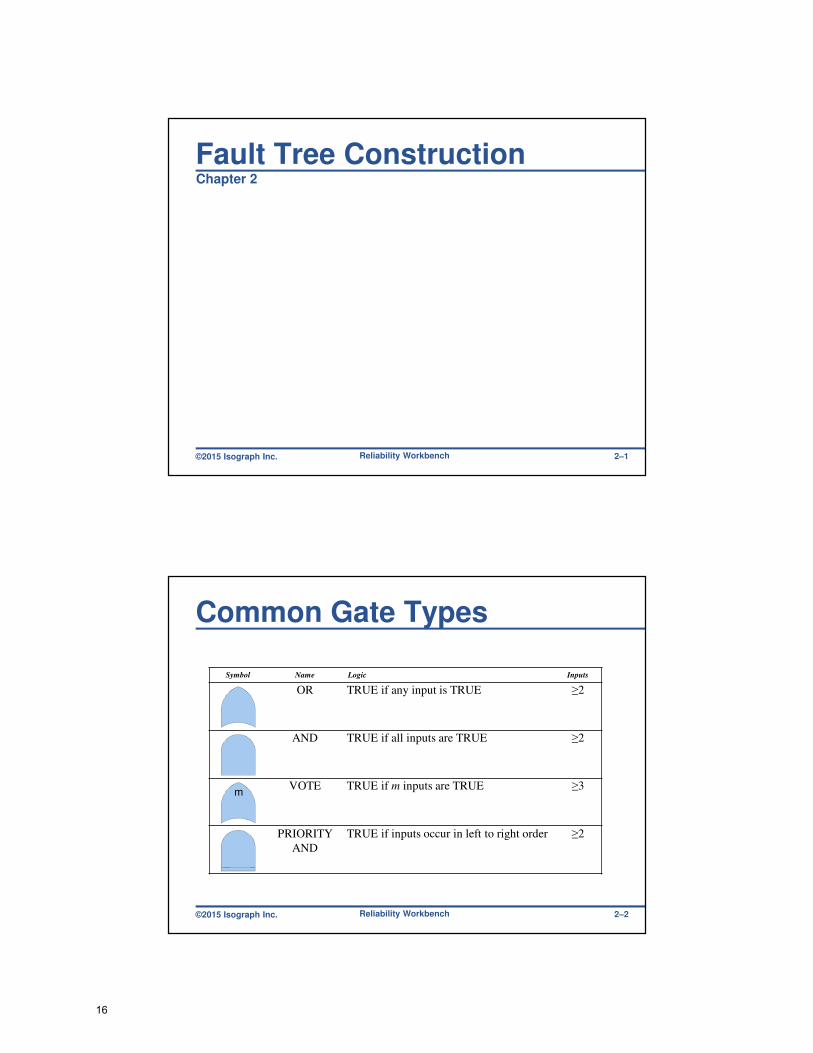
Common Gate Types
Symbol Name Logic Inputs
OR TRUE if any input is TRUE ≥2
AND TRUE if all inputs are TRUE ≥2
VOTE TRUE if m inputs are TRUE ≥3
PRIORITY
AND
TRUE if inputs occur in left to right order ≥2
m
Reliability Workbench 2–2
16
©2015 Isograph Inc.
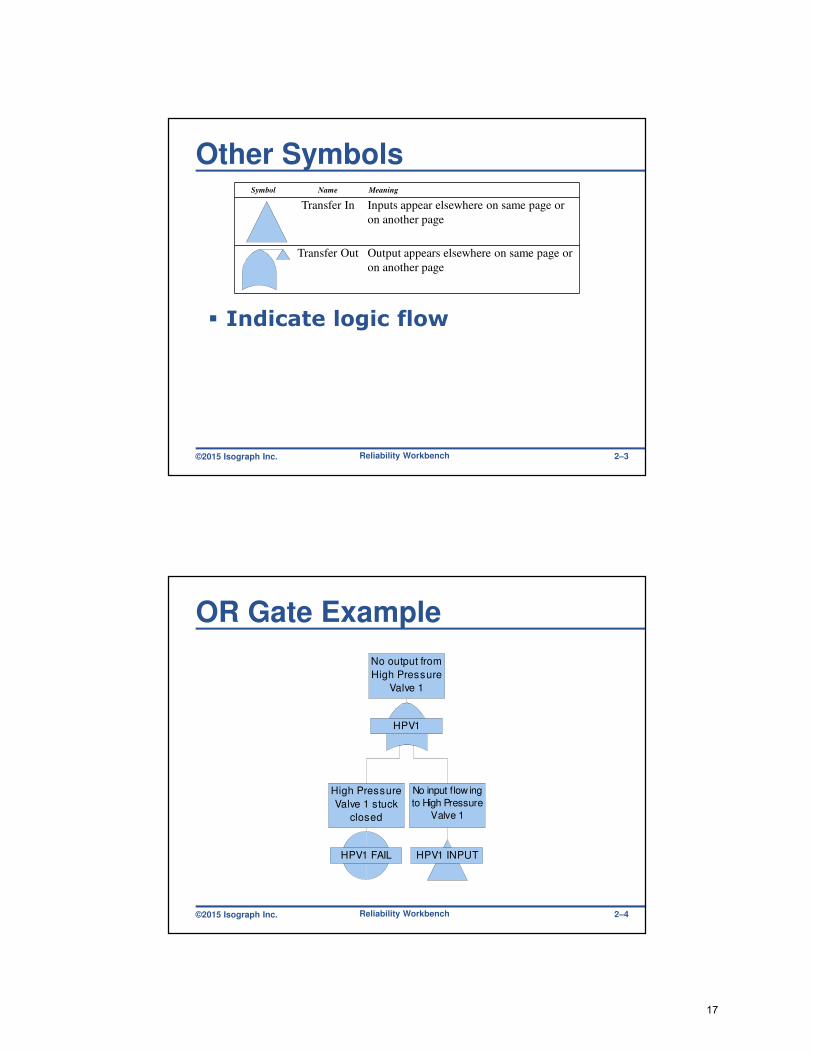
Other Symbols
� Indicate logic flow
Reliability Workbench
Symbol Name Meaning
Transfer In Inputs appear elsewhere on same page or
on another page
Transfer Out Output appears elsewhere on same page or
on another page
2–3
©2015 Isograph Inc.
OR Gate Example
HPV1
No output from
High Pressure
Valve 1
HPV1 INPUT
No input flow ing
to High Pressure
Valve 1
HPV1 FAIL
High Pressure
Valve 1 stuck
closed
Reliability Workbench 2–4
17
©2015 Isograph Inc.
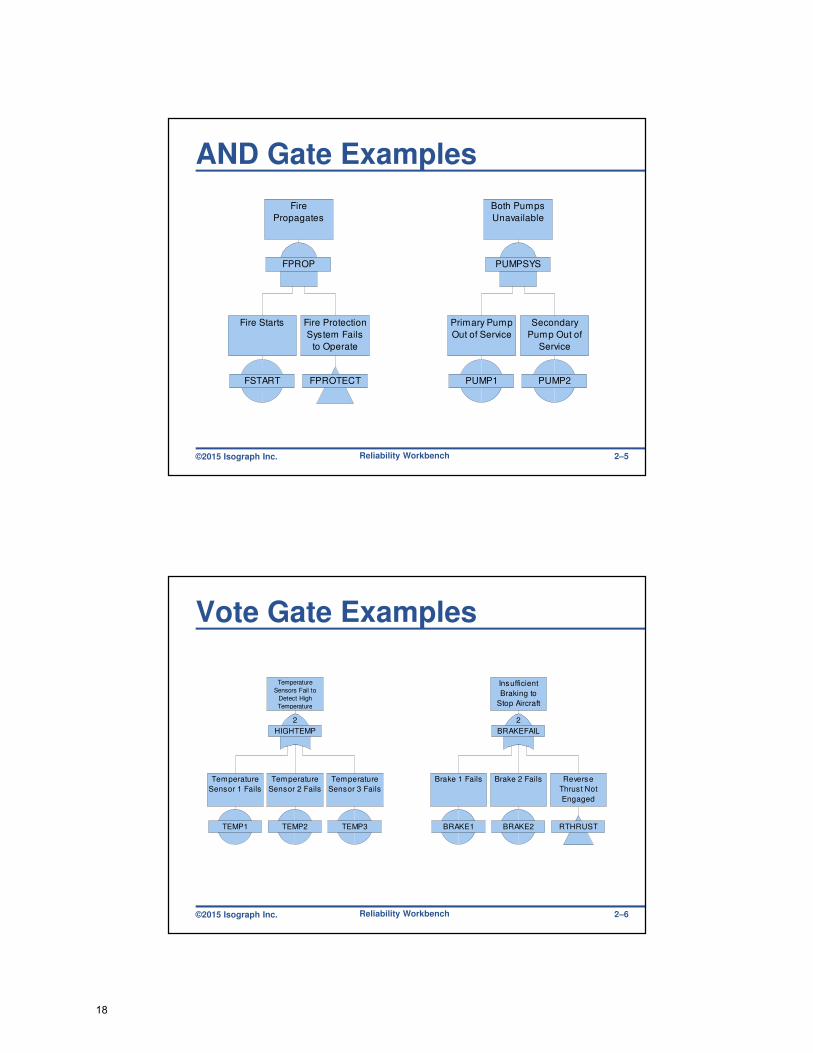
AND Gate Examples
PUMPSYS
Both Pumps
Unavailable
PUMP1
Primary Pump
Out of Service
PUMP2
Secondary
Pump Out of
Service
FPROP
Fire
Propagates
FPROTECT
Fire Protection
System Fails
to Operate
FSTART
Fire Starts
Reliability Workbench 2–5
©2015 Isograph Inc.
Vote Gate Examples
HIGHTEMP
2
Temperature
Sensors Fail to
Detect High
Temperature
TEMP1
Temperature
Sensor 1 Fails
TEMP2
Temperature
Sensor 2 Fails
TEMP3
Temperature
Sensor 3 Fails
BRAKEFAIL
2
Insufficient
Braking to
Stop Aircraft
RTHRUST
Reverse
Thrust Not
Engaged
BRAKE1
Brake 1 Fails
BRAKE2
Brake 2 Fails
Reliability Workbench 2–6
18
©2015 Isograph Inc.
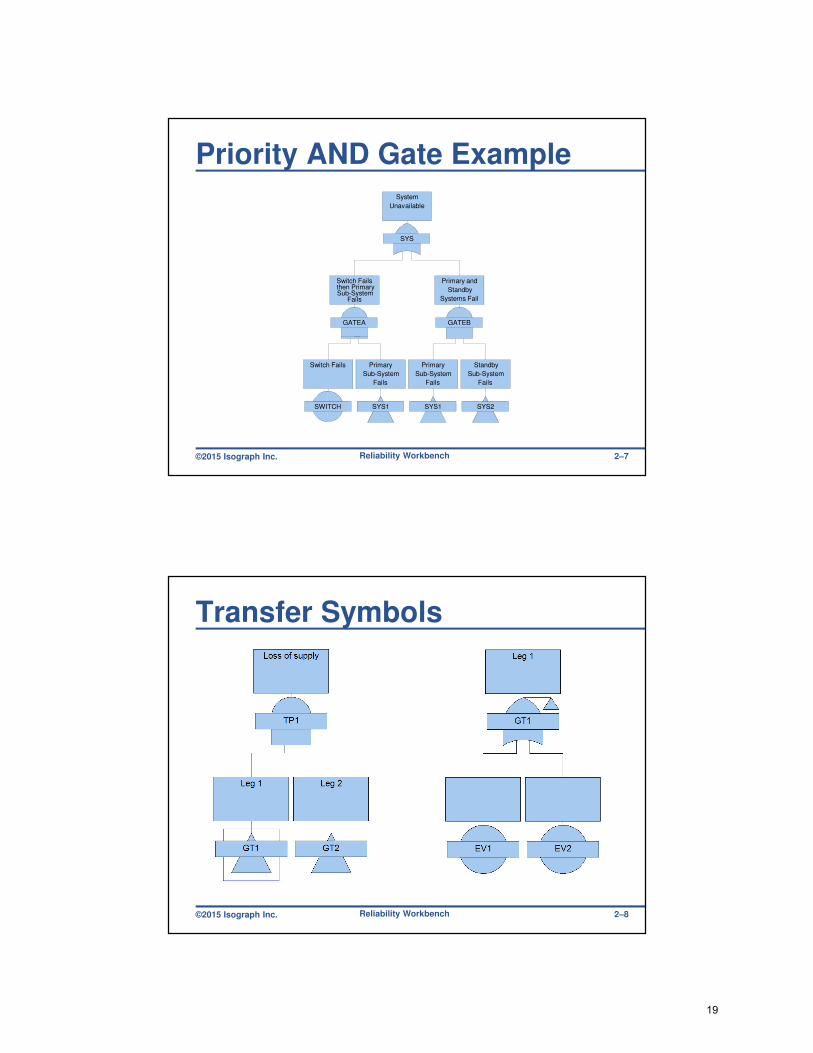
Priority AND Gate Example
SYS
System
Unavailable
GATEA
Switch Failsthen PrimarySub-System
Fails
GATEB
Primary and
Standby
Systems Fail
SYS1
Primary
Sub-System
Fails
SWITCH
Switch Fails
SYS1
Primary
Sub-System
Fails
SYS2
Standby
Sub-System
Fails
Reliability Workbench 2–7
©2015 Isograph Inc.
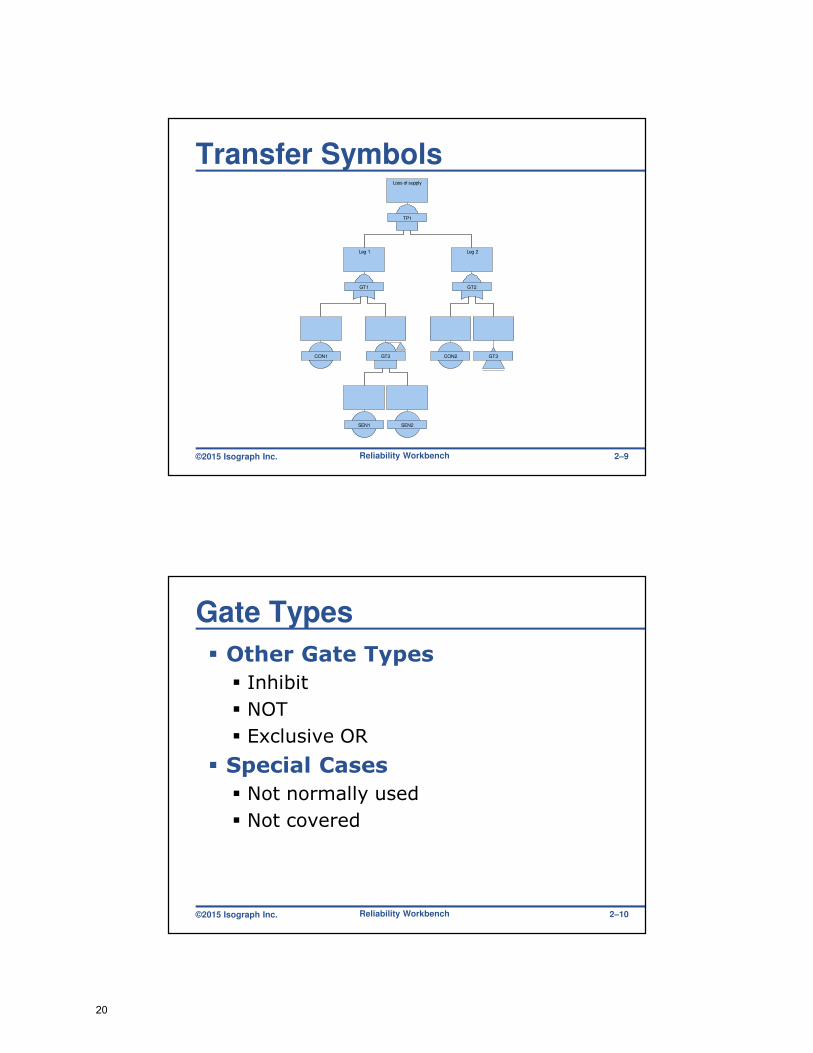
Transfer Symbols
Reliability Workbench 2–8
19
©2015 Isograph Inc.
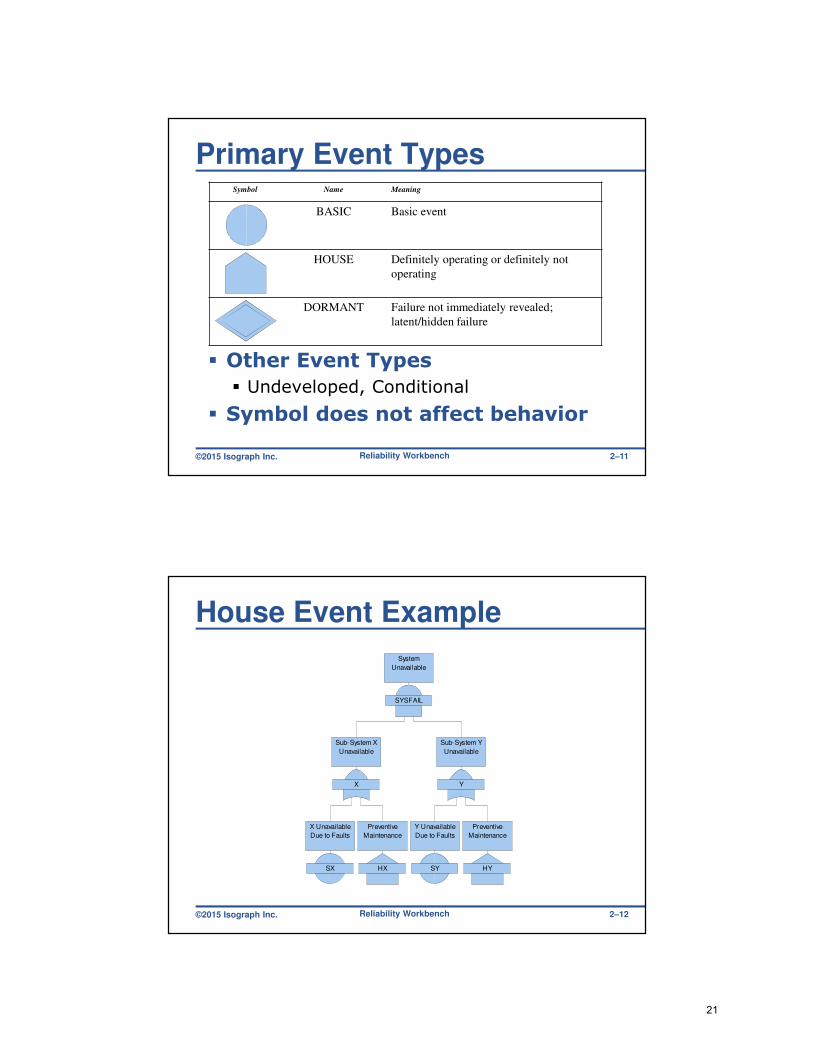
Transfer Symbols
Reliability Workbench
TP1
Loss of supply
GT1
Leg 1
GT2
Leg 2
GT3CON1 GT3CON2
SEN1 SEN2
2–9
©2015 Isograph Inc.
Gate Types
� Other Gate Types
� Inhibit
� NOT
� Exclusive OR
� Special Cases
� Not normally used
� Not covered
Reliability Workbench 2–10
20
©2015 Isograph Inc.
Primary Event Types
� Other Event Types
� Undeveloped, Conditional
� Symbol does not affect behavior
Reliability Workbench
Symbol Name Meaning
BASIC Basic event
HOUSE Definitely operating or definitely not
operating
DORMANT Failure not immediately revealed;
latent/hidden failure
2–11
©2015 Isograph Inc.
House Event Example
SYSFAIL
System
Unavailable
X
Sub-System X
Unavailable
Y
Sub-System Y
Unavailable
SX
X Unavailable
Due to Faults
HX
Preventive
Maintenance
SY
Y Unavailable
Due to Faults
HY
Preventive
Maintenance
Reliability Workbench 2–12
21
©2015 Isograph Inc.
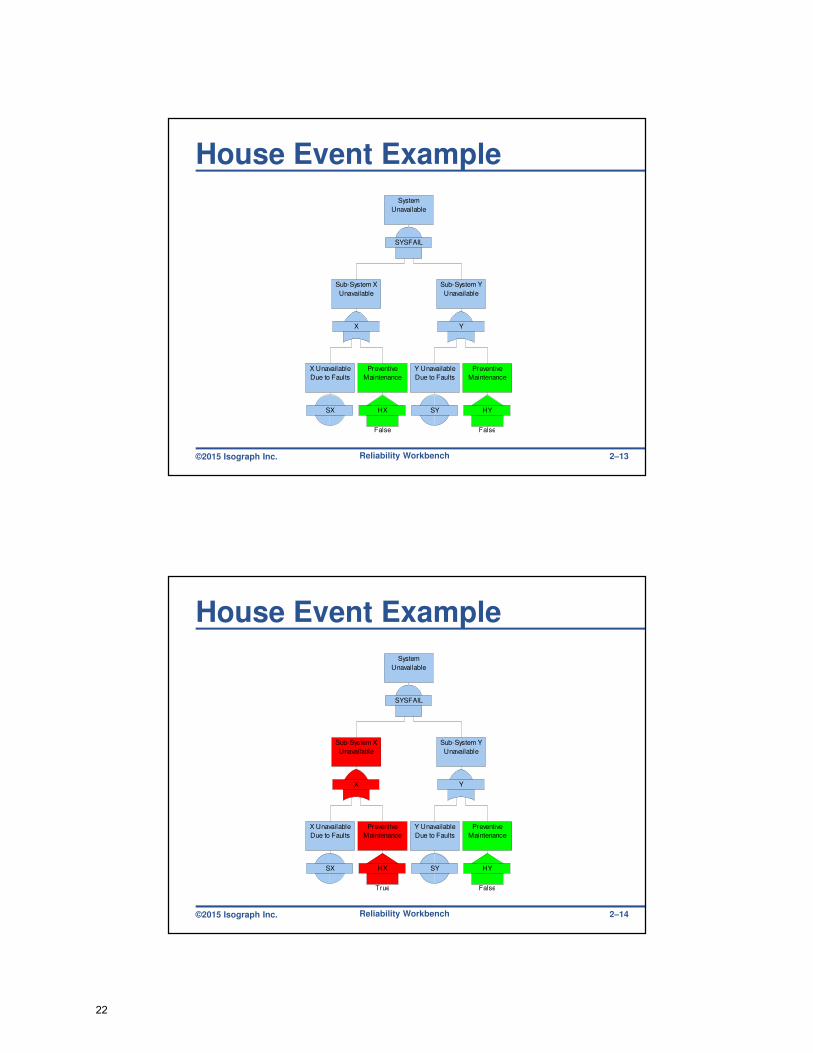
House Event Example
SYSFAIL
System
Unavailable
X
Sub-System X
Unavailable
Y
Sub-System Y
Unavailable
SX
X Unavailable
Due to Faults
HX
Preventive
Maintenance
False
SY
Y Unavailable
Due to Faults
HY
Preventive
Maintenance
False
Reliability Workbench 2–13
©2015 Isograph Inc.
House Event Example
SYSFAIL
System
Unavailable
X
Sub-System X
Unavailable
Y
Sub-System Y
Unavailable
SX
X Unavailable
Due to Faults
HX
Preventive
Maintenance
True
SY
Y Unavailable
Due to Faults
HY
Preventive
Maintenance
False
Reliability Workbench 2–14
22

©2015 Isograph Inc.
System & Component Events
� System Events
� Failures not directly associated with a single component
� Component Events
� Failures entirely associated with a given component
Reliability Workbench 2–15
©2015 Isograph Inc.
Component Events
COMPONENT
UNAVAILABLE
PRIMARY
FAILURE
COMMAND
FAULT
Reliability Workbench 2–16
23

©2015 Isograph Inc.
Construction Guidelines
� Define system bounds
� Identify TOP event(s)
� Identify immediate causes using top-down approach
� Continue to identify immediate causes through intermediate levels of complexity
Reliability Workbench 2–17
©2015 Isograph Inc.
Construction Guidelines (cont.)
� Terminate roots with primary events
� Identify distinct causes
� Always provide complete descriptions
� Use distinctive names
Reliability Workbench 2–18
24
©2015 Isograph Inc.
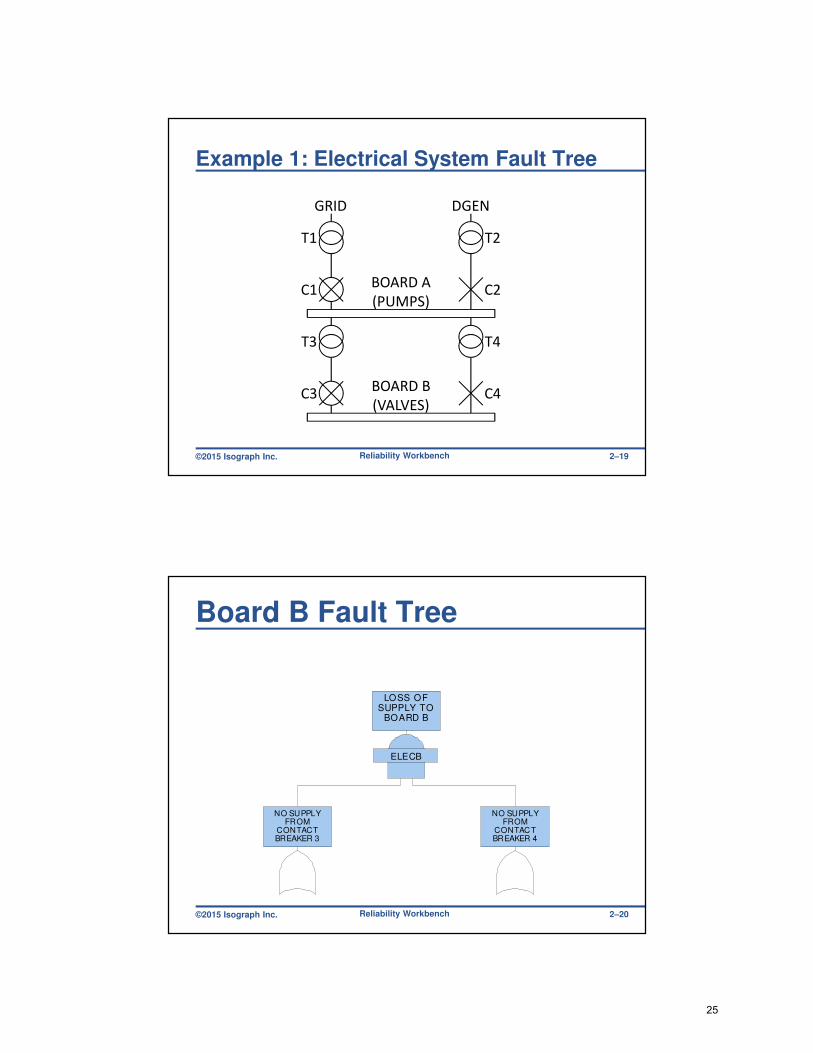
Example 1: Electrical System Fault Tree
GRID DGEN
BOARD A
(PUMPS)
BOARD B
(VALVES)
T1
C1
T2
C2
T3
C3
T4
C4
Reliability Workbench 2–19
©2015 Isograph Inc.
Board B Fault Tree
ELECB
LOSS OFSUPPLY TO
BOARD B
NO SUPPLYFROM
CONTACTBREAKER 3
NO SUPPLYFROM
CONTACTBREAKER 4
Reliability Workbench 2–20
25

©2015 Isograph Inc.
Board B Fault Tree
GATE1
NO SUPPLYFROM
CONTACTBREAKER 3
GATE3
NO SUPPLYFROM
TRANSFORMER3
C3
CONTACTBREAKER 3
FAILURE
Reliability Workbench 2–21
©2015 Isograph Inc.
Board B Fault Tree
GATE1
NO SUPPLYFROM
CONTACTBREAKER 3
GATE3
NO SUPPLYFROM
TRANSFORMER3
C3
CONTACTBREAKER 3
FAILURE
ELECA
LOSS OFSUPPLY TO
BOARD A
T3
TRANSFORMER3 FAILURE
Reliability Workbench 2–22
26
©2015 Isograph Inc.
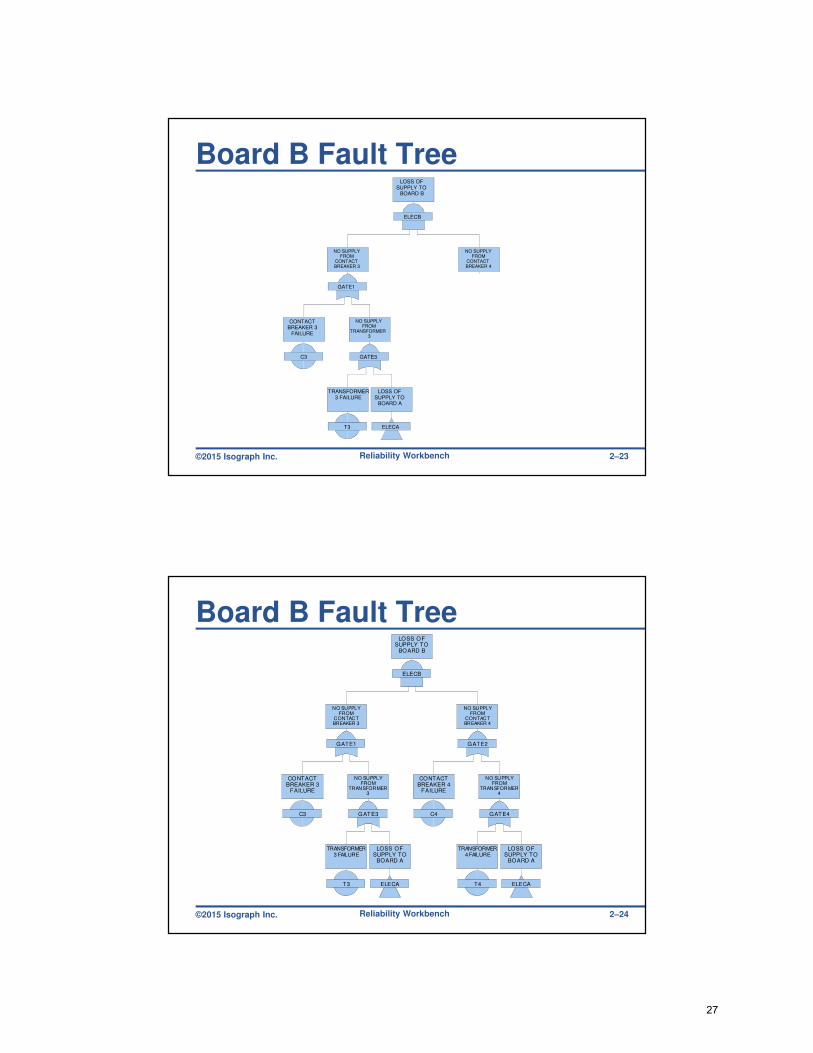
Board B Fault Tree
ELECB
LOSS OFSUPPLY TO
BOARD B
GATE1
NO SUPPLYFROM
CONTACTBREAKER 3
NO SUPPLYFROM
CONTACTBREAKER 4
GATE3
NO SUPPLYFROM
TRANSFORMER3
C3
CONTACTBREAKER 3
FAILURE
ELECA
LOSS OFSUPPLY TO
BOARD A
T3
TRANSFORMER3 FAILURE
Reliability Workbench 2–23
©2015 Isograph Inc.
Board B Fault Tree
ELECB
LOSS OFSUPPLY TO
BOARD B
GATE1
NO SUPPLYFROM
CONTACTBREAKER 3
GATE2
NO SUPPLYFROM
CONTACTBREAKER 4
GATE3
NO SUPPLYFROM
TRANSFORMER3
C3
CONTACTBREAKER 3
FAILURE
GATE4
NO SUPPLYFROM
TRANSFORMER4
C4
CONTACTBREAKER 4
FAILURE
ELECA
LOSS OFSUPPLY TO
BOARD A
T3
TRANSFORMER3 FAILURE
ELECA
LOSS OFSUPPLY TO
BOARD A
T4
TRANSFORMER4 FAILURE
Reliability Workbench 2–24
27

©2015 Isograph Inc.
Board A Fault Tree
ELECA
LOSS OFSUPPLY TO
BOARD A
NO SUPPLYFROM
CONTACTBREAKER 1
NO SUPPLYFROM
CONTACTBREAKER 2
Reliability Workbench 2–25
©2015 Isograph Inc.
Board A Fault Tree
GATE6
NO SUPPLYFROM
CONTACTBREAKER 1
GATE8
NO SUPPLYFROM
TRANSFORMER1
C1
CONTACTBREAKER 1
FAILURE
Reliability Workbench 2–26
28

©2015 Isograph Inc.
Board A Fault Tree
GATE6
NO SUPPLYFROM
CONTACTBREAKER 1
GATE8
NO SUPPLYFROM
TRANSFORMER1
C1
CONTACTBREAKER 1
FAILURE
T1
TRANSFORMER1 FAILURE
GRID
GRIDUNAVAILABLE
Reliability Workbench 2–27
©2015 Isograph Inc.
Board A Fault Tree
ELECA
LOSS OFSUPPLY TO
BOARD A
GATE6
NO SUPPLYFROM
CONTACTBREAKER 1
NO SUPPLYFROM
CONTACTBREAKER 2
GATE8
NO SUPPLYFROM
TRANSFORMER1
C1
CONTACTBREAKER 1
FAILURE
T1
TRANSFORMER1 FAILURE
GRID
GRIDUNAVAILABLE
Reliability Workbench 2–28
29
©2015 Isograph Inc.
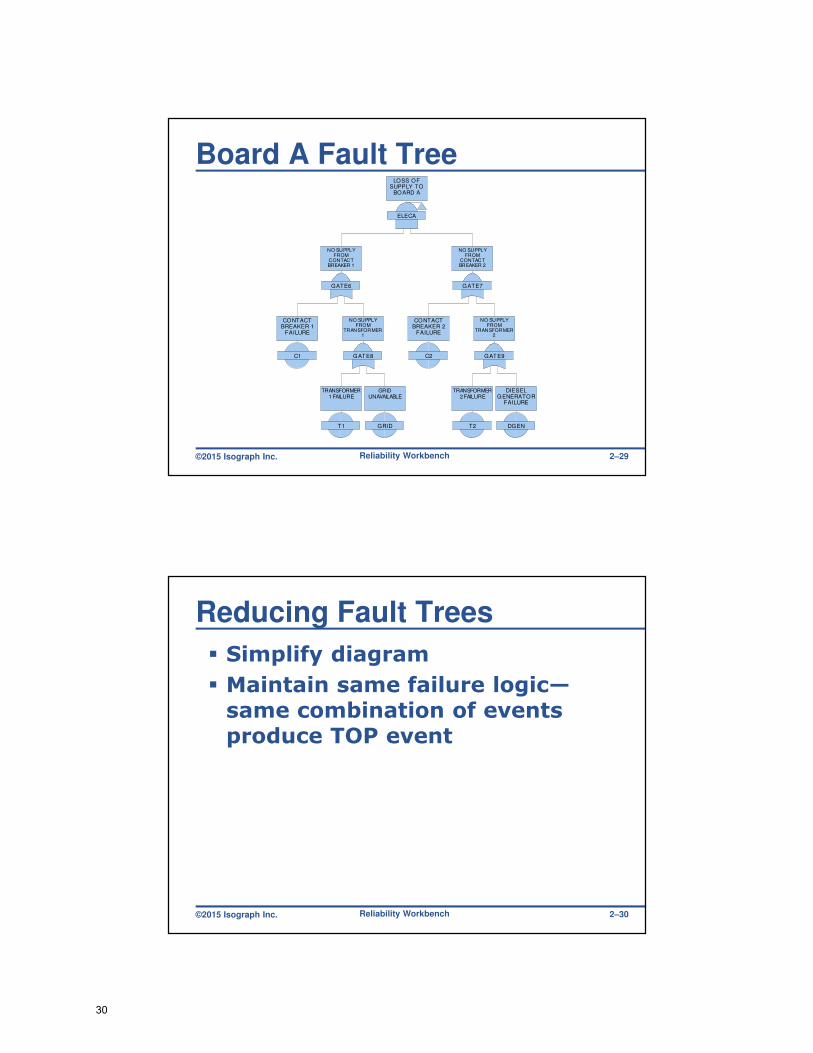
Board A Fault Tree
ELECA
LOSS OFSUPPLY TO
BOARD A
GATE6
NO SUPPLYFROM
CONTACTBREAKER 1
GATE7
NO SUPPLYFROM
CONTACTBREAKER 2
GATE8
NO SUPPLYFROM
TRANSFORMER1
C1
CONTACTBREAKER 1
FAILURE
GATE9
NO SUPPLYFROM
TRANSFORMER2
C2
CONTACTBREAKER 2
FAILURE
T1
TRANSFORMER1 FAILURE
GRID
GRIDUNAVAILABLE
T2
TRANSFORMER2 FAILURE
DGEN
DIESELGENERATOR
FAILURE
Reliability Workbench 2–29
©2015 Isograph Inc.
Reducing Fault Trees
� Simplify diagram
� Maintain same failure logic—same combination of events produce TOP event
Reliability Workbench 2–30
30

©2015 Isograph Inc.
Reducing Fault Trees
� Linked OR gates can become single OR gate
= TOP1
EVENT1 EVENT2 EVENT3 EVENT4
TOP1
GATE1E VENT 1
GATE2EVENT 2
EVENT3 EVENT4
Reliability Workbench 2–31
©2015 Isograph Inc.
Reducing Fault Trees� Common failures under each branch of an
AND gate can sometimes be simplified
TOP1
GATE1 GATE2
EVENT1 COMMON EVENT2 COMMON
=
TOP1
GATE1 COMMON
EVENT1 EVENT2
Reliability Workbench 2–32
31
©2015 Isograph Inc.
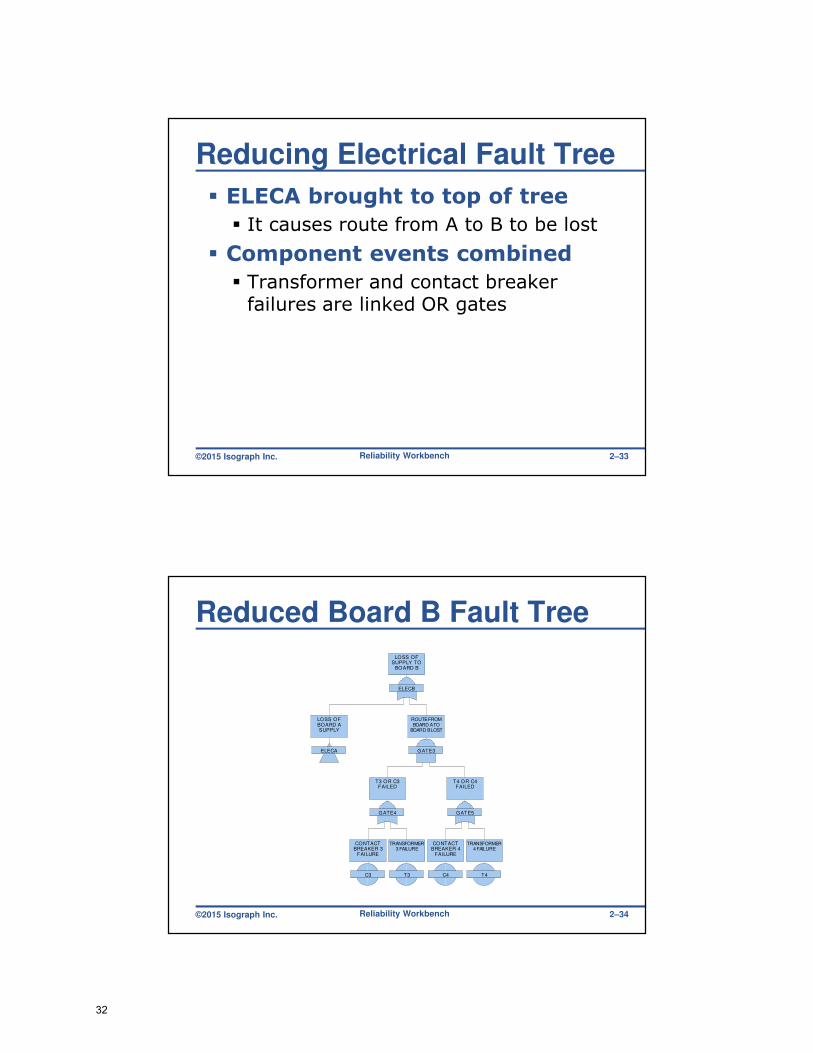
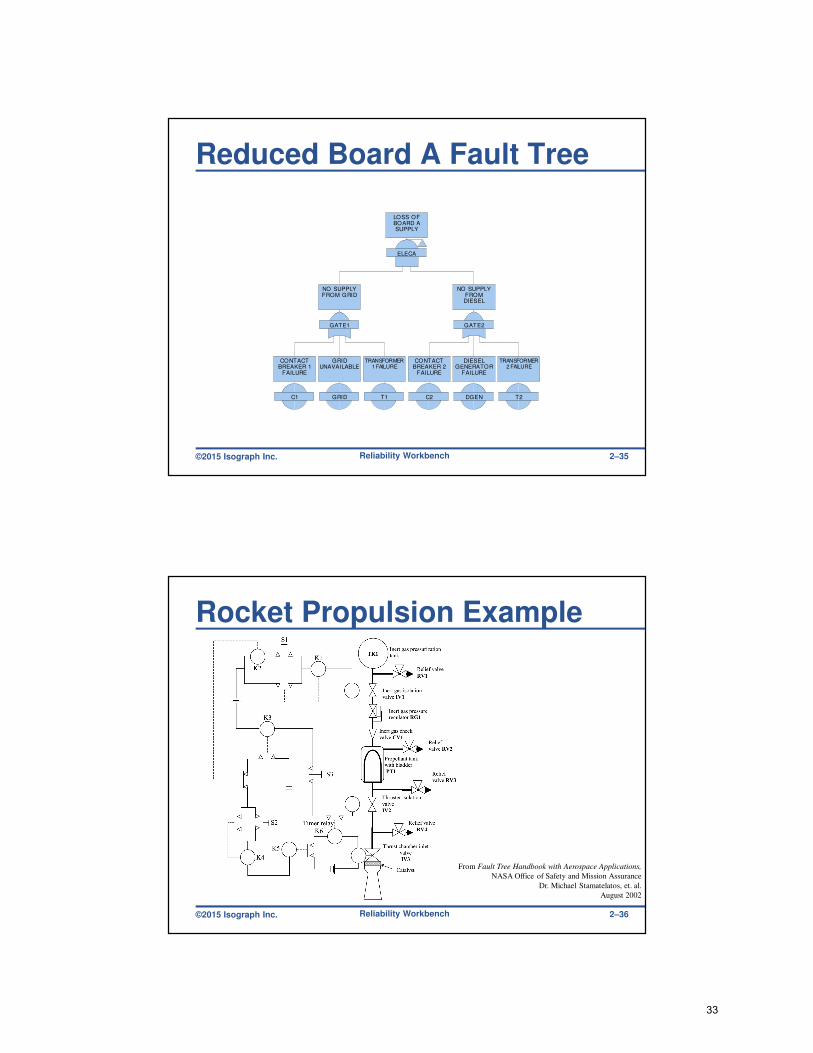
Reducing Electrical Fault Tree
� ELECA brought to top of tree
� It causes route from A to B to be lost
� Component events combined
� Transformer and contact breaker failures are linked OR gates
Reliability Workbench 2–33
©2015 Isograph Inc.
Reduced Board B Fault Tree
ELECB
LOSS OFSUPPLY TO
BOARD B
ELECA
LOSS OFBOARD ASUPPLY
GATE3
ROUTE FROMBOARD A TO
BOARD B LOST
GATE4
T3 OR C3FAILED
GATE5
T4 OR C4FAILED
C3
CONTACTBREAKER 3
FAILURE
T3
TRANSFORMER3 FAILURE
C4
CONTACTBREAKER 4
FAILURE
T4
TRANSFORMER4 FAILURE
Reliability Workbench 2–34
32
©2015 Isograph Inc.
Reduced Board A Fault Tree
ELECA
LOSS OFBOARD ASUPPLY
GATE1
NO SUPPLYFROM GRID
GATE2
NO SUPPLYFROMDIESEL
C1
CONTACTBREAKER 1
FAILURE
GRID
GRIDUNAVAILABLE
T1
TRANSFORMER1 FAILURE
C2
CONTACTBREAKER 2
FAILURE
DGEN
DIESELGENERATOR
FAILURE
T2
TRANSFORMER2 FAILURE
Reliability Workbench 2–35
©2015 Isograph Inc.
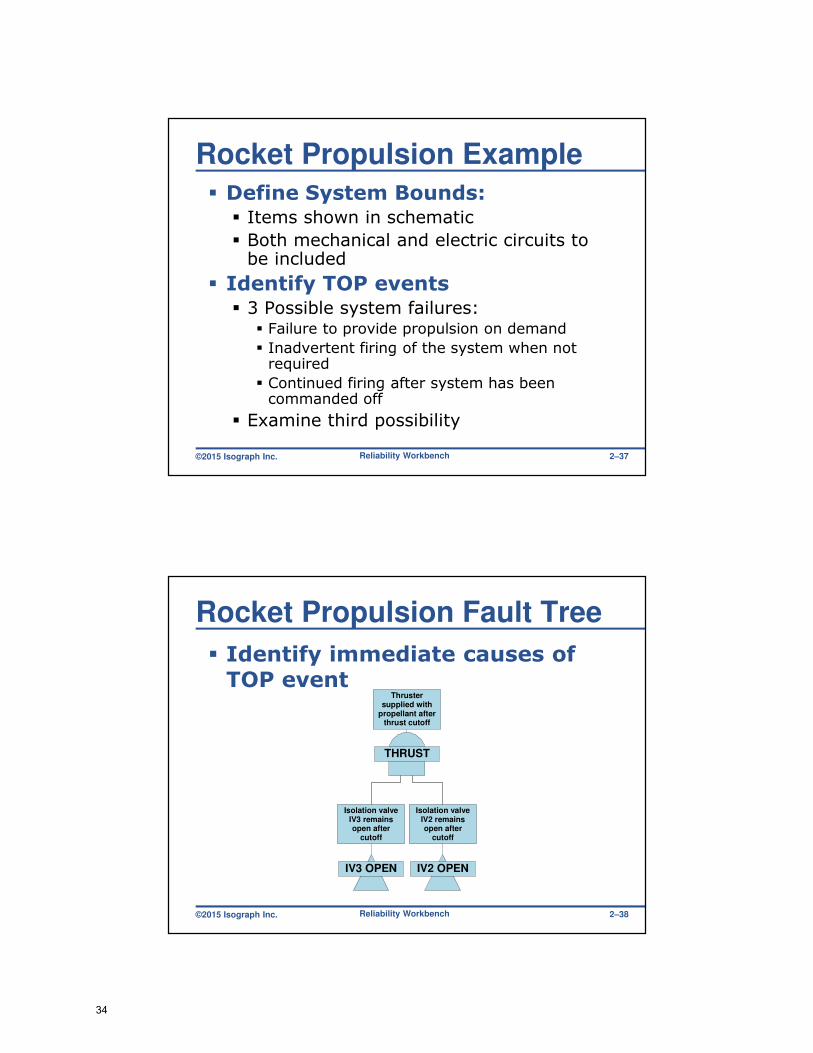
Rocket Propulsion Example
Reliability Workbench
From Fault Tree Handbook with Aerospace Applications,
NASA Office of Safety and Mission Assurance
Dr. Michael Stamatelatos, et. al.
August 2002
2–36
33
©2015 Isograph Inc.
Rocket Propulsion Example
� Define System Bounds:� Items shown in schematic
� Both mechanical and electric circuits to be included
� Identify TOP events� 3 Possible system failures:
� Failure to provide propulsion on demand
� Inadvertent firing of the system when not required
� Continued firing after system has been commanded off
� Examine third possibility
Reliability Workbench 2–37
©2015 Isograph Inc.
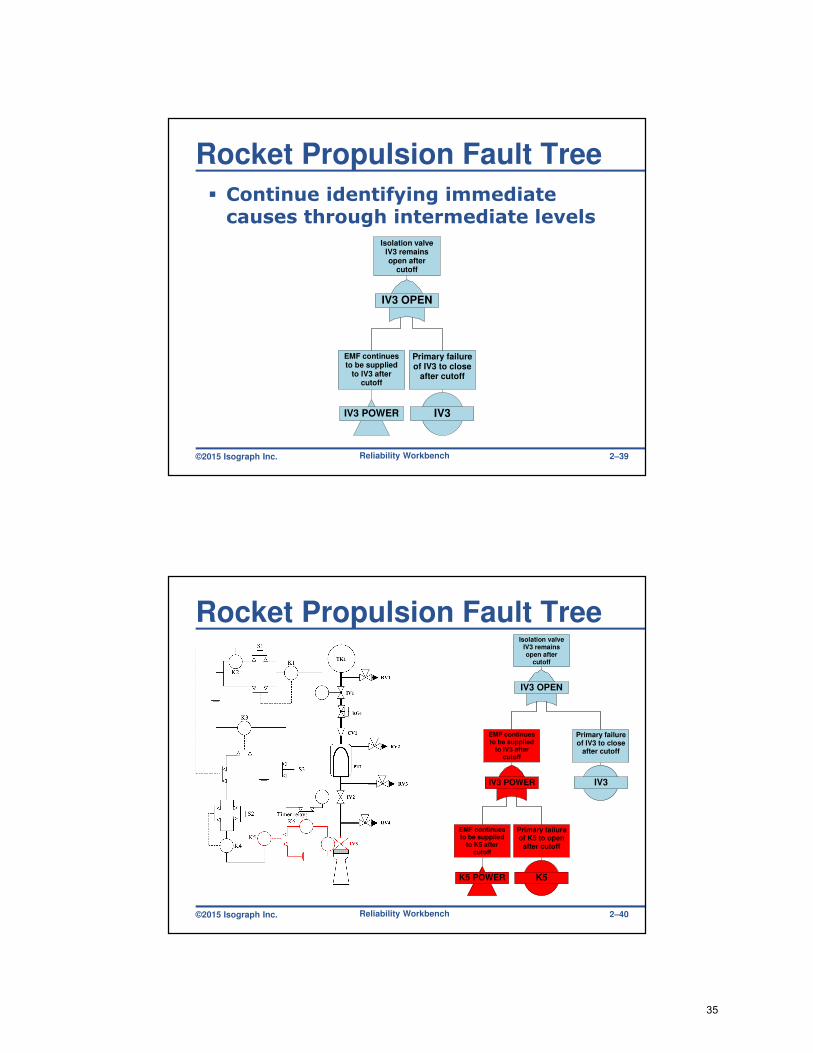
Rocket Propulsion Fault Tree
� Identify immediate causes of TOP event
Reliability Workbench
THRUST
Thrustersupplied with
propellant afterthrust cutoff
IV3 OPEN
Isolation valveIV3 remainsopen after
cutoff
IV2 OPEN
Isolation valveIV2 remainsopen after
cutoff
2–38
34
©2015 Isograph Inc.
Rocket Propulsion Fault Tree
� Continue identifying immediate causes through intermediate levels
Reliability Workbench
IV3 OPEN
Isolation valveIV3 remainsopen after
cutoff
IV3 POWER
EMF continuesto be supplied
to IV3 aftercutoff
IV3
Primary failureof IV3 to close
after cutoff
2–39
©2015 Isograph Inc.
Rocket Propulsion Fault Tree
Reliability Workbench
IV3 OPEN
Isolation valveIV3 remainsopen after
cutoff
IV3 POWER
EMF continuesto be supplied
to IV3 aftercutoff
IV3
Primary failureof IV3 to close
after cutoff
K5 POWER
EMF continuesto be supplied
to K5 aftercutoff
K5
Primary failureof K5 to open
after cutoff
2–40
35
©2015 Isograph Inc.
Rocket Propulsion Fault Tree
Reliability Workbench
IV3 OPEN
Isolation valveIV3 remainsopen after
cutoff
IV3 POWER
EMF continuesto be supplied
to IV3 aftercutoff
IV3
Primary failureof IV3 to close
after cutoff
K5 POWER
EMF continuesto be supplied
to K5 aftercutoff
K5
Primary failureof K5 to open
after cutoff
K3 POWER
EMF continuesto be supplied
to K3 aftercutoff
K3
Primary failureof K3 to open
after cutoff
2–41
©2015 Isograph Inc.
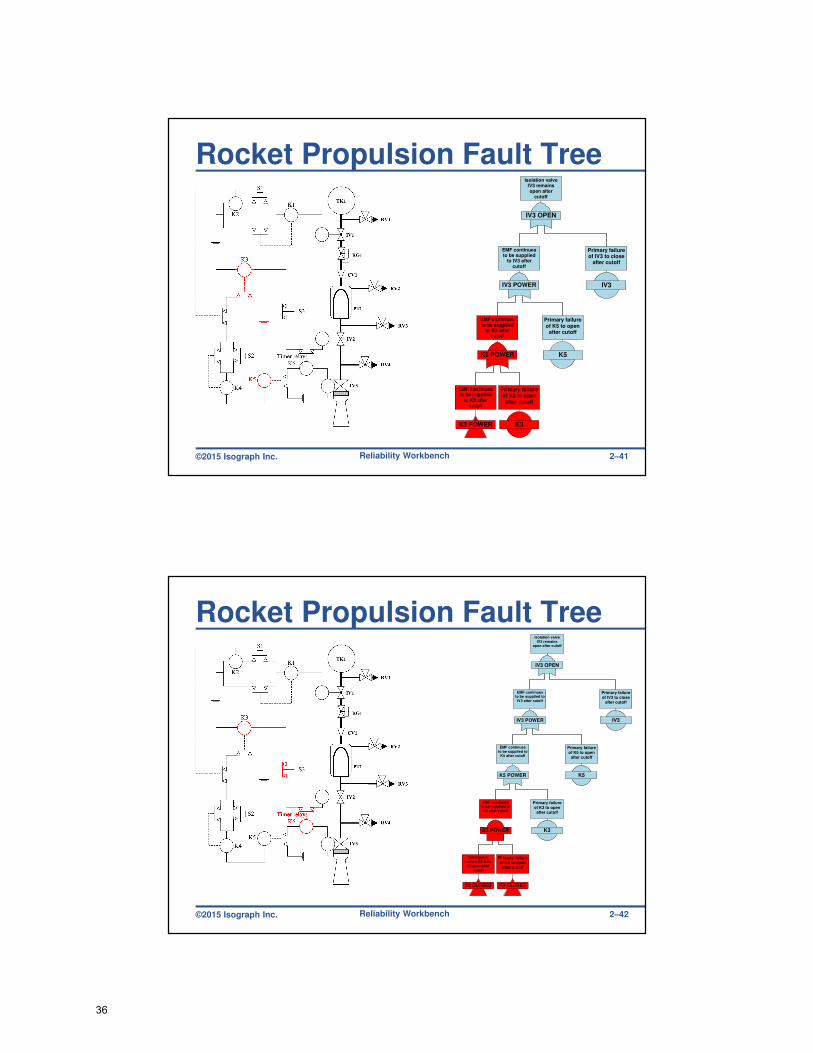
Rocket Propulsion Fault Tree
Reliability Workbench
IV3 OPEN
Isolation valveIV3 remains
open after cutoff
IV3 POWER
EMF continuesto be supplied toIV3 after cutoff
IV3
Primary failureof IV3 to close
after cutoff
K5 POWER
EMF continuesto be supplied to
K5 after cutoff
K5
Primary failureof K5 to open
after cutoff
K3 POWER
EMF continuesto be supplied to
K3 after cutoff
K3
Primary failureof K3 to open
after cutoff
S3 CLOSED
Emergencyswitch S3 failsto open after
cutoff
K6 CLOSED
Primary failureof K6 to open
after cutoff
2–42
36
©2015 Isograph Inc.
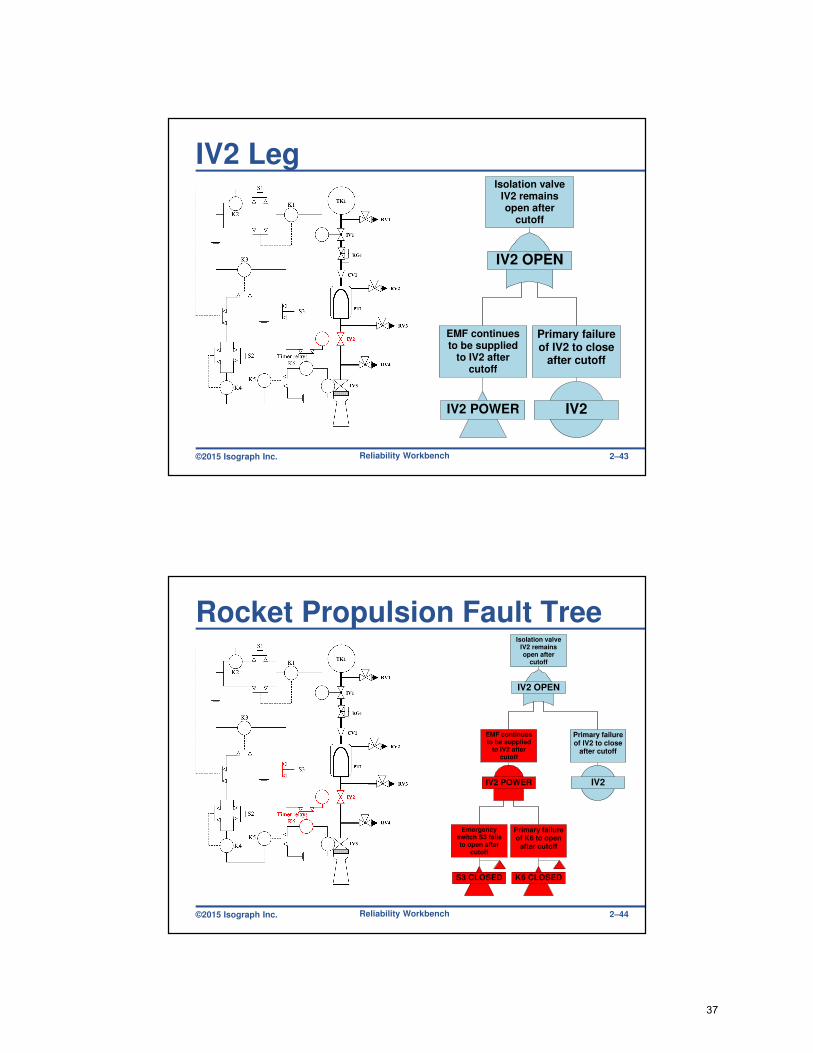
IV2 Leg
Reliability Workbench
IV2 OPEN
Isolation valveIV2 remainsopen after
cutoff
IV2 POWER
EMF continuesto be supplied
to IV2 aftercutoff
IV2
Primary failureof IV2 to close
after cutoff
2–43
©2015 Isograph Inc.
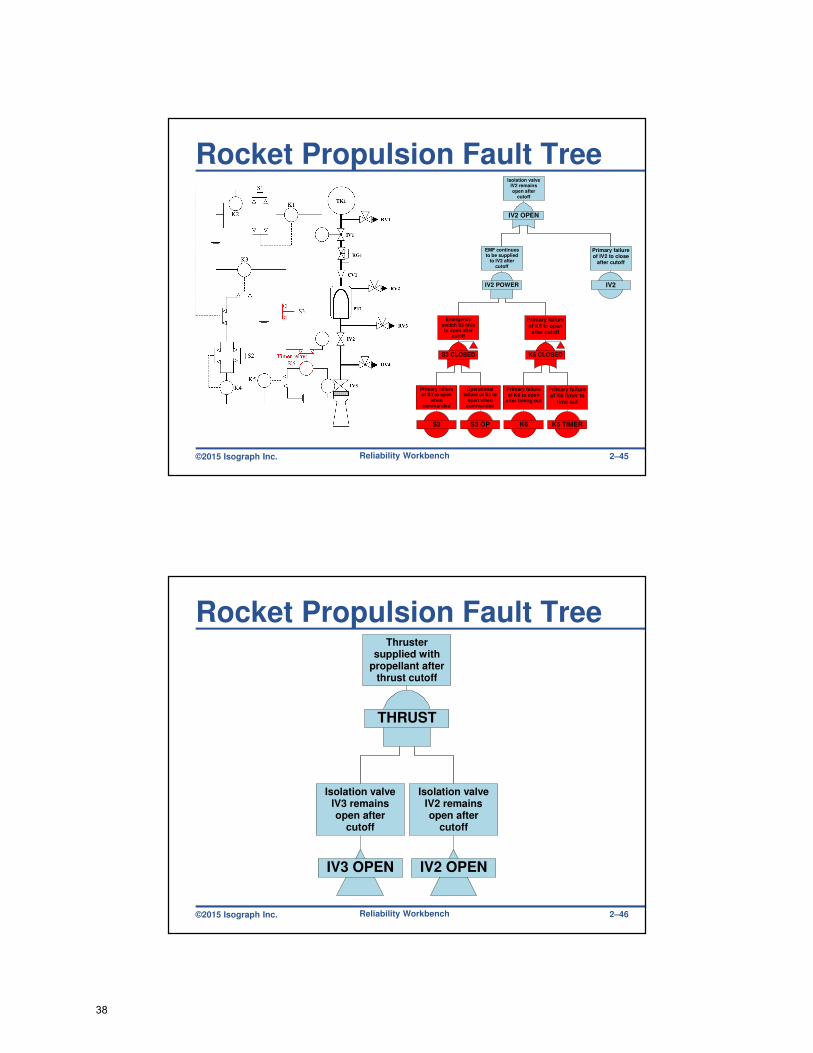
Rocket Propulsion Fault Tree
Reliability Workbench
IV2 OPEN
Isolation valveIV2 remainsopen after
cutoff
IV2 POWER
EMF continuesto be supplied
to IV2 aftercutoff
IV2
Primary failureof IV2 to close
after cutoff
S3 CLOSED
Emergencyswitch S3 failsto open after
cutoff
K6 CLOSED
Primary failureof K6 to open
after cutoff
2–44
37
©2015 Isograph Inc.
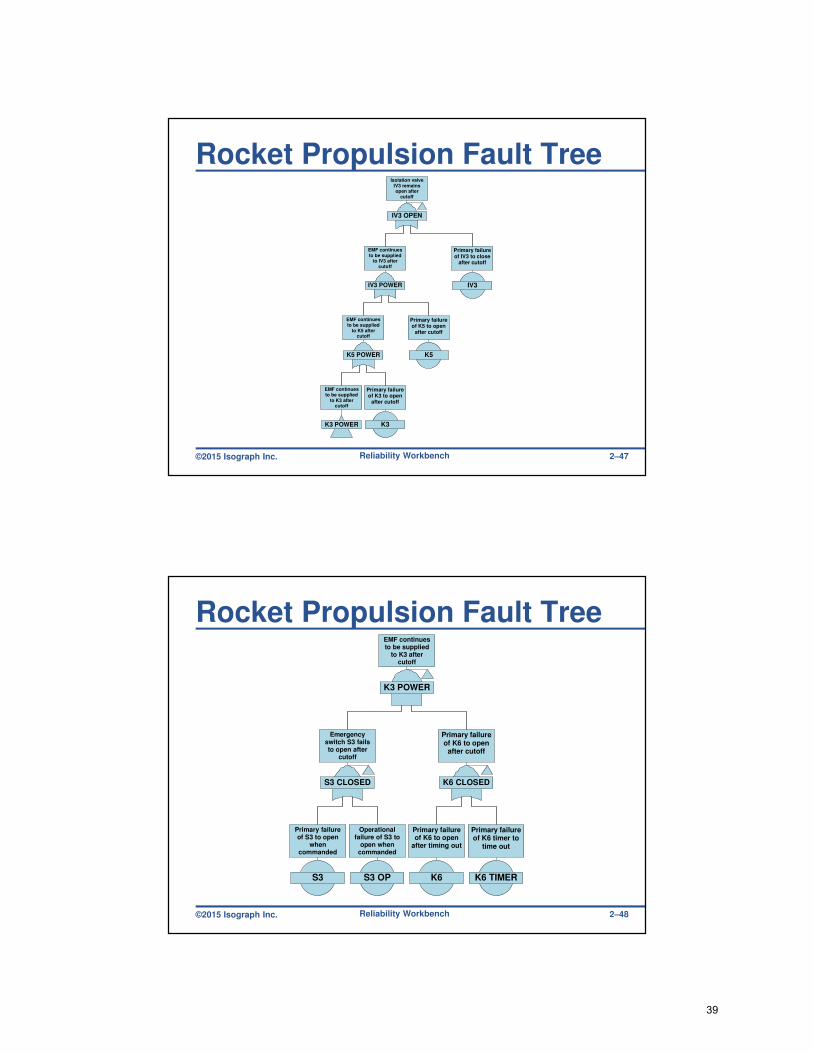
Rocket Propulsion Fault Tree
Reliability Workbench
IV2 OPEN
Isolation valveIV2 remainsopen after
cutoff
IV2 POWER
EMF continuesto be supplied
to IV2 aftercutoff
IV2
Primary failureof IV2 to close
after cutoff
S3 CLOSED
Emergencyswitch S3 failsto open after
cutoff
K6 CLOSED
Primary failureof K6 to open
after cutoff
S3
Primary failureof S3 to open
whencommanded
S3 OP
Operationalfailure of S3 to
open whencommanded
K6
Primary failureof K6 to open
after timing out
K6 TIMER
Primary failureof K6 timer to
time out
2–45
©2015 Isograph Inc.
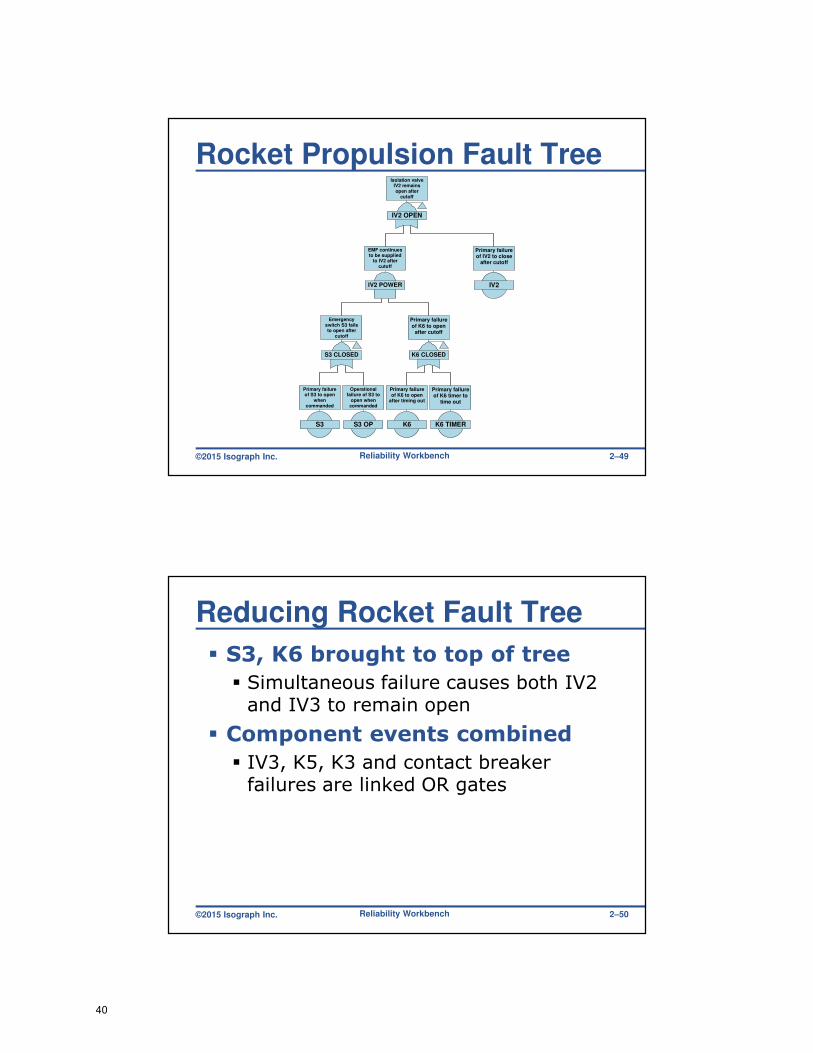
Rocket Propulsion Fault Tree
Reliability Workbench
THRUST
Thrustersupplied with
propellant afterthrust cutoff
IV3 OPEN
Isolation valveIV3 remainsopen after
cutoff
IV2 OPEN
Isolation valveIV2 remainsopen after
cutoff
2–46
38
©2015 Isograph Inc.
Rocket Propulsion Fault Tree
Reliability Workbench
IV3 OPEN
Isolation valveIV3 remainsopen after
cutoff
IV3 POWER
EMF continuesto be supplied
to IV3 aftercutoff
IV3
Primary failureof IV3 to close
after cutoff
K5 POWER
EMF continuesto be supplied
to K5 aftercutoff
K5
Primary failureof K5 to open
after cutoff
K3 POWER
EMF continuesto be supplied
to K3 aftercutoff
K3
Primary failureof K3 to open
after cutoff
2–47
©2015 Isograph Inc.
Rocket Propulsion Fault Tree
Reliability Workbench
K3 POWER
EMF continuesto be supplied
to K3 aftercutoff
S3
Primary failureof S3 to open
whencommanded
S3 OP
Operationalfailure of S3 to
open whencommanded
K6
Primary failureof K6 to open
after timing out
K6 TIMER
Primary failureof K6 timer to
time out
S3 CLOSED
Emergencyswitch S3 failsto open after
cutoff
K6 CLOSED
Primary failureof K6 to open
after cutoff
2–48
39
©2015 Isograph Inc.
Rocket Propulsion Fault Tree
Reliability Workbench
IV2 OPEN
Isolation valveIV2 remainsopen after
cutoff
IV2 POWER
EMF continuesto be supplied
to IV2 aftercutoff
IV2
Primary failureof IV2 to close
after cutoff
S3 CLOSED
Emergencyswitch S3 failsto open after
cutoff
K6 CLOSED
Primary failureof K6 to open
after cutoff
S3
Primary failureof S3 to open
whencommanded
S3 OP
Operationalfailure of S3 to
open whencommanded
K6
Primary failureof K6 to open
after timing out
K6 TIMER
Primary failureof K6 timer to
time out
2–49
©2015 Isograph Inc.
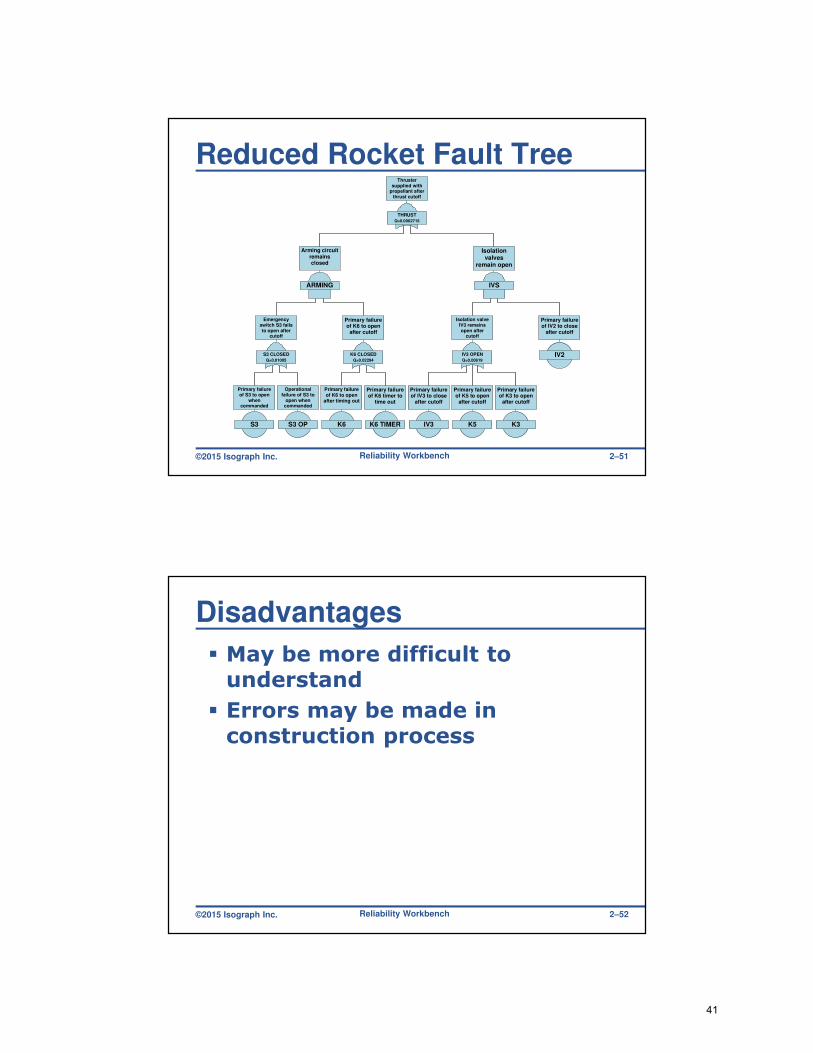
Reducing Rocket Fault Tree
� S3, K6 brought to top of tree
� Simultaneous failure causes both IV2 and IV3 to remain open
� Component events combined
� IV3, K5, K3 and contact breaker failures are linked OR gates
Reliability Workbench 2–50
40
©2015 Isograph Inc.
Reduced Rocket Fault Tree
Reliability Workbench
THRUST
Q=0.0002715
Thrustersupplied with
propellant afterthrust cutoff
ARMING
Arming circuitremainsclosed
IVS
Isolationvalves
remain open
IV3
Primary failureof IV3 to close
after cutoff
K5
Primary failureof K5 to open
after cutoff
K3
Primary failureof K3 to open
after cutoff
S3
Primary failureof S3 to open
whencommanded
S3 OP
Operationalfailure of S3 to
open whencommanded
K6
Primary failureof K6 to open
after timing out
K6 TIMER
Primary failureof K6 timer to
time out
S3 CLOSED
Q=0.01005
Emergencyswitch S3 failsto open after
cutoff
K6 CLOSED
Q=0.02294
Primary failureof K6 to open
after cutoff
IV3 OPEN
Q=0.00619
Isolation valveIV3 remainsopen after
cutoff
IV2
Primary failureof IV2 to close
after cutoff
2–51
©2015 Isograph Inc.
Disadvantages
� May be more difficult to understand
� Errors may be made in construction process
Reliability Workbench 2–52
41

©2015 Isograph Inc.
Workshop 2.1: Chemical Reactor vessel
CON
Input 1 Input 2
Pressure relief
By-productProduct
MV1 MV2
EV1 EV2
TS
PS
NRV
ALARM
OP
Reliability Workbench 2–53
©2015 Isograph Inc.
Workshop 2.1
� TOP event – Fails to stop rupture
� Base events:
Reliability Workbench
Name Description Name Description
EV1 Electrical valve 1 failure TS1 Temperature sensor failure
EV2 Electrical valve 2 failure PS1 Pressure sensor failure
MV1 Manual valve 1 stuck open ALARM Alarm unit failure
MV2 Manual valve 2 stuck open NRV Pressure relief valve failure
CON Controller failure GRID No electrical supply from the grid
OP Operator Unavailable
2–54
42

©2015 Isograph Inc.
Name Description Name Description
EV1 Electrical valve 1 failure TS1 Temperature sensor failure
EV2 Electrical valve 2 failure PS1 Pressure sensor failure
MV1 Manual valve 1 stuck open ALARM Alarm unit failure
MV2 Manual valve 2 stuck open NRV Pressure relief valve failure
CON Controller failure GRID No electrical supply from the grid
OP Operator Unavailable
CON
Input 1 Input 2
Pressure relief
By-productProduct
MV1 MV2
EV1 EV2
TS
PS
NRV
ALARM
OP
Workshop 2.1
Reliability Workbench 2–55
©2015 Isograph Inc.
Workshop 2.1 Solution
G0
FAILS TO
STOP
RUPTURE
G1
FAILS TO
SHUT DOWN
BOTH INPUTS
NRV
VALVE STUCK
CLOSED
G2
INPUT 1 NOT
SHUT DOWN
G3
INPUT 2 NOT
SHUT DOWN
Reliability Workbench 2–56
43
©2015 Isograph Inc.
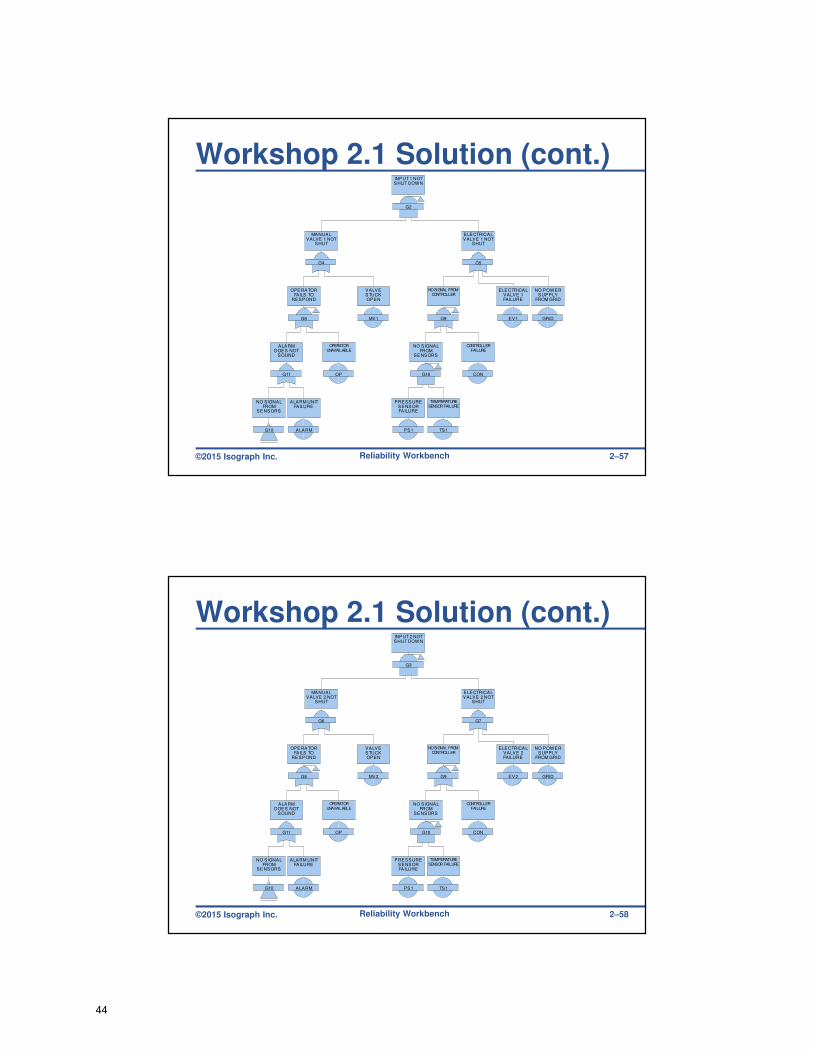
Workshop 2.1 Solution (cont.)
G2
INPUT 1 NOTSHUT DOWN
G4
MANUALVALVE 1 NOT
SHUT
G5
ELECTRICALVALVE 1 NOT
SHUT
G8
OPERATORFAILS TO
RESPOND
MV1
VALVESTUCKOPEN
G9
NO SIGNAL FROMCONTROLLER
EV1
ELECTRICALVALVE 1FAILURE
GRID
NO POWERSUPPLY
FROM GRID
G11
ALARMDOES NOT
SOUND
OP
OPERATORUNAVAILABLE
G10
NO SIGNALFROM
SENSORS
CON
CONTROLLERFAILURE
PS1
PRESSURESENSORFAILURE
TS1
TEMPERATURESENSOR FAILURE
G10
NO SIGNALFROM
SENSORS
ALARM
ALARM UNITFAILURE
Reliability Workbench 2–57
©2015 Isograph Inc.
Workshop 2.1 Solution (cont.)
G3
INPUT 2 NOTSHUT DOWN
G6
MANUALVALVE 2 NOT
SHUT
G7
ELECTRICALVALVE 2 NOT
SHUT
G8
OPERATORFAILS TO
RESPOND
MV2
VALVESTUCKOPEN
G9
NO SIGNAL FROMCONTROLLER
EV2
ELECTRICALVALVE 2FAILURE
GRID
NO POWERSUPPLY
FROM GRID
G11
ALARMDOES NOT
SOUND
OP
OPERATORUNAVAILABLE
G10
NO SIGNALFROM
SENSORS
CON
CONTROLLERFAILURE
PS1
PRESSURESENSORFAILURE
TS1
TEMPERATURESENSOR FAILURE
G10
NO SIGNALFROM
SENSORS
ALARM
ALARM UNITFAILURE
Reliability Workbench 2–58
44
©2015 Isograph Inc.
End of Chapter 2
� Summary
� Gate symbols
� Event symbols
� Construction guidelines
Reliability Workbench 2–59
45
©2015 Isograph Inc.
Minimal Cut SetsChapter 3
Reliability Workbench 3–1
©2015 Isograph Inc.
Minimal Cut Sets
� First step of Analysis
� Minimum combinations of events which cause TOP event
� Produced using Boolean algebra
� Quantitative data not required
Reliability Workbench 3–2
46
©2015 Isograph Inc.
Boolean Algebra Techniques
� Represent gates with equivalent Boolean expression
� Variables represent inputs
Reliability Workbench 3–3
©2015 Isograph Inc.
Boolean Algebra Operators
EventX·EventY
· symbol represents AND logic
EventX + EventY
+ symbol represents OR logic
Reliability Workbench 3–4
47

©2015 Isograph Inc.
AND gate
� TOP1 = A · B
� 3 inputs: TOP1 = A · B · C
Reliability Workbench
TOP1
A B
3–5
©2015 Isograph Inc.
OR gate
� TOP1 = A + B
� 3 inputs: TOP1 = A + B + C
TOP1
A B
Reliability Workbench 3–6
48
©2015 Isograph Inc.
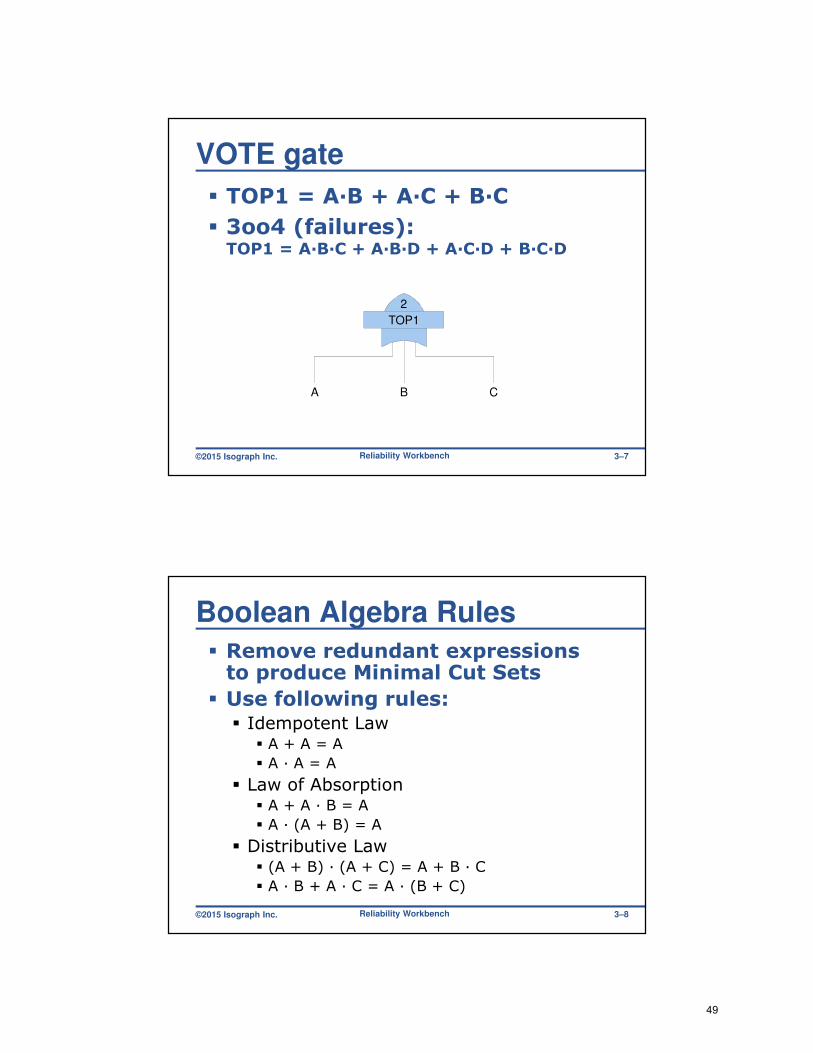
VOTE gate
� TOP1 = A·B + A·C + B·C
� 3oo4 (failures): TOP1 = A·B·C + A·B·D + A·C·D + B·C·D
TOP1
2
A B C
Reliability Workbench 3–7
©2015 Isograph Inc.
Boolean Algebra Rules
� Remove redundant expressions to produce Minimal Cut Sets
� Use following rules:� Idempotent Law
� A + A = A
� A ∙ A = A
� Law of Absorption� A + A ∙ B = A
� A ∙ (A + B) = A
� Distributive Law� (A + B) ∙ (A + C) = A + B ∙ C
� A · B + A · C = A · (B + C)
Reliability Workbench 3–8
49
©2015 Isograph Inc.
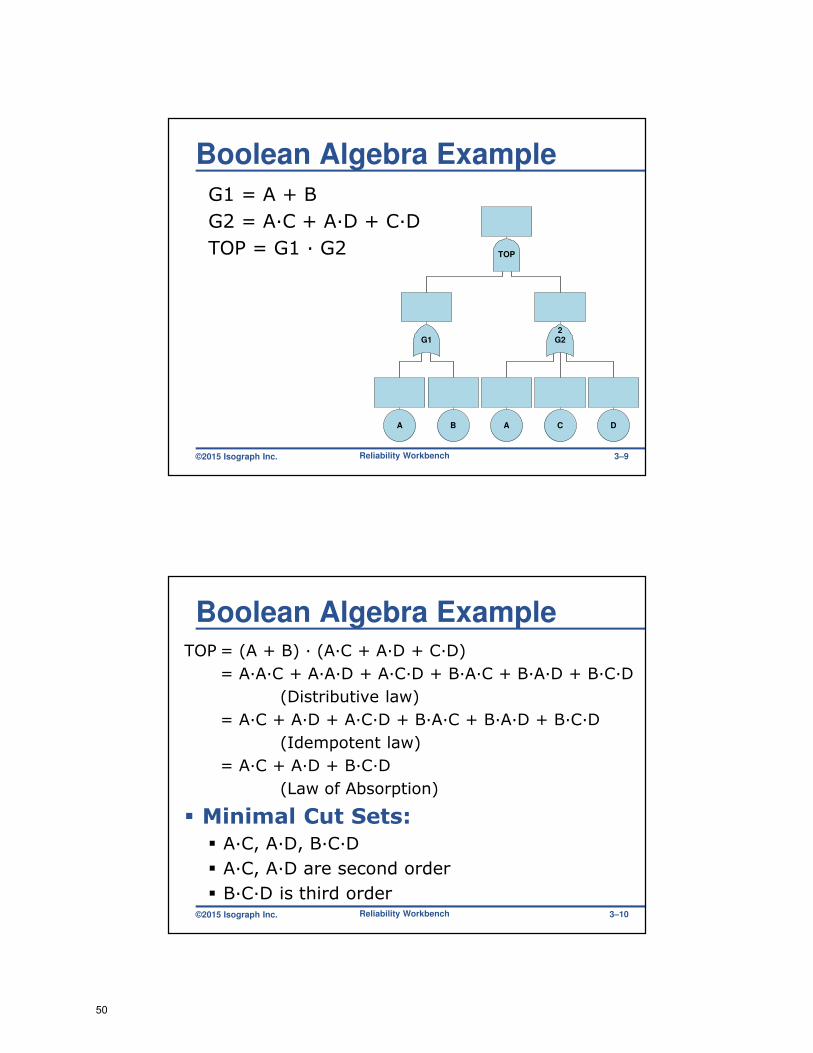
Boolean Algebra Example
G1 = A + B
G2 = A·C + A·D + C·D
TOP = G1 · G2
Reliability Workbench
TOP
G1 G22
A B A C D
3–9
©2015 Isograph Inc.
Boolean Algebra ExampleTOP = (A + B) · (A·C + A·D + C·D)
= A·A·C + A·A·D + A·C·D + B·A·C + B·A·D + B·C·D
(Distributive law)
= A·C + A·D + A·C·D + B·A·C + B·A·D + B·C·D
(Idempotent law)
= A·C + A·D + B·C·D
(Law of Absorption)
� Minimal Cut Sets:
� A·C, A·D, B·C·D
� A·C, A·D are second order
� B·C·D is third orderReliability Workbench 3–10
50
©2015 Isograph Inc.
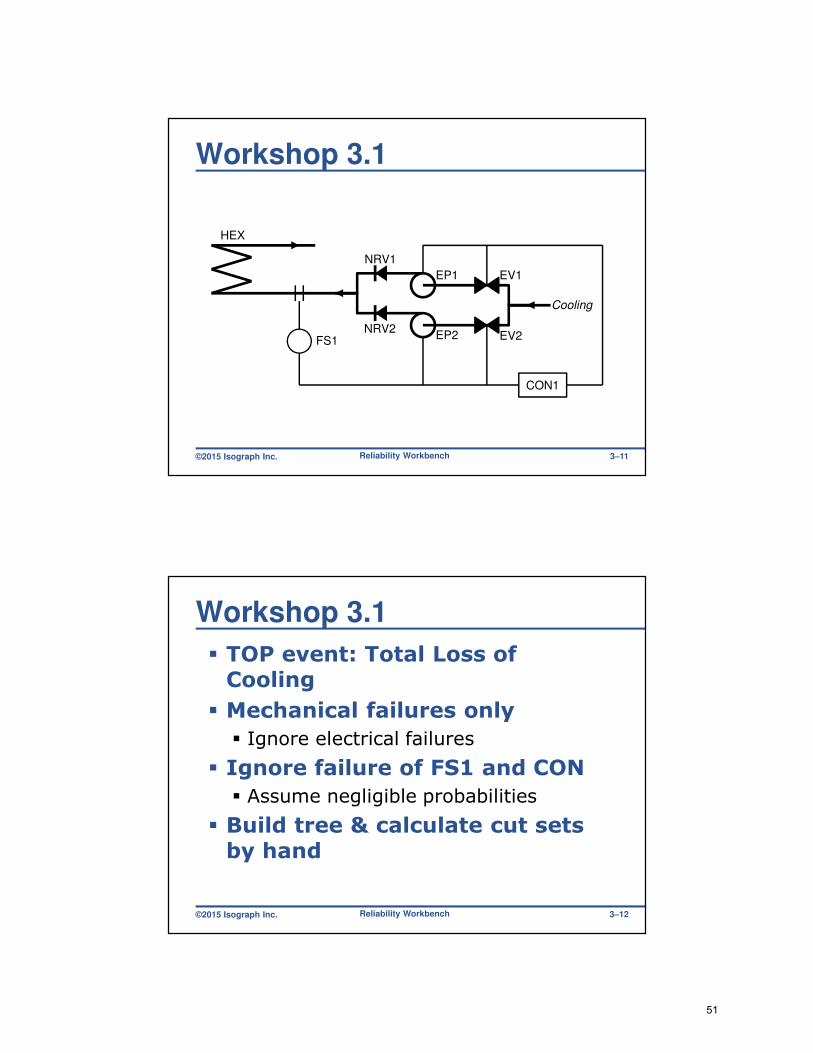
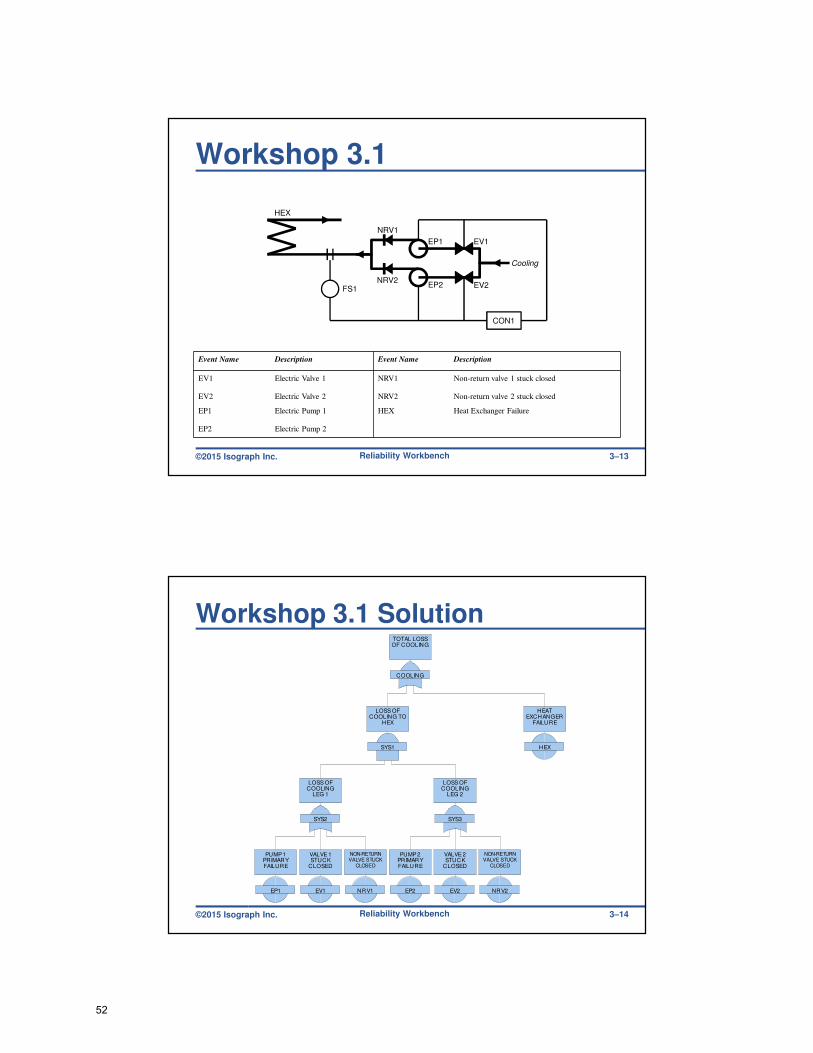
Workshop 3.1
CON1
FS1
HEX
NRV1
NRV2
EP1
EP2
EV1
EV2
Cooling
Reliability Workbench 3–11
©2015 Isograph Inc.
Workshop 3.1
� TOP event: Total Loss of Cooling
� Mechanical failures only
� Ignore electrical failures
� Ignore failure of FS1 and CON
� Assume negligible probabilities
� Build tree & calculate cut sets by hand
Reliability Workbench 3–12
51
©2015 Isograph Inc.
Workshop 3.1
CON1
FS1
HEX
NRV1
NRV2
EP1
EP2
EV1
EV2
Cooling
Event Name Description Event Name Description
EV1 Electric Valve 1 NRV1 Non-return valve 1 stuck closed
EV2 Electric Valve 2 NRV2 Non-return valve 2 stuck closed
EP1 Electric Pump 1 HEX Heat Exchanger Failure
EP2 Electric Pump 2
Reliability Workbench 3–13
©2015 Isograph Inc.
Workshop 3.1 Solution
COOLING
TOTAL LOSSOF COOLING
SYS1
LOSS OFCOOLING TO
HEX
HEX
HEATEXCHANGER
FAILURE
SYS2
LOSS OFCOOLING
LEG 1
SYS3
LOSS OFCOOLING
LEG 2
EP1
PUMP 1PRIMARYFAILURE
EV1
VALVE 1STUCK
CLOSED
NRV1
NON-RETURNVALVE STUCK
CLOSED
EP2
PUMP 2PRIMARYFAILURE
EV2
VALVE 2STUCK
CLOSED
NRV2
NON-RETURNVALVE STUCK
CLOSED
Reliability Workbench 3–14
52
©2015 Isograph Inc.
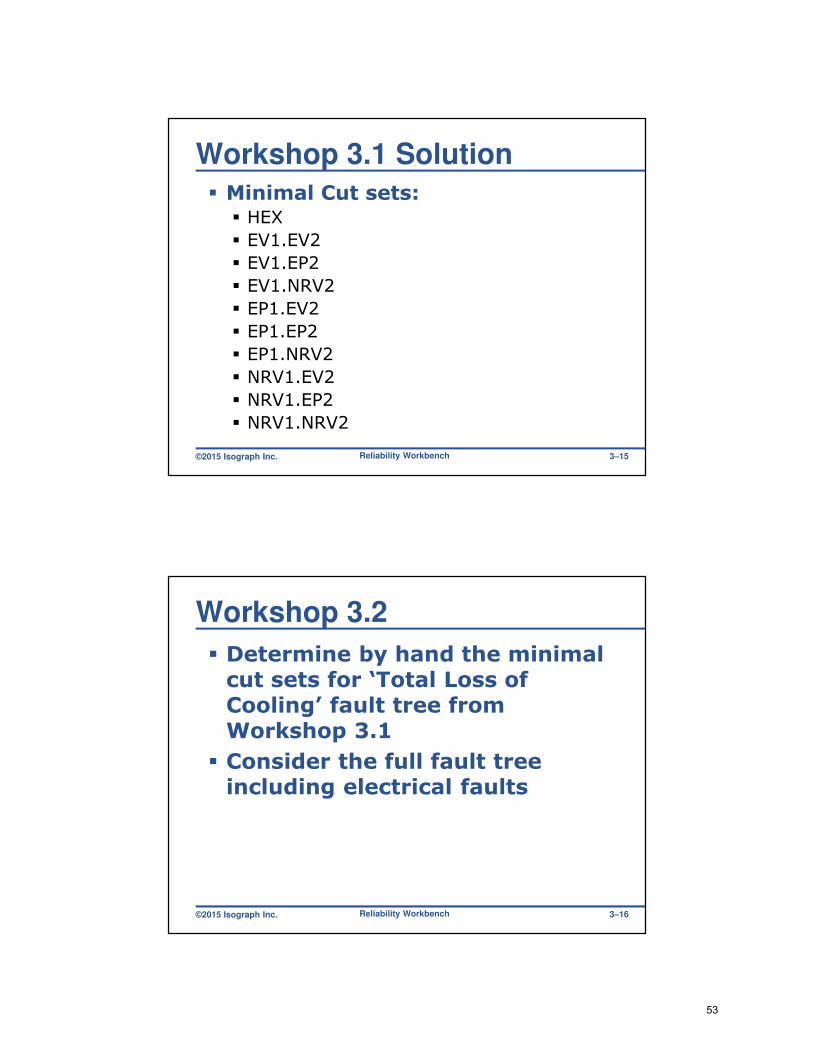
Workshop 3.1 Solution
� Minimal Cut sets:� HEX
� EV1.EV2
� EV1.EP2
� EV1.NRV2
� EP1.EV2
� EP1.EP2
� EP1.NRV2
� NRV1.EV2
� NRV1.EP2
� NRV1.NRV2
Reliability Workbench 3–15
©2015 Isograph Inc.
Workshop 3.2
� Determine by hand the minimal cut sets for ‘Total Loss of Cooling’ fault tree from Workshop 3.1
� Consider the full fault tree including electrical faults
Reliability Workbench 3–16
53

©2015 Isograph Inc.
Cooling System
Reliability Workbench
COOLING
TOTAL LOSS
OF COOLING
SYS1
LOSS OF
COOLING TO
HEX
HEX
HEAT
EXCHANGER
FAILURE
SYS2
LOSS OF
COOLING LEG
1
SYS3
LOSS OF
COOLING LEG
2
3–17
©2015 Isograph Inc.
Cooling System
Reliability Workbench
SYS2
LOSS OFCOOLING LEG
1
PUMP1
PUMP 1UNAVAILABLE
VALVE1
VALVE 1CLOSED
NRV1
NON-RETURNVALVESTUCKCLOSED
ELECA
LOSS OFBOARD ASUPPLY
EP1
PUMP 1PRIMARYFAILURE
ELECB
LOSS OFBOARD BSUPPLY
EV1
VALVE 1STUCKCLOSED
3–18
54
©2015 Isograph Inc.
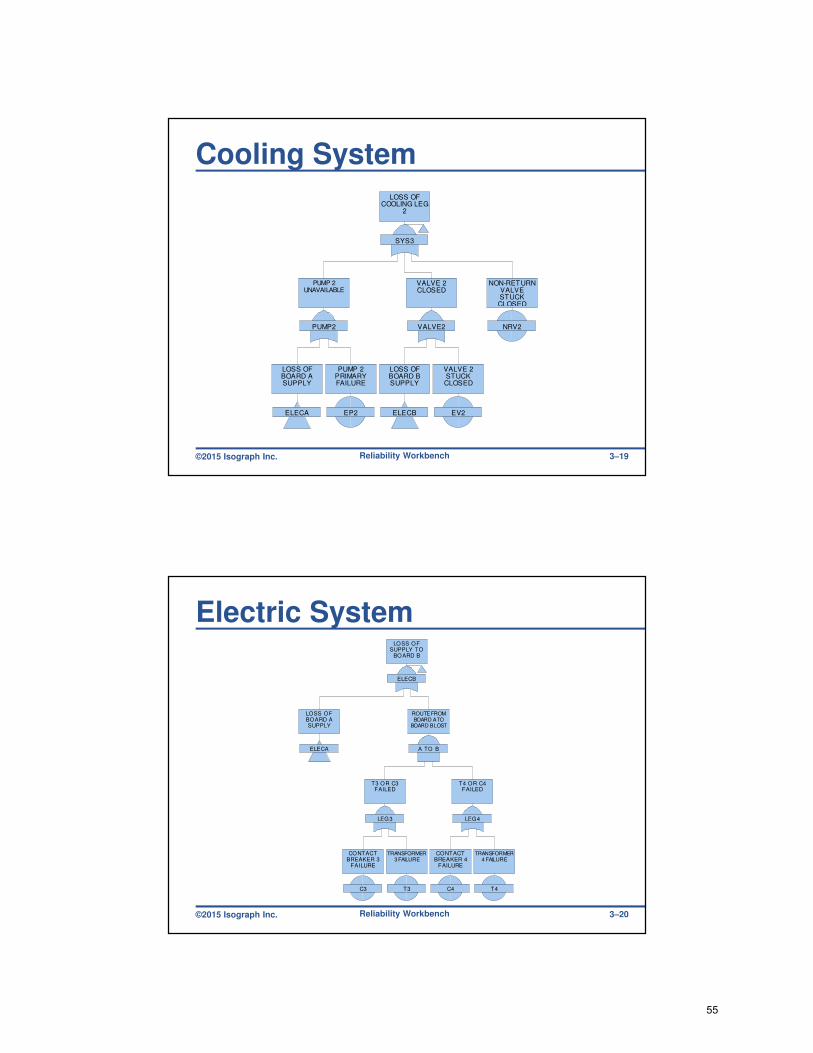
Cooling System
Reliability Workbench
SYS3
LOSS OFCOOLING LEG
2
PUMP2
PUMP 2UNAVAILABLE
VALVE2
VALVE 2CLOSED
NRV2
NON-RETURNVALVESTUCKCLOSED
ELECA
LOSS OFBOARD ASUPPLY
EP2
PUMP 2PRIMARYFAILURE
ELECB
LOSS OFBOARD BSUPPLY
EV2
VALVE 2STUCKCLOSED
3–19
©2015 Isograph Inc.
Electric System
Reliability Workbench
ELECB
LOSS OFSUPPLY TO
BOARD B
ELECA
LOSS OFBOARD ASUPPLY
A TO B
ROUTE FROMBOARD A TO
BOARD B LOST
LEG3
T3 OR C3FAILED
LEG4
T4 OR C4FAILED
C3
CONTACTBREAKER 3
FAILURE
T3
TRANSFORMER3 FAILURE
C4
CONTACTBREAKER 4
FAILURE
T4
TRANSFORMER4 FAILURE
3–20
55
©2015 Isograph Inc.
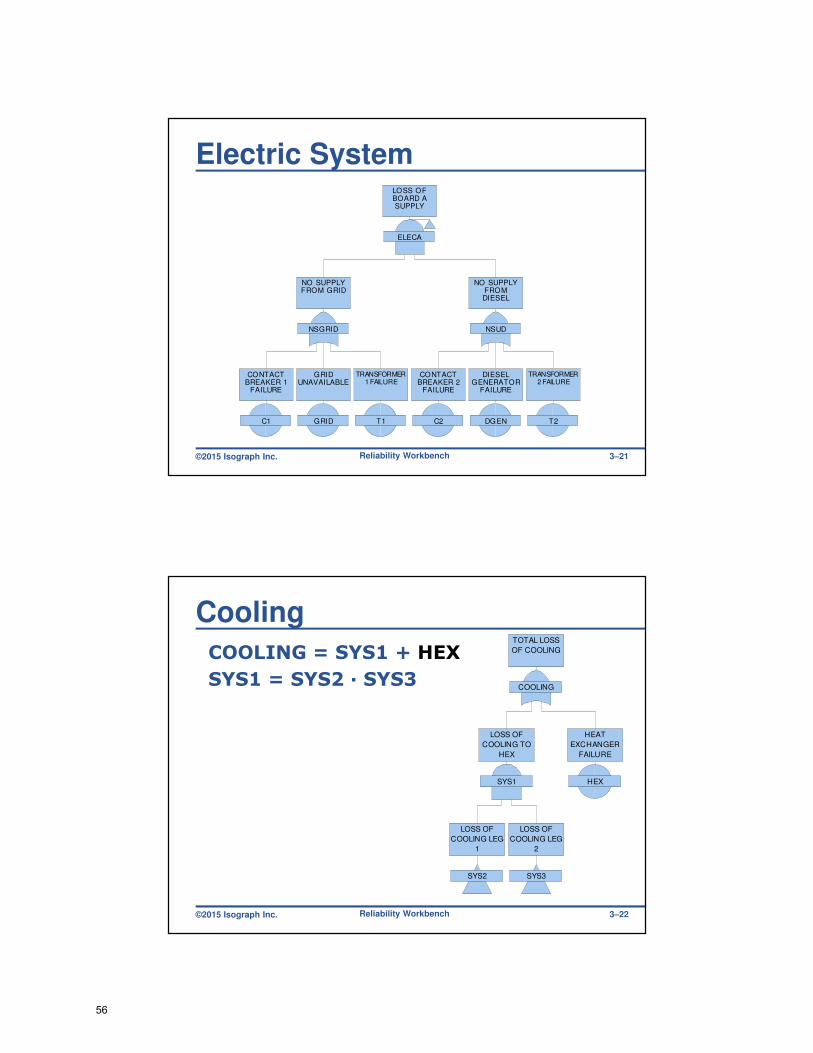
Electric System
Reliability Workbench
ELECA
LOSS OFBOARD ASUPPLY
NSGRID
NO SUPPLYFROM GRID
NSUD
NO SUPPLYFROMDIESEL
C1
CONTACTBREAKER 1
FAILURE
GRID
GRIDUNAVAILABLE
T1
TRANSFORMER1 FAILURE
C2
CONTACTBREAKER 2
FAILURE
DGEN
DIESELGENERATOR
FAILURE
T2
TRANSFORMER2 FAILURE
3–21
©2015 Isograph Inc.
Cooling
COOLING = SYS1 + HEX
SYS1 = SYS2 · SYS3COOLING
TOTAL LOSS
OF COOLING
SYS1
LOSS OF
COOLING TO
HEX
HEX
HEAT
EXCHANGER
FAILURE
SYS2
LOSS OF
COOLING LEG
1
SYS3
LOSS OF
COOLING LEG
2
Reliability Workbench 3–22
56
©2015 Isograph Inc.
SYS2
LOSS OFCOOLING LEG
1
PUMP1
PUMP 1UNAVAILABLE
VALVE1
VALVE 1CLOSED
NRV1
NON-RETURNVALVESTUCKCLOSED
ELECA
LOSS OFBOARD ASUPPLY
EP1
PUMP 1PRIMARYFAILURE
ELECB
LOSS OFBOARD BSUPPLY
EV1
VALVE 1STUCKCLOSED
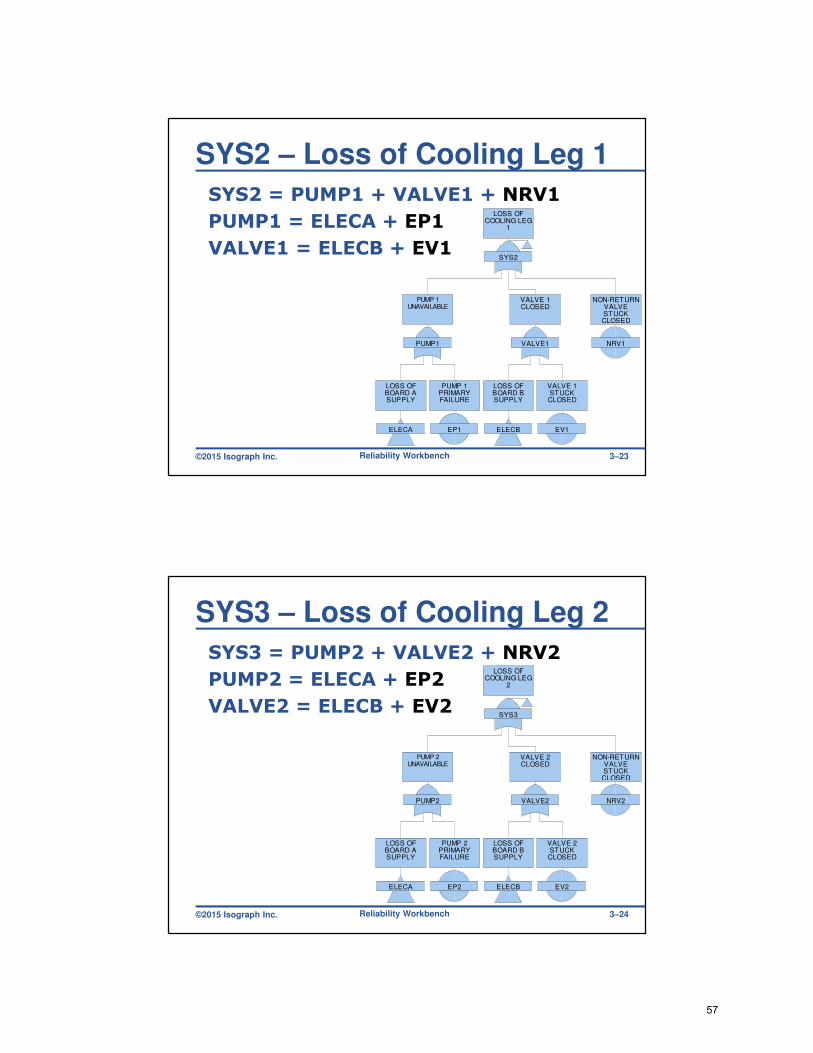
SYS2 – Loss of Cooling Leg 1
SYS2 = PUMP1 + VALVE1 + NRV1
PUMP1 = ELECA + EP1
VALVE1 = ELECB + EV1
Reliability Workbench 3–23
©2015 Isograph Inc.
SYS3
LOSS OFCOOLING LEG
2
PUMP2
PUMP 2UNAVAILABLE
VALVE2
VALVE 2CLOSED
NRV2
NON-RETURNVALVESTUCKCLOSED
ELECA
LOSS OFBOARD ASUPPLY
EP2
PUMP 2PRIMARYFAILURE
ELECB
LOSS OFBOARD BSUPPLY
EV2
VALVE 2STUCKCLOSED
SYS3 – Loss of Cooling Leg 2
SYS3 = PUMP2 + VALVE2 + NRV2
PUMP2 = ELECA + EP2
VALVE2 = ELECB + EV2
Reliability Workbench 3–24
57

©2015 Isograph Inc.
ELECB
LOSS OFSUPPLY TO
BOARD B
ELECA
LOSS OFBOARD ASUPPLY
A TO B
ROUTE FROMBOARD A TO
BOARD B LOST
LEG3
T3 OR C3FAILED
LEG4
T4 OR C4FAILED
C3
CONTACTBREAKER 3
FAILURE
T3
TRANSFORMER3 FAILURE
C4
CONTACTBREAKER 4
FAILURE
T4
TRANSFORMER4 FAILURE
ELECB – Loss of Supply to Board B
ELECB = ELECA + A TO B
A TO B = LEG3 · LEG4
LEG3 = C3 + T3
LEG4 = C4 + T4
Reliability Workbench 3–25
©2015 Isograph Inc.
ELECA – Loss of Supply to Board A
ELECA = NSGRID · NSUD
NSGRID = C1 + GRID + T1
NSUD = C2 + DGEN +T2
ELECA
LOSS OFBOARD ASUPPLY
NSGRID
NO SUPPLYFROM GRID
NSUD
NO SUPPLYFROMDIESEL
C1
CONTACTBREAKER 1
FAILURE
GRID
GRIDUNAVAILABLE
T1
TRANSFORMER1 FAILURE
C2
CONTACTBREAKER 2
FAILURE
DGEN
DIESELGENERATOR
FAILURE
T2
TRANSFORMER2 FAILURE
Reliability Workbench 3–26
58
©2015 Isograph Inc.
COOLING
TOTAL LOSS
OF COOLING
SYS1
LOSS OF
COOLING TO
HEX
HEX
HEAT
EXCHANGER
FAILURE
SYS2
LOSS OF
COOLING LEG
1
SYS3
LOSS OF
COOLING LEG
2
Cooling
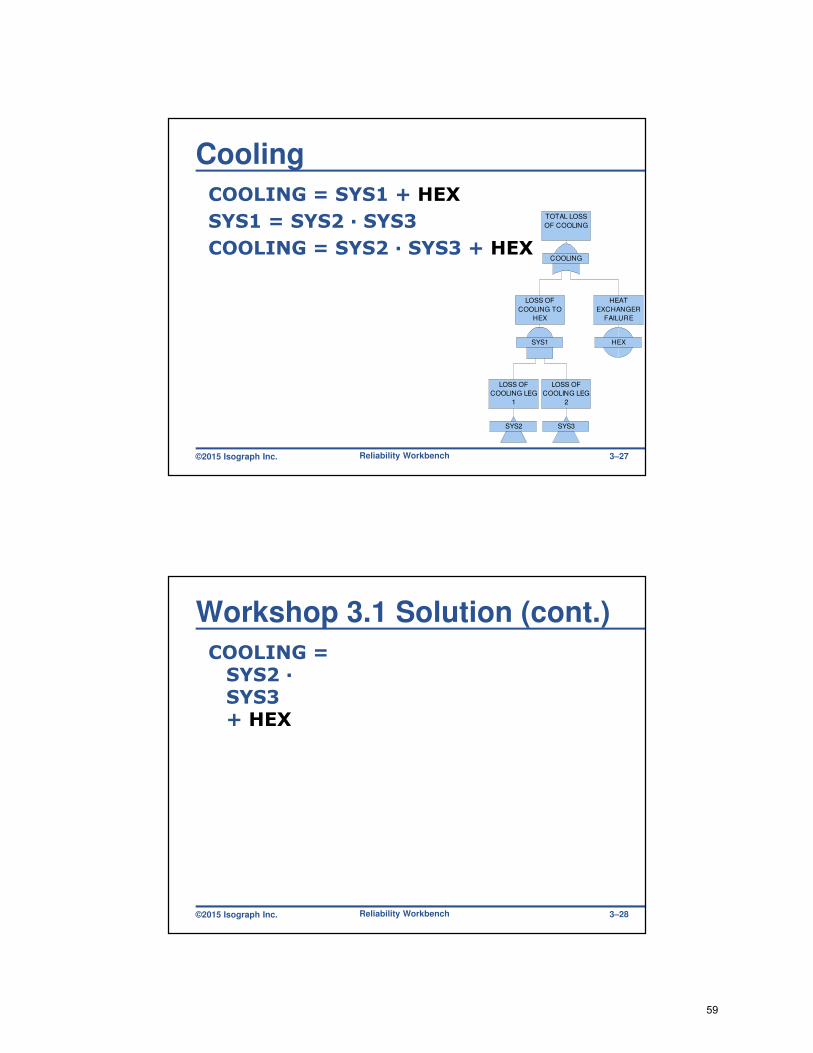
COOLING = SYS1 + HEX
SYS1 = SYS2 · SYS3
COOLING = SYS2 · SYS3 + HEX
Reliability Workbench 3–27
©2015 Isograph Inc.
Workshop 3.1 Solution (cont.)
COOLING = SYS2 · SYS3 + HEX
Reliability Workbench 3–28
59

©2015 Isograph Inc.
Workshop 3.1 Solution (cont.)
COOLING = (PUMP1 + VALVE1 + NRV1) · (PUMP2 + VALVE2 + NRV2) + HEX
Reliability Workbench 3–29
©2015 Isograph Inc.
Workshop 3.1 Solution (cont.)
COOLING = ([ELECA + EP1] + [ELECB + EV1] + NRV1) ·([ELECA + EP2] + [ELECB + EV2] + NRV2)+ HEX
Reliability Workbench 3–30
60
©2015 Isograph Inc.
Workshop 3.2 Solution (cont.)
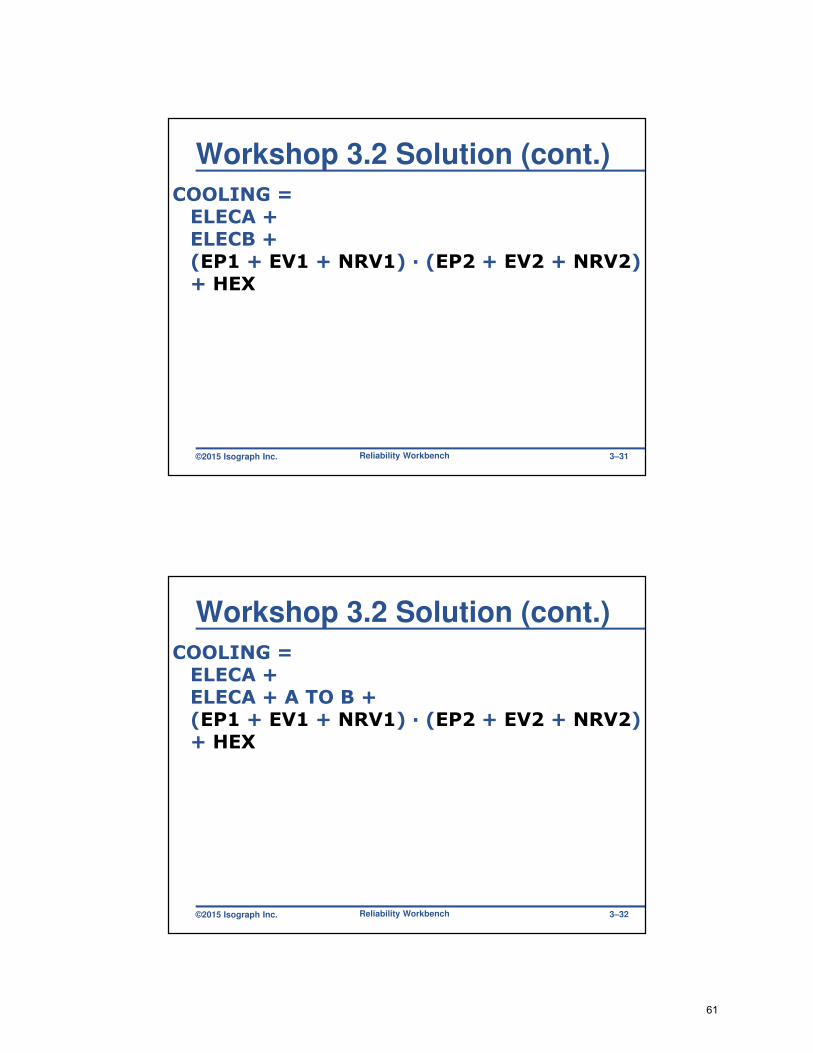
COOLING = ELECA +ELECB +(EP1 + EV1 + NRV1) · (EP2 + EV2 + NRV2)+ HEX
Reliability Workbench 3–31
©2015 Isograph Inc.
Workshop 3.2 Solution (cont.)
COOLING = ELECA +ELECA + A TO B +(EP1 + EV1 + NRV1) · (EP2 + EV2 + NRV2)+ HEX
Reliability Workbench 3–32
61
©2015 Isograph Inc.
Workshop 3.2 Solution (cont.)
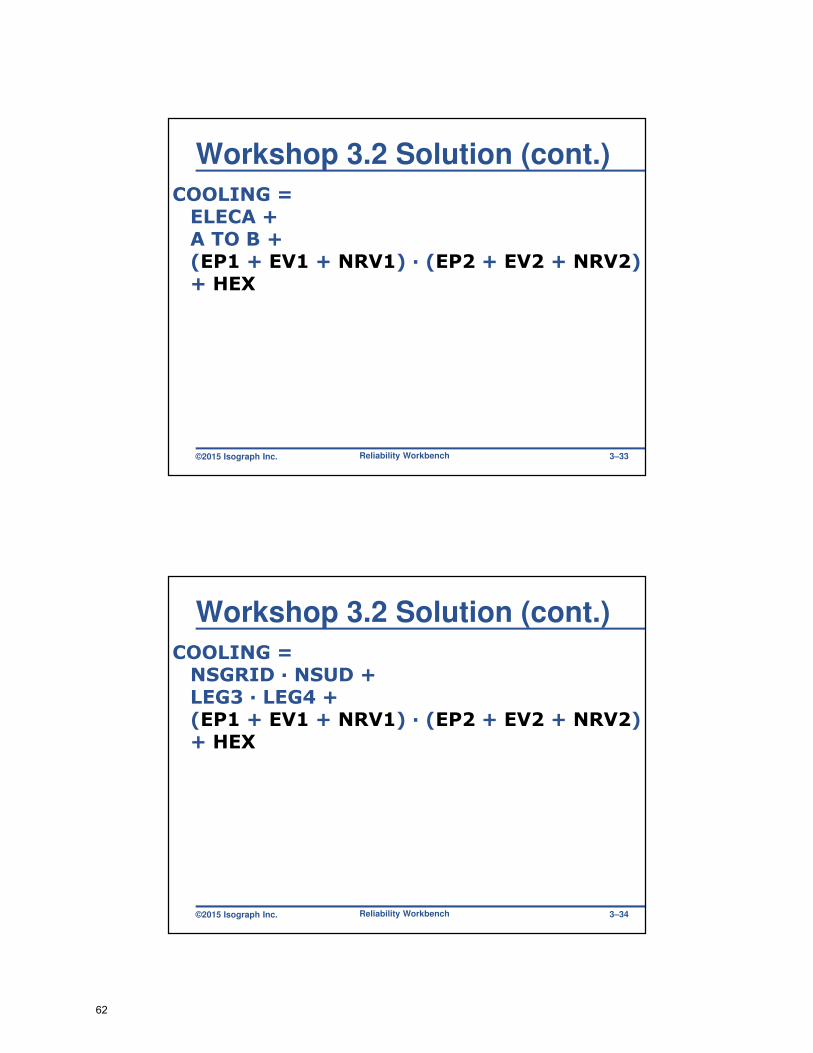
COOLING = ELECA +A TO B +(EP1 + EV1 + NRV1) · (EP2 + EV2 + NRV2)+ HEX
Reliability Workbench 3–33
©2015 Isograph Inc.
Workshop 3.2 Solution (cont.)
COOLING = NSGRID · NSUD +LEG3 · LEG4 + (EP1 + EV1 + NRV1) · (EP2 + EV2 + NRV2)+ HEX
Reliability Workbench 3–34
62
©2015 Isograph Inc.
Workshop 3.2 Solution (cont.)
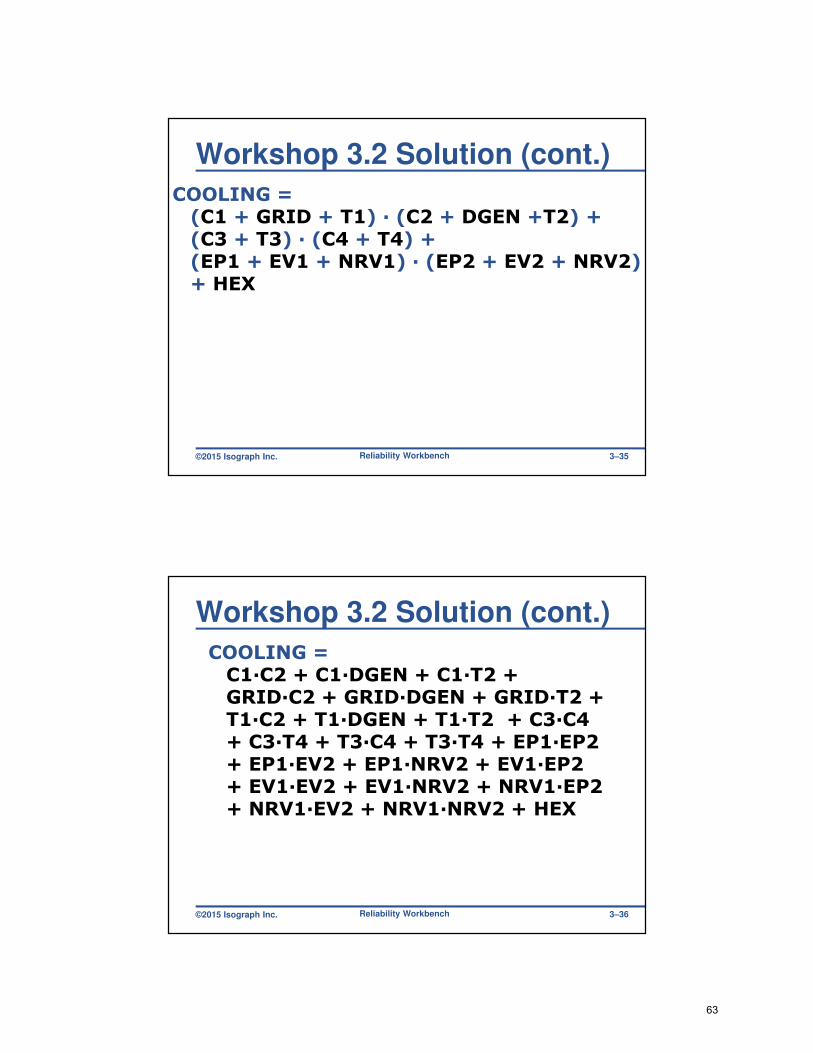
COOLING = (C1 + GRID + T1) · (C2 + DGEN +T2) +(C3 + T3) · (C4 + T4) +(EP1 + EV1 + NRV1) · (EP2 + EV2 + NRV2)+ HEX
Reliability Workbench 3–35
©2015 Isograph Inc.
Workshop 3.2 Solution (cont.)
COOLING = C1·C2 + C1·DGEN + C1·T2 + GRID·C2 + GRID·DGEN + GRID·T2 + T1·C2 + T1·DGEN + T1·T2 + C3·C4 + C3·T4 + T3·C4 + T3·T4 + EP1·EP2 + EP1·EV2 + EP1·NRV2 + EV1·EP2 + EV1·EV2 + EV1·NRV2 + NRV1·EP2 + NRV1·EV2 + NRV1·NRV2 + HEX
Reliability Workbench 3–36
63

©2015 Isograph Inc.
Program Demonstration
� Using a Fault Tree program to obtain cut sets
Reliability Workbench 3–37
©2015 Isograph Inc.
End of Chapter 3
� Summary
� Boolean operators
� Boolean gate expressions
� Boolean algebra rules
� Evaluating cut sets in a computer program
Reliability Workbench 3–38
64
©2015 Isograph Inc.
Chapter 4
Basic Probability Theory
Reliability Workbench 4–1
©2015 Isograph Inc.
Basic Probability Theory
� First step in analysis: calculate cut sets
� Second step in analysis: calculate cut set Q
� Third step: calculate TOP event Q
� Need laws of probability
� Multiplication law
� Addition law
� Used to calculate Qs
Reliability Workbench 4–2
65

©2015 Isograph Inc.
Independent Events
� Independent events: unaffected by other’s occurrence
� Rolling a die, flipping a coin
� Generally Assumed in FTA
� Simplifies calculations
� Not necessarily the case
� Increased stress, etc.
� CCFs, discussed later
Reliability Workbench 4–3
©2015 Isograph Inc.
Exclusivity
� Mutually exclusive events: cannot occur together
� Ex: Failed and working states
� Non-exclusive events
� Ex: failure of two independent components
� Die showing 6, coin landing heads
Reliability Workbench 4–4
66
©2015 Isograph Inc.
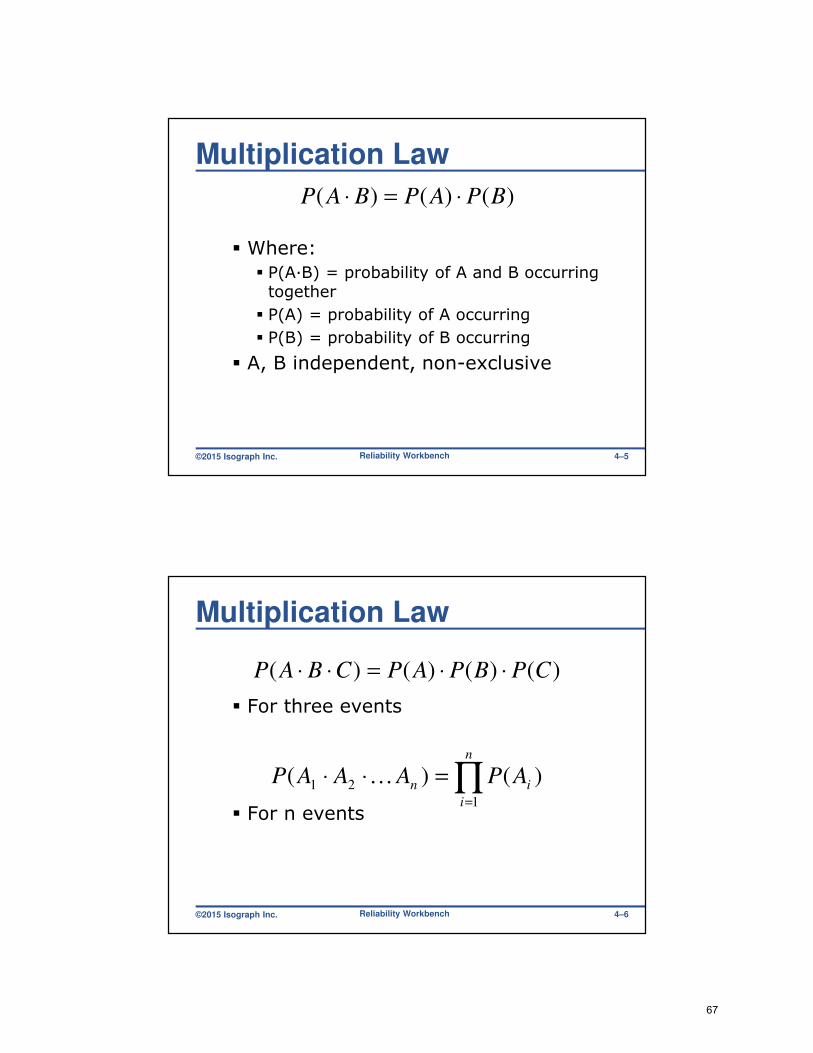
Multiplication Law
� Where:
� P(A·B) = probability of A and B occurring together
� P(A) = probability of A occurring
� P(B) = probability of B occurring
� A, B independent, non-exclusive
)()()( BPAPBAP ⋅=⋅
Reliability Workbench 4–5
©2015 Isograph Inc.
Multiplication Law
� For three events
� For n events
)()()()( CPBPAPCBAP ⋅⋅=⋅⋅
∏=
=⋅⋅
n
i
in APAAAP1
21 )()( K
Reliability Workbench 4–6
67
©2015 Isograph Inc.
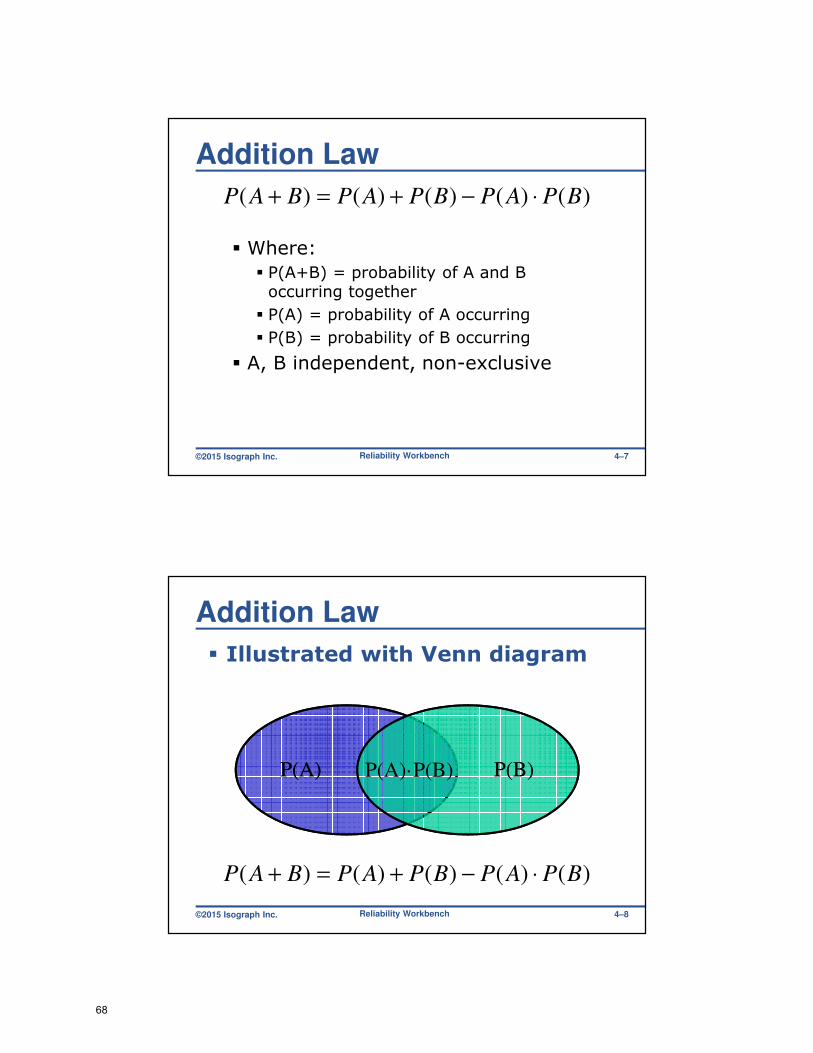
Addition Law
� Where:
� P(A+B) = probability of A and B occurring together
� P(A) = probability of A occurring
� P(B) = probability of B occurring
� A, B independent, non-exclusive
)()()()()( BPAPBPAPBAP ⋅−+=+
Reliability Workbench 4–7
©2015 Isograph Inc.
Addition Law
� Illustrated with Venn diagram
)()()()()( BPAPBPAPBAP ⋅−+=+
P(A)P(A) P(B)P(B)P(A)·P(B)
Reliability Workbench 4–8
68

©2015 Isograph Inc.
Addition Law for 3 Events
)()()(
)()()()()()(
)()()()(
CPBPAP
CPBPCPAPBPAP
CPBPAPCBAP
⋅⋅+
⋅−⋅−⋅−
++=++
P(A)P(A)
P(C)P(C)P(B)P(B)P(B)·P(C)
P(A)·P(B)·P(C)
Reliability Workbench 4–9
©2015 Isograph Inc.
Addition Law
� General form:
� Very complex
� Approximation methods
� Success states
)()...()()1...()()()()...( 21
11
1 11
21 n
n
j
n
i
n
ij
i
n
i
in APAPAPAPAPAPAAAP+
−
= +==
−+−=+++ ∑∑∑
Reliability Workbench 4–10
69
©2015 Isograph Inc.
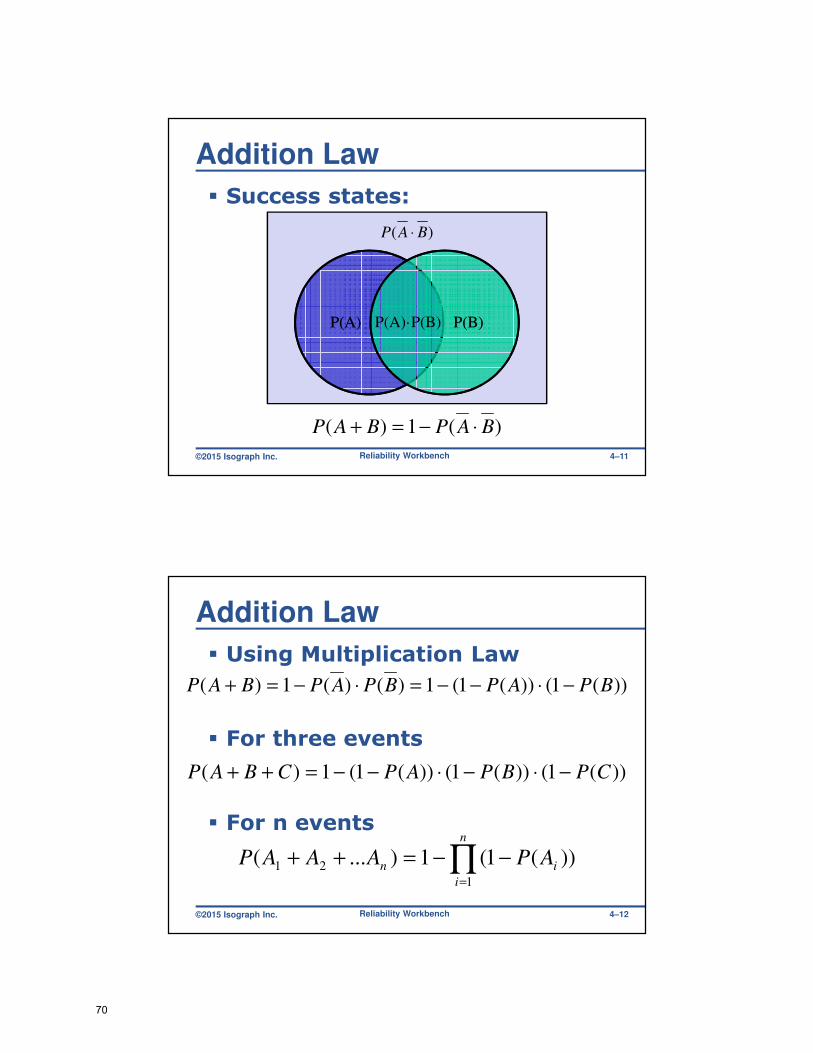
Addition Law
� Success states:
P(A)P(A) P(B)P(B)P(A)·P(B)
)( BAP ⋅
)(1)( BAPBAP ⋅−=+
Reliability Workbench 4–11
©2015 Isograph Inc.
Addition Law
� Using Multiplication Law
� For three events
� For n events
))(1())(1(1)()(1)( BPAPBPAPBAP −⋅−−=⋅−=+
))(1())(1())(1(1)( CPBPAPCBAP −⋅−⋅−−=++
∏=
−−=++
n
i
in APAAAP1
21 ))(1(1)...(
Reliability Workbench 4–12
70

©2015 Isograph Inc.
Example 4.1
� Two-sided coin and a twenty-sided die are thrown
� Probability of the coin landing heads AND the dice showing 20?
Reliability Workbench 4–13
©2015 Isograph Inc.
Example 4.1 Solution
� P(Heads) = ½ = 0.5
� P(20) = 1/20 = 0.05
� Independent, non-exclusive?
� Yes! Multiplication law
� P(Heads·20) = 1/2 x 1/20 = 1/40 = .025 = 2.5%
Reliability Workbench 4–14
71

©2015 Isograph Inc.
Example 4.2
� Spin 3 coins
� Probability of AT LEAST ONE landing heads?
Reliability Workbench 4–15
©2015 Isograph Inc.
Example 4.2 Solution
� Probability of coin A landing heads = P(A) = ½ = 0.5
� P(B) = ½ = 0.5
� P(C) = ½ = 0.5
� Addition law
� A OR B OR C
� 3·½ – 3 · ½·½ + ½·½·½ = 0.875
Reliability Workbench 4–16
72
©2015 Isograph Inc.
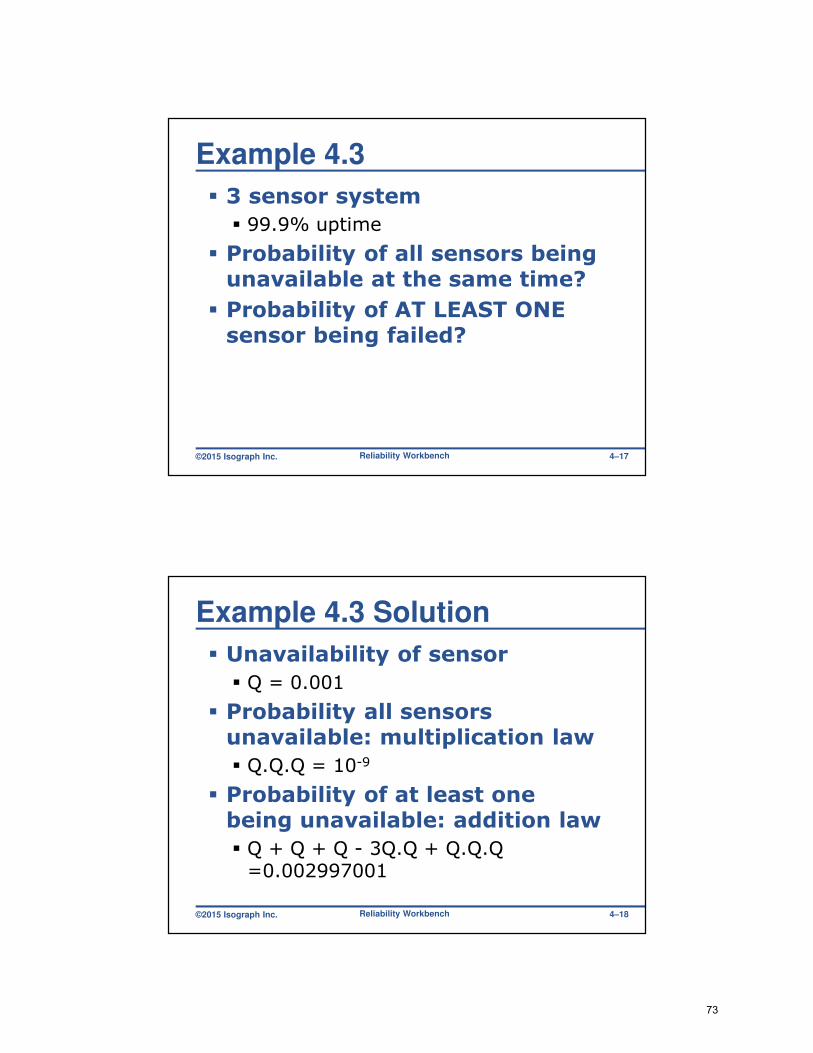
Example 4.3
� 3 sensor system
� 99.9% uptime
� Probability of all sensors being unavailable at the same time?
� Probability of AT LEAST ONE sensor being failed?
Reliability Workbench 4–17
©2015 Isograph Inc.
Example 4.3 Solution
� Unavailability of sensor
� Q = 0.001
� Probability all sensors unavailable: multiplication law
� Q.Q.Q = 10-9
� Probability of at least one being unavailable: addition law
� Q + Q + Q - 3Q.Q + Q.Q.Q =0.002997001
Reliability Workbench 4–18
73

©2015 Isograph Inc.
Lower/Upper bounds
� Q=0.001
� Q + Q + Q = 0.003
� 3Q·Q = 0.000003
� Q·Q·Q = 0.000000001
Cumulative total Change % Change
Q+Q+Q 0.003 0.003 100%
3·Q·Q 0.002997 0.000003 1%
Q·Q·Q 0.002997001 0.000000001 0.00003%
Reliability Workbench 4–19
©2015 Isograph Inc.
Example 4.4
� Weather forecaster predicts 40% chance of rain for five days
� Probability that it rains at least one day?
Reliability Workbench 4–20
74
©2015 Isograph Inc.
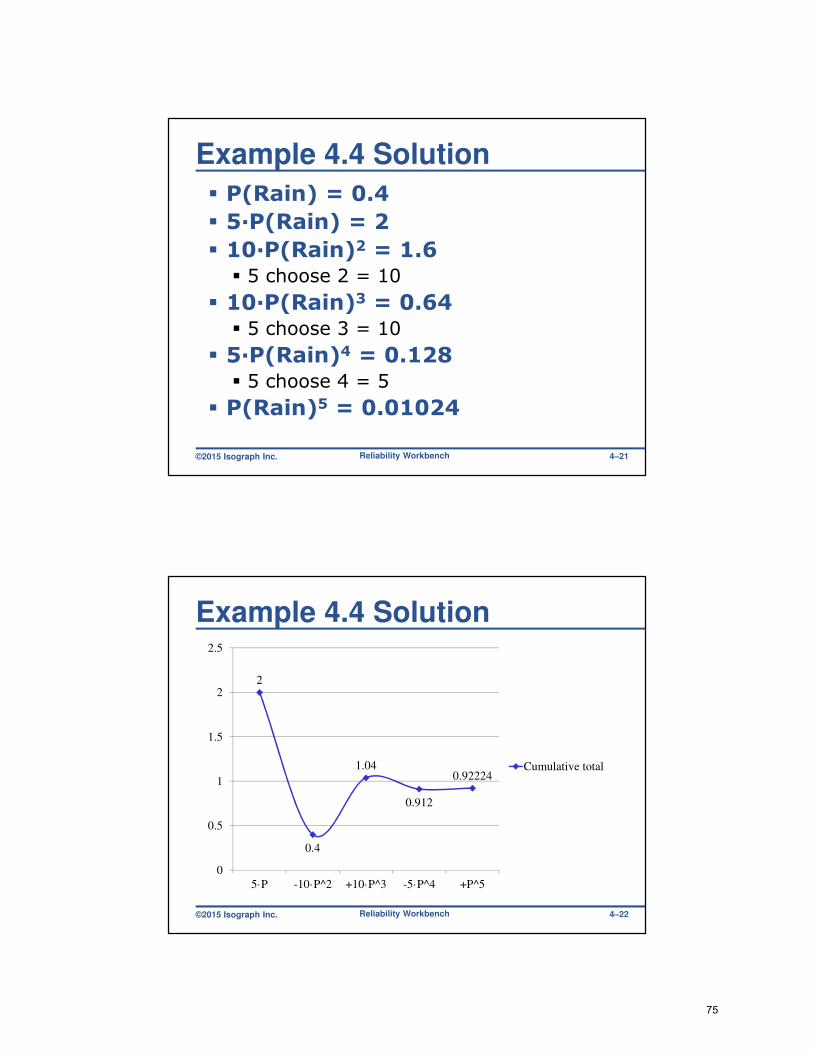
Example 4.4 Solution
� P(Rain) = 0.4
� 5·P(Rain) = 2
� 10·P(Rain)2 = 1.6� 5 choose 2 = 10
� 10·P(Rain)3 = 0.64� 5 choose 3 = 10
� 5·P(Rain)4 = 0.128� 5 choose 4 = 5
� P(Rain)5 = 0.01024
Reliability Workbench 4–21
©2015 Isograph Inc.
Example 4.4 Solution
2
0.4
1.04
0.912
0.92224
0
0.5
1
1.5
2
2.5
5·P -10·P^2 +10·P^3 -5·P^4 +P^5
Cumulative total
Reliability Workbench 4–22
75

©2015 Isograph Inc.
End of Chapter 4
� Summary
� Independence
� Exclusivity
� Multiplication Law
� Addition Law
� De Morgan’s Theorem
Reliability Workbench 4–23
76
©2015 Isograph Inc.
Quantitative DataChapter 5
Reliability Workbench 5–1
©2015 Isograph Inc.
Quantitative Data
� Fault Trees are both:
� Qualitative
� Quantitative
� Qualitative
� Cut set analysis
� Quantitative
� Multiplication/Addition laws
� Need input values
Reliability Workbench 5–2
77

©2015 Isograph Inc.
Input Data
� Entered for all events
� Required for quantitative analysis
� Function to calculate Q and ω
� Equation depends on event characteristics
� Options will differ between FT tools
Reliability Workbench 5–3
©2015 Isograph Inc.
Common Parameters
� Unavailability
� Failure Frequency
� Mean Time To Failure (MTTF)
� Failure Rate (1/MTTF)
� Inspection (Test) Interval
� Mean Time to Repair (MTTR)
� Repair Rate (1/MTTR)
� Time at Risk/Lifetime
Reliability Workbench 5–4
78
©2015 Isograph Inc.
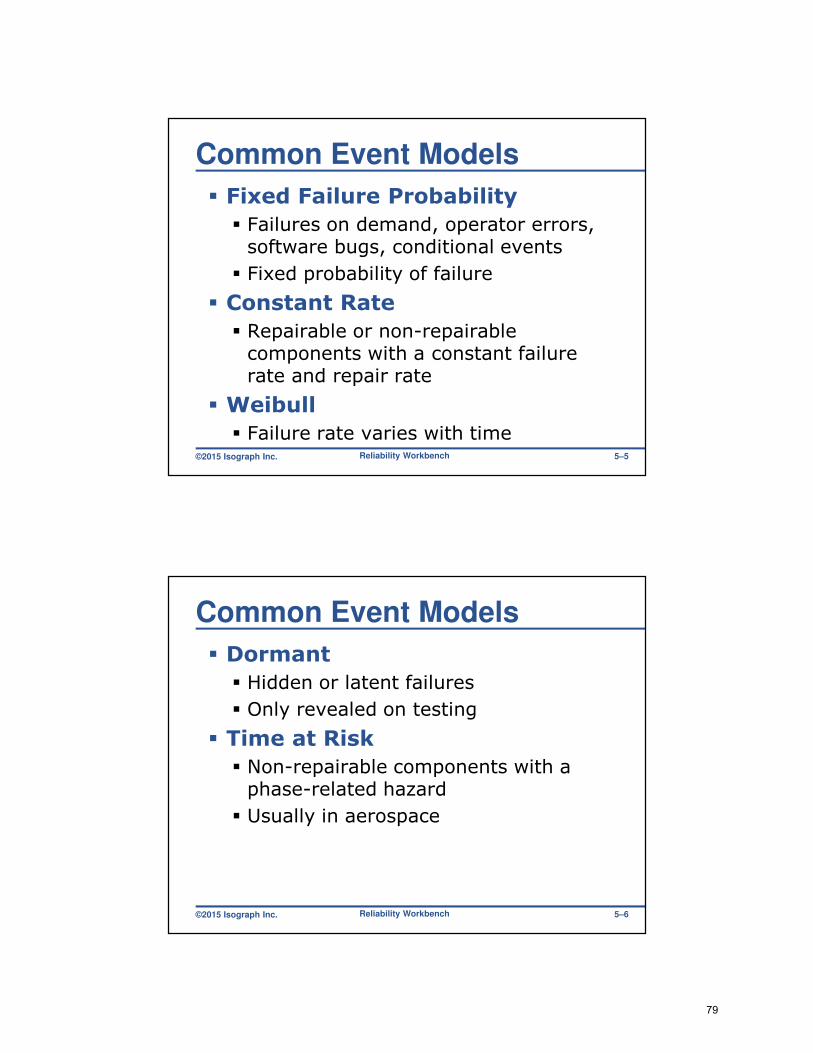
Common Event Models
� Fixed Failure Probability
� Failures on demand, operator errors, software bugs, conditional events
� Fixed probability of failure
� Constant Rate
� Repairable or non-repairable components with a constant failure rate and repair rate
� Weibull
� Failure rate varies with timeReliability Workbench 5–5
©2015 Isograph Inc.
Common Event Models
� Dormant
� Hidden or latent failures
� Only revealed on testing
� Time at Risk
� Non-repairable components with a phase-related hazard
� Usually in aerospace
Reliability Workbench 5–6
79

©2015 Isograph Inc.
Fixed Probability
� Constant Q and ω
� Useful for
� Operator errors
� Failure on demand
� Software bugs
� Conditional events
� Probability of failure on demand = Q
� Input Q and ω directly
Reliability Workbench 5–7
©2015 Isograph Inc.
Fixed ProbabilityInitiators and Enablers
� Failure frequency = 0 (usually)
� Event is an enabler
� Only interested in system Q
� For initiators:
� Use Fixed model
� Input ω only
� Program will ignore Q
Reliability Workbench 5–8
80
©2015 Isograph Inc.
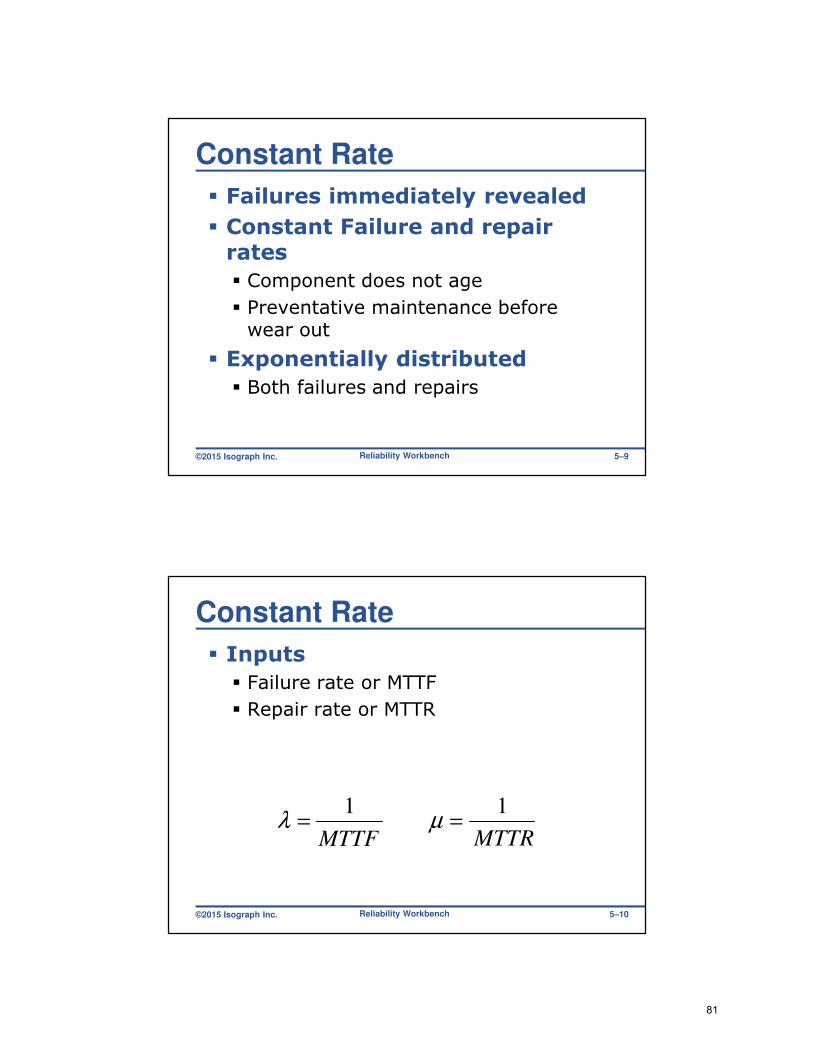
Constant Rate
� Failures immediately revealed
� Constant Failure and repair rates
� Component does not age
� Preventative maintenance before wear out
� Exponentially distributed
� Both failures and repairs
Reliability Workbench 5–9
©2015 Isograph Inc.
Constant Rate
� Inputs
� Failure rate or MTTF
� Repair rate or MTTR
Reliability Workbench 5–10
MTTF
1=λ µ =
1
MTTR
81

©2015 Isograph Inc.
Constant Rate
λ = failure rate, µ = repair rate
� If Q(t) ≈ 0 (usually the case)
λω ≈)(t
)](1[)(
)1()( )(
tQt
etQt
−=
−
+
=+−
λω
µλ
λµλ
Reliability Workbench 5–11
©2015 Isograph Inc.
Constant Rate
Q(t)
t
Transient Region
Steady-state Region
Reliability Workbench 5–12
82
©2015 Isograph Inc.
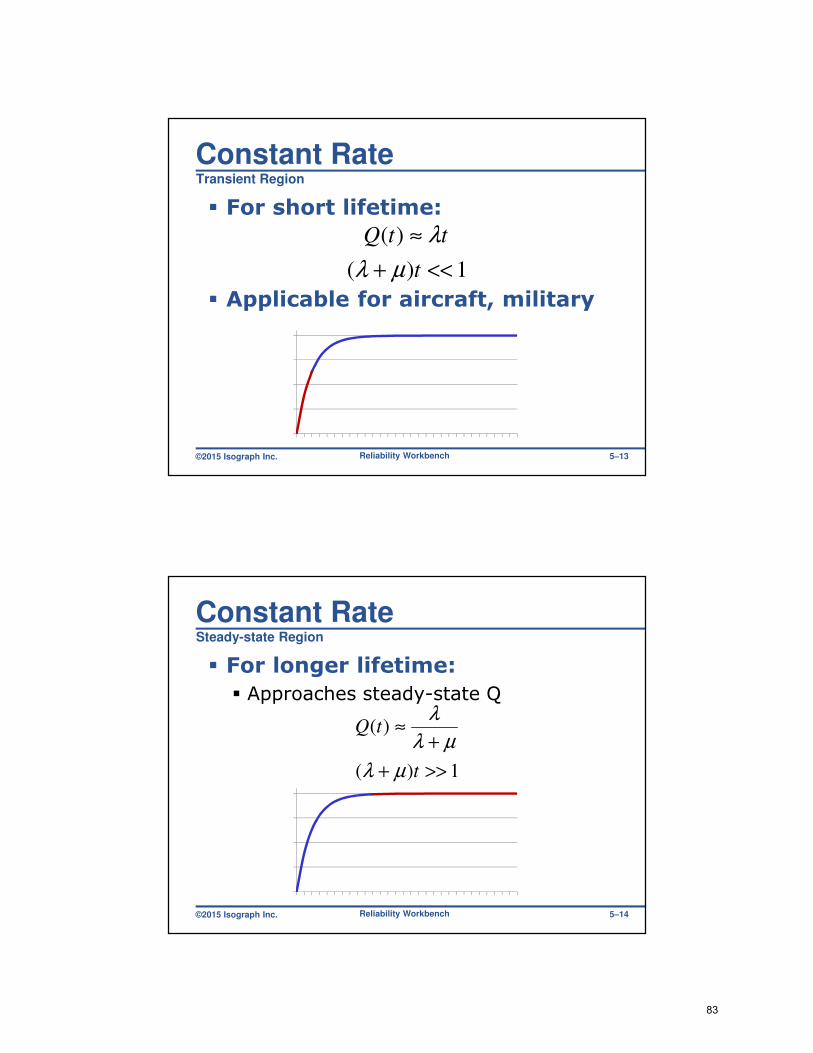
Constant RateTransient Region
� For short lifetime:
� Applicable for aircraft, military
1)(
)(
<<+
≈
t
ttQ
µλ
λ
Reliability Workbench 5–13
©2015 Isograph Inc.
Constant RateSteady-state Region
� For longer lifetime:
� Approaches steady-state Q
1)(
)(
>>+
+
≈
t
tQ
µλ
µλ
λ
Reliability Workbench 5–14
83

©2015 Isograph Inc.
Non-Repairable Events
� Non-repairable components
� Repair rate = 0
� Substitution yields:
t
t
etQ
etQ
λ
λ
λ
λ
−
+−
−=
−
+
=
1)(
)1(0
)( )0(
Reliability Workbench 5–15
©2015 Isograph Inc.
Non-Repairable Events
0
0.2
0.4
0.6
0.8
1
Reliability Workbench 5–16
84
©2015 Isograph Inc.
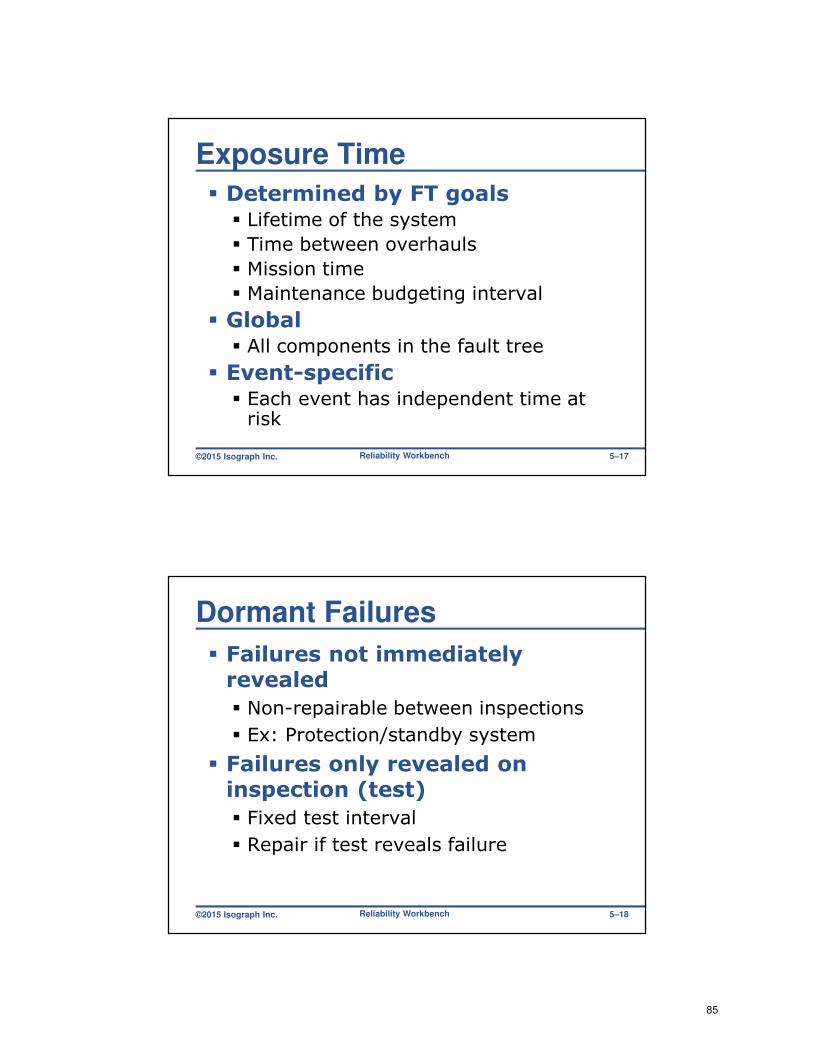
Exposure Time
� Determined by FT goals� Lifetime of the system
� Time between overhauls
� Mission time
� Maintenance budgeting interval
� Global� All components in the fault tree
� Event-specific� Each event has independent time at risk
Reliability Workbench 5–17
©2015 Isograph Inc.
Dormant Failures
� Failures not immediately revealed
� Non-repairable between inspections
� Ex: Protection/standby system
� Failures only revealed on inspection (test)
� Fixed test interval
� Repair if test reveals failure
Reliability Workbench 5–18
85
©2015 Isograph Inc.
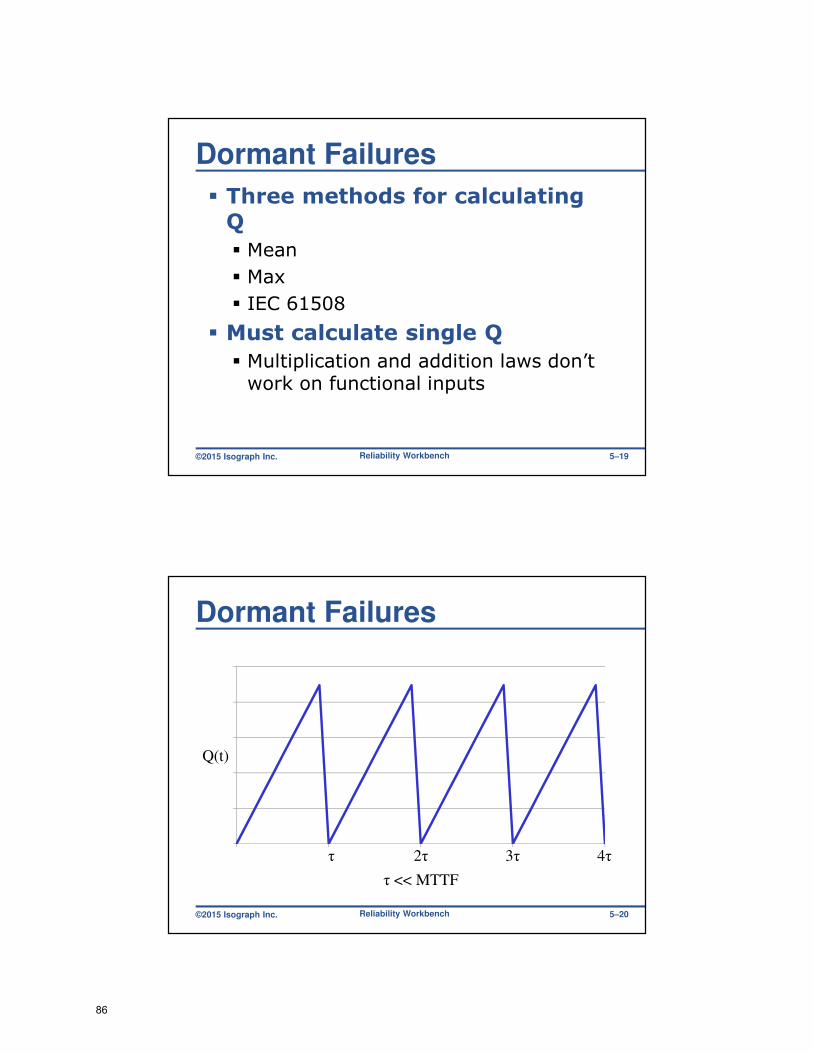
Dormant Failures
� Three methods for calculating Q
� Mean
� Max
� IEC 61508
� Must calculate single Q
� Multiplication and addition laws don’t work on functional inputs
Reliability Workbench 5–19
©2015 Isograph Inc.
Dormant Failures
Q(t)
τ 2τ 3τ 4τ
τ << MTTF
Reliability Workbench 5–20
86
©2015 Isograph Inc.
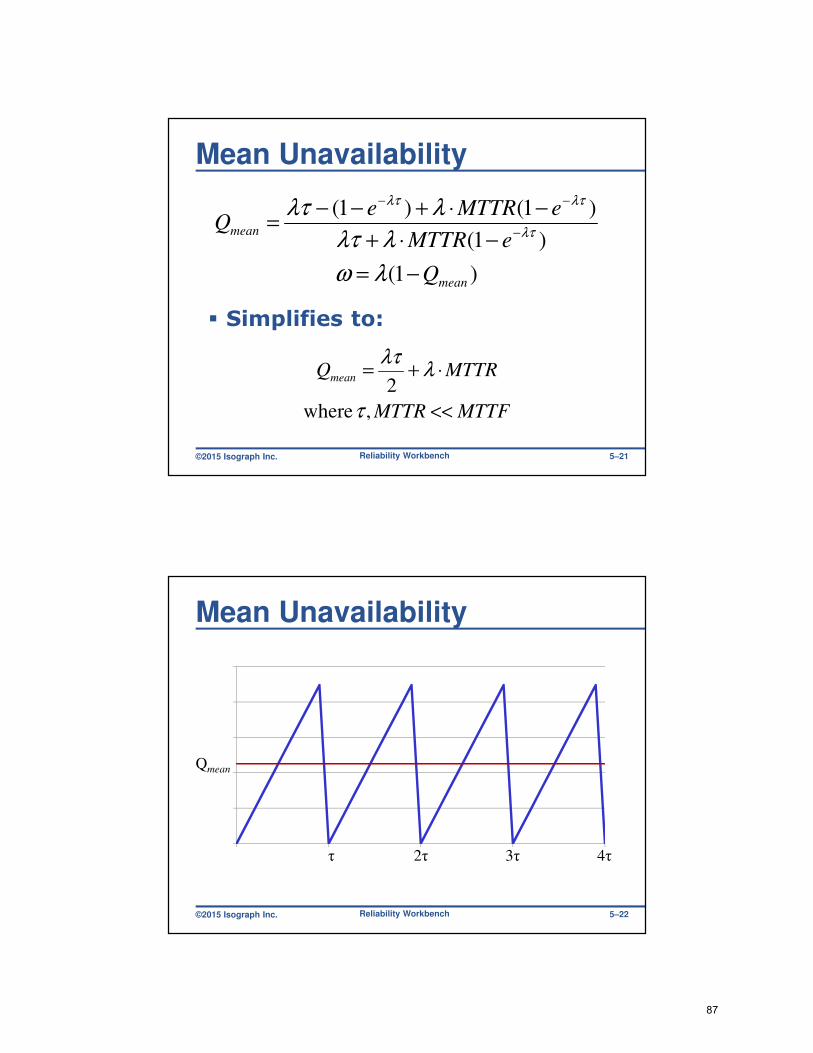
Mean Unavailability
� Simplifies to:
Reliability Workbench 5–21
)1(
)1(
)1()1(
mean
mean
Q
eMTTR
eMTTReQ
−=
−⋅+
−⋅+−−=
−
−−
λω
λλτ
λλτ
λτ
λτλτ
MTTFMTTR
MTTRQmean
<<
⋅+=
, where
2
τ
λλτ
©2015 Isograph Inc.
Mean Unavailability
Reliability Workbench 5–22
Qmean
τ 2τ 3τ 4τ
87

©2015 Isograph Inc.
Maximum Unavailability
Reliability Workbench 5–23
)1(
1
max
max
Q
eQ
−=
−=−
λω
λτ
©2015 Isograph Inc.
Maximum Unavailability
Reliability Workbench 5–24
Qmax
τ 2τ 3τ 4τ
88
©2015 Isograph Inc.
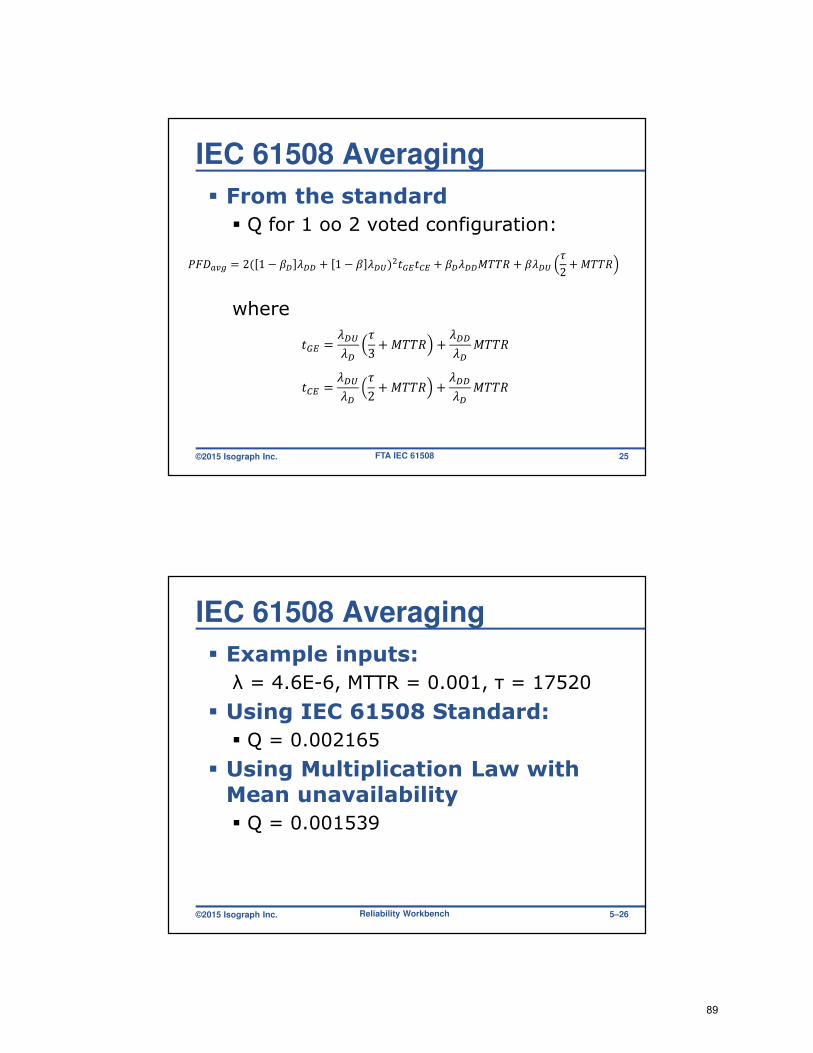
IEC 61508 Averaging
� From the standard
� Q for 1 oo 2 voted configuration:
where
FTA IEC 61508
������ = 2( 1 − � � + 1 − � � �)������� + � � ���� + �� �
�
2+ ����
��� =� �
�
�
3+ ���� +
�
� ����
��� =� �
�
�
2+ ���� +
�
� ����
25
©2015 Isograph Inc.
IEC 61508 Averaging
� Example inputs:
λ = 4.6E-6, MTTR = 0.001, τ = 17520
� Using IEC 61508 Standard:
� Q = 0.002165
� Using Multiplication Law with Mean unavailability
� Q = 0.001539
Reliability Workbench 5–26
89
©2015 Isograph Inc.
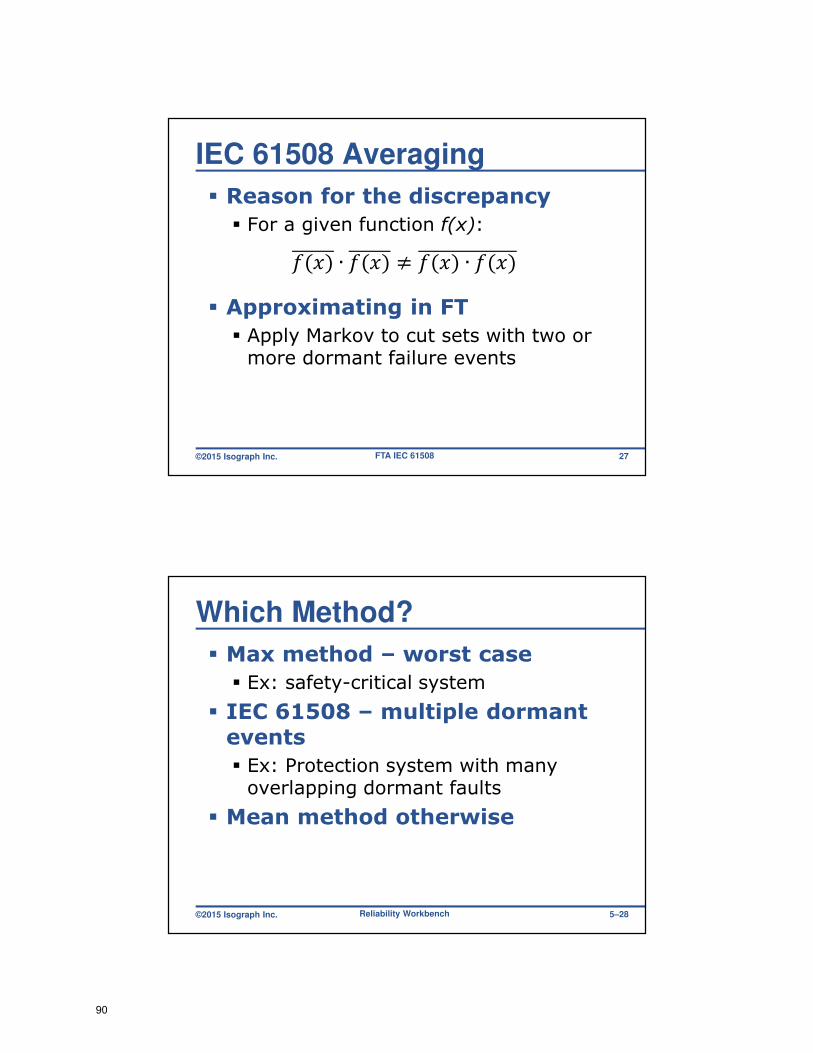
IEC 61508 Averaging
� Reason for the discrepancy
� For a given function f(x):
� Approximating in FT
� Apply Markov to cut sets with two or more dormant failure events
FTA IEC 61508
�(�) ∙ �(�) ≠ �(�) ∙ �(�)
27
©2015 Isograph Inc.
Which Method?
� Max method – worst case
� Ex: safety-critical system
� IEC 61508 – multiple dormant events
� Ex: Protection system with many overlapping dormant faults
� Mean method otherwise
Reliability Workbench 5–28
90
©2015 Isograph Inc.
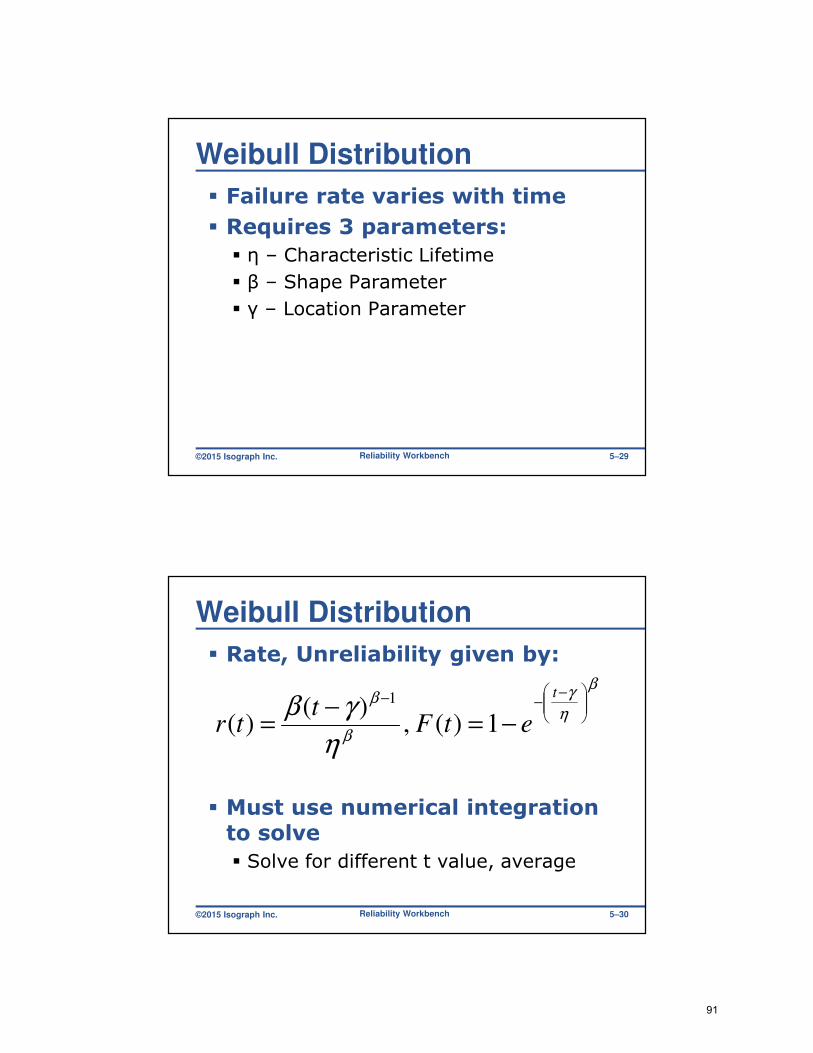
Weibull Distribution
� Failure rate varies with time
� Requires 3 parameters:
� η – Characteristic Lifetime
� β – Shape Parameter
� γ – Location Parameter
Reliability Workbench 5–29
©2015 Isograph Inc.
Weibull Distribution
� Rate, Unreliability given by:
� Must use numerical integration to solve
� Solve for different t value, average
Reliability Workbench 5–30
β
η
γ
β
β
η
γβ
−−−
−=−
=
t
etFt
tr 1)( ,)(
)(1
91
©2015 Isograph Inc.
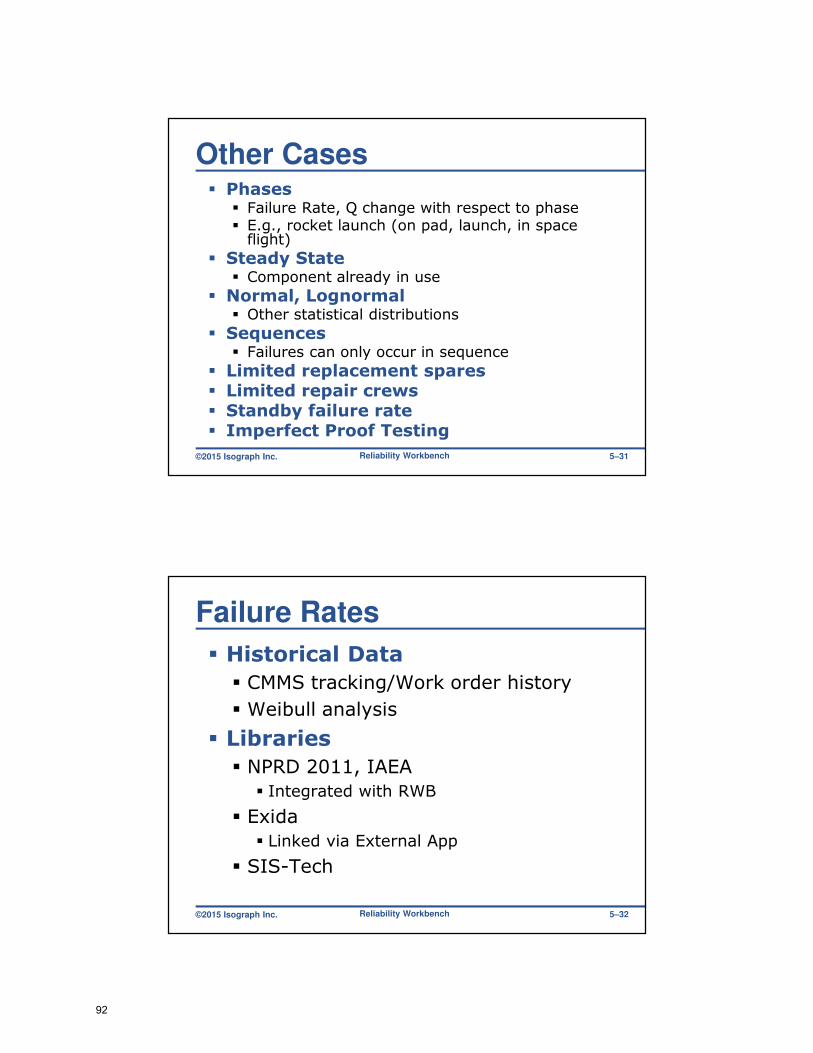
Other Cases� Phases
� Failure Rate, Q change with respect to phase� E.g., rocket launch (on pad, launch, in space flight)
� Steady State� Component already in use
� Normal, Lognormal� Other statistical distributions
� Sequences� Failures can only occur in sequence
� Limited replacement spares� Limited repair crews� Standby failure rate� Imperfect Proof Testing
Reliability Workbench 5–31
©2015 Isograph Inc.
Failure Rates
� Historical Data
� CMMS tracking/Work order history
� Weibull analysis
� Libraries
� NPRD 2011, IAEA
� Integrated with RWB
� Exida
� Linked via External App
� SIS-Tech
Reliability Workbench 5–32
92
©2015 Isograph Inc.
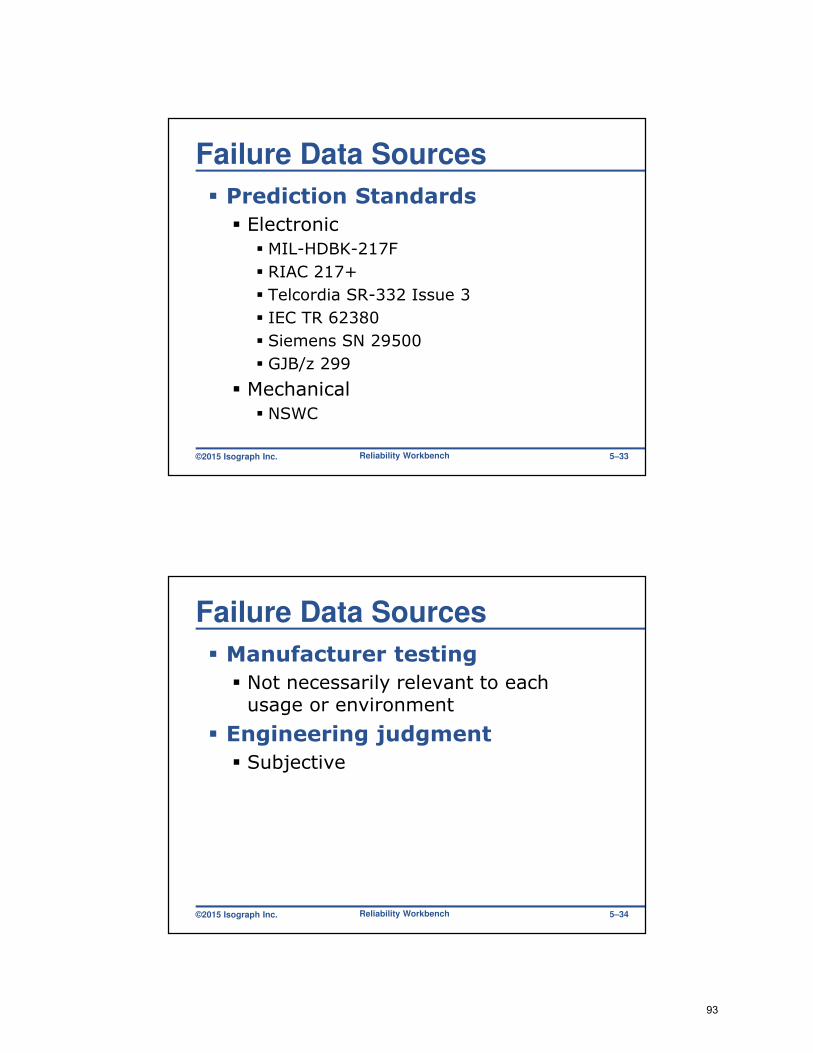
Failure Data Sources
� Prediction Standards
� Electronic
� MIL-HDBK-217F
� RIAC 217+
� Telcordia SR-332 Issue 3
� IEC TR 62380
� Siemens SN 29500
� GJB/z 299
� Mechanical
� NSWC
Reliability Workbench 5–33
©2015 Isograph Inc.
Failure Data Sources
� Manufacturer testing
� Not necessarily relevant to each usage or environment
� Engineering judgment
� Subjective
Reliability Workbench 5–34
93
©2015 Isograph Inc.
End of Chapter 5
� Summary
� Common model parameters
� Common event failure characteristics
Reliability Workbench 5–35
94
©2015 Isograph Inc.
System QuantificationChapter 6
Reliability Workbench 6–1
©2015 Isograph Inc.
System Quantification
� Determine cut sets
� Solve Q and ω
� For basic events
� For cut sets (multiplication law)
� For TOP events (addition law)
� Use TOP event Q and ω to solve:
� TDT, W, F, CFI
Reliability Workbench 6–2
95
©2015 Isograph Inc.
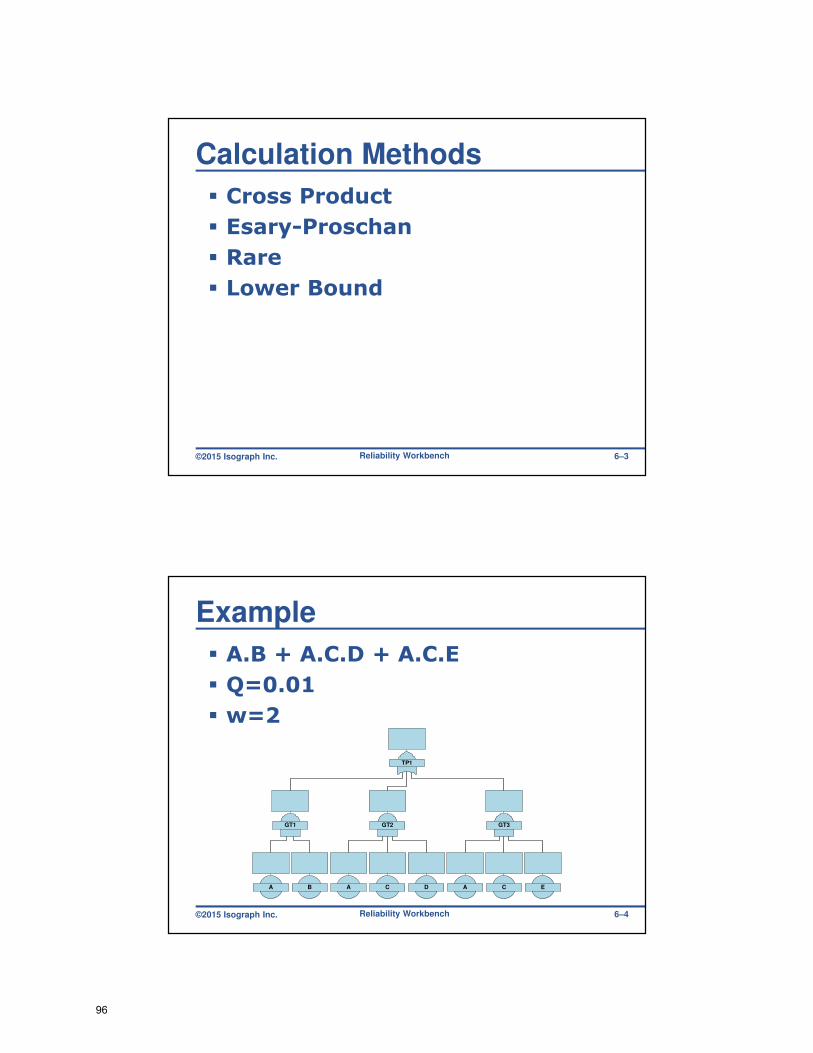
Calculation Methods
� Cross Product
� Esary-Proschan
� Rare
� Lower Bound
Reliability Workbench 6–3
©2015 Isograph Inc.
Example
� A.B + A.C.D + A.C.E
� Q=0.01
� w=2
Reliability Workbench 6–4
TP1
GT1 GT2 GT3
A B A C D A C E
96

©2015 Isograph Inc.
Minimal Cut Set Q and ω
� Multiplication law
� n = number of events in cut set
∑ ∏
∏
= ≠=
=
=
=
n
j
n
jii
ijcut
n
i
icut
Q
tQtQ
1 ,1
1
)()(
ωω
Reliability Workbench 6–5
©2015 Isograph Inc.
ExampleCut Set Q and ω
QAB = 0.01 × 0.01 = 10-4
QACD = 0.01 × 0.01 × 0.01 = 10-6
QACE = 0.01 × 0.01 × 0.01 = 10-6
ωAB = ωA QB + ωB QA = 2 × 0.01 + 2 × 0.01 = 0.04
ωACD = ωA QC QD + ωC QA QD + ωD QA QC
= 2 × 0.01 × 0.01 + 2 × 0.01 × 0.01 + 2 × 0.01 × 0.01 = 0.0006
ωACE = ωA QC QE + ωC QA QE + ωE QA QC
= 2 × 0.01 × 0.01 + 2 × 0.01 × 0.01 + 2 × 0.01 × 0.01 = 0.0006
Reliability Workbench 6–6
97
©2015 Isograph Inc.
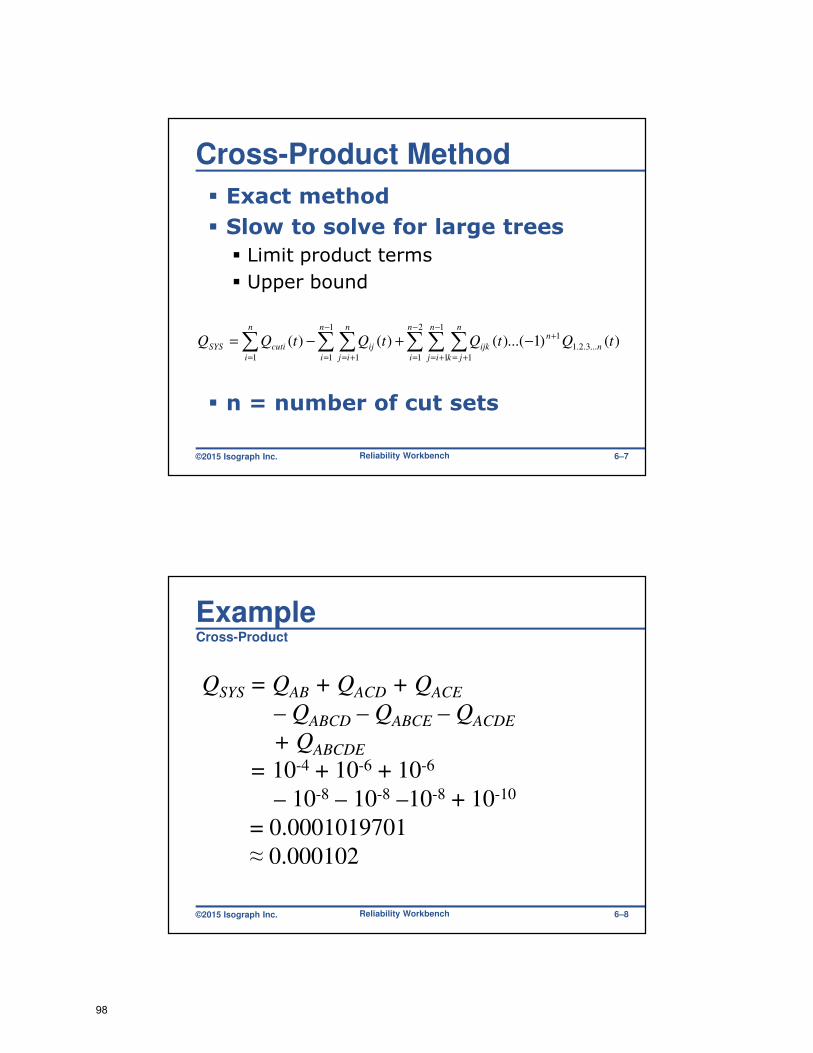
Cross-Product Method
� Exact method
� Slow to solve for large trees
� Limit product terms
� Upper bound
� n = number of cut sets
)()1...()()()( ...3.2.1
12
1
1
1 1
1
1 11
tQtQtQtQQ n
nn
i
n
ij
n
jk
ijk
n
i
n
ij
ij
n
i
cutiSYS
+
−
=
−
+= +=
−
= +==
−+−= ∑∑ ∑∑ ∑∑
Reliability Workbench 6–7
©2015 Isograph Inc.
ExampleCross-Product
QSYS = QAB + QACD + QACE
– QABCD – QABCE – QACDE
+ QABCDE
= 10-4 + 10-6 + 10-6
– 10-8 – 10-8 –10-8 + 10-10
= 0.0001019701
≈ 0.000102
Reliability Workbench 6–8
98
©2015 Isograph Inc.
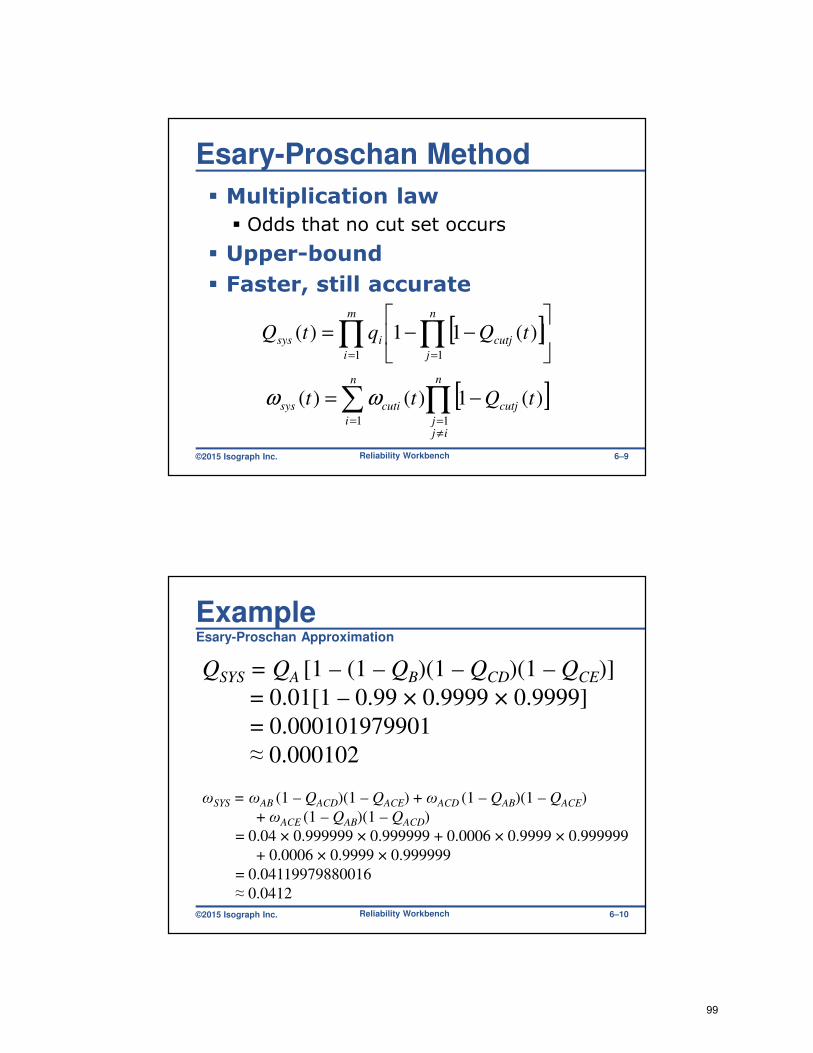
Esary-Proschan Method
� Multiplication law
� Odds that no cut set occurs
� Upper-bound
� Faster, still accurate
[ ]
[ ]∏∑
∏∏
≠
==
==
−=
−−=
n
ijj
cutj
n
i
cutisys
n
j
cutj
m
i
isys
tQtt
tQqtQ
11
11
)(1)()(
)(11)(
ωω
Reliability Workbench 6–9
©2015 Isograph Inc.
ExampleEsary-Proschan Approximation
QSYS = QA [1 – (1 – QB)(1 – QCD)(1 – QCE)]
= 0.01[1 – 0.99 × 0.9999 × 0.9999]
= 0.000101979901
≈ 0.000102
ωSYS = ωAB (1 – QACD)(1 – QACE) + ωACD (1 – QAB)(1 – QACE)
+ ωACE (1 – QAB)(1 – QACD)
= 0.04 × 0.999999 × 0.999999 + 0.0006 × 0.9999 × 0.999999
+ 0.0006 × 0.9999 × 0.999999
= 0.04119979880016
≈ 0.0412
Reliability Workbench 6–10
99

©2015 Isograph Inc.
Rare Approximation
� Cross Product — First iteration
� Upper bound
� Fastest
� Less accurate for Q > 0.2
)()(
)()(
1
1
tt
tQtQ
n
i
cutiSYS
n
i
cutiSYS
∑
∑
=
=
=
=
ωω
Reliability Workbench 6–11
©2015 Isograph Inc.
ExampleRare Approximation
QSYS = QAB + QACD + QACE
= 10-4 + 10-6 + 10-6
= 0.000102
ωSYS = 0.04 + 0.0006 + 0.0006
= 0.0412
Reliability Workbench 6–12
100
©2015 Isograph Inc.
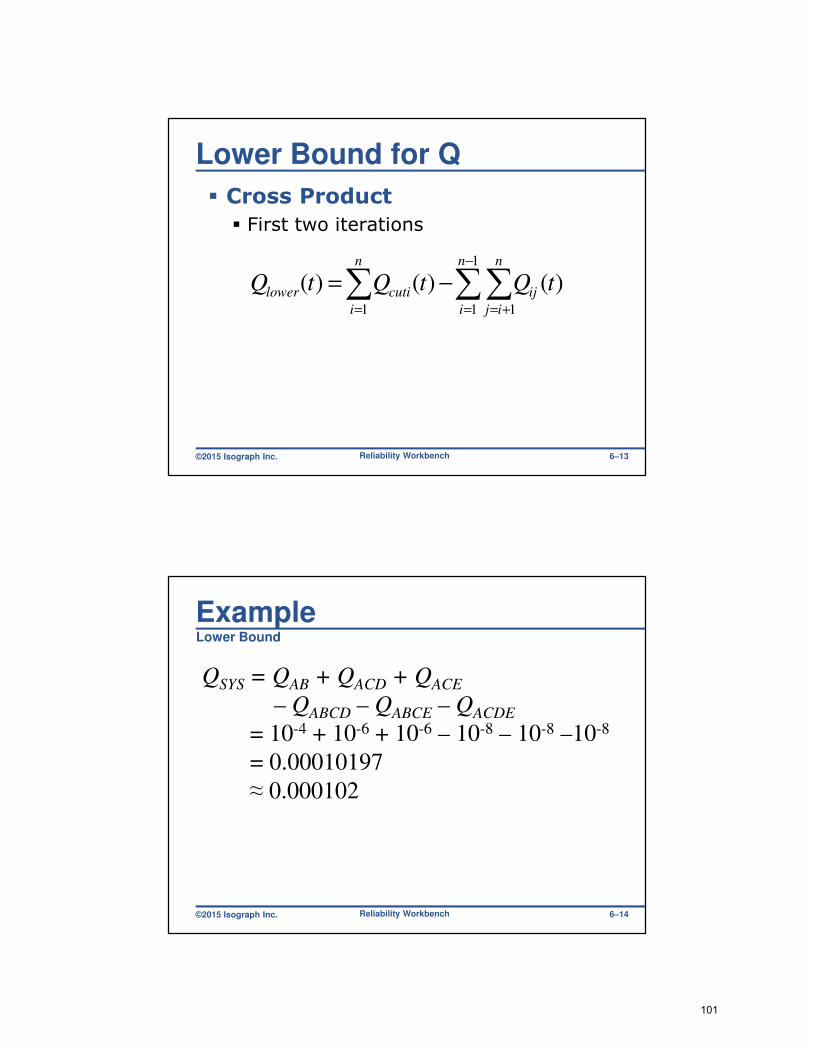
Lower Bound for Q
� Cross Product
� First two iterations
)()()(1
1 11
tQtQtQn
i
n
ij
ij
n
i
cutilower ∑∑∑−
= +==
−=
Reliability Workbench 6–13
©2015 Isograph Inc.
ExampleLower Bound
QSYS = QAB + QACD + QACE
– QABCD – QABCE – QACDE
= 10-4 + 10-6 + 10-6 – 10-8 – 10-8 –10-8
= 0.00010197
≈ 0.000102
Reliability Workbench 6–14
101
©2015 Isograph Inc.
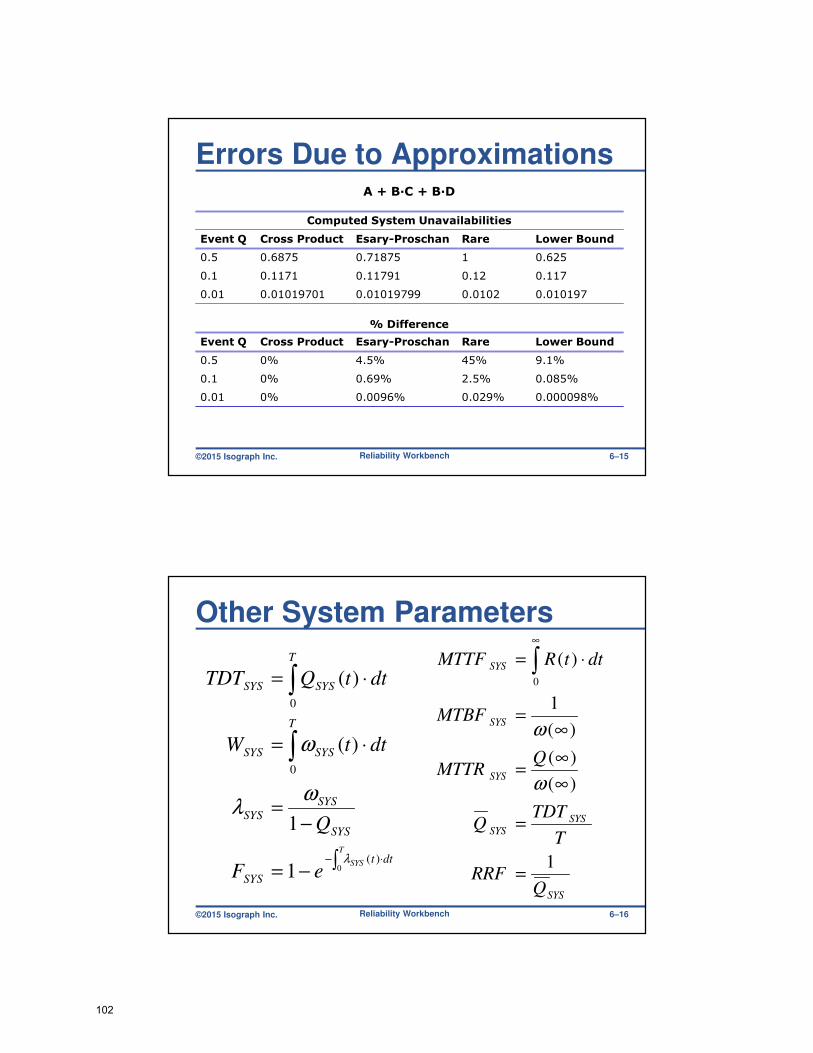
Errors Due to ApproximationsA + B·C + B·D
Computed System Unavailabilities
Event Q Cross Product Esary-Proschan Rare Lower Bound
0.5 0.6875 0.71875 1 0.625
0.1 0.1171 0.11791 0.12 0.117
0.01 0.01019701 0.01019799 0.0102 0.010197
% Difference
Event Q Cross Product Esary-Proschan Rare Lower Bound
0.5 0% 4.5% 45% 9.1%
0.1 0% 0.69% 2.5% 0.085%
0.01 0% 0.0096% 0.029% 0.000098%
Reliability Workbench 6–15
©2015 Isograph Inc.
Other System Parameters
∫−=
−
=
⋅=
⋅=
⋅−
∫
∫
T
SYS dtt
SYS
SYS
SYS
SYS
T
SYSSYS
T
SYSSYS
eF
Q
dttW
dttQTDT
0)(
0
0
1
1
)(
)(
λ
ωλ
ω
SYS
SYS
SYS
SYS
SYS
SYS
QRRF
T
TDTQ
QMTTR
MTBF
dttRMTTF
1
)(
)(
)(
1
)(0
=
=
∞
∞=
∞
=
⋅= ∫∞
ω
ω
Reliability Workbench 6–16
102
©2015 Isograph Inc.
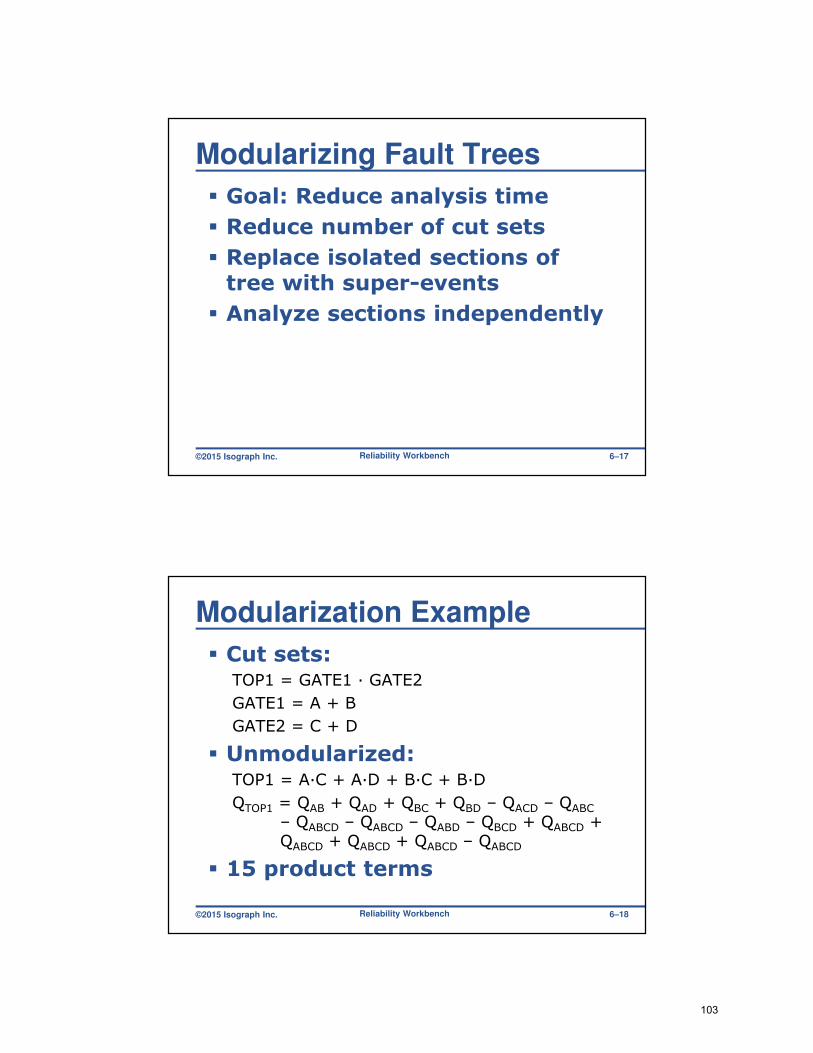
Modularizing Fault Trees
� Goal: Reduce analysis time
� Reduce number of cut sets
� Replace isolated sections of tree with super-events
� Analyze sections independently
Reliability Workbench 6–17
©2015 Isograph Inc.
Modularization Example
� Cut sets:TOP1 = GATE1 · GATE2
GATE1 = A + B
GATE2 = C + D
� Unmodularized:TOP1 = A·C + A·D + B·C + B·D
QTOP1 = QAB + QAD + QBC + QBD – QACD – QABC
– QABCD – QABCD – QABD – QBCD + QABCD + QABCD + QABCD + QABCD – QABCD
� 15 product terms
Reliability Workbench 6–18
103
©2015 Isograph Inc.
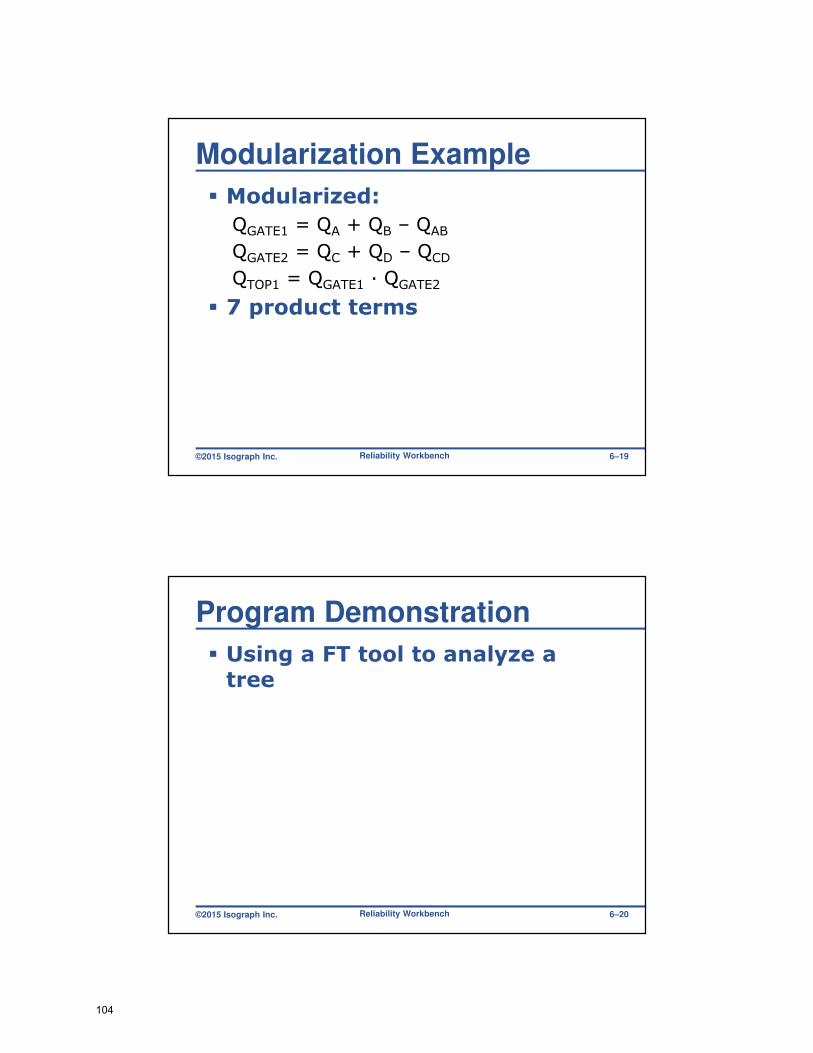
Modularization Example
� Modularized:
QGATE1 = QA + QB – QAB
QGATE2 = QC + QD – QCD
QTOP1 = QGATE1 · QGATE2
� 7 product terms
Reliability Workbench 6–19
©2015 Isograph Inc.
Program Demonstration
� Using a FT tool to analyze a tree
Reliability Workbench 6–20
104
©2015 Isograph Inc.
End of Chapter 6
� Summary
� Approximation methods
� Cross Product, Esary-Proschan, Rare, Lower Bound
� Differences
� Other parameters
� Modularization
Reliability Workbench 6–21
105

©2015 Isograph Inc.
Importance AnalysisChapter 7
Reliability Workbench 7–1
©2015 Isograph Inc.
Importance Analysis
� Helps determine:
� Event contribution to TOP event
� TOP event sensitivity to event changes
� Weak areas in the system
� Where to cut corners
� Useful during the design stage
Reliability Workbench 7–2
106

©2015 Isograph Inc.
Importance Measures
� Fussell-Vesely Importance
� Birnbaum Importance
� Barlow-Proschan Importance
� Sequential Importance
� Risk Reduction Worth
� Risk Achievement Worth
Reliability Workbench 7–3
©2015 Isograph Inc.
Fussell-Vesely Importance
� Contribution to system Q
� High F-V Importance — worst actor
� Decreasing Q on these events = biggest decrease to system Q
� Percentage of failures involving the event
SYS
iSYSSYSFV
iQ
qQQI
)0( =−
=
Reliability Workbench 7–4
107

©2015 Isograph Inc.
Birnbaum Importance
� Sensitivity of system Q
� High Birnbaum — highly sensitive
� Increasing Q on these events = biggest increase in system Q
i
n
j
cutj
BB
iq
Q
I
∑=
≈1
Where n = number of cut sets containing event iReliability Workbench 7–5
©2015 Isograph Inc.
Barlow-Proschan Importance
� Contribution to ω as initiator
� Last to fail
� Probability system fails because event failed last
� Sum of frequency terms with event as initiator ÷ system ω
SYS
n
j
cutji
BP
i
Q
Iω
ω∑=
=1
Qcutj = product of events in j-th cut set, excluding event i
Reliability Workbench 7–6
108
©2015 Isograph Inc.
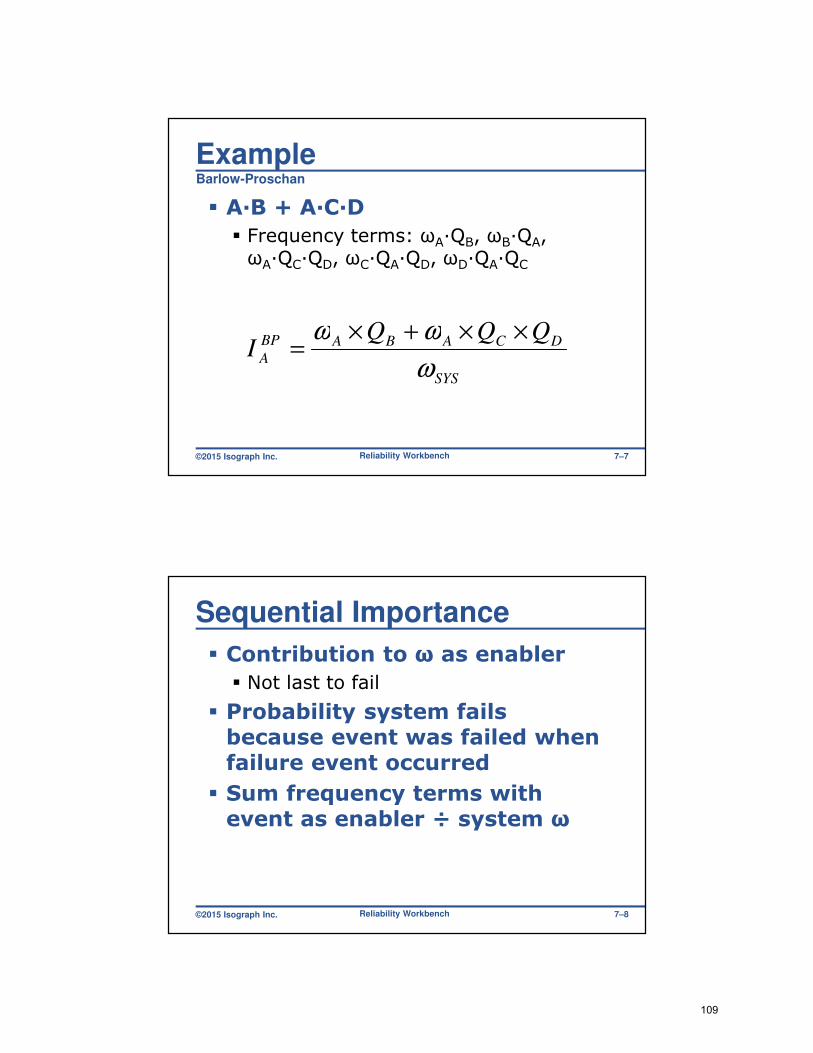
ExampleBarlow-Proschan
� A·B + A·C·D
� Frequency terms: ωA·QB, ωB·QA, ωA·QC·QD, ωC·QA·QD, ωD·QA·QC
SYS
DCABABP
A
QQQI
ω
ωω ××+×
=
Reliability Workbench 7–7
©2015 Isograph Inc.
Sequential Importance
� Contribution to ω as enabler
� Not last to fail
� Probability system fails because event was failed when failure event occurred
� Sum frequency terms with event as enabler ÷ system ω
Reliability Workbench 7–8
109
©2015 Isograph Inc.
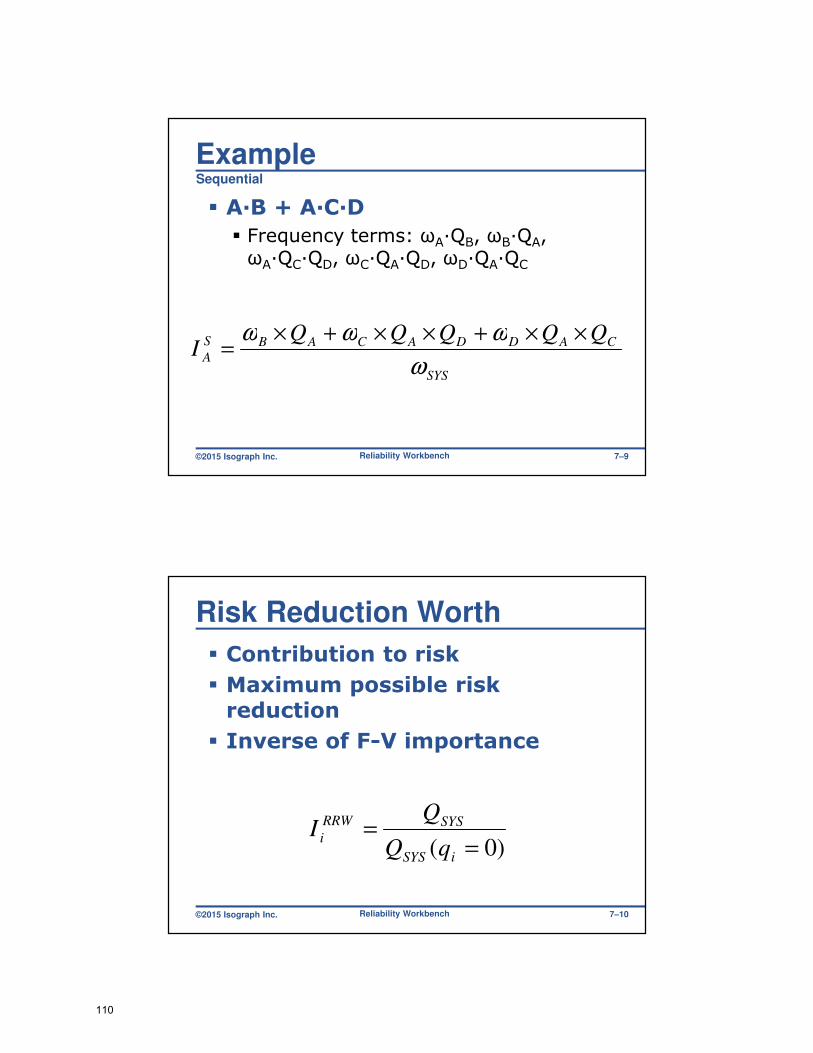
ExampleSequential
� A·B + A·C·D
� Frequency terms: ωA·QB, ωB·QA, ωA·QC·QD, ωC·QA·QD, ωD·QA·QC
SYS
CADDACABS
A
QQQQQI
ω
ωωω ××+××+×
=
Reliability Workbench 7–9
©2015 Isograph Inc.
Risk Reduction Worth
� Contribution to risk
� Maximum possible risk reduction
� Inverse of F-V importance
)0( =
=
iSYS
SYSRRW
iqQ
QI
Reliability Workbench 7–10
110
©2015 Isograph Inc.
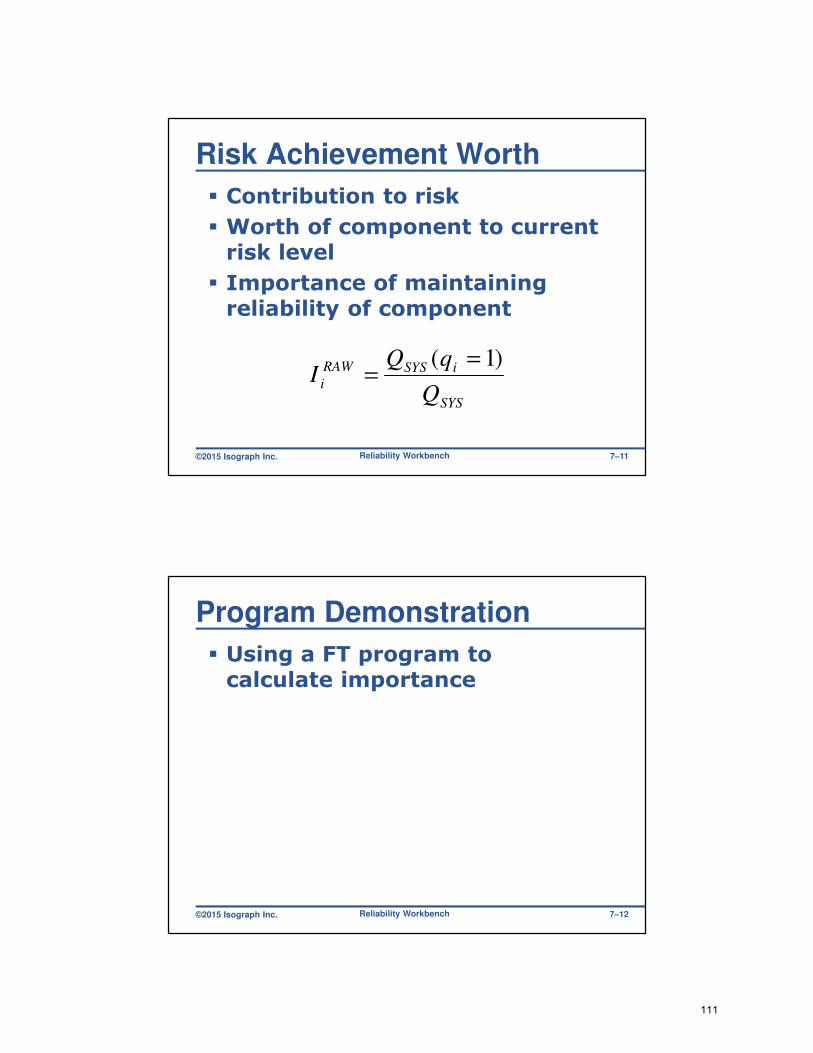
Risk Achievement Worth
� Contribution to risk
� Worth of component to current risk level
� Importance of maintaining reliability of component
SYS
iSYSRAW
iQ
qQI
)1( =
=
Reliability Workbench 7–11
©2015 Isograph Inc.
Program Demonstration
� Using a FT program to calculate importance
Reliability Workbench 7–12
111
©2015 Isograph Inc.
End of Chapter 7
� Summary
� Importance analysis
� Fussell-Vesely, Birnbaum, Barlow-Proschan, Sequential, Risk Reduction, Risk Achievement
Reliability Workbench 7–13
112
©2015 Isograph Inc.
Common Cause FailuresChapter 8
Reliability Workbench 8–1
©2015 Isograph Inc.
Common Cause Failures� Affect multiple otherwise independent components� System, component and operator failures
� Environment� Maintenance and testing� Manufacturer� Installation� Calibration� External impacts� Stress� Ageing
Reliability Workbench 8–2
113
©2015 Isograph Inc.
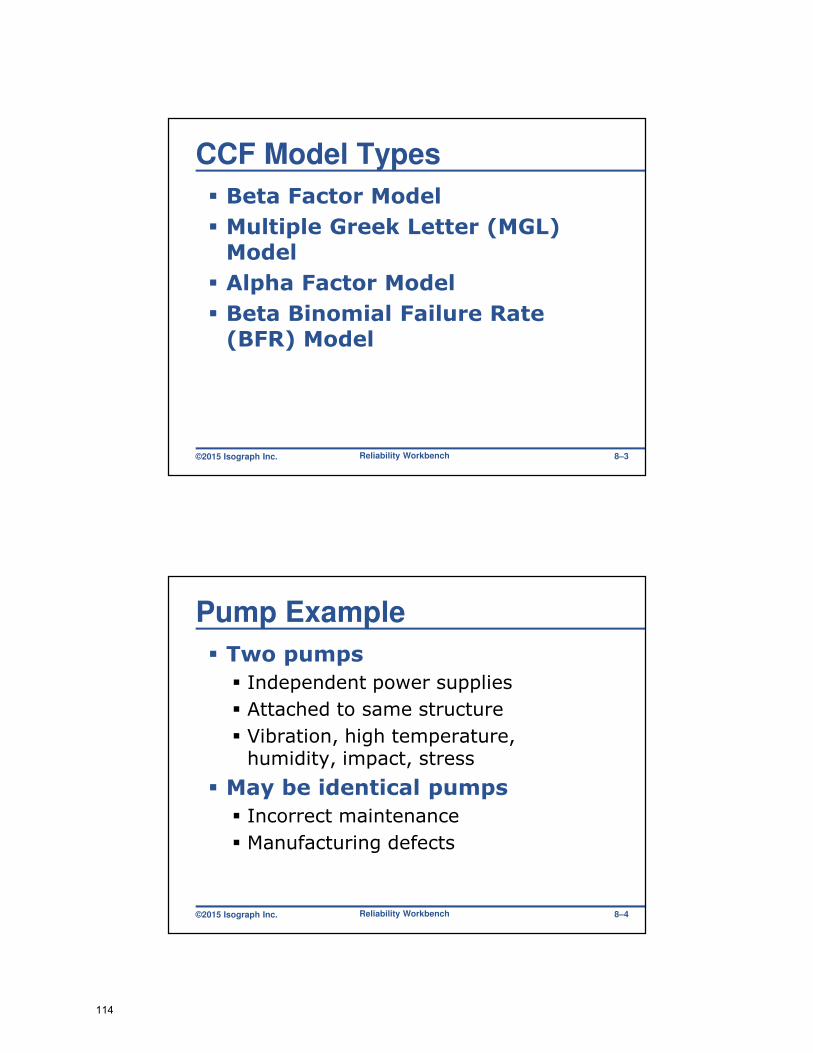
CCF Model Types
� Beta Factor Model
� Multiple Greek Letter (MGL) Model
� Alpha Factor Model
� Beta Binomial Failure Rate (BFR) Model
Reliability Workbench 8–3
©2015 Isograph Inc.
Pump Example
� Two pumps
� Independent power supplies
� Attached to same structure
� Vibration, high temperature, humidity, impact, stress
� May be identical pumps
� Incorrect maintenance
� Manufacturing defects
Reliability Workbench 8–4
114
©2015 Isograph Inc.
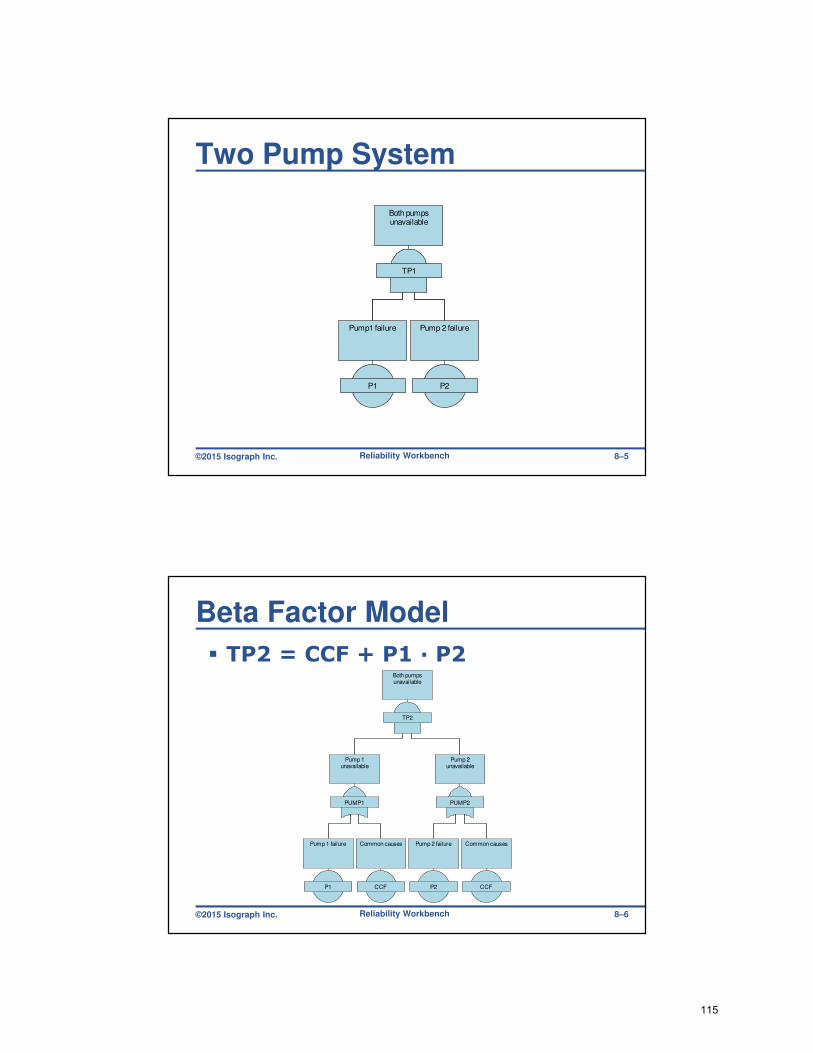
Two Pump System
TP1
Both pumps unavailable
P1
Pump1 failure
P2
Pump 2 failure
Reliability Workbench 8–5
©2015 Isograph Inc.
Beta Factor Model
� TP2 = CCF + P1 · P2
TP2
Both pumps unavailable
PUMP1
Pump 1 unavailable
PUMP2
Pump 2 unavailable
P1
Pump 1 failure
CCF
Common causes
P2
Pump 2 failure
CCF
Common causes
Reliability Workbench 8–6
115
©2015 Isograph Inc.
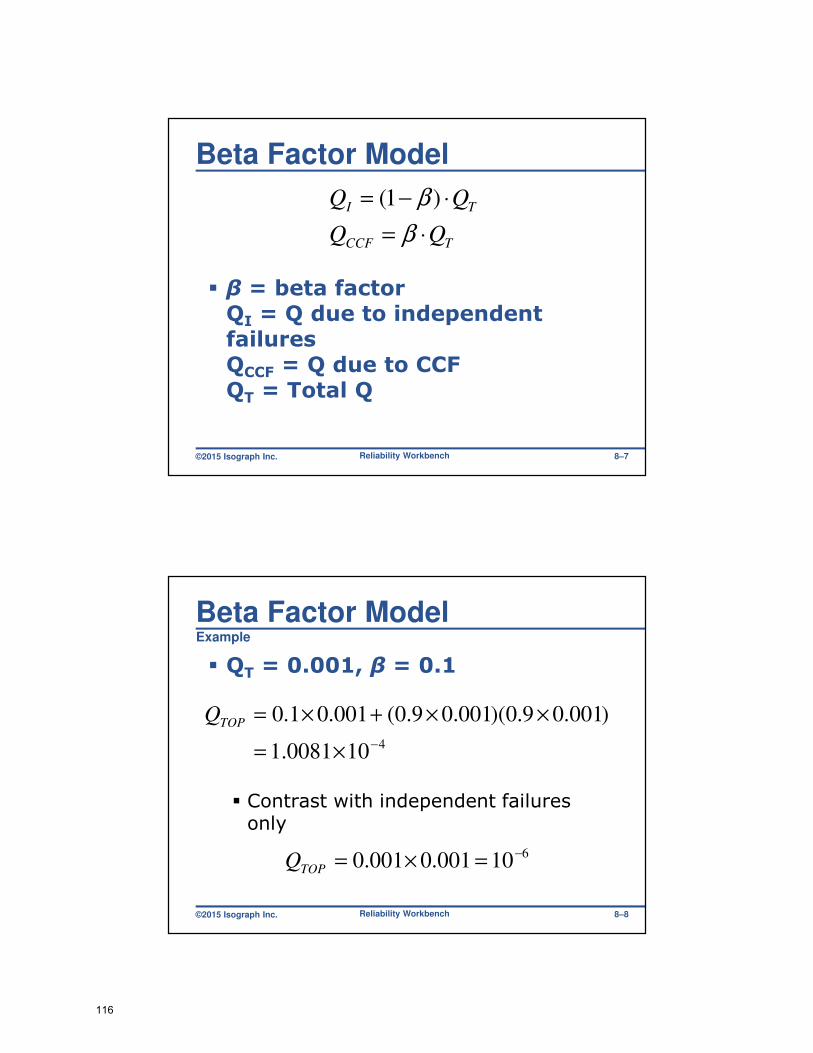
Beta Factor Model
� β = beta factorQI = Q due to independent failuresQCCF = Q due to CCFQT = Total Q
TCCF
TI
⋅=
⋅−=
β
β )1(
Reliability Workbench 8–7
©2015 Isograph Inc.
Beta Factor ModelExample
� QT = 0.001, β = 0.1
� Contrast with independent failures only
4100081.1
)001.09.0)(001.09.0(001.01.0
−
×=
××+×=TOPQ
610001.0001.0 −
=×=TOPQ
Reliability Workbench 8–8
116
©2015 Isograph Inc.
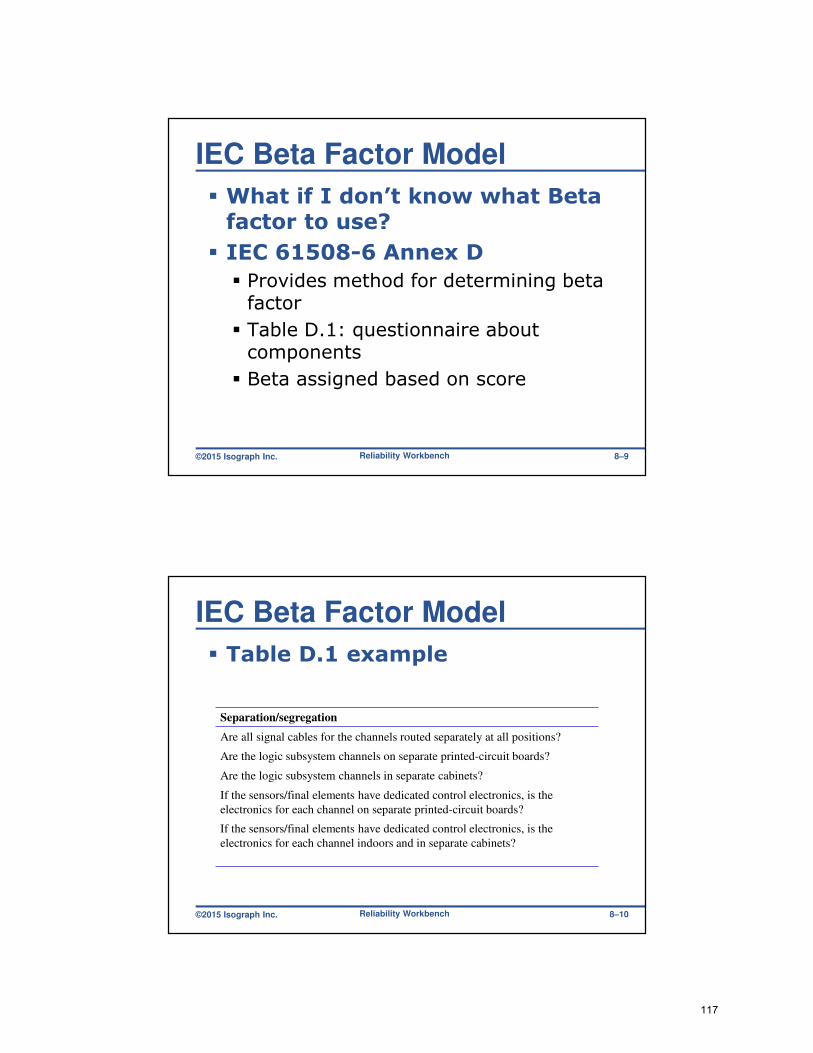
IEC Beta Factor Model
� What if I don’t know what Beta factor to use?
� IEC 61508-6 Annex D
� Provides method for determining beta factor
� Table D.1: questionnaire about components
� Beta assigned based on score
Reliability Workbench 8–9
©2015 Isograph Inc.
IEC Beta Factor Model
� Table D.1 example
Reliability Workbench
Separation/segregation
Are all signal cables for the channels routed separately at all positions?
Are the logic subsystem channels on separate printed-circuit boards?
Are the logic subsystem channels in separate cabinets?
If the sensors/final elements have dedicated control electronics, is the
electronics for each channel on separate printed-circuit boards?
If the sensors/final elements have dedicated control electronics, is the
electronics for each channel indoors and in separate cabinets?
8–10
117

©2015 Isograph Inc.
CCF Models
� Beta factor: “All or nothing”
� CCFs affect either all components in group, or none
Reliability Workbench
TP2
All sensors failed
SENSOR1
Sensor 1 failed
SENSOR2
Sensor 2 failed
SENSOR3
Sensor 3 failed
S1
Sensor 1 failure
CCF
All sensors faildue to common
causes
S2
Sensor 2 failure
CCF
All sensors faildue to common
causes
S3
Sensor 3 failure
CCF
All sensors faildue to common
causes
8–11
©2015 Isograph Inc.
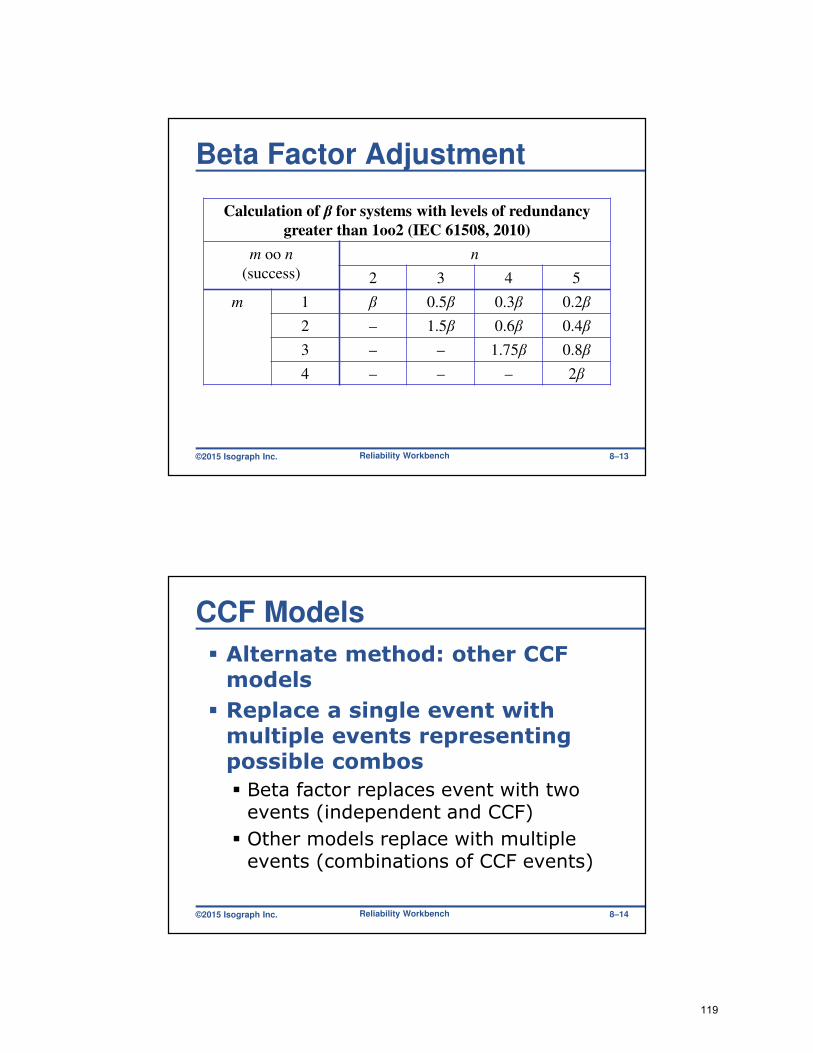
Beta Factor Adjustment
� Applying Beta factor to CCF group of 3 or more can be pessimistic
� Less likely that CCF will affect all rather than some
� Can adjust beta factor to compensate
� IEC 61508, 2010 has a table for this
Reliability Workbench 8–12
118
©2015 Isograph Inc.
Beta Factor Adjustment
Calculation of β for systems with levels of redundancy
greater than 1oo2 (IEC 61508, 2010)
m oo n
(success)
n
2 3 4 5
m 1 β 0.5β 0.3β 0.2β
2 – 1.5β 0.6β 0.4β
3 – – 1.75β 0.8β
4 – – – 2β
Reliability Workbench 8–13
©2015 Isograph Inc.
CCF Models
� Alternate method: other CCF models
� Replace a single event with multiple events representing possible combos
� Beta factor replaces event with two events (independent and CCF)
� Other models replace with multiple events (combinations of CCF events)
Reliability Workbench 8–14
119
©2015 Isograph Inc.
CCF Models
� Example: CCF Group A, B, C, D
� Event A replaced in cut sets with:
� A + [AB] + [AC] + [AD] + [ABC] + [ABD] + [ACD] + [ABCD]
� A represents independent failure
� [] represent CCF event affecting those components
� [ACD] represents CCF of A, C, and D
Reliability Workbench 8–15
©2015 Isograph Inc.
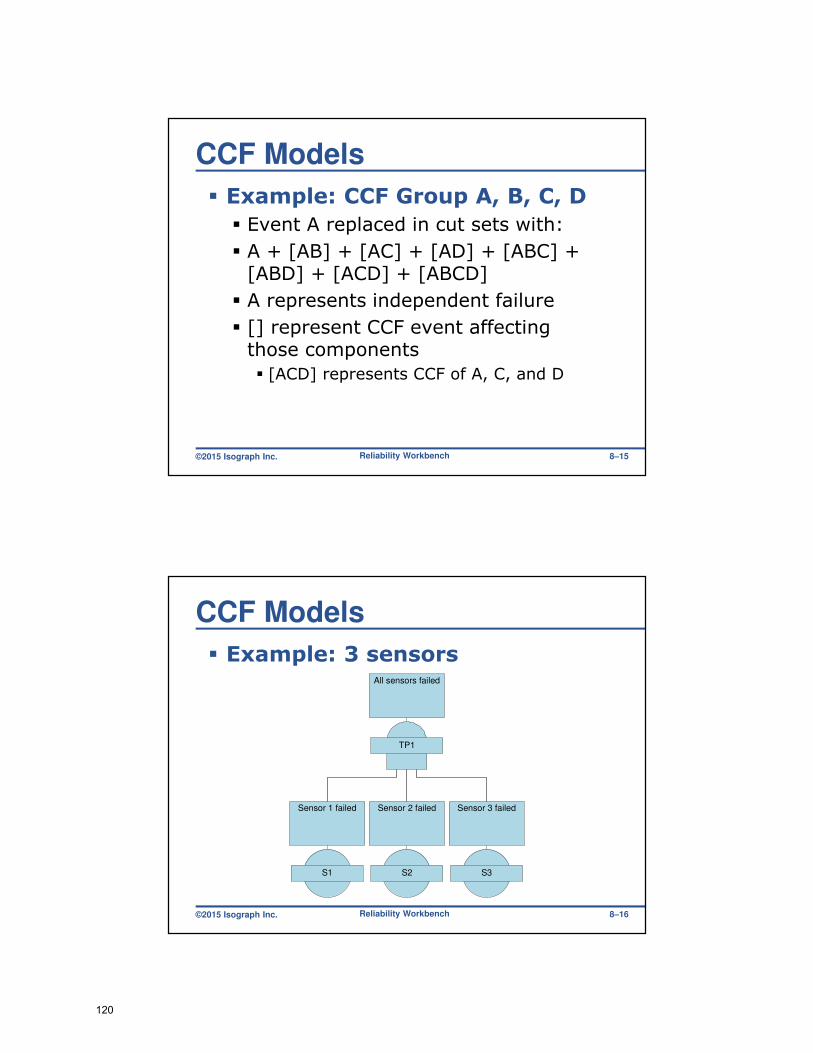
CCF Models
� Example: 3 sensors
Reliability Workbench
TP1
All sensors failed
S1
Sensor 1 failed
S2
Sensor 2 failed
S3
Sensor 3 failed
8–16
120
©2015 Isograph Inc.
CCF Models
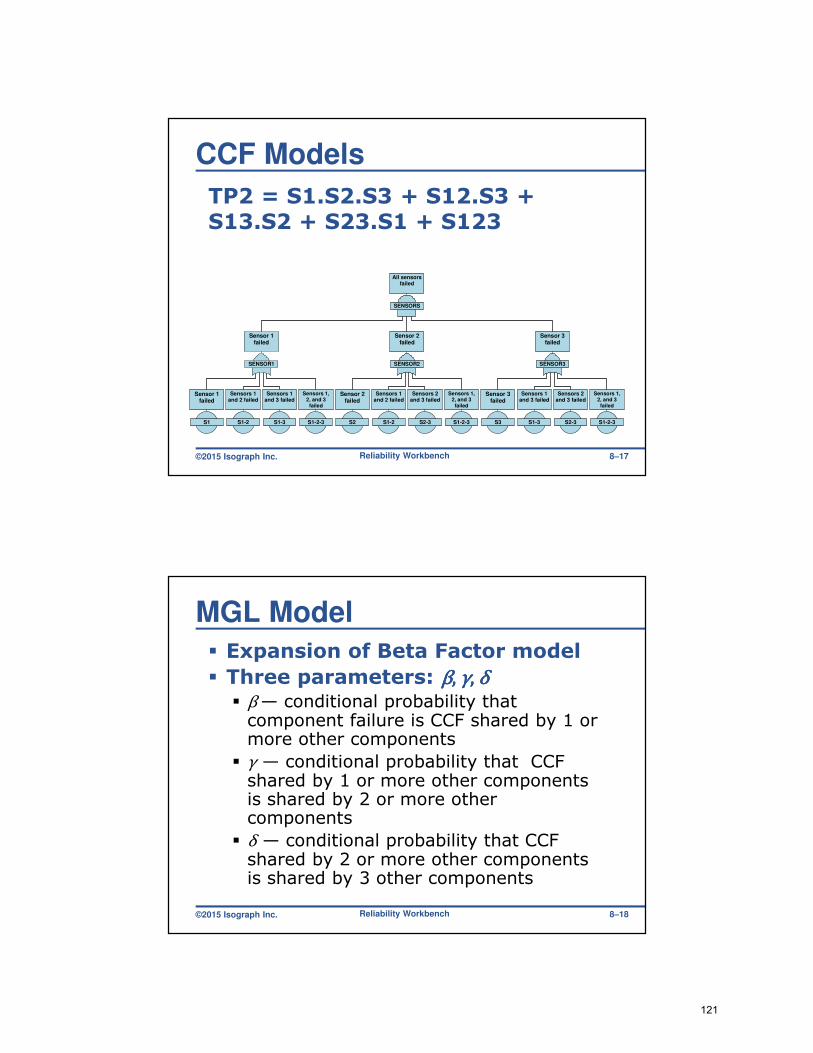
TP2 = S1.S2.S3 + S12.S3 + S13.S2 + S23.S1 + S123
Reliability Workbench
SENSORS
All sensorsfailed
SENSOR1
Sensor 1failed
SENSOR2
Sensor 2failed
SENSOR3
Sensor 3failed
S1
Sensor 1failed
S1-2
Sensors 1and 2 failed
S1-3
Sensors 1and 3 failed
S1-2-3
Sensors 1,2, and 3
failed
S2
Sensor 2failed
S1-2
Sensors 1and 2 failed
S2-3
Sensors 2and 3 failed
S1-2-3
Sensors 1,2, and 3
failed
S3
Sensor 3failed
S1-3
Sensors 1and 3 failed
S2-3
Sensors 2and 3 failed
S1-2-3
Sensors 1,2, and 3failed
8–17
©2015 Isograph Inc.
MGL Model
� Expansion of Beta Factor model
� Three parameters: ββββ,,,, γγγγ,,,, δδδδ� β — conditional probability that component failure is CCF shared by 1 or more other components
� γ — conditional probability that CCF shared by 1 or more other components is shared by 2 or more other components
� δ — conditional probability that CCF shared by 2 or more other components is shared by 3 other components
Reliability Workbench 8–18
121
©2015 Isograph Inc.
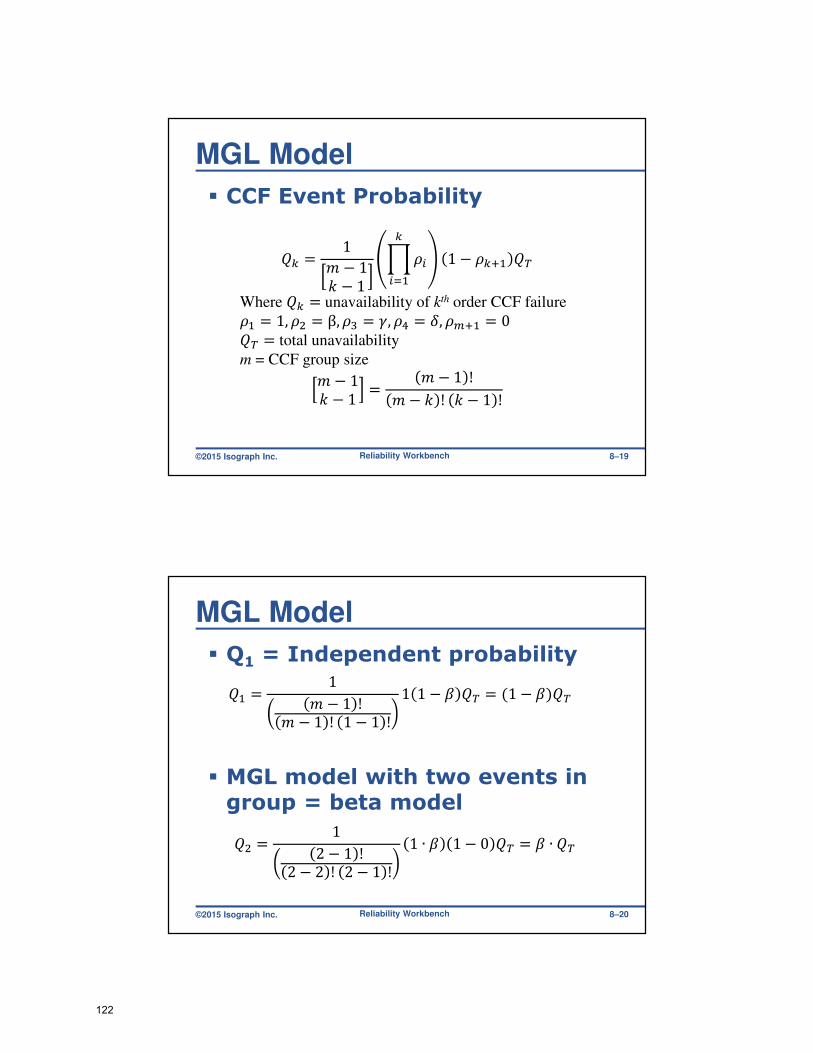
MGL Model
� CCF Event Probability
Reliability Workbench
�� = 1 − 1� − 1
� ��
���1 − ��� ��
Where �� = unavailability of kth order CCF failure
� = 1, � = β, � = �, � = �, ��� = 0�� = total unavailability
m = CCF group size
− 1� − 1 = − 1 !
− � ! � − 1 !
8–19
©2015 Isograph Inc.
MGL Model
� Q1 = Independent probability
� MGL model with two events in group = beta model
Reliability Workbench
�� = 12 − 1 !
2 − 2 ! 2 − 1 !1 ∙ � 1 − 0 �� = � ∙ ��
�� = 1 − 1 !
− 1 ! 1 − 1 !1 1 − � �� = (1 − �)��
8–20
122
©2015 Isograph Inc.
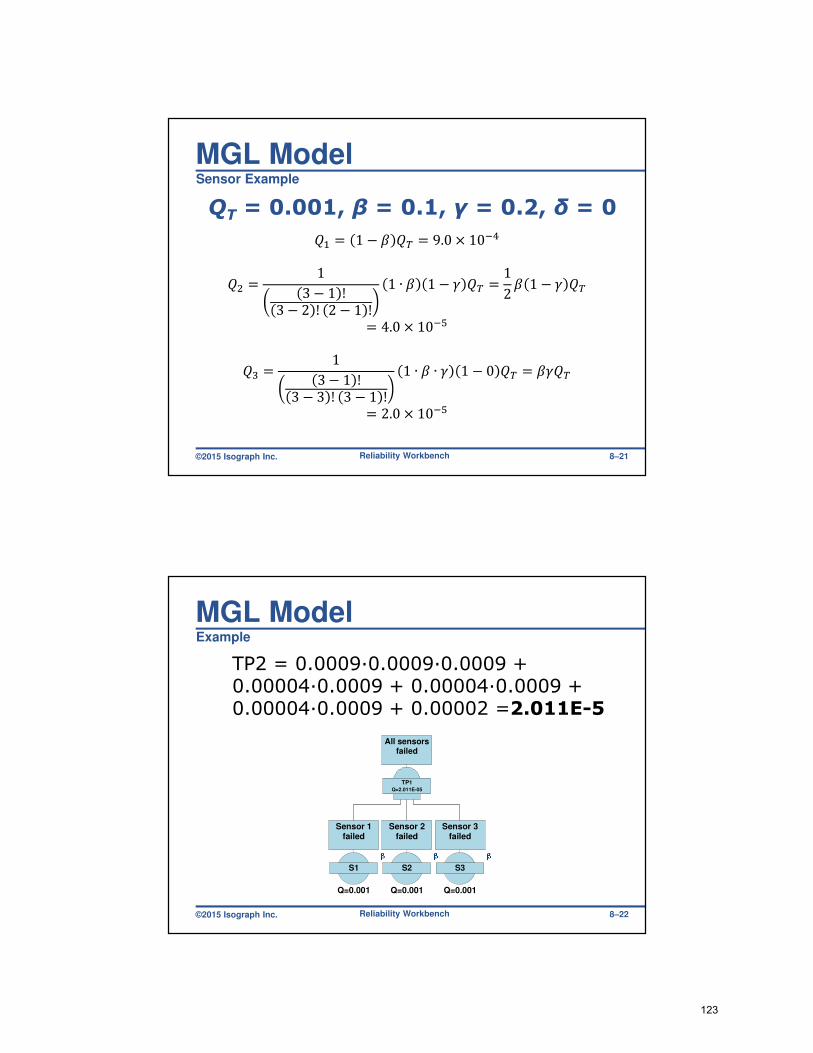
MGL ModelSensor Example
QT = 0.001, β = 0.1, γ = 0.2, δ = 0
Reliability Workbench
�� = 1 − � �� = 9.0 × 10#�
�� = 13 − 1 !
3 − 2 ! 2 − 1 !1 ∙ � 1 − � �� = 1
2 � 1 − � ��
= 4.0 × 10#&
�� = 13 − 1 !
3 − 3 ! 3 − 1 !1 ∙ � ∙ � 1 − 0 �� = ����
= 2.0 × 10#&
8–21
©2015 Isograph Inc.
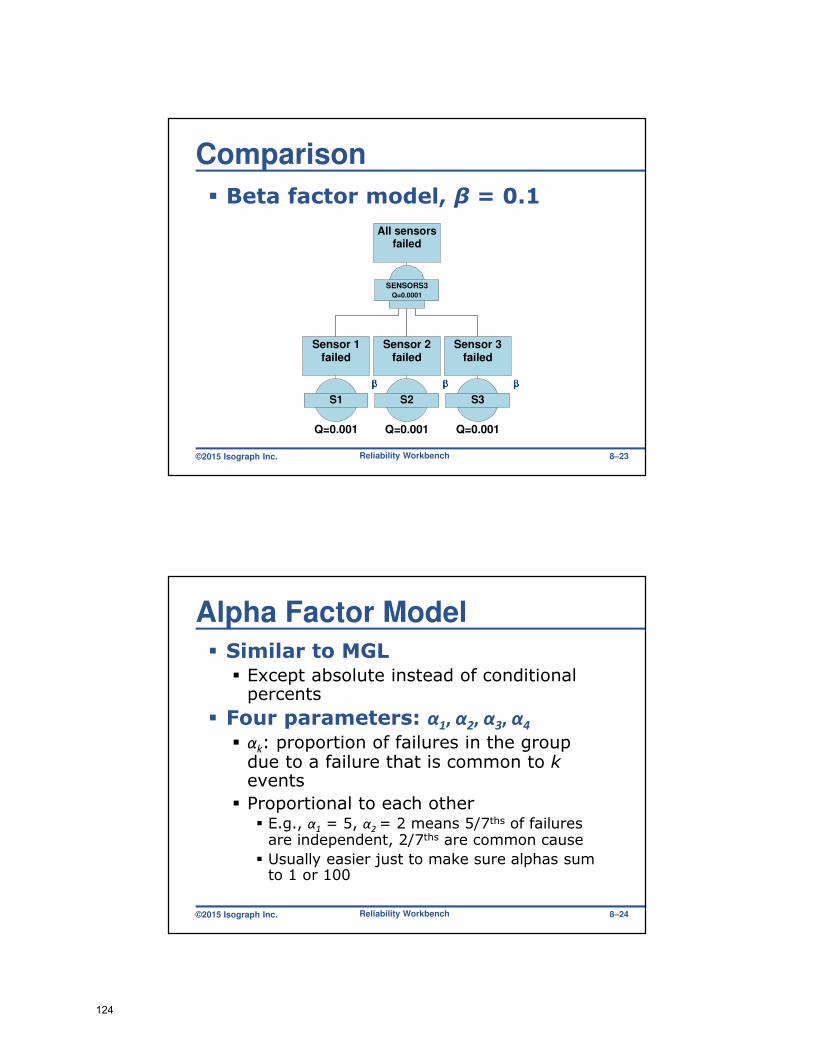
MGL ModelExample
TP2 = 0.0009∙0.0009∙0.0009 + 0.00004∙0.0009 + 0.00004∙0.0009 + 0.00004∙0.0009 + 0.00002 =2.011E-5
Reliability Workbench
TP1Q=2.011E-05
All sensorsfailed
S1
Sensor 1failed
Q=0.001
S2
Sensor 2failed
Q=0.001
S3
Sensor 3failed
Q=0.001
8–22
123
©2015 Isograph Inc.
Comparison
� Beta factor model, β = 0.1
Reliability Workbench
SENSORS3Q=0.0001
All sensorsfailed
S1
Sensor 1failed
Q=0.001
S2
Sensor 2failed
Q=0.001
S3
Sensor 3failed
Q=0.001
8–23
©2015 Isograph Inc.
Alpha Factor Model
� Similar to MGL� Except absolute instead of conditional percents
� Four parameters: α1, α
2, α
3, α
4
� αk: proportion of failures in the group
due to a failure that is common to kevents
� Proportional to each other� E.g., α
1= 5, α
2= 2 means 5/7ths of failures
are independent, 2/7ths are common cause
� Usually easier just to make sure alphas sum to 1 or 100
Reliability Workbench 8–24
124

©2015 Isograph Inc.
Alpha Factor Model
� CCF Event Probability
Reliability Workbench
�� = � − 1� − 1
'�'�
��
Where �� = unavailability of kth order CCF failure
�� = total unavailability
m = CCF group size
'� = ( )'��
���
− 1� − 1 = − 1 !
− � ! � − 1 !8–25
©2015 Isograph Inc.
Alpha Factor ModelSensors Example
QQQQTTTT = 0.001, = 0.001, = 0.001, = 0.001, αααα1111 = 0.9507, = 0.9507, = 0.9507, = 0.9507, αααα2222 = 0.04225, = 0.04225, = 0.04225, = 0.04225, αααα3333 = 0.007042= 0.007042= 0.007042= 0.007042
Reliability Workbench
'� = ( )'��
���= 0.9507 + 2 ∙ 0.04225 + 3 ∙ 0.007042 = 1.056
�� = 11 ∙ 0.9507
1.056 0.001 = 0.0009
�� = 22 ∙ 0.04225
1.056 0.001 = 4.0 × 10#&
�� = 31 ∙ 0.007042
1.056 0.001 = 2.0 × 10#&
8–26
125
©2015 Isograph Inc.
Program Demonstration
� CCF Model
� Include CCFs without another event
� Not recommended for system, component and operator failures
� Cut sets/Importance
Reliability Workbench 8–27
©2015 Isograph Inc.
End of Chapter 8
� Summary
� Model types
� Beta factor model
� MGL, Alpha factor models
� Including CCFs in a FT
Reliability Workbench 8–28
126
©2015 Isograph Inc.
Confidence AnalysisChapter 9
Reliability Workbench 9–1
©2015 Isograph Inc.
Confidence Analysis
� Assuming failure rates exactly known
� Not necessarily true
� Sparse data
� Introduces uncertainty in component Q
Reliability Workbench 9–2
127

©2015 Isograph Inc.
Confidence AnalysisExample
� 10 components tested for 1 year
� 2 failures occur
� λ estimate= 0.2 / year
� Could be 0.25 or 0.15
� Unlikely to be 0.9 or 0.01
� More data — more certainty
Reliability Workbench 9–3
©2015 Isograph Inc.
Confidence Analysis
� Uncertainty expressed as range, distribution
� 10–5 ± 0.5×10⁻⁵ normal distribution
� 10–6 to 10–4 lognormal distribution
� Modeled using Monte Carlo sampling
� Pick failure rates from distribution
� Run analysis
� Repeat
Reliability Workbench 9–4
128
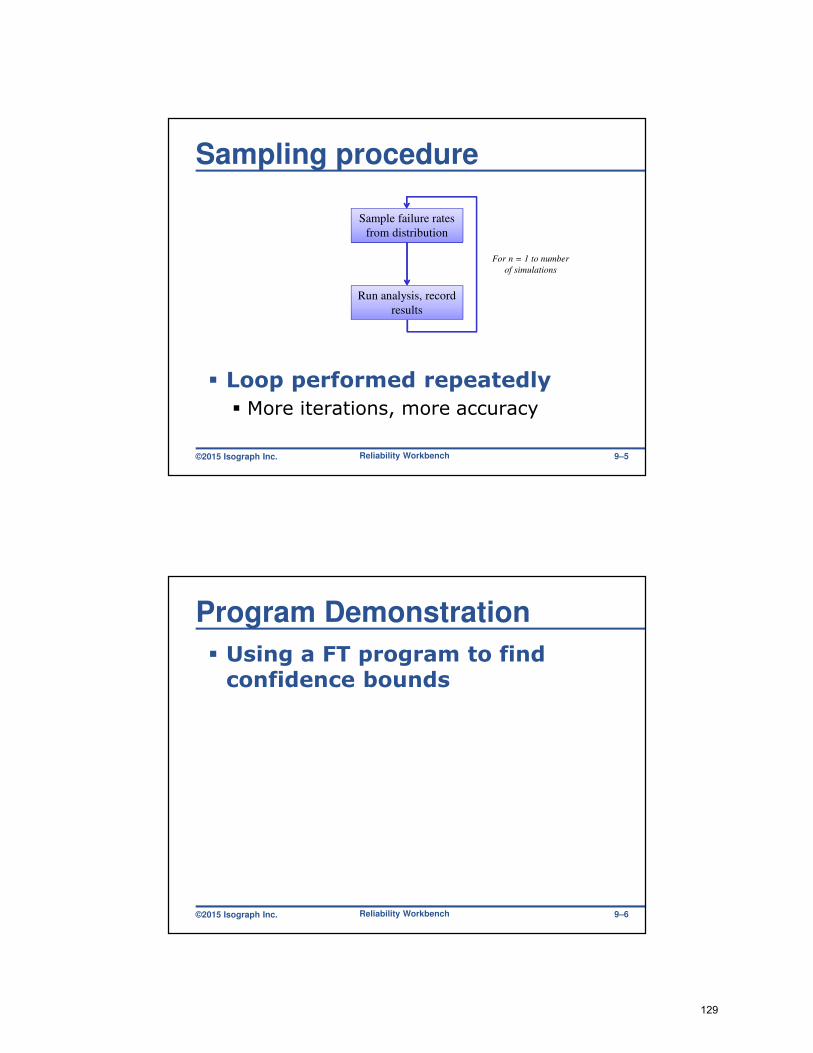
©2015 Isograph Inc.
Sampling procedure
� Loop performed repeatedly
� More iterations, more accuracy
Sample failure rates
from distribution
Run analysis, record
results
For n = 1 to number
of simulations
Reliability Workbench 9–5
©2015 Isograph Inc.
Program Demonstration
� Using a FT program to find confidence bounds
Reliability Workbench 9–6
129

©2015 Isograph Inc.
End of Chapter 9
Reliability Workbench 9–7
130
©2015 Isograph Inc.
Initiators, Enablers, and SequencingChapter 10
Reliability Workbench 10–1
©2015 Isograph Inc.
Initiating & Enabling Events
� Used when order is important
� Initiator — last to occur
� Frequency event
� Enabler — cannot occur last
� Probability event
� Initiator/enabler — any order
� Default
Reliability Workbench 10–2
131

©2015 Isograph Inc.
Initiator Example
� SPARK is initiator
� IMFLAM is enabler
� SPARK → INFLAM: safe
� INFLAM → SPARK: fire
� Similar for FIRE and PROTECT
� Gate status automatically determined
TOP1
Explosion
FIRE
Fire Starts
PROTECT
PROTECTION
SYSTEM
UNAVAILABLE
INFLAM
Inflammable
Material
Present
E
Q=0.1
SPARK
Spark Occurs
I
w=2
Reliability Workbench 10–3
©2015 Isograph Inc.
Cut set Frequency
� Example
� A, B, C, D initiators
� A initiator only
INFLAMSPARKFIRE Q.ωω =
CBADDBAC
DCABDCBACUT
QQQQQQ
QQQQQQ
......
.......
ωω
ωωω
+
++=
DCBACUT QQQ ....ωω =
Reliability Workbench 10–4
132
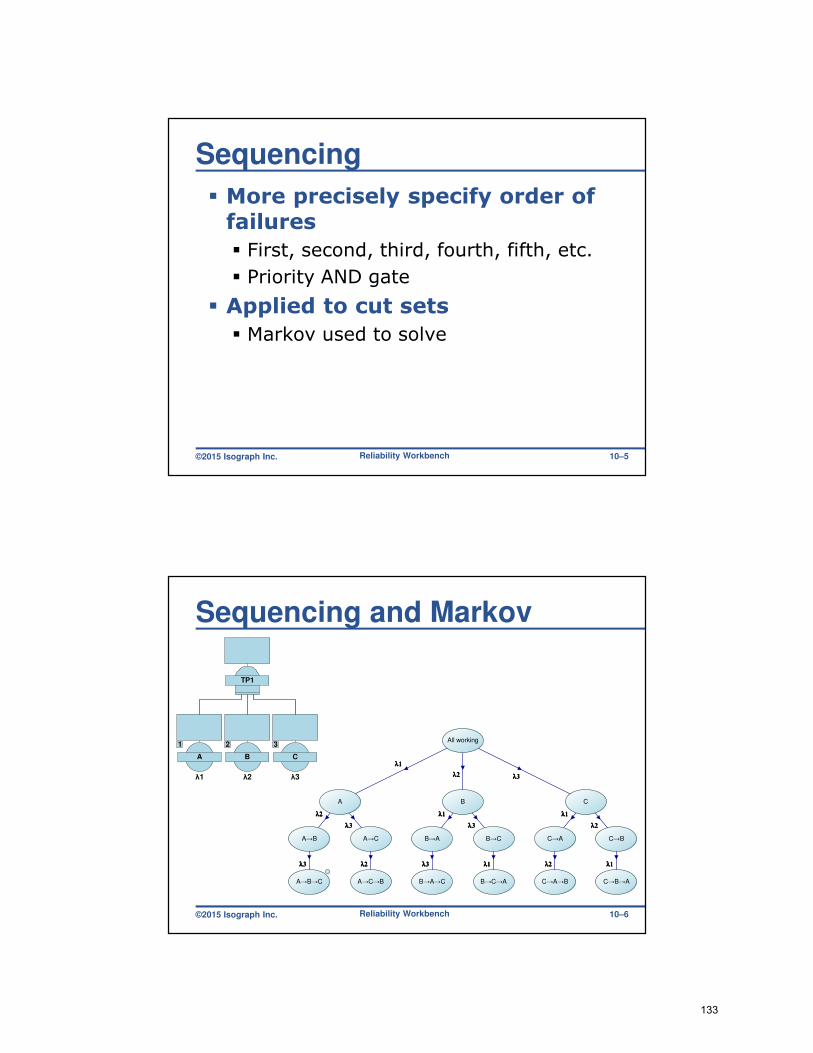
©2015 Isograph Inc.
Sequencing
� More precisely specify order of failures
� First, second, third, fourth, fifth, etc.
� Priority AND gate
� Applied to cut sets
� Markov used to solve
Reliability Workbench 10–5
©2015 Isograph Inc.
Sequencing and Markov
Reliability Workbench 10–6
λ1λ1λ1λ1
λ2λ2λ2λ2λ3λ3λ3λ3
λ2λ2λ2λ2
λ3λ3λ3λ3
λ3λ3λ3λ3
λ1λ1λ1λ1
λ3λ3λ3λ3
λ3λ3λ3λ3
λ1λ1λ1λ1
λ2λ2λ2λ2
λ2λ2λ2λ2λ2λ2λ2λ2 λ1λ1λ1λ1 λ1λ1λ1λ1
All working
A B C
A→B A→C B→A B→C C→A C→B
A→B→C B→A→C C→A→BA→C→B B→C→A C→B→A
TP1
A
1
λ1
B
2
λ2
C
3
λ3
133
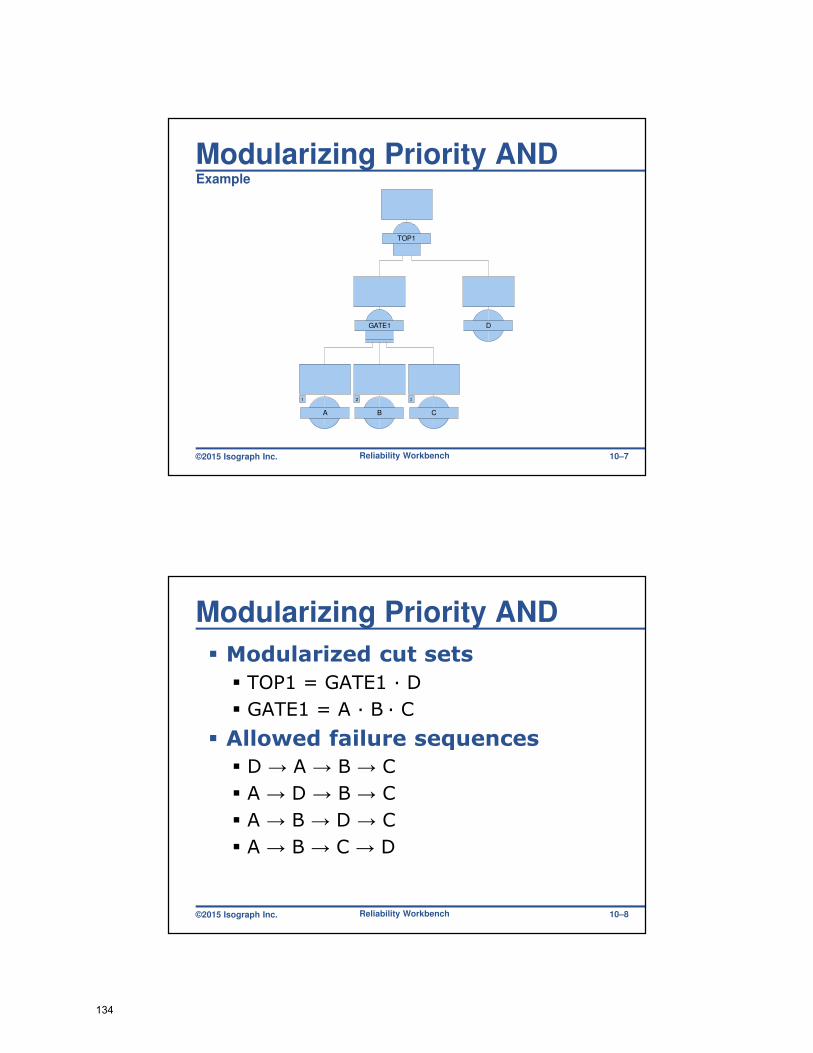
©2015 Isograph Inc.
Modularizing Priority ANDExample
TOP1
GATE1 D
A
1
B
2
C
3
Reliability Workbench 10–7
©2015 Isograph Inc.
Modularizing Priority AND
� Modularized cut sets
� TOP1 = GATE1 · D
� GATE1 = A · B · C
� Allowed failure sequences
� D → A → B → C
� A → D → B → C
� A → B → D → C
� A → B → C → D
Reliability Workbench 10–8
134
©2015 Isograph Inc.
Modularizing Priority AND
� Non-modularized cut sets
� TOP1 = A · B · C · D
� Allowed failure sequences
� A → B → C → D
Reliability Workbench 10–9
©2015 Isograph Inc.
Program Demonstration
� Event sequence status
� Sequencing options
� Auto-sequence Priority AND
� Verification
� Exactly 1 initiator under AND
� Results
Reliability Workbench 10–10
135
©2015 Isograph Inc.
End of Chapter 10
Reliability Workbench 10–11
136
©2015 Isograph Inc.
Event TreesChapter 11
Reliability Workbench 11–1
©2015 Isograph Inc.
Event Tree Analysis
� Identifies outcomes of initiating event
� Uses inductive approach
� Fault trees use deductive approach
� ETA & FTA closely linked
� FTs can be used to quantify events in ET sequences
� Use cut sets and same quantitative methodology
Reliability Workbench 11–2
137
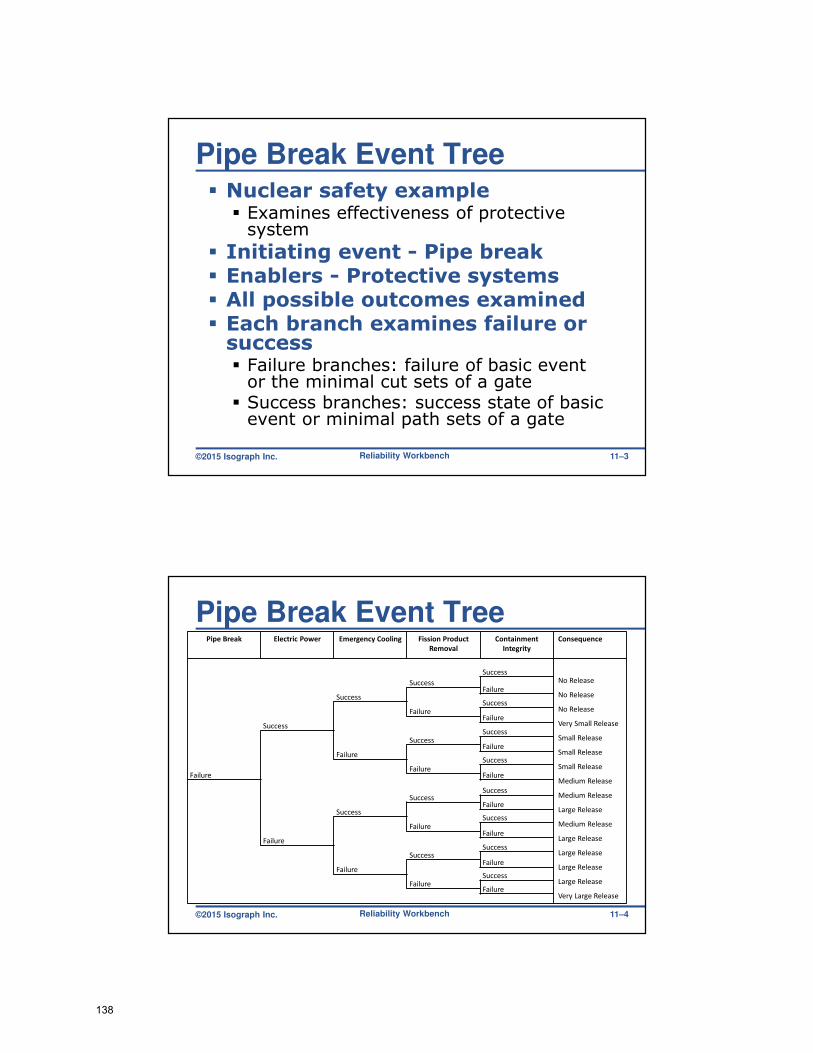
©2015 Isograph Inc.
Pipe Break Event Tree� Nuclear safety example
� Examines effectiveness of protective system
� Initiating event - Pipe break� Enablers - Protective systems� All possible outcomes examined� Each branch examines failure or success� Failure branches: failure of basic event or the minimal cut sets of a gate
� Success branches: success state of basic event or minimal path sets of a gate
Reliability Workbench 11–3
©2015 Isograph Inc.
Pipe Break Event TreePipe Break Electric Power Emergency Cooling Fission Product
Removal
Containment
Integrity
Consequence
Failure
Success
Success
Success
SuccessNo Release
Failure
Failure
No ReleaseSuccess
Failure
No Release
Failure
Success
Very Small ReleaseSuccess
Failure
Small Release
Failure
Failure
Small ReleaseSuccess
Success
Small Release
Failure
Success
Medium Release
SuccessMedium Release
Failure
Failure
Large ReleaseSuccess
Failure
Medium Release
Failure
Success
Large Release
SuccessLarge Release
Failure
Failure
Large ReleaseSuccess
Large ReleaseFailure
Very Large Release
Reliability Workbench 11–4
138
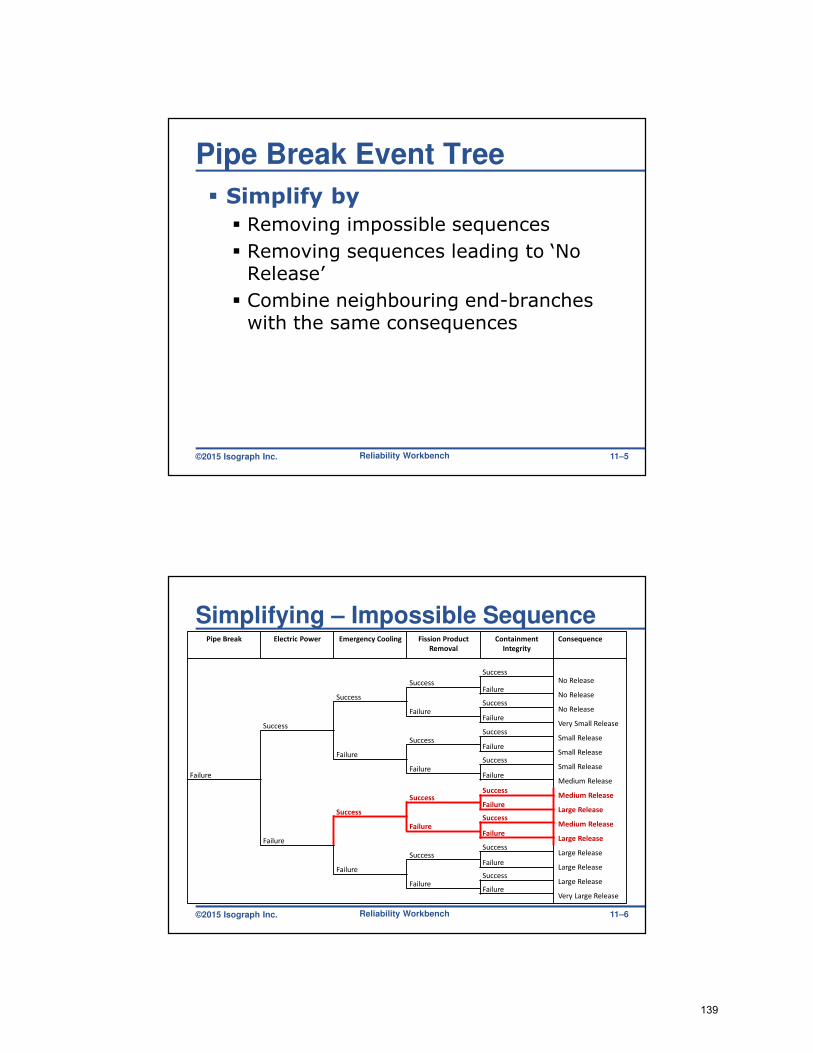
©2015 Isograph Inc.
Pipe Break Event Tree
� Simplify by
� Removing impossible sequences
� Removing sequences leading to ‘No Release’
� Combine neighbouring end-branches with the same consequences
Reliability Workbench 11–5
©2015 Isograph Inc.
Simplifying – Impossible SequencePipe Break Electric Power Emergency Cooling Fission Product
Removal
Containment
Integrity
Consequence
Failure
Success
Success
Success
SuccessNo Release
Failure
Failure
No ReleaseSuccess
Failure
No Release
Failure
Success
Very Small ReleaseSuccess
Failure
Small Release
Failure
Failure
Small ReleaseSuccess
Success
Small Release
Failure
Success
Medium Release
SuccessMedium Release
Failure
Failure
Large ReleaseSuccess
Medium Release
Failure
Success
Large Release
Success
Failure
Large Release
Failure
Failure
Large ReleaseSuccess
Large ReleaseFailure
Very Large Release
Reliability Workbench 11–6
139
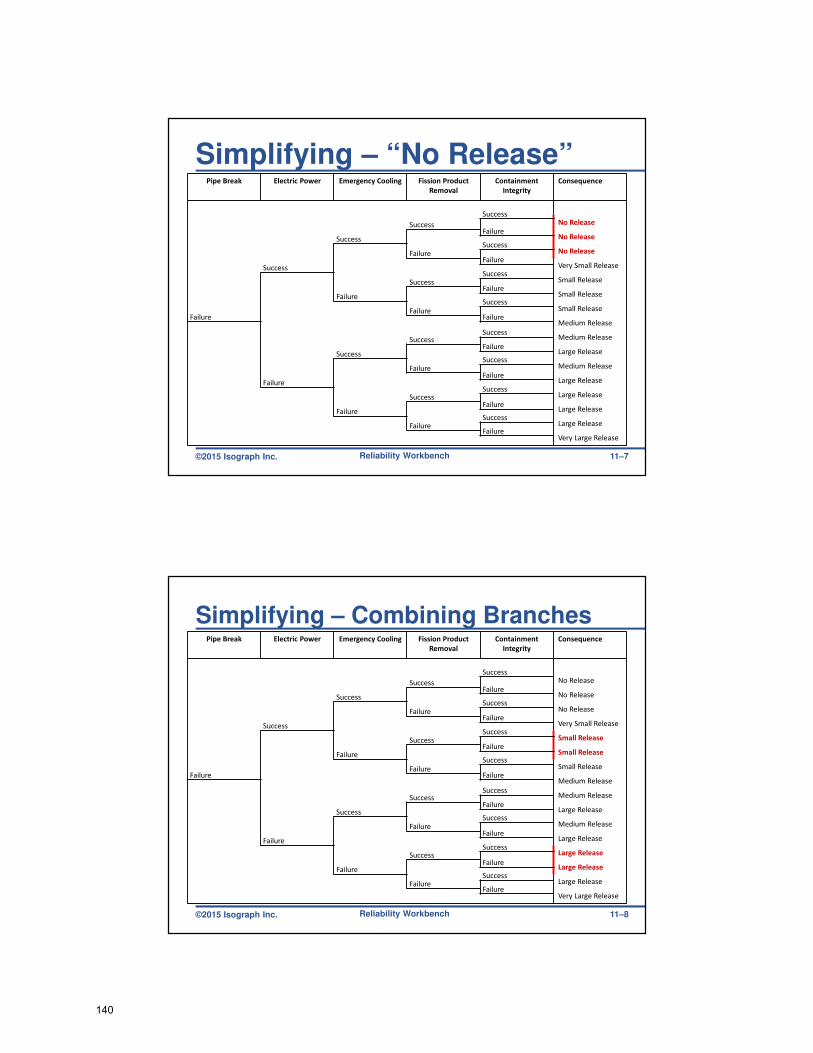
©2015 Isograph Inc.
Simplifying – “No Release”Pipe Break Electric Power Emergency Cooling Fission Product
Removal
Containment
Integrity
Consequence
Failure
Success
Success
Success
SuccessNo Release
Failure
Failure
No ReleaseSuccess
Failure
No Release
Failure
Success
Very Small ReleaseSuccess
Failure
Small Release
Failure
Failure
Small ReleaseSuccess
Success
Small Release
Failure
Success
Medium Release
SuccessMedium Release
Failure
Failure
Large ReleaseSuccess
Failure
Medium Release
Failure
Success
Large Release
SuccessLarge Release
Failure
Failure
Large ReleaseSuccess
Large ReleaseFailure
Very Large Release
Reliability Workbench 11–7
©2015 Isograph Inc.
Simplifying – Combining BranchesPipe Break Electric Power Emergency Cooling Fission Product
Removal
Containment
Integrity
Consequence
Failure
Success
Success
Success
SuccessNo Release
Failure
Failure
No ReleaseSuccess
Failure
No Release
Failure
Success
Very Small ReleaseSuccess
Failure
Small Release
Failure
Failure
Small ReleaseSuccess
Success
Small Release
Failure
Success
Medium Release
SuccessMedium Release
Failure
Failure
Large ReleaseSuccess
Failure
Medium Release
Failure
Success
Large Release
SuccessLarge Release
Failure
Failure
Large ReleaseSuccess
Large ReleaseFailure
Very Large Release
Reliability Workbench 11–8
140
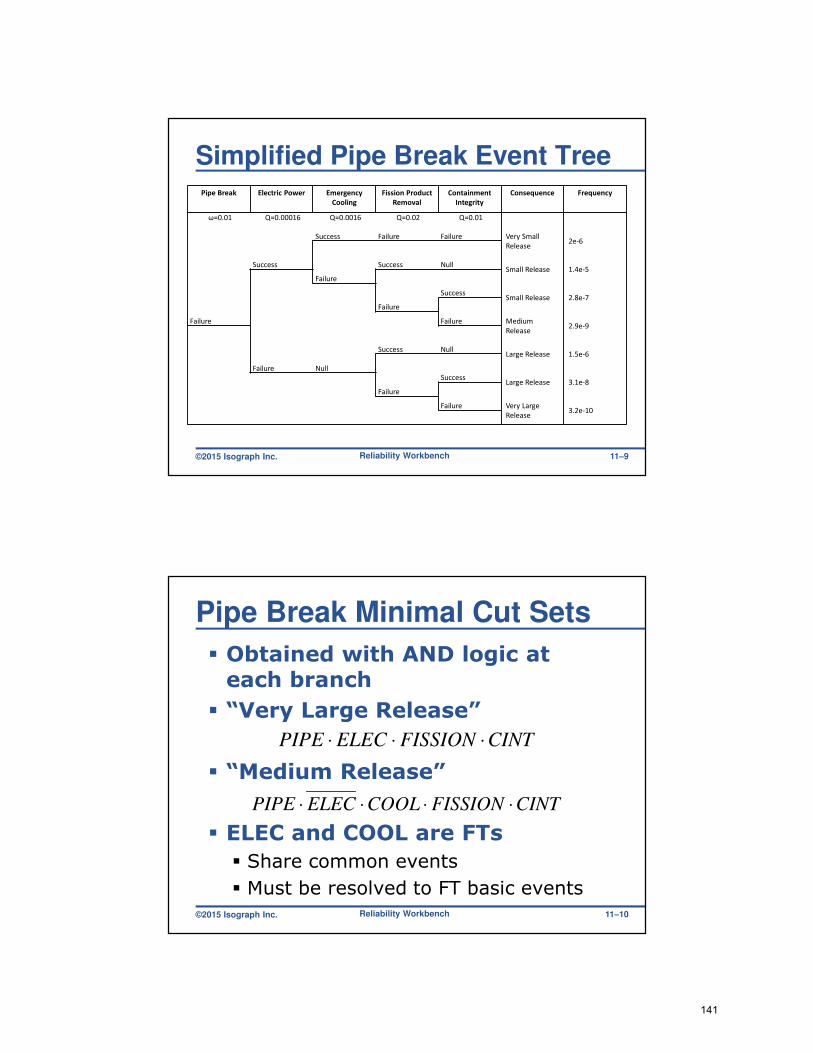
©2015 Isograph Inc.
Simplified Pipe Break Event TreePipe Break Electric Power Emergency
Cooling
Fission Product
Removal
Containment
Integrity
Consequence Frequency
ω=0.01 Q=0.00016 Q=0.0016 Q=0.02 Q=0.01
Failure
Success
Success Failure Failure Very Small
Release2e-6
Failure
Success NullSmall Release 1.4e-5
Failure
Failure
Success
Null
Small Release 2.8e-7
Failure
Success
Medium
Release2.9e-9
NullLarge Release 1.5e-6
Failure
SuccessLarge Release 3.1e-8
Failure Very Large
Release3.2e-10
Reliability Workbench 11–9
©2015 Isograph Inc.
Pipe Break Minimal Cut Sets
� Obtained with AND logic at each branch
� “Very Large Release”
� “Medium Release”
� ELEC and COOL are FTs
� Share common events
� Must be resolved to FT basic events
CINTFISSIONELECPIPE ⋅⋅⋅
CINTFISSIONCOOLELECPIPE ⋅⋅⋅⋅
Reliability Workbench 11–10
141
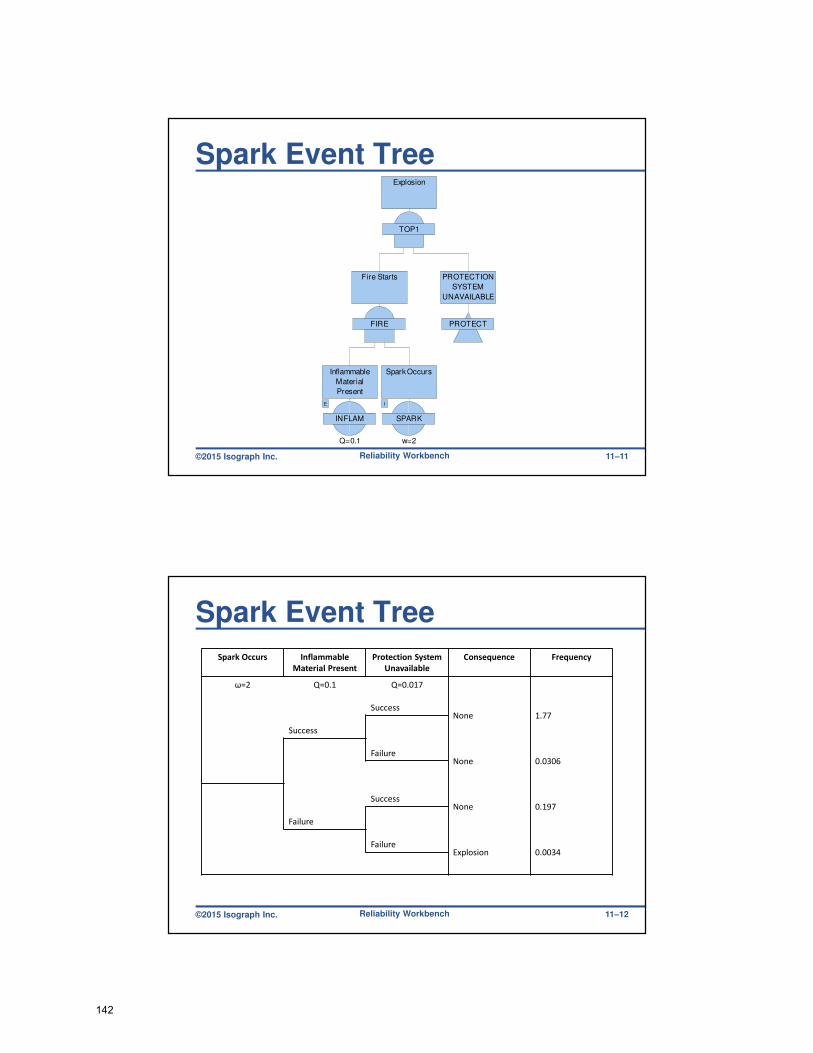
©2015 Isograph Inc.
Spark Event Tree
TOP1
Explosion
FIRE
Fire Starts
PROTECT
PROTECTION
SYSTEM
UNAVAILABLE
INFLAM
Inflammable
Material
Present
E
Q=0.1
SPARK
Spark Occurs
I
w=2
Reliability Workbench 11–11
©2015 Isograph Inc.
Spark Event Tree
Spark Occurs Inflammable
Material Present
Protection System
Unavailable
Consequence Frequency
ω=2 Q=0.1 Q=0.017
Success
SuccessNone 1.77
FailureNone 0.0306
Failure
SuccessNone 0.197
FailureExplosion 0.0034
Reliability Workbench 11–12
142

©2015 Isograph Inc.
Results
� Per Consequence
� Frequency
� Importance
� Cut sets
� Per category
� Risk
Reliability Workbench 11–13
©2015 Isograph Inc.
F-N Curve
� Correlates weight with frequency
� X-axis: weight
� Y-axis: cumulative frequency of all consequences with that weight
� In a given category
Reliability Workbench 11–14
143
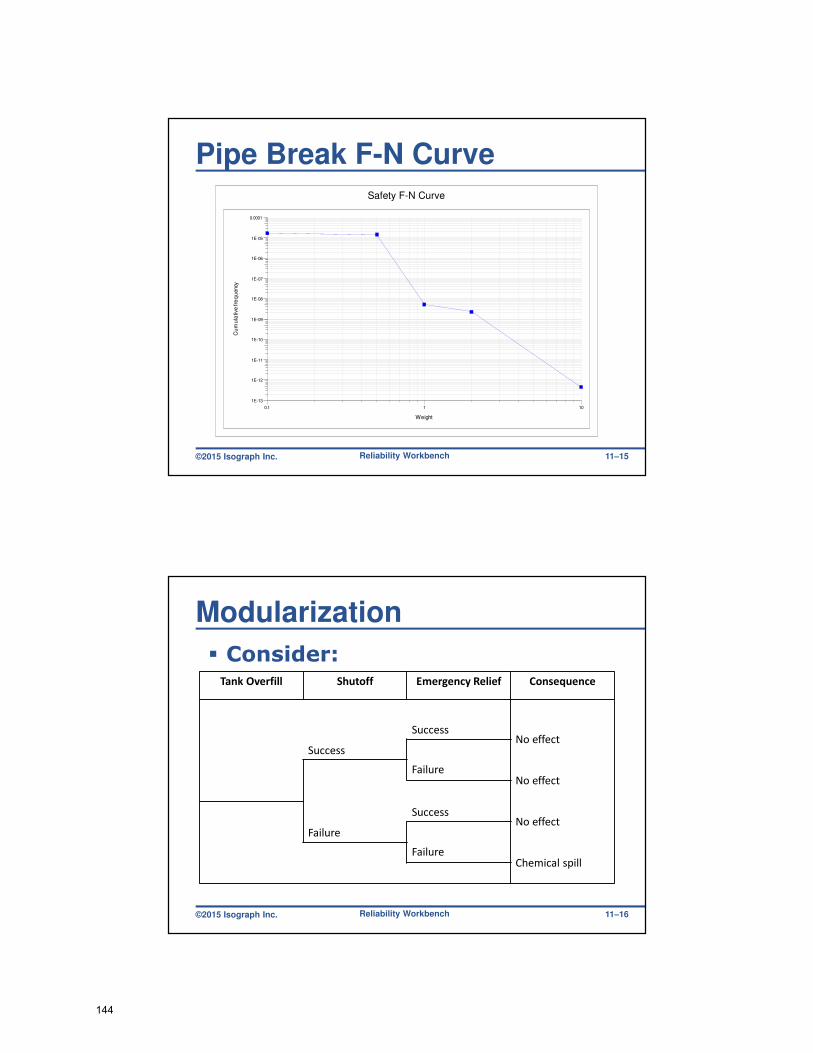
©2015 Isograph Inc.
Pipe Break F-N CurveSafety F-N Curve
0.1 1 10
Weight
1E-13
1E-12
1E-11
1E-10
1E-09
1E-08
1E-07
1E-06
1E-05
0.0001
Cu
mu
lative
fre
qu
ency
Reliability Workbench 11–15
©2015 Isograph Inc.
Modularization
� Consider:Tank Overfill Shutoff Emergency Relief Consequence
SuccessNo effect
Success
FailureNo effect
SuccessNo effect
Failure
FailureChemical spill
Reliability Workbench 11–16
144
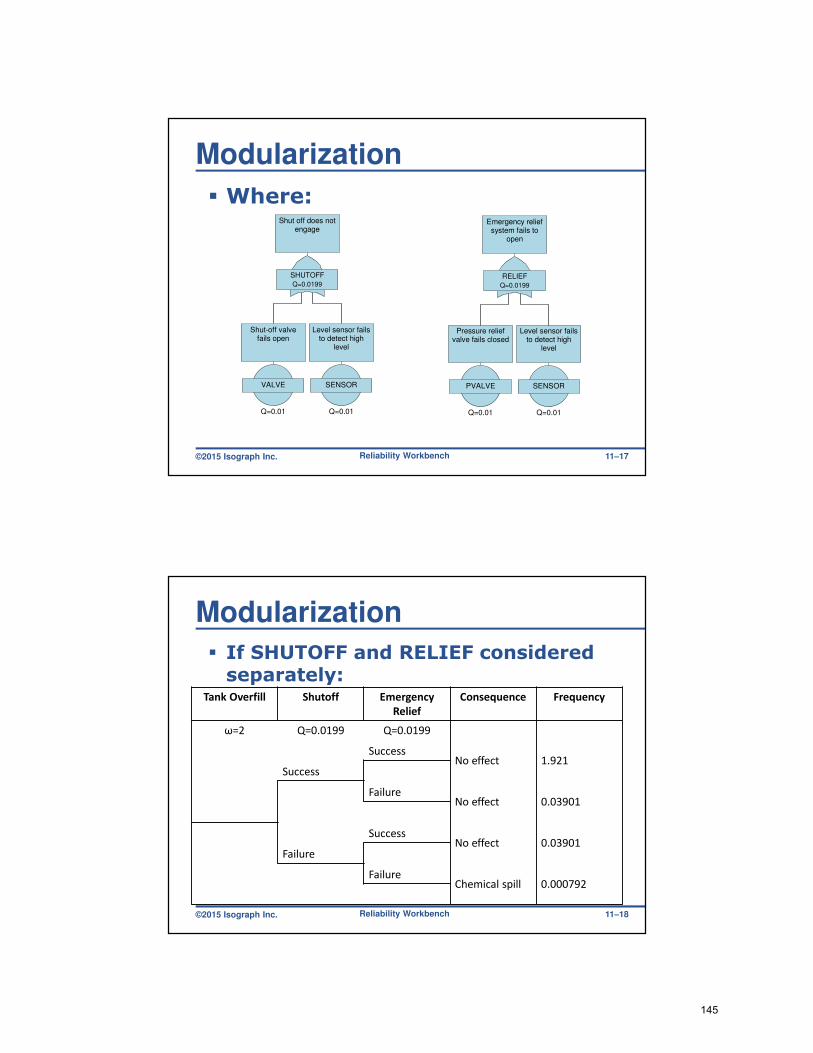
©2015 Isograph Inc.
Modularization
� Where:
Reliability Workbench
SHUTOFF
Q=0.0199
Shut off does notengage
VALVE
Shut-off valvefails open
Q=0.01
SENSOR
Level sensor failsto detect high
level
Q=0.01
RELIEF
Q=0.0199
Emergency reliefsystem fails to
open
PVALVE
Pressure reliefvalve fails closed
Q=0.01
SENSOR
Level sensor failsto detect high
level
Q=0.01
11–17
©2015 Isograph Inc.
Modularization
� If SHUTOFF and RELIEF considered separately:
Tank Overfill Shutoff Emergency
Relief
Consequence Frequency
ω=2 Q=0.0199 Q=0.0199
SuccessNo effect 1.921
Success
FailureNo effect 0.03901
SuccessNo effect 0.03901
Failure
FailureChemical spill 0.000792
Reliability Workbench 11–18
145
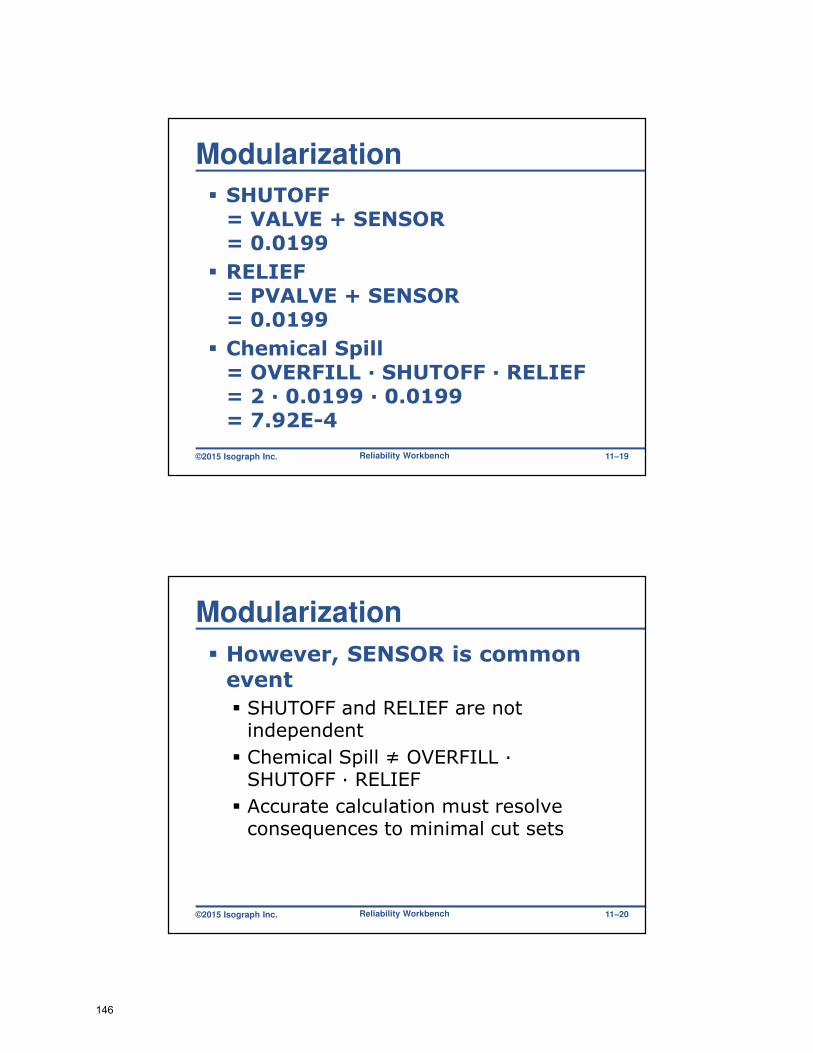
©2015 Isograph Inc.
Modularization
� SHUTOFF= VALVE + SENSOR= 0.0199
� RELIEF= PVALVE + SENSOR= 0.0199
� Chemical Spill= OVERFILL · SHUTOFF ∙ RELIEF= 2 · 0.0199 · 0.0199= 7.92E-4
Reliability Workbench 11–19
©2015 Isograph Inc.
Modularization
� However, SENSOR is common event
� SHUTOFF and RELIEF are not independent
� Chemical Spill ≠ OVERFILL ∙ SHUTOFF · RELIEF
� Accurate calculation must resolve consequences to minimal cut sets
Reliability Workbench 11–20
146
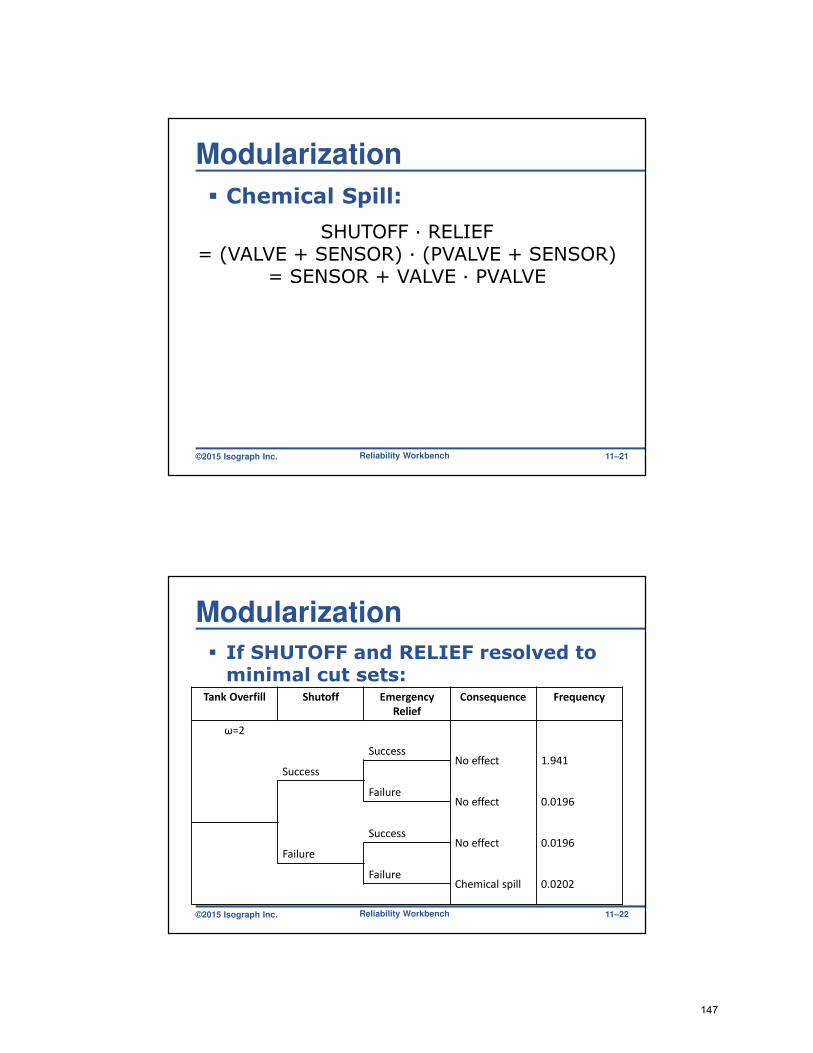
©2015 Isograph Inc.
Modularization
� Chemical Spill:
SHUTOFF · RELIEF= (VALVE + SENSOR) · (PVALVE + SENSOR)
= SENSOR + VALVE · PVALVE
Reliability Workbench 11–21
©2015 Isograph Inc.
Modularization
� If SHUTOFF and RELIEF resolved to minimal cut sets:
Tank Overfill Shutoff Emergency
Relief
Consequence Frequency
ω=2
SuccessNo effect 1.941
Success
FailureNo effect 0.0196
SuccessNo effect 0.0196
Failure
FailureChemical spill 0.0202
Reliability Workbench 11–22
147

©2015 Isograph Inc.
Partial Failure Branches
� Success/Failure logic
� Gives two and only two outcomes
� Partial failure
� More than two possible outcomes
� Gives a gradation of possibilities
� Not necessarily mutually exclusive
� Each branch associated with a different gate or event failure
� E.g., partial capacity
Reliability Workbench 11–23
©2015 Isograph Inc.
Partial Failure BranchesHigh speed
derailment
Dual track Train passing on
other track
Passenger
exposure
Consequence Frequency
ω=5.154E-4 Q=0.9 Q=0.01
0-10 passengers2 fatalities 1.031E-5
False Null 11-20 passengers4 fatalities 2.577E-5
21-30 passengers8 fatalities 1.546E-5
0-10 passengers2 fatalities 9.184E-5
Success 11-20 passengers4 fatalities 2.296E-4
True
21-30 passengers8 fatalities 1.378E-4
0-10 passengers8 fatalities 9.277E-7
Failure 11-20 passengers16 fatalities 2.319E-6
21-30 passengers24 fatalities 1.392E-6
Reliability Workbench 11–24
148

©2015 Isograph Inc.
Program Demonstration
� Evaluating an Event Tree in a computer program
Reliability Workbench 11–25
©2015 Isograph Inc.
End of Chapter 11
Reliability Workbench 11–26
149