Fault-Tolerant, Scalable and Interoperable IoT Platform
108
Universidade de Lisboa Faculdade de Ciˆ encias Departamento de Inform´atica Fault-Tolerant, Scalable and Interoperable IoT Platform Jos´ e Marques Barga Soares Mestrado em Engenharia Inform´ atica Engenharia de Software Disserta¸c˜ ao orientada por: Professor Doutor Jos´ e Manuel da Silva Cec´ ılio 2020
Transcript of Fault-Tolerant, Scalable and Interoperable IoT Platform

Universidade de LisboaFaculdade de CienciasDepartamento de Informatica
Fault-Tolerant, Scalable andInteroperable IoT Platform
Jose Marques Barga Soares
Mestrado em Engenharia InformaticaEngenharia de Software
Dissertacao orientada por:
Professor Doutor Jose Manuel da Silva Cecılio
2020


Acknowledgements
I would like to express my biggest thanks to my professor and advisor, professor Jose Cecılio forall the help and work that he has done this year, without his help this thesis would not havebeen possible. His patience and guidance were decisive, especially in a time that was difficult foreveryone due to the pandemic. He helped me through the most difficult time of my academic path,and for that I will always be grateful.
I also want to thank Professor Antonio Casimiro for his advices in the beginning of my thesisand for allowing me of the opportunity to work in the AQUAMON project.
I want to thank my parents and my family for always trying to help me in anyway they could,the strength they gave me was very important in the most difficult moments that I had to gothrough. Additionally, I would like to thank all my friends who always were there to support me,they know who they are but I would like to indicate some who had a greater impact - Ana, Patricia,Tiago, Maria and Rafael.
This work was supported by FCT through funding of the AQUAMON research project, ref.PTDC/CCI-COM/30142/2017 and LASIGE Research Unit, ref. UIDB/00408/2020.


Abstract
Nowadays the growth of Internet usage is quite visible. Everyday the number of devices connectedto the Internet increases, everything may be a smart device capable of interacting with the Internet,from smartphones, smartwatches, refrigerators and much more. All of these devices are called thingsin the Internet of Things. Many of them are usually constrained devices due to it’s size, usuallyvery small with low capacities such as memory and/or processing power. These kind of devices needto be very efficient in all of their actives. For example, the battery lifetime should be maximizedas possible so that the necessity to change each device’s battery could be minimized. There aremany technologies that allow communication between devices. Besides the technologies, protocolsmay be involved in the communication between each device in an IoT system. CommunicationProtocols define the behaviour that is followed by things when communicating with each other. Forexample, in some protocols acknowledgments must be used to ensure data arrival, while in othersthis feature is not enforced. There are many communication Protocols available in the literature.
The use of communication protocols and communication models bring many benefits to IoTsystems, but they may also benefit from using the cloud. One of the biggest struggles in IoT isthe fact that things are very constrained devices in terms of resources (CPU and RAM). With thecloud this would no longer be an issue. Plus, the cloud is able of providing device management,scalability, storage and real time transmission.
The characteristics of the communication protocols were studied and an innovative system ar-chitecture based on micro-services, Kubernetes and Kafka is proposed in this thesis. This proposaltries to address issues such as scalability, interoperability, fault tolerance, resiliency, availability andsimple management of large IoT systems. Supported by Kubernetes, which is an open-source tech-nology that allows micro-services to be extensible, configurable and automatically managed withfault tolerance and Kafka, which is a distributed event log that uses the publish-subscribe pattern,the proposed architecture is able to deal with high number of devices producing and consumingdata at the same time.
The proposed Fault-Tolerant and Interoperable IoT Architecture is a cluster composed of manycomponents (micro-services) that were implemented using docker containers. The current imple-mentation of the system supports the MQTT, CoAP and REST protocols for data incoming andthe same plus websockets for data output.
Since the system is based on micro-services, more protocols may be added in a simple way(just a new micro-service must be added). The system is able to convert any protocol into anotherprotocol, e.g., if a message arrives at the system through MQTT protocol, it can be consumedusing the CoAP or REST protocol. When messages are sent to the system the payload is stored inKafka independently of the protocol, and when clients request it, it is consumed from Kafka andencapsulated by the client protocol to be sent to the client.
In order to evaluate and demonstrate the capabilities of our proposal a set of experiments weremade, which allows to collect information about the performance of the Communication Protocols,the system as a whole, Kubernetes and Kafka. From the experiments we were able to concludethat the message size is not so much important, since the system is able to deal with messagesfrom 39 bytes to 2000 bytes. Since we are designing the system for IoT applications, we consideredthat messages with 2000 Bytes are big messages.
Also, it was recognized that the system is able to recover from crashed nodes and to respondwell in terms of average delay and packet loss when low and high throughput are compared. Inthis situation, there is a significant impact of the RAM usage, but the system still works withoutproblems.
In terms of scalability, the evaluation of the system through its cluster under-layer platform(Kubernetes) allowed us to understand that there is no direct relation between the time spent to
2

add a node and the number of nodes in the cluster. So the time to add a single node is reduced andconstant. However, the same conclusion is not true for the number of instances that are needed athigh layer (application layer). Here, time spent to increase the number of instances of a specificapplication is directly proportional to the number of instances that are already running.
In respect to data redundancy and persistence, the experiments showed that the average delayand packet loss of a message sent from a Producer to a Receiver is approximately the same regard-less of the number of Kafka instances being used. Additionally, using a high number of partitionshas a negative impact on the system’s behaviour.
Keywords: IoT, MQTT, CoAP, REST, Kubernetes, Kafka, Cloud, Scalability, Interoper-ability, Fault Tolerance, Resiliency, Availability, Simple Management, Publish-Subscribe, Micro-Services, Docker containers.


Resumo alargado em Portugues
Hoje em dia o crescimento da utilizacao da internet esta a aumentar devido a vasta possibilidadede dispositivos capazes de se conectarem a ela, desde telefones, relogios, frigorıficos ou lampadasinteligentes, entre muitos outros dispositivos. Todos estes dispositivos sao denominados de ”coisas”na Internet das Coisas (”Internet of Things - IoT” em ingles). Muitos deles apresentam poucopoder de processamento e/ou memoria, devido ao fato da grande maioria ser de pequenas di-mensoes. Normalmente estes dispositivos sao usados para capturar determinados dados, tipica-mente com tamanhos reduzidos, e transmiti-los para outras entidades, como e o caso de sensoresde temperatura e/ou humidade que transmitem a sua informacao para uma central onde sao ap-resentados.
Para que os sistemas IoT tenham um bom desempenho estes devem ser o mais eficientes possıvel,por exemplo, o tempo de vida da bateria dos dispositivos usados deve ser maximizada de forma aque estas tenham que ser substituıdas o menor numero de vezes possıvel (por exemplo, uma vezpor ano).
Existem varios aspetos que devem ser tidos em consideracao na maximizacao da eficienciados sistemas IoT, como e o caso do tipo de tecnologia usada, o modelo ou o protocolo decomunicacao. Muitos dos sistemas IoT sao suportados por modelos de computacao na nuvem.Neste caso a comunicacao com a nuvem tambem deve ser tida em consideracao.
Nesta tese, numa primeira fase, estes aspetos foram estudados de forma a poder ter uma boabase de conhecimento sobre como maximizar a eficiencia deste tipo de sistemas.
As tecnologias estudas foram as seguintes: LoRa, Sigfox, NB-IoT, Bluetooth, ZigBee, Wi-Fi,LTE, GSM.
Em termos de modelos de comunicacao, nesta tese foram abordados os modelos publish-subscribee request-response. O modelo publish-subscribe e um modelo onde dispositivos publicam dados(Publishers) para um componente central chamado Broker, cuja responsabilidade e receber osdados e reencaminha-los para o destinatario correto (Subscribers). Os dados que fluem nesta co-municacao sao identificados por meio de Topicos. Por exemplo, os dados relativos a temperatura ehumidade podem ser divididos em dois topicos chamados ”temperatura” e ”humidade”. Os Publish-ers publicam dados num topico (no Broker) e o Broker trata de reencaminhar esses dados a todosos Subscribers que tenham, previamente, subscrito esse topico. No caso do modelo request-responsenao existem topicos, nem Publishers, Subscribers ou Brokers. Em vez disso existem Clientes, Servi-dores e Recursos. Os dados transmitidos sao separados em recursos que representam a informacaoenviada, por exemplo ”temperatura” ou ”humidade”. Os Recursos sao pre-programados nos servi-dores de modo a que estes saibam como proceder para responder aos clientes. A interacao com osservidores deste tipo baseia-se no conjunto de primitivas CRUD do HTML (PUT, POST, GET ouDELETE). Este conjunto de primitivas permite enviar dados a um determinado Recurso criando-ocaso nao exista, atualizar um Recurso existente, pedir ao servidor para receber os dados de umRecurso ou apagar dados de um Recurso.
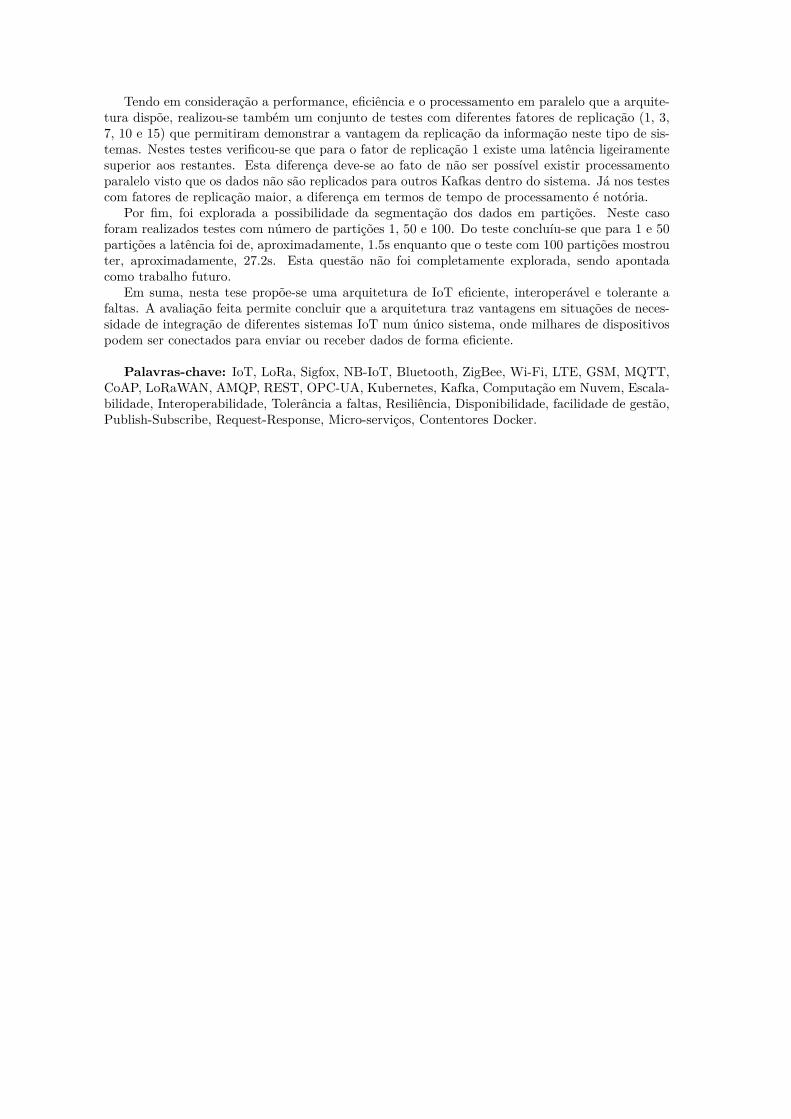
Em termos de protocolos de comunicacao, nesta tese sao abordados os protocolos MQTT, CoAP,LoRaWAN, AMQP, REST e OPC-UA. Dada a amplitude do trabalho, a parte experimental tevede ser limitada, concentrando a sua avaliacao nos protocolos MQTT, CoAP e REST.
O protocolo MQTT e um dos protocolos de acesso publico mais usados em IoT. Este protocolousa o modelo publish-subscribe para estabelecer comunicacao o que significa que os dispositivos naoprecisam de saber os enderecos uns dos outros porque os dados sao enviados para o broker, sendoo unico endereco necessario para estabelecer a comunicacao.
Em relacao a comunicacao, este protocolo oferece garantias de entrega da informacao, uma vezque usa o protocolo TCP na camada de transporte. Quanto a qualidade de servico, o protocolooferece tres nıveis: ”No maximo uma vez”, ”Pelo menos uma vez” e ”Exatamente uma vez”. No
3

primeiro nıvel (”No maximo uma vez”) as mensagens nao chegam ao destino mais que uma vez ecaso alguma se perca nada e feito. No segundo nıvel as mensagens que nao cheguem ao destinosao reenviadas, podendo haver mensagens duplicadas. Para isto o protocolo MQTT faz uso de”acknowledgments” que sao mensagens cujo unico proposito e confirmar a rececao de chegada deuma mensagem a entidade que a enviou. No ultimo nıvel, as mensagens sao entregues uma unicavez, sem perdas e sem duplicados, para isso o protocolo usa quatro etapas de confirmacao.
No que diz respeito ao protocolo CoAP, este foi desenhado especificamente para ser usadoem ambientes onde os dispositivos tem poucos recursos, o que o torna tambem muito util emsistemas IoT, porem, ao contrario de MQTT, este segue o modelo resquest-response. E tambemum protocolo de acesso publico, mas neste caso pode usar UDP ou TCP na camada de transporte.Este protocolo define quatro tipos de mensagens: ”Confirmable”, ”Non-Confirmable”, ”Reset” ou”Acknowledgment”. O primeiro tipo indica que as mensagens exigem confirmacao, ou seja, espera-se que uma mensagem do tipo ”Acknowledgement” seja devolvida apos a sua chegada ao destino.As mensagens do tipo ”Non-Confirmable” nao tem essa necessidade de confirmacao. Contudo, seforem usados juntamente com o protocolo UDP, nao existe garantia de entrega das mesmas. Asmensagens do tipo ”Reset” sao usadas pelo servidor e reservadas para casos especıficos como porexemplo mensagens que se perderam e e necessario repor os contadores de mensagens.
REST e um estilo de arquitetura que, de forma semelhante ao CoAP, segue o modelo request-response. Porem o REST nao foi desenhado para ser usado especificamente em sistemas onde existeacesso a poucos recursos. E um estilo comum em aplicacoes de rede. Sendo assim, existe tambemneste caso um servidor para o qual clientes enviam pedidos. Esses pedidos podem ser qualquer umdos anteriormente mencionados ”PUT”, ”POST”, ”GET” e ”Delete” que pedem ao servidor paraenviar, alterar/atualizar, receber ou apagar recursos.
Alem das tecnologias, modelos e protocolos falados, tambem a nuvem e capaz de oferecer muitosbenefıcios a sistemas IoT. Um dos maiores problemas em IoT e a falta de recursos (processamentoe memoria) que surge do fato dos dispositivos, tipicamente, oferecerem poucos recursos. Nesteaspeto, o uso da nuvem ajuda atraves da possibilidade de se usarem instancias com recursosfornecidos pelo provedor de nuvem (como por exemplo a Google Cloud ou Microsoft Azure). Estesrecursos tem por norma um custo consideravelmente barato, dependendo da quantidade e tempoque esses recursos sao usados. Atualmente, os fornecedores de servicos na nuvem fornecem tambemrecursos para a gestao de dispositivos, escalabilidade, armazenamento e transmissao de dados emtempo real.
Apos o estudo destas metodologias e ferramentas disponıveis, foi desenvolvida uma nova ar-quitetura para sistemas IoT. Esta arquitetura e constituıda por um cluster composto por variosmicro-servicos implementados com o uso de contentores docker por forma a facilitar a adicao,remocao ou atualizacao de micro-servicos.
A Arquitetura de IoT interoperavel e tolerante a faltas (Fault-Tolerant and Interoperable IoTArchitecture) por nos proposta tenta obter escalabilidade, interoperabilidade, tolerancia afaltas, resiliencia, disponibilidade e facilidade de gestao de sistemas IoT de grande dimensaoatraves do uso de duas principais ferramentas de livre acesso: Kubernetes e Kafka.
O Kubernetes e um cluster que permite gerir, configurar ou escalar micro-servicos de formaautomatica e tolerante a faltas. Neste tipo de clusters, existem um ou mais nos master e nosescravos. Os nos master sao os nos que gerem e controlam os nos escravos. Os nos escravossao os que executam os micro-servicos. No Kubernetes os micro-servicos sao implementados emcontentores docker que sao colocados no componente mais basico do Kubernetes chamado ”Pod”.Os Pods sao criados em nos escravos existentes no cluster.
Em conjunto com o Kubernetes esta tambem em funcionamento o Kafka que serve como umregisto de eventos distribuıdo. O Kafka e um sistema que segue o modelo publish-subscribe onde”Producers” usam topicos para enviar mensagens para o Kafka e ”Receivers” consomem dadosdesses topicos. Estes topicos tem ainda dois novos conceitos adicionados pelo Kafka: fator dereplicacao e numero de particoes. O fator de replicacao indica o numero de replicas (de Kafka)pelos quais se pretende persistir os dados recebidos num topico. O numero de particoes serve paraindicar em quantas particoes deve o topico estar repartido. Estas particoes servem para permitirprocessamento paralelo.
A implementacao desta arquitetura permite o envio de dados usando os protocolos MQTT,CoAP e REST e a rececao desses dados atraves de qualquer um destes protocolos e ainda Web-Sockets. O sistema e capaz de traduzir estes protocolos, por exemplo, dados enviados usandoMQTT podem ser recebidos atraves de CoAP. Quando os dados sao enviados para o sistema, a
4 Jose Soares

mensagem enviada e guardada no Kafka independentemente do protocolo usado, e quando alguemquer receber dados do sistema, este devolve os dados guardados no Kafka.
Caso seja necessario, a arquitetura foi desenhada para que a adicao de novos protocolos sejasimples, bastando para isso adicionar novos micro-servicos ao sistema.
De forma a demonstrar as capacidades da arquitetura proposta e desenvolvida nesta tese, foirealizado um conjunto de experiencias que avaliam a performance do sistema.
A primeira experiencia realizada verifica qual a latencia de uma mensagem, de tamanho pe-queno, desde o momento em que e enviada para o sistema ate ao momento que chega ao seu destino.Esta experiencia foi repetida para todos os protocolos com diferentes taxas de envio (1, 10 e 100mensagens por segundo).
Dos resultados obtidos concluiu-se que a latencia de envio de pacotes MQTT e de, aproximada-mente, 1.1s, 1.8s e 5.3s para as taxas de envio testadas. Em relacao ao CoAP, a latencia e de,aproximadamente, 2.8s, 3.3s e 2.8s, enquanto no REST obtiveram-se valores 3.2s, 3.1s e 2.97s.
Em termos de perda de informacao (pacotes perdidos), o teste realizado com MQTT foi o unicoque nao apresentou perdas para qualquer uma das taxas de envio usadas. No CoAP, para ritmosde entrada de 1, 10 e 100 mensagens por segundo houve uma perda de 0,92%, 18,52% e 17,58%,respetivamente. No Caso de REST, obtiveram-se valores de 0,52%, 32,48% e 28,33% de perdaspara os mesmos ritmos de entrada de dados.
Com base nos valores apresentados, e possıvel concluir que, em relacao a perda de pacotes,quando a taxa de envio e alta, todos os protocolos tem dificuldades em responder. Em relacao alatencia de envio dos dados, parece existir uma tendencia para ser tanto maior quanto a taxa deenvio, excepto no caso de REST que nao foi identificada uma relacao directa.
De forma a avaliar qual o impacto do tamanho de uma mensagem no desempenho do sistema,realizou-se um conjunto de experiencias onde se enviaram mensagens com tamanho grande e comtamanho variavel usando MQTT. Os resultados destes testes foram comparados com os resultadosobtidos na experiencia anterior.
Tendo em consideracao que a arquitetura do sistema foi concebida para utilizacoes em contextode IoT, mensagens com 39 Bytes sao consideradas mensagens pequenas ou regulares e mensagenscom 2000 Bytes sao consideradas mensagens grandes. Nos testes onde mensagens de tamanhovariavel foram consideradas, estas tiveram um tamanho compreendido entre 100 e 1000 Bytes.
Com estes testes pode-se verificar que nao existe um impacto muito significativo provocadopelo tamanho das mensagens em termos de latencia. Contudo, deparamo-nos com um impactoexpressivo, em termos de pacotes perdidos, quando se usam tamanhos variaveis das mensagens.
Em termos de capacidade de recuperacao a falhas de nos, foram realizadas experiencias ondeos nos foram forcados a falhar e verificou-se a capacidade de recuperacao do cluster. Neste casoverificou-se que o sistema foi capaz de se adaptar, removendo os pods do no que falhou, distribuindo-os por outros nos, e retomar o funcionamento normal do sistema.
De seguida, e de forma a avaliar a influencia da quantidade de dados em processamento nosistema, foram realizados dois testes de carga, onde os nıveis de uso do CPU e memoria RAMforam monitorizados. No primeiro teste usou-se um unico produtor MQTT para enviar dados,enquanto que no segundo usaram-se 10 produtores. A quantidade de dados recebidos e em pro-cessamento aumenta em dez vezes de um caso para outro. Como resultado, concluiu-se que onıvel de CPU utilizado nao varia muito entre cada teste, mas os nıveis de uso de RAM aumentamsignificativamente.
Sendo a arquitetura proposta escalavel em termos de instancias dos micro-servicos ou em termosdo numero de nos de hardware que dispoe, realizaram-se tambem experiencias onde se verificouqual o tempo necessario para que o sistema adicione um novo no (hardware) ao cluster consoanteo numero de nos existentes. Foram realizados testes com diferentes dimensoes do cluster (1, 3, 5,8 e 10 nos) onde se acrescentava um no adicional. Deste teste concluiu-se que, independentementeda dimensao do cluster, a adicao de um novo no demora entre 30 e 40 segundos.
Por outro lado, a arquitetura proposta tambem permite a escalabilidade horizontal, permitindoaumentar o numero de instancias de um micro-servico. Para avaliar esta componente, configurou-se o sistema de forma a ter um master e quatro nos escravos. Com base nesta configuracao,fizeram-se testes com 10, 20, 30, 40, 50 e 60 instancias de um micro-servico, e de cada vez que seescalava o micro-servico verificou-se o tempo que este demorou a passar de estado ”Nao Pronto”para ”Pronto”. Desta experiencia concluiu-se que o tempo necessario para escalar o micro-servicoaumenta de forma diretamente proporcional ao numero de instancias a escalar. Quantas maisinstancias sao precisas escalar maior o tempo necessario para o fazer.
5 Jose Soares
Tendo em consideracao a performance, eficiencia e o processamento em paralelo que a arquite-tura dispoe, realizou-se tambem um conjunto de testes com diferentes fatores de replicacao (1, 3,7, 10 e 15) que permitiram demonstrar a vantagem da replicacao da informacao neste tipo de sis-temas. Nestes testes verificou-se que para o fator de replicacao 1 existe uma latencia ligeiramentesuperior aos restantes. Esta diferenca deve-se ao fato de nao ser possıvel existir processamentoparalelo visto que os dados nao sao replicados para outros Kafkas dentro do sistema. Ja nos testescom fatores de replicacao maior, a diferenca em termos de tempo de processamento e notoria.
Por fim, foi explorada a possibilidade da segmentacao dos dados em particoes. Neste casoforam realizados testes com numero de particoes 1, 50 e 100. Do teste concluıu-se que para 1 e 50particoes a latencia foi de, aproximadamente, 1.5s enquanto que o teste com 100 particoes mostrouter, aproximadamente, 27.2s. Esta questao nao foi completamente explorada, sendo apontadacomo trabalho futuro.
Em suma, nesta tese propoe-se uma arquitetura de IoT eficiente, interoperavel e tolerante afaltas. A avaliacao feita permite concluir que a arquitetura traz vantagens em situacoes de neces-sidade de integracao de diferentes sistemas IoT num unico sistema, onde milhares de dispositivospodem ser conectados para enviar ou receber dados de forma eficiente.
Palavras-chave: IoT, LoRa, Sigfox, NB-IoT, Bluetooth, ZigBee, Wi-Fi, LTE, GSM, MQTT,CoAP, LoRaWAN, AMQP, REST, OPC-UA, Kubernetes, Kafka, Computacao em Nuvem, Escala-bilidade, Interoperabilidade, Tolerancia a faltas, Resiliencia, Disponibilidade, facilidade de gestao,Publish-Subscribe, Request-Response, Micro-servicos, Contentores Docker.


List of Figures
2.1 Sigfox Network [39] . . . . . . . . . . . . . . . . . . . . . . . . . . . . . . . . . . . . 182.2 Overview of the Piconet and Scatternet [55] . . . . . . . . . . . . . . . . . . . . . . 192.3 Pub-Sub Pattern [104] . . . . . . . . . . . . . . . . . . . . . . . . . . . . . . . . . . 212.4 Request Response Pattern . . . . . . . . . . . . . . . . . . . . . . . . . . . . . . . . 222.5 Communication Protocols on the network layers - TCP/IP model [84] . . . . . . . 222.6 MQTT Control Packet Format [38] . . . . . . . . . . . . . . . . . . . . . . . . . . . 232.7 MQTT QoS level 2 [119] . . . . . . . . . . . . . . . . . . . . . . . . . . . . . . . . . 242.8 CoAP Functionality [63] . . . . . . . . . . . . . . . . . . . . . . . . . . . . . . . . . 262.9 CoAP Message Format [63] . . . . . . . . . . . . . . . . . . . . . . . . . . . . . . . 272.10 Lora’s Star Architecture [13] . . . . . . . . . . . . . . . . . . . . . . . . . . . . . . . 292.11 LoRaWAN Architecture Layers [81] . . . . . . . . . . . . . . . . . . . . . . . . . . . 292.12 LoRaWAN Packet Format [81] . . . . . . . . . . . . . . . . . . . . . . . . . . . . . 302.13 AMQP Architecture . . . . . . . . . . . . . . . . . . . . . . . . . . . . . . . . . . . 312.14 AMQP Message Format [117] . . . . . . . . . . . . . . . . . . . . . . . . . . . . . . 332.15 AMQP with RabbitMQ [54] . . . . . . . . . . . . . . . . . . . . . . . . . . . . . . . 332.16 OPC UA Architecture [91] . . . . . . . . . . . . . . . . . . . . . . . . . . . . . . . . 352.17 OPC UA Message Format [91] . . . . . . . . . . . . . . . . . . . . . . . . . . . . . 372.18 OPC UA Security Architecture [91] . . . . . . . . . . . . . . . . . . . . . . . . . . . 372.19 OPC UA Mapping [91] . . . . . . . . . . . . . . . . . . . . . . . . . . . . . . . . . . 382.20 Cloud and IoT Network [85] . . . . . . . . . . . . . . . . . . . . . . . . . . . . . . . 392.21 Container’s role [74] . . . . . . . . . . . . . . . . . . . . . . . . . . . . . . . . . . . 412.22 Kubernetes Components [25] . . . . . . . . . . . . . . . . . . . . . . . . . . . . . . 432.23 Kafka Topics, Partitions and Replication factor [85] . . . . . . . . . . . . . . . . . 47
3.1 Typical IoT system in 2020 [69] . . . . . . . . . . . . . . . . . . . . . . . . . . . . . 48
4.1 System Architecture . . . . . . . . . . . . . . . . . . . . . . . . . . . . . . . . . . . 534.2 MQTT data flow . . . . . . . . . . . . . . . . . . . . . . . . . . . . . . . . . . . . . 544.3 Kafka topic anatomy . . . . . . . . . . . . . . . . . . . . . . . . . . . . . . . . . . . 564.4 Kafka Partitions . . . . . . . . . . . . . . . . . . . . . . . . . . . . . . . . . . . . . 564.5 Proxy Architecture . . . . . . . . . . . . . . . . . . . . . . . . . . . . . . . . . . . . 594.6 Excerpt of kafka.yaml with the configurations of the Service . . . . . . . . . . . . . 614.7 Excerpt of Kafka.yaml with the configurations of the StatefulSet . . . . . . . . . . 614.8 Excerpt of zookeeper.yaml with the configurations of its Services . . . . . . . . . . 624.9 Excerpt of zookeeper.yaml with the configurations of the StatefulSet . . . . . . . . 634.10 Excerpt of mosquitto-in.yaml with the configurations of the Service . . . . . . . . . 644.11 Excerpt of mosquitto-in.yaml with the configurations of the Deployment . . . . . . 644.12 Excerpt of mosquitto-out.yaml with the configurations of its Services . . . . . . . . 654.13 Excerpt of mosquitto-out.yaml with the configurations of the Deployment . . . . . 654.14 Excerpt of coap.yaml with the configurations of its Service . . . . . . . . . . . . . . 664.15 Excerpt of coap.yaml with the configurations of the Deployment . . . . . . . . . . 674.16 Excerpt of rest.yaml with the configurations of its Service . . . . . . . . . . . . . . 674.17 Excerpt of rest.yaml with the configurations of the Deployment . . . . . . . . . . . 684.18 Excerpt of controller.yaml with its configurations . . . . . . . . . . . . . . . . . . . 694.19 Excerpt of pq-rwo.yaml with its configurations . . . . . . . . . . . . . . . . . . . . 69
6.1 MQTT Average Latency (ms) and Packet Loss vs Rate . . . . . . . . . . . . . . . . 81
6

6.2 CoAP Average Latency (ms) and Packet Loss vs Rate . . . . . . . . . . . . . . . . 816.3 REST Average Latency (ms) and Packet Loss vs Rate . . . . . . . . . . . . . . . . 826.4 MQTT Small vs Big message latency . . . . . . . . . . . . . . . . . . . . . . . . . . 826.5 MQTT Small vs Big message latency . . . . . . . . . . . . . . . . . . . . . . . . . . 836.6 MQTT Small vs Big message packets lost . . . . . . . . . . . . . . . . . . . . . . . 836.7 #Packets Received . . . . . . . . . . . . . . . . . . . . . . . . . . . . . . . . . . . . 846.8 Slave 1 - CPU level - 1 Producer vs 10 Producers . . . . . . . . . . . . . . . . . . . 846.9 Slave 2 - CPU level - 1 Producer vs 10 Producers . . . . . . . . . . . . . . . . . . . 856.10 Slave 3 - CPU level - 1 Producer vs 10 Producers . . . . . . . . . . . . . . . . . . . 856.11 Slave 1 - CPU level - 1 vs 10 Producers . . . . . . . . . . . . . . . . . . . . . . . . 856.12 Slave 2 - CPU level - 1 vs 10 Producers . . . . . . . . . . . . . . . . . . . . . . . . 866.13 Slave 3 - CPU level - 1 vs 10 Producers . . . . . . . . . . . . . . . . . . . . . . . . 866.14 #Nodes in the cluster vs time spent to add another node . . . . . . . . . . . . . . 876.15 #Instances vs time spent scaling them . . . . . . . . . . . . . . . . . . . . . . . . . 886.16 Replication factor vs Avg. latency . . . . . . . . . . . . . . . . . . . . . . . . . . . 886.17 Number of Partitions vs Avg. latency . . . . . . . . . . . . . . . . . . . . . . . . . 896.18 Number of Partitions vs Packet Loss . . . . . . . . . . . . . . . . . . . . . . . . . . 89
7 Jose Soares

List of Tables
4.1 Summary of all ports used for each Pod . . . . . . . . . . . . . . . . . . . . . . . . 57
5.1 Virtual Machine Node’s Configuration . . . . . . . . . . . . . . . . . . . . . . . . . 71
6.1 Increment of RAM usage on tests with one Producer . . . . . . . . . . . . . . . . . 866.2 Increment of RAM usage on tests with ten Producers . . . . . . . . . . . . . . . . 86
8

Abbreviations
3GPP Third Generation Partnership Project. 18, 20
6LowPAN IPv6 over Low-power Wireless Personal Area Network. 28
AES Advanced Encryption Standard. 25
AMQP Advanced Message Queuing Protocol. 14, 22
API Application Programming Interface. 31
AWS Amazon Web Services. 39
Azure Microsoft Azure. 39
CEP Complex Event Processing. 39
CEPT European Conference of Postal and Telecommunications. 20
CoAP Constrained Application Protocol. 14, 22
COM Component Object Model. 36
CoRE Constrained Restful Environments. 26
CRUD Create, Read, Update and Delete. 34
CSS Chirp Spread Spectrum. 17
DCOM Distributed Component Object Model. 36
DNS Domain Name Space. 45, 60
DOS Denial of Service. 25, 28, 37
DTLS Datagram Transport Layer Security. 28
DUP Duplicated. 24
E-UTRAN Evolved UMTS Terrestrial Radio Access Network. 20
EPC Evolved Packet Core. 20
FIFO First In First Out. 31
FRM Frame. 30
FSK Frequency Shifting Keying. 17
GCP Google Cloud Platform. 39
GSM Global System for Mobile Communications. 16
HetNet Heterogeneous Network. 20
9

HTTP Hypertext Transfer Protocol. 34
HTTPS Hyper Text Transfer Protocol Secure. 34
HW Hardware. 41
I/O Input/Output. 79
IANA Internet Assigned Numbers Authority. 25
id identification. 36
IETF Internet Engineering Task Force. 26
IoT Internet of Things. 14
JMS Java Message Service. 31
JPMC JPMorgan Chase. 31
LAN Local Area Network. 20
LooCI Loosely-coupled Component Infrastructure. 22
LoRaWAN Long Range Wide Area Network. 14, 22
LPWAN Low Power Wide Area Networks. 17
LTE Long Term Evolution. 14, 18, 20
LTE Cat-M1 Long Term Evolution Category M1. 20
LTE-A Long Term Evolution Advanced. 20
MAC Medium Access Control. 17.
MIC Message Integrity Code. 30
MIMO Multiple-Input Multiple-Output. 20
MQTT Message Queuing Telemetry Transport. 14, 22
NAT Network Address Translation. 34
NBIoT Narrow Band IoT. 14
NesC Network Embedded Systems C. 22
OPC Open Platform Communications. 35
OPC AE OPC Alarms and Events. 35
OPC DA OPC Data Access. 35
OPC HDA OPC Historical Data Access. 35
OPC-UA OPC - Unified Architecture. 14, 22
OS Operating System. 41
PKIs Public Key Infrastructures. 37
REST Representational State Transfer. 14, 22, 34
RUNES Reconfigurable Ubiquitous Networked Embedded Systems. 22
10 Jose Soares

SDK Software Development Kit. 35
SMS Short Message Service. 20
TCP Transmission Control Protocol. 25, 26, 31
TinyOS Tiny Operating System. 22
TLS Transport Layer Security. 34
TTL Time To Live. 32
UDP User Datagram Protocol. 26
UNB Ultra-Narrow Band. 17
URI’s Uniform Resource Identifiers. 34
VM Virtual Machine. 41
VMs Virtual Machines. 41
WLAN Wireless Local Area Network. 20
WPAN Wireless Personal Area Networks. 18
XML Extensible Markup Language. 38
ZigBee Zonal Intercommunication Global-standard. 14
11 Jose Soares

Contents
1 Introduction 141.1 Objectives . . . . . . . . . . . . . . . . . . . . . . . . . . . . . . . . . . . . . . . . . 141.2 Structure . . . . . . . . . . . . . . . . . . . . . . . . . . . . . . . . . . . . . . . . . 15
2 State of the Art 162.1 Communication Technologies . . . . . . . . . . . . . . . . . . . . . . . . . . . . . . 162.2 Communication Models . . . . . . . . . . . . . . . . . . . . . . . . . . . . . . . . . 21
2.2.1 Publish-Subscribe Pattern . . . . . . . . . . . . . . . . . . . . . . . . . . . . 212.2.2 Request-Response Pattern . . . . . . . . . . . . . . . . . . . . . . . . . . . . 21
2.3 Communication Protocols . . . . . . . . . . . . . . . . . . . . . . . . . . . . . . . . 222.3.1 MQTT . . . . . . . . . . . . . . . . . . . . . . . . . . . . . . . . . . . . . . 232.3.2 CoAP . . . . . . . . . . . . . . . . . . . . . . . . . . . . . . . . . . . . . . . 262.3.3 LoRaWAN . . . . . . . . . . . . . . . . . . . . . . . . . . . . . . . . . . . . 292.3.4 AMQP . . . . . . . . . . . . . . . . . . . . . . . . . . . . . . . . . . . . . . 312.3.5 REST . . . . . . . . . . . . . . . . . . . . . . . . . . . . . . . . . . . . . . . 342.3.6 OPC-UA . . . . . . . . . . . . . . . . . . . . . . . . . . . . . . . . . . . . . 35
2.4 IoT and Cloud Computing . . . . . . . . . . . . . . . . . . . . . . . . . . . . . . . . 382.4.1 Cloud and its Benefits for IoT solutions . . . . . . . . . . . . . . . . . . . . 382.4.2 Monolithic vs Micro Services . . . . . . . . . . . . . . . . . . . . . . . . . . 402.4.3 Kubernetes . . . . . . . . . . . . . . . . . . . . . . . . . . . . . . . . . . . . 402.4.4 Kafka System . . . . . . . . . . . . . . . . . . . . . . . . . . . . . . . . . . . 46
3 Requirements Analysis 483.1 Use Cases . . . . . . . . . . . . . . . . . . . . . . . . . . . . . . . . . . . . . . . . . 493.2 Requirements . . . . . . . . . . . . . . . . . . . . . . . . . . . . . . . . . . . . . . . 50
4 Fault-Tolerant and Interoperable IoT architecture 524.1 Components of the architecture . . . . . . . . . . . . . . . . . . . . . . . . . . . . . 534.2 Kubernetes Environment . . . . . . . . . . . . . . . . . . . . . . . . . . . . . . . . . 59
5 Experiments 715.1 Setup Configuration . . . . . . . . . . . . . . . . . . . . . . . . . . . . . . . . . . . 715.2 Testing Scenarios . . . . . . . . . . . . . . . . . . . . . . . . . . . . . . . . . . . . . 72
5.2.1 Protocols . . . . . . . . . . . . . . . . . . . . . . . . . . . . . . . . . . . . . 725.2.2 System . . . . . . . . . . . . . . . . . . . . . . . . . . . . . . . . . . . . . . 725.2.3 kubernetes . . . . . . . . . . . . . . . . . . . . . . . . . . . . . . . . . . . . 735.2.4 Kafka . . . . . . . . . . . . . . . . . . . . . . . . . . . . . . . . . . . . . . . 73
5.3 Implementation: . . . . . . . . . . . . . . . . . . . . . . . . . . . . . . . . . . . . . 735.3.1 Producers . . . . . . . . . . . . . . . . . . . . . . . . . . . . . . . . . . . . . 745.3.2 Receivers . . . . . . . . . . . . . . . . . . . . . . . . . . . . . . . . . . . . . 755.3.3 Monitor . . . . . . . . . . . . . . . . . . . . . . . . . . . . . . . . . . . . . . 765.3.4 Controller . . . . . . . . . . . . . . . . . . . . . . . . . . . . . . . . . . . . . 775.3.5 Packet Loss . . . . . . . . . . . . . . . . . . . . . . . . . . . . . . . . . . . . 785.3.6 CPU Consumption . . . . . . . . . . . . . . . . . . . . . . . . . . . . . . . . 795.3.7 RAM Consumption . . . . . . . . . . . . . . . . . . . . . . . . . . . . . . . 80
12

6 Results 816.1 Scenario 1: Latency and Packet Loss . . . . . . . . . . . . . . . . . . . . . . 816.2 Scenario 2: Messages with big size - latency vs msg size . . . . . . . . . . 826.3 Scenario 3: Messages with variable size - latency vs message size . . . . . 836.4 Scenario 4: fail recovery (node suddenly unavailable) . . . . . . . . . . . . 836.5 Scenario 5: low vs high throughput . . . . . . . . . . . . . . . . . . . . . . . . 846.6 Scenario 6: Time spent to add a node on a cluster with few vs many nodes 876.7 Scenario 7: Scaling delay . . . . . . . . . . . . . . . . . . . . . . . . . . . . . . 876.8 Scenario 8: Replication Factor . . . . . . . . . . . . . . . . . . . . . . . . . . . 886.9 Scenario 9: Number of Partitions . . . . . . . . . . . . . . . . . . . . . . . . . 89
7 Conclusion 90
A Kubernetes Installation 92
Bibliography 96
13 Jose Soares

1: Introduction
Nowadays the growth of the Internet usage is quite visible. The number of connected devices isincreasing every day. Everything can be a device connected to the network, from smartphones,smartwatches, refrigerators or even televisions. Therefore, there is a net full of things connectedto it, building the Internet of Things (IoT).
Most of these ”things” are constrained devices because they were developed without high pro-cessing, memory or energy capacity. A good example of devices that have these characteristics aresmart sensors, such as small temperature or humidity smart sensors. In this context, everythingthat can be done to decrease the cost of devices or provide better efficiency is very valued.
A good way to improve the efficiency of these devices is by using an appropriate communicationprotocol that takes into account the features present in those devices. There are already manyprotocols proposed in the literature, such as Message Queuing Telemetry Transport (MQTT), Con-strained Application Protocol (CoAP), Long Range Wide Area Network (LoRaWAN), AdvancedMessage Queuing Protocol (AMQP), Representational State Transfer (REST), OPC - UnifiedArchitecture (OPC-UA) or Zonal Intercommunication Global-standard (ZigBee), which are appro-priated for different application contexts.
Besides the communication protocol, also the communication technology used can improve thecapability of sensor networks (things network), which is used for specific application scenarios.There are many communication technologies that allow devices to communicate with each other,such as cellular technologies like Long Term Evolution (LTE) or 5G, satellite or others like NarrowBand IoT (NBIoT). Even with a good protocol and using the best technology available, the IoTsystem may still fail, and if so, data may be lost forever. To prevent such cases, it would be greatif these kind of systems were fault tolerant and able to scale in order to address high number ofdevices. There are frameworks that allow for an automatic management of system failures alreadyin the literature such as Kubernetes and Kafka. A full architecture that comprises things, networkand those frameworks will impose a new generation of IoT systems where scale and failure handlingimproves the IoT system.
1.1 ObjectivesDepending on the goals of each application, protocols might not satisfy all the needed requirements.For example, the MQTT protocol is a publish-subscribe protocol, a pattern that is dominant inIoT, allowing the communication to have better performance when there are a lot of consumerswanting for the same information. On the other hand, there’s, for example, the LoRaWAN protocolthat was designed for long-range communications, taking into account the energy spent in thecommunication. Hence, each protocol might be better suited for different kinds of situations.
Typically, the IoT protocols are proposed individually, taking into consideration their ownrequirements. As a result, each was implemented separately, having created several brokers andservers that work independently. This hinders the creation of a full interoperable system becausefor each protocol there is a need for understanding the broker and/or server implementations todeal with information coming from devices.
Moreover, there is a big heterogeneity in the IoT devices [92], and each of these devices maywork with a specific communication protocol, making deployments complex when different typesof devices are included in the same setup.
Hence, we propose the implementation of a scalable, fault-tolerance architecture that is able todeal with different IoT protocols. It can be used, for instance, to evaluate the protocols behaviourin individual or mixed way, where a device can send, for example, a CoAP or MQTT packet to thesystem and the consumer can receive it through other protocols like REST or Websocket. This
14

architecture brings the possibility to have a set of protocols working on a single IoT network orsystem.
Besides the implementation of the solution, we also intended to perform the tests on the fieldand use different hardware such as Raspberry Pi’s and Arduinos, which allows to obtain realmeasurements and test, for instance, LoRaWAN in a real environment.
Unfortunately, due to the new Corona Virus, which forced us to stay at home for a large amountof time, the real environmental testing was not done. In order to perform tests of our system wedecided to change the initial plan and considered an approach to use the cloud to deploy the systemand use our own machines to send data to the system. After some considerations it was evident thatthe use of the Kubernetes with the cloud (in our case the Google Cloud Platform was considered)would be expensive and these tests would be easier to make on a bare metal environment using alocal machine, the LASIGE Navigators cluster (called LASIGE Quinta) or simple virtual instanceson Google Cloud Platform.
1.2 StructureThe rest of the document is organized as follow: Chapter 2 presents some background of thearea and the State of the Art related with high availability and scalable solutions that can beused in the IoT context. The most commonly used Communication Technologies are presentedalong with their main features and characteristics. Wireless sensor networks and IoT architecturesmay follow different models, which are also reviewed in this chapter. After that, a review of somecommunication protocols used in this kind of communications are presented, such as MQTT, CoAPor LoRaWAN, presenting their main features and patterns that are followed. After this, we discusshow IoT may benefit with the use of the Cloud infrastructure and some technologies that allowour system to be scalable, elastic and fault tolerant such as Kubernetes and Kafka. The maincharacteristics of these technologies are also presented.
In Chapter 3 a requirement analysis is presented. Some use cases and requirements are shownallowing the understanding of what are the main points that an IoT system should be focused on.
In chapter 4, the definition of the system and its architecture is described, explaining the mainfeatures and how it can be used in order to have data flowing from device to device without everbeing lost or having the network overloaded.
In chapter 5 we define a set of experiments that allow better understanding the behaviour andperformance of the proposed architecture, for example if nodes are restored after a fail or howmuch time does it take to add a new node to the system. The results of these experiments arepresented in Chapter 6.
Finally, Chapter 7 concluded the thesis with a reflection of the entire work explaining itsachievements, limitations and improvements that can be done in the future.
15 Jose Soares

2: State of the Art
The deployment of sensors for IoT applications is a challenging task because many issues must behandled. For example, data is flowing at high rates and many times this data is quantitatively big.Also, there is a possibility to store the data and only process it later, but this way the opportunityto have a quick reaction to more urgent scenarios is lost. Typically, IoT applications requirereliable and low power wireless communication links between nodes and gateways. Examples ofsuch applications are smart homes and health care systems.
A sensor, or ”Things” in these kind of environment represents a physical object that can beuniquely identified, capable of communicating with other sensors and/or other entities (with theuse of an address). It may have the ability to measure specific conditions such as temperaturelevel or proximity to other objects [85]. In order to understand the magnitude of the task that isbuilding an IoT system, in the next sections we reviewed the existing communication technologies,patterns and protocols that are known in the literature and may be used to construct such systems.
Additionally, we know that these kind of systems must be scalable, resilient and fault tolerant.In this context we also revised the benefits of using the cloud and other frameworks that allowsystems to fulfill all these requirements. Kubernetes and Kafka frameworks were revised andpresented in section 2.4.
2.1 Communication TechnologiesThe number of IoT devices is growing day by day in different contexts, such as smart cities,smart homes, healthcare among other applications. These devices must communicate wirelesslywith each other very often with some requirements, such as long range, low data rate, low energyconsumption and low cost [94].
There are several technologies that allow wireless communication between devices, but someare most suited for long range communications and others are more suited for short range com-munications. There are also some technologies who take into consideration the need for low powerconsumption, while others don’t take this into account. Examples of technologies that were builtto provide communication in close range are Bluetooth and ZigBee. Using one of these technologiesfor long range communication wouldn’t be feasible unless a mesh network was used to extend thereach of the communication, but in that case there would be a need to have intermediary devices(hops), meaning that more money would be spent in infrastructure. An example of a long rangecommunication technology is the Global System for Mobile Communications (GSM). This type oftechnology is not the best suited for sensor networks because it doesn’t have into consideration thepower consumption of the devices. An example of a technology that allows long range communica-tion and concerns about the devices power consumption is LoRaWAN. Because of this, LoRaWANmay be the best one out of these technologies to use in IoT systems [5, 106].
In the rest of this section the most used communication technologies in the context of IoTapplications are introduced. The following wireless communication technologies are revised: LoRa[13], Sigfox [39], NB-IoT [94], Bluetooth [125], ZigBee [83], Wi-Fi [82], LTE [68], GSM [107].
16

LPWAN Technologies
This technology is being used as a complement, and even replacement, of the traditional com-munication technologies, such as the Bluetooth or Wi-Fi technologies, allowing the nodes to com-municate with low cost, having a radio chipset that costs at maximum 2€, operating cost of 1€for each device a year [94]. Low Power Wide Area Networks (LPWAN) ensures low power con-sumption with nodes working with a battery with lifetime over 10 years. Besides all of this,LPWAN enables communication over long distances, from 10km to 40km and 1km to 5km dis-tance range, in rural and urban areas, respectively. There are many LPWAN technologies, such asthe LoRaWAN , Sigfox, LTE-M and NB-IoT .
According to Ikpehai et al. [71] and Mekki et al. [94], the most used LPWAN technologies arethe LoRa, Sigfox and NB-IoT. LoRaWAN (with LoRA in the Physical layer) is the most deployedLPWAN technology in IoT use cases due to its signal propagation method (Chirp Spread Spectrum[108]) and provides a better coverage, reliability and data rate [94].
• LoRaLoRa is an LPWAN technology that uses Chirp Spread Spectrum (CSS) modulation [45].It was designed to have low power characteristics and increased communication range whencompared with, for example, the Frequency Shifting Keying (FSK), which is a often used mod-ulation technique for achieving low power communication [5]. LoRa implements a MediumAccess Control (MAC) layer protocol where protocols like LoRaWAN can be integrated givingthem access to the LoRa architecture [44].With LoRa technology the range utterly depends on the environment and obstructions onit, i.e. for an urban environment the range may be between 2 km to 5 km and for a ruralenvironment this range may go up to around 45 km [5, 44]. Despite this, when combinedwith LoRaWAN it offers a better link budget then most of the standardized communicationtechnologies [5].LoRa operates in specific frequency bands that are relative to the region of usage, for example,in Europe it operates in frequency band 867-869MHZ but in North America the frequencyband is 902-928MHz [5, 13].
• SigfoxSigfox is also an LPWAN technology, similar to LoRa, working as a network operator but alsobeing a company (while LoRa belongs to Semtech Corporation) [71]. It allows communicationover long distances with an approximated speed of 100-600 bps (bits per second) [39]. Thistechnology was created in France (Toulouse) and it has been commercialized worldwide dueto its partnerships with other network operators [94].To make this possible, Sigfox uses a technology called Ultra-Narrow Band (UNB) [7] whichallows for a bidirectional connection between nodes and a base-station. This base-station isresponsible to send data received from the nodes to the Sigfox cloud, which forwards theinformation to the client cloud where the data is visualized and manipulated as the clientwishes. The Sigfox system architecture is represented in figure 2.1.Based on UNB technology, due to its high wave-length and low bandwidth, Sigfox is able tosend messages in a reduced bandwidth (less then 200Hz), with the ability to reach more than30 km distance in rural areas. UNB also provides noise-cancelling features, which improvesthe communication [39].
17 Jose Soares

Figure 2.1: Sigfox Network [39]
• NB-IoTAnother LPWAN technology is the Narrowband Internet of Things [94]. It was standardizedby Third Generation Partnership Project (3GPP), and publicly released in June 2016. InDecember 2016, both Vodafone and Huawei integrated the technology on a Spanish Vodafonenetwork and sent the first message following the standard to a device placed on a water me-ter [94]. Since this technology rises from another one named LTE it inherited some featuresand sets of specifications that are very well suited for smart metering use cases. In terms ofenergy this technology is comparable to LoRa, and even sometimes outperforms it. Batterylifetime may reach more than 10 years [11]. One of the differences between NB-IoT and LTEis that NB-IoT is more stationary, data is transmitted on small chunks and applications areprepared for that. Another difference is that NB-IoT responds well when having a big num-ber of devices, and those devices may even be installed on troublesome places like basementsor high points (top of buildings) [93].
Short Range Technologies
• BluetoothBluetooth technology was created by a group of the biggest companies in 1998 (Ericsson,Nokia, IBM, Toshiba and Intel) as a solution for wireless data communication interface thatallowed exchange data in a seamless way [41, 55, 125]. Devices with Bluetooth capabilitiescan be used as bridges between networks, or nodes of an ad-hoc network, transporting smallamounts of data and over a short range. These devices are able to detect each other andconnect to one another using radio waves with frequency 2.4 GHz. This kind of applicationsare known as Wireless Personal Area Networks (WPAN) [55].
18 Jose Soares

Bluetooth devices may work in two different modes, the Slave mode and Master mode.The Slave nodes may be active or asleep and are connected by one or more Master nodes.Nodes may act as both the Slave or the Master at the same time in order to connect multiplePiconets, creating the Scatternet. Piconets are groups of up to eight active nodes workingtogether, with one Master node, seven Slave active nodes and zero or more sleeping slavenodes. When Piconets are connected together they form a larger Bluetooth Network calledthe Scatternet as visible in figure 2.2. Masters on the network send inquiries to know whichnodes are available on the area. If there is a recently awaken Slave node in the area, it willrespond to the Master providing its address. After this, the Master may send a request toestablish a connection, which must be accepted by the Slave. Both devices then start syn-chronizing in a specific frequency defined by the Master, which is different for every Piconet,allowing data to be exchanged. When the connected devices are not needed in the network,they have the option to enter power or bandwidth saving modes [55].
Figure 2.2: Overview of the Piconet and Scatternet [55]
• ZigBeeZigBee is a Wireless Personal Area Networking (WPAN) open standard created by the ZigBeeAlliance. it was designed specifically to meet sensors and control devices needs, such as lowlatency, cost, energy consumption and low bandwidth [83].It is based on the IEEE 802.15.4 Medium Access Control (MAC) and Physical Layers pro-viding technologies that enable networks to be scalable, self-organizing and self-healing whiletrading data. It is characterized for having a very low rate, which consequently consumesless power and increases the battery lifetime. Although its range is not very wide, it can beused with a mesh network, which provides high reliability and larger range [3].ZigBee has two major low power consumption modes, the TX/RX and Sleep mode. On theTX/RX mode, sensors send (TX - transmit) and receive (RX - receive) the data that iscollected, while on the Sleep mode devices are placed in stand by. There are two differentways to transmit data called Traffic Types. They are:
– Periodic: The application must provide the value of the data rate. Devices will activateon the given time/rate, check for data, send it and then deactivate again [3].
– Intermittent: Traffic may be stimulated by an application or an external stimulatordefines the data rate. For example, a light switch or smoke detectors. This way, datais not send periodically, instead, different amount of time may pass between each send(intermittent sending) [83].
19 Jose Soares

• Wi-FiThe Wi-Fi, Wireless-Fidelity, protocol (also referred to as Wireless Local Area Network(WLAN) or IEEE 802.11) allows us to have a Local Area Network (LAN) on which devicesare connected and are capable of communicating with each other wirelessly. Devices suchas laptops or smartphones connect to a router or access points (hotspots) which generatesWi-Fi signals [122]. IEEE approved the 802.11 standard (Wi-Fi) in 1997 specifying the MACand Physical layers for transmission with 2.4 GHz band and signal rate up to 2 Mbps [55,82]. Many amendments were made from then on, and in 2009 an amendment called theIEEE 802.11ad started with the goal of addressing the 60GHz band technology with higherbandwidth of 2160 MHz [82, 102] and data rate of 6.7Gbps with a cost of distance (this datarate is only possible at 3.3m of the access point) [112]. IEEE 802.11 is based in a cellulararchitecture where devices, also called Stations (STA), are connected with a base stationcalled Access Points (AP) (also called medium) which is connected to a LAN, when thereis one. STA’s may be mobile, portable or stationary and must support STA services. STAServices are the authentication, deauthentication, privacy and data delivery. AP’s providedistribution services which may be the association, reassociation, disassociation, distributionand integration. Since the architecture is not centralized, it is very flexible and helps pre-venting bottlenecks, allowing for small networks with few devices and large networks withseveral access points and servers. Also allowing for these networks to be permanent or semi-permanent, lasting for several years or for a short duration time [100].
Cellular Technologies
• LTEThe LTE standard was first released in 2009 by the 3GPP. LTE is an IP-based network thatbrought higher data rates and lower latency than those of the 3G. This technology allowedcellular operators to use a wider spectrum. To achieve this goals the air interface and thenetwork architecture evolved to the Evolved UMTS Terrestrial Radio Access Network (E-UTRAN) [50] and Evolved Packet Core (EPC) [62], respectively. To test LTE technology,the first deployment was made in a limited scale, in Scandinavia. Nowadays deploymentsare being done all around the world in a large scale [42, 86]. Along the years many releaseshave been published by 3GPP with improved performances of the LTE. In the 10th and 13thRelease the Long Term Evolution Advanced (LTE-A) and Long Term Evolution CategoryM1 (LTE Cat-M1) (LTE-M) were announced, respectively. The former uses a high-reorderMultiple-Input Multiple-Output (MIMO), carrier aggregation and deployment strategies thatare based on Heterogeneous Network (HetNet), which is an heterogeneous network topologythat uses macrocells, picocells, metrocells, relays and femtocells. The latter was speciallydesigned for an IoT environment, being an LPWA technology that supports lower devicecomplexity, extended coverage, bigger battery lifetime at lower costs [42, 86].
• Global System for Mobile CommunicationsGSM technology is related to mobile communication specifically, being the most used stan-dard in cell/mobile phones. With this technology people from all around the world are ableto make wireless calls. It was created by the European Conference of Postal and Telecom-munications (CEPT) in 1982, being only commercially from 1991 on, providing standardfeatures such as phone call encryption, data networking or Short Message Service (SMS) [52].
20 Jose Soares

2.2 Communication ModelsThe Publish-Subscribe and Request-Response models are commonly used communication approachesin IoT architectures [92, 104]. The following subsection presents a description and discussion abouteach pattern in order to have a better understanding about how they work.
2.2.1 Publish-Subscribe PatternThe Publish-Subscribe Pattern has three main components, the Publisher(s), the Broker(s) andthe Subscriber(s) that work together to establish communication (figure 2.3). This communicationworks around Topics that describe data is going to be exchanged using a string format. Thisstring may contain multiple levels, divide by slashes, for example: topic 1: ”room41/device10”,topic 2: ”room41/device10/temperature” [104]. Every time data is published or subscribed, itmust be done on a given Topic, which is registered by the Broker on the moment of the publishingor subscribing if it doesn’t exist already.
Figure 2.3: Pub-Sub Pattern [104]
The Publisher is responsible for the publishing of data (information for example, a temperaturevalue) to the Broker (on a specific topic). In turn, the Broker is responsible to forward thedata received from that publisher and topic to all Subscribers that had subscribed the topic.These exchanged data is the information included in packets with a specific format defined bycommunication protocols. They are called messages.
Subscribers are responsible for subscribing to a specific topic, receiving messages from theBroker every time that a publisher sends messages to the topic. Both Publisher and Subscriber actas Clients and neither of them needs to know about each other’s existence. The communication isdecoupled which means they also don’t need to run synchronously [92]. For example, consideringa temperature sensor that has a new value to output, it will be published to a Broker on a specifictopic (e.g. topic ”temperature”). If a client wants to receive data from the topic, it needs to knownthe name of the topic and subscribe it by sending a subscribe message to the Broker. Upon newdata is received at Broker, it will be forwarded to all registered clients.
The Publish-Subscribe pattern is a widely used model in IoT architectures because it is verylight weight and efficient in terms of resources and scalability [104].
2.2.2 Request-Response PatternOn the other hand, the Request-Response pattern doesn’t include a Broker. Instead of a Broker,there is a component called Server, which sends data to Clients as visible in figure 2.4. Thedata exchanged is identified by resources and those resources are made available for clients. Forexample, if a temperature sensor sends a PUT request with payload ”23ºC” to a resource called”Temperature”, this payload will be saved by the Server and everytime another client performsa GET command requesting for that resource, the server provides that temperature value to theclient. The commands available to request the server are the PUT, GET, POST and DELETE.These commands allow managing the content and the resource itself on the server. A good exampleof this pattern is a RESTful API, which is widely used and it is supported by the HTTP protocolwhere Web Browsers act as client in order to put and ask for resources [92].
Unlike to the Publish-Subscribe pattern, this pattern requires a synchronous communicationschema, so a direct coupling between the communicating clients is needed [92].
21 Jose Soares

Figure 2.4: Request Response Pattern
2.3 Communication ProtocolsThere’s a lot of research being done around communication protocols for IoT. These protocolswere defined to fit embedded devices and try to improve the communication between those devices.Some good examples of these protocols are MQTT, CoAP, LoRaWan, AMQP, REST, OPC-UA andZigbee.In this chapter we will review and discuss the main aspects of these protocols. Although,there are many other protocols such as Loosely-coupled Component Infrastructure (LooCI) [70],Network Embedded Systems C (NesC) [65] used in the Tiny Operating System (TinyOS) operatingsystem [88], or Reconfigurable Ubiquitous Networked Embedded Systems (RUNES) [47]. Theseprotocols follow the publish-subscribe pattern but are less used in the literature. They weredeveloped for specific contexts and are not generic protocols.
In IoT architectures there are two main communication styles (publish-subscribe and request-reply patterns [104]) used to exchange data between the devices. Both are widely used, but ac-cording to Gowri S. R. et al. [104], the request-reply pattern isn’t appropriated to be used inconstrained devices because it is not designed to be scaled and its portability is weak.
In these subsections we will discuss the communication protocols that are being researchedand used by the community (meaning scientists, researchers, students and even companies). Weconcentrate our discussion around the MQTT, CoAP, LoRaWAN, AMQP, REST and OPC-UAprotocols. The majority of these protocols fit in the Application layer of the TCP/IP model asshown in Figure 2.5.
Figure 2.5: Communication Protocols on the network layers - TCP/IP model [84]
22 Jose Soares

2.3.1 MQTTMQTT is a communication protocol standardized by OASIS [38] that uses the publish-subscribepattern to establish communication. It provides one-to-many communication (one sending, multi-ple receiving or vice-versa), being one of the most used protocols in IoT applications. MQTT isopen-source, lightweight, data-centric and designed to be used in constrained environments like inIoT [92, 104]. Devices involved in the communication do not need to know the address of othernodes (consumers) because data is forwarded by a Broker and everyone just needs to know theBroker address [92].
MQTT runs over TCP/IP or over any other network protocol that provides ordered, lossless,bidirectional connections. The protocol’s first version was MQTT v3.1.1 being also standardizedas ISO/IEC 20922:2016. Nowadays MQTT v5.0 is available bringing better scalability, improvederror reporting, Session Expiry or Message Expiry [38, 101].
Functionality
MQTT follows the Publish-Subscribe communication model and describes how the communi-cation should occur between end-devices. It is supported by a Broker, which its responsibility isto forward the published messages, on a specific topic, to the subscribers. These end-devices areany device that intends to send or receive messages (Publisher or Subscriber).
There are many types of messages available to be sent, such as the Connect, Publish or Sub-scribe Messages, for creating a connection to the broker, publish data to the broker or subscribedata from the broker. The MQTT protocol defines three QoS levels. These levels are used toassure that the communication is being done under certain level of assurance.
MQTT Message Format
This protocol works by exchanging messages between nodes, these messages are series of MQTTControl Packets that are divided in three parts, the Fixed Header with 2bytes of size, the Vari-able Header and the Payload as shown in Figure 2.6 [38].
Figure 2.6: MQTT Control Packet Format [38]
The Fixed header is present in all MQTT Control Packets. It has 1 byte (8 bits) reserved forthe type of message and for flags (4 bits each), which represents the MQTT Control Packet Type.The final byte represents the Remaining Length containing the number of bytes remaining withinthe current packet, which includes the Variable Header and the Payload.
23 Jose Soares

Variable header is only present in some MQTT Control Packets, they are: ”CONNECT”,”CONNACK”, ”PUBLISH”, ”PUBACK”, ”PUBREC”, ”PUBREL”, ”PUBCOMP”, ”SUBSCRIBE”,”UNSUBSCRIBE”, ”SUBACK”, ”UNSUBACK”, ”PINGREQ”. This header’s content depend onthe packet type [38]. For most of the packet types, the Variable Header contains a two Byte Integerpacket identifier field that once set for an MQTT Control Packet, it only becomes available againfor reuse when the sender has processed its acknowledgement. This header finishes its fields with aset of Properties which are composed by a field with Property Length corresponding to the lengthof the properties and the actual Properties, which includes an Identifier that defines the message’susage, data type and value.
The Payload field is where the actual content of the message is. It is not included in all MQTTControl Packets.
QoS
In this protocol the concern is only with the delivery of an application message from a singlesender to a single receiver, this way when a server is sending messages to many clients, each ofthem are dealt with independently [38]. The MQTT protocol offers three different levels of QoS:
• QoS 0 - “At most once”Best effort, sends only once. Some messages may never reach the destination. The receiversends no response and the sender doesn’t resend messages, so the message either gets thereat the first try or it doesn’t reach the destination at all [38].
• QoS 1 - “At least once”The sender re-sends messages if they don’t get to the destination, some messages may beduplicated but there is assurance that the message is received at least once. The sender waitsfor a PUBACK, from the receiver, after sending the PUBLISH packet “publish1”. If it isreceiving other PUBACKS the sender compares each message Packet Identifier to know ifany of them are from the message “publish1”. If the sender waits a reasonable amount oftime without getting the PUBACK, it re-sends the “publish1” message [38].
• QoS 2 - “Exactly once”Messages are assured to arrive exactly once at the cost of some performance by the usage ofa four-part handshake. The sender assigns an unused Packet Identifier to a PUBLISH packetbefore sending it, and then waits for a PUBREC, meanwhile re-sends the PUBLISH packetin a reasonable amount of time. After receiving the PUBREC packet, sends a PUBRELpacket and waits for a PUBCOMP packet (with Duplicated (DUP) flag). After receiving thePUBCOMP the Packet Identifier becomes available again. An illustration of the protocolusing this QoS level is shown in figure 2.7 [38].
Figure 2.7: MQTT QoS level 2 [119]
24 Jose Soares

Security
MQTT protocol specification lets to developers the choice to have privacy, authenticationand/or authorization implemented. Although there is a strong recommendation to use the Trans-mission Control Protocol (TCP) port 8883 (Internet Assigned Numbers Authority (IANA) [48] withservice name: ”secure-mqtt”) [38].
To understand how to better security and how to protect the communication with MQTT,there are some threats that were identified and are very important to fight [38]:
• Devices can be compromised: Developers must be aware that the devices in the communica-tion might be hacked, therefore being compromised and possibly work in malicious ways, forexample sending packets with malicious content.
• Possible access of the data in the Clients and Servers: The same way that devices may becompromised, so their data may also be compromised, meaning that even if a device is notcompromised, it can still work with maliciously manipulated data that had previously beendeformed by an attack.
• Protocol behaviors could have side effects: This protocol has specified QoS levels which sendadditional packets in the communication to guarantee its level of assurance that the messagewas received, an example of this is the Acknowledgment message. This kind of behaviour isspecific for each protocol, so attackers can possibly use timing attacks [111] to find vulnera-bilities on the communication.
• Denial of Service (DOS): One of the most common attacks on the web are the DOS attacks,which stands for Denial of Service, in this kind of attacks, attackers use malicious softwareto request operations on the system, in this case, the Broker, in the order of millions or morerequests, which will consume a lot of effort from the system to respond to them, and actuallyresulting on some failures and real requests to not be dealt with, denying the services thatthe system provides.
• The communication can be intercepted, modified, re-routed or deleted: Even if the devicesand their data are protected, between the time that the data leaves the device to get tothe Broker, and from the Broker to the devices the communication might be intercepted,meaning that a sent message might be caught by a malicious program and be changed, sothe communication channels also must be secured.
• Malicious MQTT Control Packet may be sent to the net: Attackers may also inject spoofedMQTT Control Packets into the network, meaning that this messages have false IP addressesthat are read by the system as true IP addresses misleading the Brokers to accept themalicious messages when they shouldn’t.
A good way to protect the communication could be to use an implementation that follows thespecific industry security standards such as NIST Cyber Security Framework or PCI-DSS [38].
In terms of cryptography, the most used algorithm is the Advanced Encryption Standard (AES),but in the case where the systems are embedded many of the devices may not support this kindof algorithm (concerning the Hardware), a better solution could be the ChaCha20 [99], which en-crypts and decrypts the messages much faster, but it not as widely available as the AES algorithm[38].
25 Jose Soares

Implementation of MQTT
A very widely used implementation of this protocol is the Mosquitto, through its Broker, Pub-lisher and Consumer developed in C programming language with its open source available ongit hub1 [89, 57] . The state-of-the-art also comprises other Brokers that provide MQTT basedcommunication, such as Kafka [54] or RabbitMQ [115].
Kafka was developed to be used in data centers, being relatively heavier than Mosquitto, butbringing some other features such as ordering guarantees and configurable persistence of messages[54].
RabbitMQ is an open source message Broker that was developed with Erlang [8] by the OpenTelecom Platform framework [54].It allows communicating through MQTT and other protocolssuch as AMQP [123].
2.3.2 CoAP
A group of the Internet Engineering Task Force (IETF) named Constrained Restful Environments(CoRE) built an application layer protocol called CoAP [63]. It is based on the REST protocol(using HTTP functionalities). This protocol is very suited for the IoT environment since by defaultit uses User Datagram Protocol (UDP) instead of TCP. UDP has some known issues, being one ofthem the reduced reliability when comparing with TCP, because of this, IETF has started a newdocument for the standard to open the possibility for CoAP to run over TCP, being this only inthe beginning [51].
This protocol follows the request-response model. It supports the GET, POST, PUT andDELETE methods. Even though CoAP modifies some of these functionalities to guarantee betterefficiency when the devices are constrained, having low processing capacity or bad links on thecommunication [63]. To improve the communication, CoAP responses are not sent over a previouslyestablished connection, instead they are exchanged asynchronously over CoAP messages which arepackets that have a specific format defined by CoAP protocol. This improves the performance butmay decrease the reliability [51].
Figure 2.8 represents how CoAP works. Since REST architecture is already very widely usedwith HTTP, by having a Proxy in between to translate this two Protocols, we can have a networkof things communicating through the internet using CoAP. Things communicate through CoAPusing a CoAP Server, that communicates to the rest of the Internet using the REST-CoAP Proxyto make a straightforward conversion between the two protocols [63].
CoAP is very lightweight being ideal for IoT environment with constrained devices. However,it still offer low portability for a wide range of platforms and shows poor scalability [104].
Figure 2.8: CoAP Functionality [63]
1https://github.com/eclipse/mosquitto
26 Jose Soares

Functionality
CoAP is divided into two different logic layers, the first layer is the Request/Response layer,which deals with the implementation of the REST paradigm, similar to HTTP. What differen-tiates CoAP from HTTP is the second layer, called Message layer. This layer deals with there-transmissions when packets have been lost, since UDP has no reliable connections as explainedin 2.3.2 [51].
Since CoAP is based on HTTP commands, when an end-device wants to send data to a serverit uses the Put or Post command, and when a device wants to get some information from the serverit uses the GET command. To ensure that a messages arrives at destination, CoAP defines fourtypes of messages (described below), which are used to perform handshakes assuring the messagehas arrived or not.
CoAP also has an option to improve the request-response approach by allowing clients to con-tinuing receiving messages from a resource that was requested on the Server (observable option).This is done by adding an observe option to the GET request, which is added to the Server ob-server’s list. When the resource state changes, clients in the list are notified. Through this option,CoAP offers a closer behaviour to the publish-subscribe pattern with the clients being notified ofchanges in the resources they ask for.
CoAP Message’s Format
A CoAP message is divided in four fields, as shown in the figure 2.9. The first field is fixedand corresponds to the Header . It occupies four bytes. The Header is composed by the CoAPVersion, the Type of transaction, the Option Count (OC), the request method/respond code(Code) and a message identifier (Message ID). The second field is an optional Token value thatis used for correlating requests and responses, this value can occupy up to eight bytes. The nexttwo fields are optional and they are reserved to add Options and the Payload [63]. A typicalCoAP messages occupy from ten to twenty bytes in total [63].
Figure 2.9: CoAP Message Format [63]
Type of messages
At the message layer level four different types of messages [51]: CONFIRMABLE, NON-CONFIRMABLE, RESET and ACKNOWLEDGMENT are defined.
When a CONFIRMABLE message is sent by a client, it waits for an ACKNOWLEDGMENTfrom the CoAP Server, re-sending the original message with a certain interval until it gets theACKNOWLEDGMENT.
When using the NON-CONFIRMABLE type, the client won’t be waiting to receive an AC-KNOWLEDGMENT message from the Server, it just sends the message and hopes it gets there.There is no guarantee that the CoAP Server actually got the message. The RESET messagesare used by the Server when it notices that messages were missed or other issues occurred [63].ACKNOWLEDGMENT messages are used to acknowledge that some message has arrived (CON-FIRMABLE Messages). This doesn’t mean that it indicates success or failure of the request made,
27 Jose Soares

but it may contain a response for that request, in this cases the response is called a PiggybackedResponse (Acknowledgment with reply) [113].
Security
In terms of security, CoAP makes use of Datagram Transport Layer Security (DTLS) which isbased on a slightly changed TLS protocol to achieve better compatibility with constrained devices.The DTLS runs on top of UDP transport layer [105, 51]. Some of the modifications include stoppingthe termination of the connection when packets are lost or out of order. Another example is thehandshake process, where the possibility to add a verification query by the Server. This featureallows making sure that the Client is sending the packets from the authentic source address, whichprevents DOS attacks [51].
By using DTLS, every time a message is sent or arrives at a device, the protocol dictates thedecryption and decompressing that must be preformed [105]. However, DTLS protocol wasn’tbuilt for the IoT environment. Based on DTLS, the literature comprises the IPv6 over Low-power Wireless Personal Area Network (6LowPAN). This new versions tried to optimize it for theconstraint devices situation [51, 105].
CoAP defines four security modes [105, 114]:
• NoSec: The NoSec mode means ”No Security” which dictates that there is no securityprovided in the CoAP transmitted messages, hence packets are sent over UDP and IP.
• PreSharedKey: In the PreSharedKey mode, there is a list of pre-shared keys where each keyhave a list of nodes and may be used to validate the communication. In this mode there is thepossibility to have a key for each device or for a group of devices. The mandatory cipher suitethat must be implemented on this mode is the TLS PSK WITH AES 128 CCM 8 specifiedin [49].
• RawPublicKey: This is a mode where a device may have one or more asymmetric pairs ofkeys without certificates (Raw Public Keys). For this mode the mandatory cipher suite tobe implemented is the TLS ECDHE ECDSA WITH AES 128 CCM 8 specified in [118].
• Certificates: This mode works around a certification chain, where authentication is basedon public key. Each time a new connection is established, certificates from external de-vices must be validated. Sometimes, nodes may need more than one certificate as theymay have more than one Authority. This mode must include an implementation of theTLS ECDHE ECDSA WITH AES 128 CCM 8 cipher suite, specified in [49]
In Raw Public Key and Certificate modes, connections that are established are set up with au-thentication in both ends of the communication which allows to maintain the connection in orderto reuse it in future data exchanges.
Implementation
This protocol only defines how the communication should be done, allowing anyone to im-plement its features. Many implementations of CoAP were proposed throughout the years, assuggested in [43]. Some examples are the Libcoap [40] which is a C library and CoAPthon [64]a Python library. With each of this libraries it’s possible to build our own server, clients andresources without much complexity. However, these implementations are not suitable for smallembedded devices, such as Arduino. To be able to transmit information with CoAP protocol inthis kind of devices specific Arduino libraries must be used, for example CoAP simple library isone of them.
28 Jose Soares

2.3.3 LoRaWANLoRaWAN is a media access control (MAC) protocol for wide area networks. It is designed toallow low-powered devices to communicate with Internet-connected applications over long rangewireless connections. Typically, a star architecture is used and three kind of possible devices aredefined [5, 13]:
• End devices: nodes who send the data to the LoRa gateway
• Gateway: forward packets sent by those nodes to the Network Server
• Network Server : manages information that was exchanged. servers that route messages fromEnd Devices to the right Application, and back.
This kind of architecture preserves the battery lifetime plus through the use of LoRa on thephysical layer, long range is achieved [5]. Figure 2.10 shows a typically architecture for LoRaWANprotocol. Through this architecture all application complexity is implemented in the server [5, 13].
Figure 2.10: Lora’s Star Architecture [13]
Functionality
LoRaWAN supports many gateways receiving data from nodes. Each gateway forwards the datareceived to the destination using the cloud-based network with, for example, WiFi or Ethernet con-nection. The complexity may be pushed to the cloud side of the network [5]. The communicationoccurs in an asynchronous way, and only when data is ready to be sent, which can be done viaevent-driven or scheduled way [5].
Message Format
LoRaWAN architecture is divided in two layers, the Application layer and the MAC layer, bothon top of Lora’s Physical Layer, as shown in figure 2.11 [81].
Figure 2.11: LoRaWAN Architecture Layers [81]
29 Jose Soares

Figure 2.12 represents the MAC layer message format that is used by LoRaWAN. This formatincludes: a MAC header with one byte, a MAC Payload with variable size and the MessageIntegrity Code (MIC) (similar to a checksum) with four bytes that is build based on the previousMAC Header and MAC Payload fields with use of a Network Session Key [81, 98]. The NetworkSession Key is an application session key that is generated when a device joins to a network, beingshared with the network, and is used for validate the exchanged messages between the nodes andthe Network Server using the MIC [98].
Wrapped inside the MAC Payload is the Application message, which has the following format(also visible on the 2.12 figure): the first field is the Frame (FRM) Header with seven to twentytwo bytes. It is followed by a multiplexing port called FPort with one byte and the FRM payloadwith variable size, which is encrypted with an Application Session Key. An Application SessionKey is also generated when a device joins a network just like the Network Session Key, but thiskey is kept private, being used for encryption and decryption of the payload based on the AES 128algorithm [81, 98].
Figure 2.12: LoRaWAN Packet Format [81]
Security
LoRaWAN specifies a number of security keys [5]: NwkSKey, AppSKey and AppKey. All keyshave a length of 128 bits. The algorithm used for this is AES-128, similar to the algorithms usedin other low power standards (e.g. 802.15.4).
• The Network Session Key (NwkSKey) is used for interaction between the Node and theNetwork Server. This key is used to validate the integrity of each message by its MessageIntegrity Code (MIC check). This MIC is similar to a checksum, except that it preventsintentional tampering with a message.
• The Application Session Key (AppSKey) is used for encryption and decryption of the payload.The payload is fully encrypted between the Node and the Application Server component.This means that nobody except the user is able to read the contents of messages you sendor receive.
• The application key (AppKey) is only known by the device and by the application and isused to derive the previously mentioned NwkSKey and AppSKey.
The session keys (NwkSKey and AppSKey) are unique per device and session. When a devicejoins to the network (this is called a join or activation), an application session key AppSKey anda network session key NwkSKey are generated using the AppKey. The NwkSKey is shared withthe network, while the AppSKey is kept private. These session keys will be used for the durationof the session.
30 Jose Soares

2.3.4 AMQPIn what concerns asynchronous messaging, one of the most recognized standards is the Java Mes-sage Service (JMS), but it is an Application Programming Interface (API) standard, not a speci-fication of protocol [123].
In order to change this situation and have an open asynchronous messaging standard protocolthat provides interoperability and is extendable at business scale, in 2006 the AMQP protocol wasproposed by the working group JPMorgan Chase (JPMC), composed by companies such as CiscoSystems, Envoy Technologies, iMatix Corporation, IONA Technologies, Red Hat, TWIST ProcessInnovations and 29West [123].
AMQP is a publish-subscribe protocol that allows applications to send and receive messagesdefining the specification of what messages and from where they can be received. It also providesfunctionalities to configure security, reliability and performance [54, 126]. The protocol runs overTCP [126]. AMQP protocol was designed and built based on the finance requirements, which arevery challenging because they require extremely high performance, throughput, scalability, relia-bility and manageability. In this kind of business area, few microseconds might be a real problem,making them loose or win against competition on a trade. Also losing messages is not an option,messages arrival must be assured as they might mean costs to the enterprise [123]. Figure 2.13shows the AMQP architecture.
Figure 2.13: AMQP Architecture
Functionality
In AMQP architecture, client applications are known as producers (”publishers”) while AMQPserver is known as broker. Client apps create messages which are given to the broker. In thebroker, messages are routed and are queued using a First In First Out (FIFO) order. They arebeing read by consumers from the queues where they are processed. These client applications areknown as consumers (”subscribers”). AMQP divides messaging Broker tasks in two modules:
• Exchanges: is the component responsible for accepting messages. This messages are after-wards forwarded to specific queues based on a set of rules and criteria, never storing them[123, 126]. The messages contain routing keys which are used by ”exchange” module in orderto route them. There are three different types of exchange methods
– direct exchange: A routing key is used to bind the exchange to a message queue. Fromthen on, messages from publishers will only be routed to that queue if the routing keyfrom the publisher matches the routing key used to bind the exchange and messagequeue [9].
– fanout exchange: Message queue binds without routing key, meaning that it receives allmessages published, there is no condition associated [9].
31 Jose Soares

– topic exchange: When a message queue binds to an exchange, a routing pattern P isassociated with the binding and that queue will only receive messages that are publishedwith a routing key P that matches the routing pattern, otherwise messages aren’t notforwarded to that queue.
• Message Queues: is the component that stores messages and send them to the respectiveconsumers. Usually messages are stored just until they are sent to the consumer [123, 126].
Therefore, there is a responsibility chain, where each processor acts on the received message,rejecting it, adding/modifying it or just forwarding it to the destination. This architecture im-proves flexibility because it allows developers to add more components or modify the ones thatalready exist [123].
Message Format
The AMQP message format is composed by five fields, as illustrated in figure 2.14. it is com-posed by an Header , a Delivery-Annotations, a Message Annotations, a Bare Messageand a Footer fields.
The Header field is divided in five sections [117]:
• Durable: A durable message means that even if an intermediary node in the communicationunexpectedly terminates, the message is still preserved. This section is of type Boolean (1byte) with False value by default.
• Priority: Responsible for carrying the level of priority of the message represented by a ubyte(1 byte) value, the higher number represents the higher priority.
• Time To Live (TTL): Defines the time that a message is considered to be ”alive” inmilliseconds, being discarded when this time has passed. This helps preventing deliveryloops.
• First-Acquirer: If this field has a true value, it means that the message has not beenacquired before, but if the value is false, then it is not guaranteed that the message has beenacquired before, it only may have been. Represented by a Boolean value (1 byte)
• Delivery-Count: Number of unsuccessful delivery attempts represented by a uint (1 byte)value. Non zero values may mean a duplicate message.
Delivery-Annotations field is used to carry properties that aren’t specific from the standard,such as information from the sending node to the receiving node. These annotations must beknown by both ends for the properties to be transmitted.
Message Annotations is a field that carries properties of the message that are propagatedin every hop of the communication. These annotations carry information about the message. Inthe communication process, some intermediaries may not understand the annotations’s purpose,they may only be used as attributes which are filtered.
Each Bare Message is composed by:
• Properties: Standard properties of the message are saved here, such as the Message-Id -unique identifier of the message, User-Id - unique identifier of the user that produced themessage or ”to” - property which identifies the message destination address.
• Application-Properties: This field is reserved for structured application data, which maybe used or filtered by intermediary nodes.
• Application-Data: Contains binary data corresponding to the payload.
Footer field is used to store details about the message delivery, only being calculated afterthe bare message has been totally finished, or being evaluated before seeing the message content.Examples of this details are hashes, signatures or encryption details [117].
32 Jose Soares
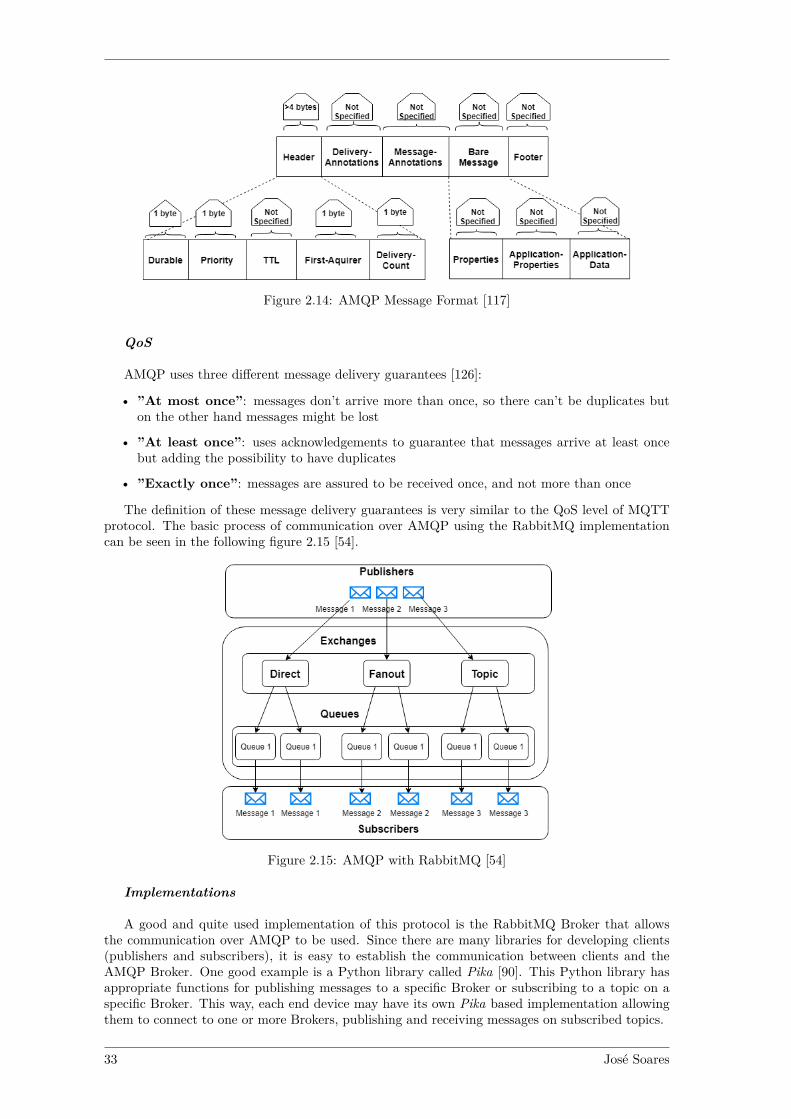
Figure 2.14: AMQP Message Format [117]
QoS
AMQP uses three different message delivery guarantees [126]:
• ”At most once”: messages don’t arrive more than once, so there can’t be duplicates buton the other hand messages might be lost
• ”At least once”: uses acknowledgements to guarantee that messages arrive at least oncebut adding the possibility to have duplicates
• ”Exactly once”: messages are assured to be received once, and not more than once
The definition of these message delivery guarantees is very similar to the QoS level of MQTTprotocol. The basic process of communication over AMQP using the RabbitMQ implementationcan be seen in the following figure 2.15 [54].
Figure 2.15: AMQP with RabbitMQ [54]
Implementations
A good and quite used implementation of this protocol is the RabbitMQ Broker that allowsthe communication over AMQP to be used. Since there are many libraries for developing clients(publishers and subscribers), it is easy to establish the communication between clients and theAMQP Broker. One good example is a Python library called Pika [90]. This Python library hasappropriate functions for publishing messages to a specific Broker or subscribing to a topic on aspecific Broker. This way, each end device may have its own Pika based implementation allowingthem to connect to one or more Brokers, publishing and receiving messages on subscribed topics.
33 Jose Soares

2.3.5 RESTThe REST architectural style is used to build network applications. It follows the client-serverstyle where the idea is the server is responsible to provide resources to clients that request forthem. Resources may be anything in REST, as long as they can be named and identified. RESTidentifies resources through Uniform Resource Identifiers (URI’s).
With this request-response approach, clients and servers must know each others addresses tocommunicate. This might be a problem sometimes, for example if Network Address Translation(NAT) is used. NAT is a technique that uses a hash to hide the IP addresses. In this case clientsand servers may not know each-others addresses, making the communication impossible.
The URI’s, or namespace, are defined as, for example, ”http://127.0.0.1/nodes”, where”http://” defines the protocol to be used, ”127.0.0.1” is the address (localhost in this particularcase) and ”nodes” is the actual resource that we are trying to reach. A call for each URI can returna single value or a collection of values, in this example a possible return could be a list of nodes [92].
Functionality
REST uses the very well known Hypertext Transfer Protocol (HTTP) (GET, POST, PUT andDELETE) methods. It follows the Create, Read, Update and Delete (CRUD) model, having amethod to create, read, update and delete a resource on the Server side.
POST and PUT methods are very similar, bringing some confusion to its difference, becausethey don’t exactly match the create and update methods of the CRUD model. POST means thatthe server will decide how to deal with the information given by the client when receiving themethod, in order to update its resource, while PUT means that the Server will replace the contentreceived on the PUT request with the resource’s content, creating the resource if it doesn’t alreadyexist.
GET method is used to fetch the resource information, but while doing it, the resource remainsunchanged. All other methods change the resource, since POST and PUT may create or updatethe resource value both may change the resource. The DELETE method deletes the resource fromthe server, making it unavailable by other clients to perform actions on it [1, 92].
REST is stateless, which means that neither the server nor the client keeps track of eachother’s state, both keep only their own state. This way, servers don’t keep information aboutprevious requests done by clients, it just saves the current state of the resources. The same way,the clients keep their own state, not knowing the state of the server, having to ask for it with aGET request to know any of the resource values [92].
QoS
Nowadays most RESTfull Web services ignore QoS parameters, as their only concern is toprovide the method’s functionality. However this QoS parameters may be very useful in the casewhere there are multiple providers for the same kind of request. This way, the client could takeadvantage of this QoS parameters to choose the most suitable provider. These QoS parameterscan be described in the HTTP payload [1].
Security and Privacy
To assure security in RESTfull Web services there’s the need to secure not only the data thatis being exchanged, but also the hole communication.
To secure data, its integrity must be assured as well as its confidentiality, which means that noone should be able to modify the data nor have access to it (actually knowing the content of thedata).
To secure the communication, there should be an authentication process that ensures accesscontrol over it, allowing it to be private so that no one could intercept the communication andlisten to what both ends are trying to exchange.
For this, there are some protocols that work on top of HTTP, as the Hyper Text TransferProtocol Secure (HTTPS), which uses an additional security layer with Transport Layer Security(TLS) protocol. There are also other technologies being built to support authentication forHTTP-based services, such as OpenId, XAuth or OAuth [1].
34 Jose Soares

2.3.6 OPC-UAAnother protocol being explored to be used within the IoT environment is the OPC-UA protocol.Open Platform Communications (OPC) is an open standard created by the OPC Foundation in1996. It was designed to provide reliable and secure communication in many industries, suchas automation or renewable energy industries. OPC is a standard that allows information to beexchanged between several devices from different vendors, increasing interoperability which is abig deal in IoT. Following the Client-Server pattern, its design is based on specifications made byindustry vendors, end-users and software developers that define several features such as access todata in real-time, monitoring of alarms or events (with OPC Alarms and Events (OPC AE)) andaccess to historical and current data (with OPC Historical Data Access (OPC HDA) and OPCData Access (OPC DA) respectively) [60, 87].
The OPC Foundation was motivated to create the OPC-UA standard because although all theother mentioned extensions of the OPC standard (OPC AE, OPC HDA and OPC DA) fulfill theirpurpose, there was no link between them, a value read with DA and HAD have no connection, butwith OPC-UA all of them are related to each other [87].
Figure 2.16 represents the OPC UA Architecture.
Figure 2.16: OPC UA Architecture [91]
This layered architecture’s specification have five goals [59]:
• Function Equivalence goal where all COM OPC classic specifications are mapped to UA
• Platform Independence that allows communication on different platforms, for example,an embedded device and cloud infrastructure
• Secure goal, because security must be assured, using authentication or encryption
• Extensible goal, which defines the new features that must be handled without compromisingolder features, and finally
• Comprehensive information modeling goal where complex information is defined
The main components of OPC UA architecture are the transport mechanisms and datamodeling as shown in figure 2.16. The transport mechanisms defined are the UA TCP, whichis a simple protocol on top of TCP that provides some necessary mechanisms for OPC UA (ex-ample: special error recovery that allows OPC UA to survive from network interruptions) andSOAP/HTTP that provide a firewall mechanism for OPC UA applications to communicate onthe internet via Web Sockets. Developing this layers requires a lot of time and effort, so OPCFoundation provides a set of OPC UA standards that have all the mappings implemented, whichare available on the OPC UA Software Development Kit (SDK) [91].
In what concerns data modeling, in the classic OPC standard the data exchange was”raw”/”pure” as it works with items containing data, for example, the temperature obtained ona sensor, but OPC UA uses a Meta Model, that is also known as Address Space, where data isrepresented trough objects, and where can be applied object-oriented techniques, such as hierar-chies and inheritance, having the possibility to have an hierarchy where, for example, the previoustemperature value is know to be from a specific sensor device in a specific house [87, 91].
35 Jose Soares

In this Meta Model, there is the concept of a meta node, which is the base of it, and as so,there is also several node classes that can be defined to specialize different classes of nodes. Oneach node, there is a set of attributes, some mandatory, some optional. An example of mandatoryattribute is the identification (id) that identifies the node uniquely and an example of an optionalattribute is the description [87].
Functionality
As a follower of the Client-Server pattern, the OPC standard specifies the away of communicatebetween Clients and Servers, where Servers provide services do clients request them. These servicesare saved on an address space that is used by the clients when having the need for a service. Thisway, an OPC client connects to an OPC server being able to ask the server for services, such asaccess to real time or historical data and events. For example, an application that has the OPCDA feature will request for services on an OPC DA Server [91].
Most OPC interfaces are based on Microsoft’s Component Object Model (COM) [96] andDistributed Component Object Model (DCOM) [95] technologies which brought an advantage tothe development of OPC because a lot of computers are based on the Windows operating systemthat already has these technologies available, although this brings a dependency on the windowsplatform [91].
Message Format
A message exchanged between a client and server in OPC UA is separated in chunks, whichare blocks that divide the message in different parts. Each chunk contains specified informationabout the message and the actuators. Sometimes messages are longer than the maximum networkpacket size, when this happens these messages are divided and reassembled in a process called”Chunking”.
A typical UA TCP message chunk format is composed by [91, 35]: .
• A Message Header which identifies the type of the message and message size. The type ofthe message is defined with the use of a three byte ASCII code. The possible messagetypes are the HEL (Hello) message, ACK (Acknowledgment) message, the ERR (Error)message or RHE (Reverse Hello) message and they are all specific to the UA TCP protocol[91, 58, 35].The message size contains the length of the message in bytes and is defined using an UInt32value, which is an unsigned integer number with 32 bit capacity (8 bytes) meaning that 8bytes are reserved to specify the length of the message [91, 58, 35].This means that every message will always contain at least 11 bytes 3 bytes for the messagetype plus 8 bytes for the size of the message. However, each message type adds some morefields, such as, for example, the ReceiveBufferSize and SendBufferSize that represents thelargest message chunk that the sender can receive or send, respectively [58].
• A Message Body which contain the actual message (payload) encoded or one of the men-tioned UA TCP-specific messages types that define the socket connection and possible errors.
Beginning with the HEL message type, there are six new fields added, where five of themuse UInt32 (8 bytes each, resulting in a total of 40 bytes) plus one field that uses the datatype String which can’t be more than 4096 bytes. Resulting on a total of 4136 maximum bytesfor this kind of message. The following type of message is the ACK message, which has fivemore fields, all of them defined using an UInt32 value, which means that this type of messagehas at most, 40 bytes. Next, the ERR message type only have two fields represented withUInt32 and a data type String, which means a total of 4104 maximum additional bytes for thiskind of message. Finally, the RHE type of message also contains two fields, both representedwith String data type, which means a total of 8192 maximum additional bytes for this message [58].
The message structure is presented in figure 2.17 [58, 91].
36 Jose Soares

Figure 2.17: OPC UA Message Format [91]
Security
The first thing to be taken in consideration, in what concerns security in communication withOPC UA, is the range of scenarios where it is applied. To assure that the communication issecure, there were taken into consideration the need to have six security goals: Authentication,Authorization, Confidentiality, Integrity, Auditability and Availability [91].
To achieve these goals OPC UA uses many security measures. One of this measures consists onthe specification of the SessionID, TimeStamp and SequenceNumber fields on the message that helpprevent replays, being verified in every message exchanged. Another measure is the possibility tosign messages with, for , a Public and Private keys before sending them, This can be done by usingcertificates, managed by Public Key Infrastructures (PKIs), to provide the private keys, having toverify this signature for every message that is received. Through this way, we have assurance thatthe message received was not altered, otherwise the signature verification would have failed.
OPC UA assigns security responsibilities in a Security Architecture composed of three layers:
• Application layer, which is responsible for the User and Product Authentication and Autho-rization. It manages the session between the client and server
• Communication Layer secures the communication channel, being responsible for the Appli-cation Authentication and Authorization as well as Confidentiality and Integrity of the dataexchanged by the use of encryption of the information and applying digital signatures
• Transport Layer layer, which is responsible for the Availability, dealing with the transmissionof data via socket connection. It uses mechanisms for error recovery which may be exploredwith attacks like DOS
All layers and security responsibilities are shown on figure 2.18. With these architecture theapplication can change or replace any of these modules easily without having to redesign the wholesystem [87, 91].
Figure 2.18: OPC UA Security Architecture [91]
37 Jose Soares

Implementation
One important thing concerning OPC UA implementation resides on three tasks, the dataencoding, communication security and data transportation (figure 2.19) [91]. Concerning dataencoding, Extensible Markup Language (XML) or UA Binary may be used. The UA Binary is aserialization of the data into a byte string which is faster to do than with XML encoding, becausethe size of the message is smaller. However, if XML encoding was used, XML SOAP clients caninterpret the data. Typically, XML encoding is only used with UA Web Services. [87].
In the transport layer, UA TCP or SOAP/HTTP may be used, both deal with the establishmentof the connection between OPC UA client and server. UA TCP is a small protocol build on top ofTCP with the purpose of getting the possibility to negotiate buffer sizes, share IP-Addresses andPorts, and create their own reacts to errors that occurred on transport level. The format of the UATCP Message is described in sub-subsection 2.3.6. The SOAP/HTTP means SOAP over HTTP,meaning that SOAP, as a network protocol based on XML uses HTTP for data transportation,being widely used to have secure communication between Web Services and Web browsers [91].
Figure 2.19: OPC UA Mapping [91]
2.4 IoT and Cloud ComputingIn this section we revise the main technologies that allow to improve IoT systems in terms of scal-ability, elasticity, availability and node computation management. The first technology presentedis the Cloud. We start by explaining how can IoT benefit with the use of the Cloud, what it canbring to the IoT, how it works, what type of clouds exist, and at the end a small explanation on thedifferences between Elasticity and Scalability. After this, a description of Monolithic and Micro-Services approaches is shown, explaining both ways of building a system and why we may benefitfrom using a Micro-Services approach when it comes to an IoT system. Afterwards Kubernetes ispresented, explaining advantages and disadvantages that it can bring into a system, such as noderecovery and update features. Finally we explain the Kafka distributing system platform, how itcan bring many benefits to an IoT system, such as replication of data or parallel computing [109].
2.4.1 Cloud and its Benefits for IoT solutionsBoth IoT and Cloud were proposed independently but there are some benefits of putting themtogether. From the IoT point of view, problems arise when a large number of constrained devicesare integrated, since many devices have low energy capacity and computing power and oftenconnections aren’t stable. The cloud is able to partially solve this problem by providing virtualunlimited storage and computation power. These resources are considerable cheap since there isno need to buy hardware, software or perform maintenance on machines, the service being usedis the only thing that has a price to be paid. Some IoT requirements that the Cloud is able toprovide are Device Management, Scalability, Storage and Real time Transmission.
The cloud is divided in three different types, the Private, Public and Hybrid Cloud [85].Private Cloud: These type of cloud provides better privacy control since the used servers,
infrastructures and other resources are owned by an organization. They are physically located onthe corporation’s data-center. However, the whole infrastructure must be maintained, and sincethis infrastructure may be complex, the task would be very difficult. These sort of service is usuallygood when there is a need to have full control of the data, making it easier for the organization
38 Jose Soares

to configure its resources and meet its IoT needs. Generally these type of cloud is very expensiveand only owned by big corporations, government agencies, financial institutions or organizationsbetween mid and large size that have a critical business operations and need to have exceptionalcontrol [37, 85].
Public Cloud: In this type of cloud, servers and the infrastructure are managed by cloudservice providers, and they are the ones that will deal with many tasks that are time consumingand some of them very complex, such as ensuring limited access and employment of securitymechanisms. Because of this, this kind of cloud is the most commonly used, some examples ofthese type of cloud are the Google Cloud Platform (GCP), Amazon Web Services (AWS) andMicrosoft Azure (Azure). It should be noted that resources are shared with other organizationsand clouds. It’s possible to access cloud services and manage the user account on a browser.These type of clouds are very cheap and often used for online applications, storage and to performexperiments of some new developed software or service [37, 85].
Hybrid Cloud: There is another approach combining both previous type of clouds, thisapproach is called Hybrid Cloud. This type of cloud allows for separation of data to be used.Hybrid Cloud is maybe the ”Best of both worlds” allowing for users to have the advantages ofboth previous types of cloud. Data and applications may be moved between private and publicclouds as needed. When there is a need for High-volume and lower security a public cloud shouldbe used. When there is a need for sensitive data, business-critical operations the private cloudshould be used. An IoT system working within the cloud is shown below on fig 2.20 [37, 85].
Figure 2.20: Cloud and IoT Network [85]
Benefits of using cloud resources to build new IoT solutions:
With the use of the cloud we get access to many resources. It offers numerous storage capacitiesto better suit users needs. The cloud allows us to gather and process the essential informationthat is needed within the raw data which is being received by the nodes. To do this, it process thedata with advanced data mining tools, like Complex Event Processing (CEP) [85]. CEP [56] is aframework that allows conversion of raw events in relevant data while it is still being transmitted.The price charged for the storage is directly proportional to the amount of storage reserved andused. The more storage reserved for a machine, the more that machine is going to be charged overtime. When it comes to Computational resources, since IoT devices are very constrained, havingthe computation of the data on such nodes would sometimes be infeasible, some king of tasks wouldbe too complex for such nodes but not for the cloud. Plus, in the cloud there is also the possibilityto choose between processing the incoming data in real-time, store the data and process it later,for example in a data base, or even have some kind of visualisation of the data, for instance witha dashboard.
In IoT, Scalability is one of the fundamental requirements to fulfill and cloud computing canhelp a lot in this factor. In most systems it’s very common to have pikes, sometimes there is aneed for more processing power due to more activity, like having a tremendous amount of requestsby users. Therefore it’s very important to have these kind of systems prepared to respond to suchevents. Systems can be scaled up, meaning that it is able to get more resources when needed or
39 Jose Soares

scaled out, which means that the system is able to revert the resources obtained when they arenot needed anymore.
Therefore, Scalability refers to the ability of a system to respond to an increase of workloadwithout having the system’s performance changed. A system is scalable if it capable of increasingthe system resources such as CPU power, amount RAM or amount of nodes in the system whenthe workload compels it to. It is possible to do this management automatically or manually (in aperiodic way). The main focus is that the system should always be able to deal with the incrementworkload.
On the other hand, there is the concept of Elasticity. Elasticity is a system’s flexibility tomanage its resources according to the workload necessity (increasing or decreasing). Even thoughvery similar to scalability, it has a different meaning, in this case the concern is about the abilityto respond to an increased and/or decreased workload, meaning that the system must be flexibleand dynamic when provisioning resources, being able to get more resources and to withdraw themas the result of a better performance by the system. To have an elastic system, first it must bescalable [2, 85].
Both of these concepts are inherent to cloud platforms and help to create new efficient IoTsolutions
2.4.2 Monolithic vs Micro ServicesWhen building a system two different approaches may be used. We can have a Monolithic systemor we can use Micro-services. Both have some benefits and drawbacks.
In a Monolithic approach all components of a system are packed together. A good examplethat illustrates a Monolithic system is a web application. In a web application, the system iscomposed by the Client-side, the Server-Side, database, and other layers may be used. All of themare built in a unique logical place. This may cause some difficulties when there is a need to updatea certain part of the system, since the whole system must be updated. Moreover, scale a systemlike these would have its adversity’s, because since the system is packed up together, everythingwould need to be scaled together. Another thing that might cause problems is a situation wherea component fails, in this case the entire system would go down. In IoT, this issue remains, amonolithic IoT system would have all the logic components in a single place. The processing ofdata, the communication with the devices and database and the visualization, everything wouldbe in a single location [85, 109].
Micro-services approach may solve some of these problems. Micro-services allow developersto build a system composed of many small independent services. In order to get the most of theintegration of IoT and cloud computing, the use of micro-services is advisable. By decomposingthe system in small independent components that implement their specific functionality within thesystem it becomes possible to update, scale, and recover from failures without the entire systembeing down, only the specific micro-services that are being modified (down, updated or scaled)are unavailable. However, it must be taken into consideration that the communication betweenMicro-Services is very expensive and it should be minimized. If changing a micro-service impliesmany changes in other micro-services, the interest of using micro-services may be lost [85, 109].
In summary, Monolithic applications are composed of a single executable having all of itsfeatures defined in one place. When the system needs an update, the entire system must beupdated and redeployed, and therefore the whole system must go down to make the necessarychanges and get back up after they have been applied. With Micro-services only the specificcomponent that needs to be updated is actually stopped, updated and redeployed while the rest ofthe system keeps on running. Besides this, while the monolithic systems are updated they increasetheir size over time until a moment where it starts to get very complex to manage, causing morespace for errors to appear, and as explained previously, failures in these type of system lead theentire system to crash. With micro-services concepts may be separated, decreasing complexity, andeven if failure occurs, only the particular micro-service’s implemented functionality goes down, allother features are up and running [85, 109].
2.4.3 KubernetesMicro-Services bring many advantages. However, having a system composed of a large number ofcomponents may lead to high complexity when managing them.
40 Jose Soares

If many components go down, it would be very time consuming to configure all of themback up one by one, so there should be some kind of mechanism that could do it automatically.This is where kubernetes is able to help. Kubernetes is an open-source technology that allowsmicro-services to be extensible, configurable and automatically managed with fault tolerance[27]. It is an open source platform that manages container workloads and services. Containersare used to aggregate all that is needed to run a specific program, from dependencies to executable.
Looking a little back in time, traditional deployments would have applications being executedon servers. This worked fine, but resource allocation problems started to emerge since in asingle physical server there were difficulties defining boundaries for each running application. Forexample, from all the applications running on a physical server one could request for most of theresources causing the other applications to have a decreased performance. Hence, Virtualizationappeared as a solution [34].
Supported by the Virtualization concept it is possible to run numerous Virtual Machines(VMs) in only one individual physical machine with the use of what is called the Hypervisor [74].The Hypervisor is the firmware/software that creates and runs the VMs. The machine wherethe VMs are created is called the Host and the VMs created are called Guests. Each machineruns its own Operating System (OS). The host may, for example, be running on a Windows OSand have VMs running Linux. With virtualization, applications become isolated between eachVirtual Machine (VM), providing better security, scalability and improving resource boundaries.Plus, this method allowed costs to be reduced in terms of Hardware (HW). Only later containersappeared [34].
A lightweight approach of virtualization to deploy applications is based on applications runningin containers. The objective of containers is to have all dependencies and all needed informationaggregated in one unit so that the whole system works as intended regardless of where it is exe-cuted. This method avoids many problems when installing software in different platforms. Withcontainers, applications may be deployed quickly and independently of the environment or in-frastructure they are being executed in. To use containers, there are some available tools calledContainer Runtimes, namely the Docker, CoreOS rkt [78] or Containerd [78]. Docker is by far themost used Container Runtime by the community and it is free to use (open source). To have anowned application running on a docker container it’s necessary to have a Docker Image. Dockerimages are very lightweight, they contain all information that the system needs to be able to runsuch as the code, run-time, other applications, settings and even system libraries. These imagesare executed in the Container Runtime by the Docker Engine, and it is at this moment that theybecome Docker Containers. Figure 2.21 shows that inside of a machine with its own OS DockerEngine runs Docker images in the Container Runtime and that the docker images may be of anykind from a Mosquitto, to a WebServer. Unlike VMs, Containers virtualize the OS instead of thehardware [74].
Figure 2.21: Container’s role [74]
41 Jose Soares

Kubernetes is the framework that will help us manage these containers by allowingself-healing, managing storage, executing load balancing and allowing for secret andconfiguration management [34, 77]. To do this, the desired state of the cluster must be declaredusing the Kubernetes API objects, meaning that the applications to be executed must be specified,for example, the container images to use must be described, the number of replicas needed for eachof them, how much disk resources should be used or which network configuration to use. Thereare two different ways to use the kubernetes API objects, the first is the command-line interfacecalled Kubectl, the other is to use the kubernetes dashboard which is not installed with kubernetesby default, but can be easily added (a step-by-step is provided in appendix A). After the desiredstate has been declared, the Kubernetes Control Plane will make sure that the cluster’s statecorresponds to the described one. To maintain the desired state, kubernetes will either restartcontainers if any of them fails or start them if more are needed and will also scale the replicas ofan application when the workload obliges it [14].
Kubernetes Components:
Having Kubernetes installed means having a cluster composed of numerous machines or nodes(at least one), each running containerized applications. These nodes are where Pods are deployed[25]. Pods are the smallest and simplest deployment units in Kubernetes. They run as processes inthe cluster and each of them may have one or many containers running applications inside them.Pods specify storage resources, have their own IP address and information about the containerbehaviour. If the system is supposed to be horizontally scalable, meaning that more machines arestarted in opposition of getting more resources to the only machine available, then each Pod shouldrun a single instance of an application, meaning that it should have only one container, and manyPods should be used to run all the instances needed [26].
Otherwise, replication can’t be achieved because if we put many containers in each pod, sinceevery pod will have its own IP address, all the containers will be scaled together [85], plus if a podwith many containers fail, all the applications running in the containers will also fail.
To manage pods and the containers inside them the Kubernetes Control Plane is used [25].Kubernetes Control Plane contains a collection of processes running on the cluster [14].
The whole Kubernetes system can be seen in figure 2.22 including the Kubernetes ControlPlane components and the Kubernetes Node components. The Kubernetes Control Plane dealswith global decisions and/or respond to events on the cluster. Although able to run in every node,it is usually working on the master node. The Kubernetes Node runs the Kubelet and Kube-proxyon every node of the cluster. Besides these components, there is also the concept of objects.Kubernetes may have use of many different objects, such as Services, Pods, Ingresses, DaemonSets and many more. The ones that we considered to be the most important are described withmore detail in this section.
Kubernetes Control Plane Components:
• Kube-Controller Manager:It is the unit responsible for running controller processes. This includes the Node Controller,the Replications Controller, the Endpoints Controller, the Service Account Controller andToken controller. The Node Controller is responsible for checking the node status and actwhen needed, meaning that it should be able to, for example, identify when a node goesdown and respond by evicting the pods out of the crashed node. The Replication Controlleris the one responsible for maintaining the number of replicas defined for the pods. EndpointsController is the controller that populates the objects of the cluster, such as pods orservices. Finally, the Service Account and the Token controllers are responsible for creat-ing default Kubernetes user accounts and tokens that give API access to new Namespaces [21].
• Cloud-Controller Manager:This component is the one that contains cloud control logic. It allows for Kubernetes to belinked to a cloud provider API. It is possible to separate components from those that interactwith the cloud and those that interact only with the cluster.
42 Jose Soares

Figure 2.22: Kubernetes Components [25]
They are the Node Controller, Route Controller and Service Controller. The Node controllerhas the same responsibilities as in the Kube-Controller Manager, but has dependencies whendealing with the cloud provider, it needs to contact the cloud provider to determine if a nodeis down. The other two controllers also must interact with the cloud to obtain information.The Route controller is responsible for setting up routes in the cloud infrastructure. ServiceController needs to be able to create, update and delete Load Balancers from the cloudsince it is the controller responsible for managing the Services of the cluster [25].
• Kube API Server:This component is responsible for exposing the Kubernetes API. It is the front end of theKubernetes Control Plane and was designed to validate and configure data for the APIobjects, such as replication controllers, pods and services [20].
43 Jose Soares

• Kube Scheduler:This component is responsible for finding new pods that are not assigned to any node andselect an optimal node for them to run on. The selection of the node needs to take intoconsideration many factors, such as the individual and collective resources requirements,QoS, constraints related to the hardware, software or policy, where data is placed or evendeadlines. If the scheduler can’t find a node that satisfies the requirements for a Pod to berun on, then it isn’t deployed, remaining unscheduled until the scheduler finds a node thatis suitable for deployment [23].
• etcd:All the cluster data is stored in a key-value backup storage called etcd [25]. These dataincludes the cluster status, its configuration and specifications [79].
Kubernetes Node Components:
• Kubelet:Runs on each node of the cluster to make sure that each container is running in a Pod withthe specified PodSpecs. PodSpecs are described in YAML or JSON files with the container’sconfiguration such as number of replicas or port numbers. The Kubelet agent ensures thatthe specs defined are running and healthy. This management is only possible in containersbuilt by kubernetes [24].
• Kube-proxy:Kube-proxy act as a network proxy on every node of the cluster. This is what controls thenetwork rules of the nodes allowing for network communication to the Pods from internaland external devices. If the operating system has a packet filtering layer and it’s available,then that will be used instead, otherwise kube-proxy will route the traffic on its own [22].
• Container Runtime:To run containers on machines a software called container runtime is needed. There aremany open source container runtimes pre-built that are available to use with Kubernetes,some of them are the Docker, CoreOS rkt or Containerd. It is also possible to implementthe Kubernetes CRI (Container Runtime Interface) and use it instead of the pre built ones[15].
Kubernetes Objects:
• Namespace:
One physical cluster allows for multiple virtual clusters which are called Namespaces. Whenthe working environment involves many users in a cluster (several dozen and up), it isadvised to use different Namespaces, on the other hand, having a short number of usersthere is no need to actually make use of them [28].
• Pod:
Pods are the smallest and simplest deployment units in Kubernetes. They run as processesin the cluster and each of them may have one or many containers running applications insidethem. Pods specify storage resources, have their own IP address and information about thecontainer behaviour.
44 Jose Soares

• Service:
For Pods to be able to communicate with internal or external devices, they need to have anIP address. Services are an abstracted way of providing this feature, allowing applicationson Pods to be exposed in a network. This way there is no need to use unfamiliar servicediscovery mechanisms. Along with the IP addresses also a Domain Name Space (DNS)name is given to a set of Pods. Services make use of the Selector to pick the set of pods towhich it’s needed to distribute the IPs and DNS [31]
• Ingresses:
Ingresses is another concept in the Kubernetes system that allows access to cluster servicesby external devices, usually using HTTP. They are also able to provide load balancing, SSLand name-based virtual hosting [18].
• ReplicaSet:
This component is responsible for maintaining the number of replicas defined for a Pod.Replicas exist to guarantee that the applications inside Pods are not lost, ensuring avail-ability. ReplicaSet creates or deletes Pods in order to get the specified number of replicas [30].
• Deployment:
Kubernetes Deployments are objects where the desired state of a Pod and/or Repli-caSets is declared, describing its life cycle, namely how many replicas to run, whichimage should be deployed or how the updates should be done. The main differencebetween Deployments and ReplicaSets is the possibility of performing updates by theDeployment. The Deployment can manage ReplicaSets and provide updates to Pods, whileReplicaSets’s main goal is to have the specified number of pod replicas running at a time [17].
• StatefulSet:
StatefulSet is the object that deals with the management of stateful applications and thedeployments. It scales a set of Pods and deals with the ordering and uniqueness of thosePods. They are very similar to deployments, but a StatefulSet maintains an identifier foreach of their Pods. All of the Pods are created from the same specification, but they are allindependent. It is advisable to use StatefulSets when using volumes because it facilitatesthe match of existing volumes with new Pods that have replaced older ones (due to failure,for example). However the downside is that individual Pods in a StatefulSet are known tobe more susceptible to fail [32].
• DaemonSet:
This object is responsible for making sure that a specified number of Nodes run a copy of aPod. When Nodes are added to the cluster, these specified Pods are created in those Nodes.When the Nodes are removed from the cluster, the Pods are garbage collected. Pods createdby a DaemonSet will be attached to the DaemonSet, so destroying a DaemonSet will alsodestroy all the Pods it has created. This is good, for example, when there is a need to havelog collection on all Nodes of the cluster [16].
45 Jose Soares

• Job:
This component provides a way of creating Pods. When Pods are created with Jobs, theyare expected to successfully terminate after its tasks are done. Every time a Pod completesits task, the job keeps track of it, and when a certain number of them terminates the jobwill be finished. If a Job gets deleted, all Pods created from that Job will also be deleted [19].
• Volume:
Saving files, logs or other types of data in a container is a problem, firstly because data savedon containers disks are ephemeral and secondly because they may fail at any point in timeand if so, data will be lost (even after they are restarted). To solve this problem Volumesmay be used. Volumes let all containers in a pod access a common directory, allowing themto have access to the saved data after being restarted. Plus, in a Pod, there is often a needfor data exchange between containers, this is also something that volumes can help with[33].
• Persistent Volumes and Persistent Volume Claims:
Kubernetes also offers a Persistent Volume subsystem. This subsystem allows users andadministrators to use an API that abstracts how storage is provided and consumed. TheAPI resources are named PersistentVolume and PersistentVolumeClaim.Persistent Volumes are pieces of storage similar to volumes, but the lifecycle is independentof the Pods that uses them. They are resources of the cluster just as a node is.Persistent Volume Claims are requests that are made from users in order to get accessto the Persistent Volumes storage. Pods in the cluster may request for different levels ofresources like CPU and/or Memory, Persistent Volume Claims work in a similar way, wherePersistent Volumes are requested in terms of size and mode (mode may be of type Read-WriteOnce, ReadOnlyMany or ReadWriteMany) [29].
2.4.4 Kafka SystemIn systems where a high number of data flows from point to point continuously, reliability andresilience are very important. Apache Kafka is a distributed event log that is able to help in suchsituations. This framework follows the publish-subscribe pattern [109], having topics to referencethe data.
A typical Kafka system consists of a Kafka Cluster containing one or many servers calledBrokers. Brokers are responsible for receiving data from Producers and forward it to theConsumers. Topics are used and may be divided in many partitions. In this case, messages areassigned to topics without a specific order, the only way to maintain the messages order is tohave one partition. Usually messages are written to partitions in a Round-Robin way. Partitionsretain these messages for a retention period (seven days by default) or until the maximum amountof messages for the topic is reached. Each partition may be replicated between several messagebrokers, with a property named Replication Factor that gives us a considerable assurance thatmessages will not be lost if a topic fails due to a broker failure. The only way for data to be lostis having all brokers that contain a certain partition replica fail.
This means that all replicas are identical, therefore to enable all replicas to be synchronized,a leader broker must exist for each partition. All partitions may be synchronized with the onerunning on the leader broker [85]. On figure 2.23 a system with two Brokers is shown. The firstbroker has two topics, ”Temp” referring to Temperature and ”Humidity” referring to Humiditydata. The former topic is divided in three partitions, each with a replication factor of 1, meaningthat these data is not considered crucial and therefore there is no need for replication.
46 Jose Soares

However, the Humidity topic is divided in 2 different partitions, each has a replication factorof 2, meaning that partitions on that topic should be replicated to ensure fault tolerance. In thiscase, partition 1 from topic Humidity in broker 1 was considered to be the partition leader anda replica of it can be found in broker 2, while for partition 2 of the same topic the leader chosenwas on broker 2 and the replica on broker 1 instead.
Figure 2.23: Kafka Topics, Partitions and Replication factor [85]
Producers and Consumers:
In the publish-subscribe pattern the nodes/devices that send messages to the broker are calledpublishers and the ones that receive the data are called subscribers. In Kafka these names areslightly changed to producers and consumers respectively. Since Kafka ensures no application levelacknowledgment, Producers have no perception on whether the message arrives to the destinationor not. When Producers send messages, they send the data to a specific partition of a topic [109].Consumers receive data only if they subscribe to the topic. Many consumers may subscribe to aspecific topic to get the same data and all will receive it.
Apache Zookeeper
When talking about Kafka it’s impossible not to mention Zookeeper. Although Zookeeperand Kafka are independent frameworks, they usually run together. A catch phrase that helpsunderstanding Zookeeper’s role is ”Zookeeper: Because Coordinating Distributing Systems is azoo” [61], this phrase means that distributed systems are hard to coordinate, much like a zoo,and zookeeper main function is to help managing these kind of systems. Zookeeper helps Kafkamanaging all the nodes in the cluster. It is the one responsible for electing the partition leaders.Messages sent to the topic go to the partition leaders first and only after that they are replicatedthe partitions replicas in other kafka brokers [12]
Messages & Offsets
The data flowing in Kafka always contains a key, value and timestamp. Kafka client libraryapplies a hash function to the message’s key to understand to which partition the message issupposed to go. This is the default procedure, but a partitioning function is also an option [12].Messages usually follow some specific formats, the most common are JSON and XML. Each recordin a partition has a designated number of offsets. Offsets help consumers keep track of a certainposition in a partition, allowing them to come back and review older entries. In case of failureduring a read, both Zookeeper and Kafka may persist the consumer offsets in order to ensure thatafter they come back to life, they are able to continue reading from the point left of (the last offsetread) before crashing. In Kafka, consumers offsets are saved in a topic named ” consumer offsets”. Messages must be committed before consumers are able to read them. A message is consideredcommitted when it is written to the partition leader and all in-sync replicas.
47 Jose Soares

3: Requirements Analysis
An IoT system is composed by many small constrained devices, generally sensors, connected witheach other, and this number has been increasing along the years. According to Stefan Ferber[53] since the beginning of the Internet’s existence there were three big waves, where the firstbrought big changes to everything related to paper work, such as documents management andtheir exchanging. The second wave brought online commerce allowing companies to profit fromonline platforms. Finally the third wave is the IoT, which allows everyone to be connected toeverything all the time.
Optimizing data streams from sensor devices to quickly capture a warning sate will allow forfaster response to emergency situations. This means having to recognize warning signs and deliveralerts as soon as possible.
With IoT these tasks are done in a dynamic, quick and automated way [120]. Therefore thereare many industries and applications already using IoT based systems. Nowadays IoT systemsgenerally follow a similar architecture to the one shown bellow in figure 3.1. Next we present someof these applications, followed by main key requirements. Not every IoT system follows rigidlyall of the presented requirements, and some others might even implement all of them and evensome more, but we think that the pointed out requirements are the main ones that all IoT systemsshould have implemented.
Figure 3.1: Typical IoT system in 2020 [69]
48

3.1 Use Cases
Healthcare: Many benefits were brought to medicine due to IoT, its now possible to have medicaldevices sending alerts to patients and help them (self-diagnose).
Nowadays there is even the concept of telemedicine, which means that clinical health care orappointments are possible to be done at distance with the use of many developed technologiessuch as wireless body area networks, which is composed of a single or multiple independent nodeslike sensors or actuators, that are placed in clothes, body or even under the skin allowing for abetter control of vital aspects of a patient. This network connects the nodes wirelessly with theuse of a star or multi-hop architecture [75, 124].
Smart Cities: According to Albishi et al. [4], by 2025 mega-cities will start to appear. Thereis a fast growing number of population and infrastructures which will force city’s boundaries toincrease, crowding neighbouring cities and forming the mega cities. IoT can be used in such citiesin many different ways, it is possible to have applications controlling traffic lights or parkinglots [46] in order to accommodate user’s lifestyle and increase productivity. There is already anEuropean project being developed by Santander, the FP7 project, which aim is to deploy an IoTinfrastructure with thousands of devices [4].
Smart Houses: Houses are becoming more and more smart, smartphones are able to interactwith shutters, smart TVs or smart bulbs for example, allowing to pull the shutters down or upautomatically at a given time of the day, control the smart TVs remotely with the smartphone,choose a desired color for a bulb, or even turn it on and off as pleased. All of this without theneed to get up and do it manually. There are many other smart houses application and in thefuture, others may appear, such as refrigerators helping in stock managing, also, ovens may beable to cook for us someday [66, 36].
Smart Vehicles: There are many brands developing smart cars capable of downloading newfeatures, help in driving and parking. Cars communicate with each other and with remote datacenters or the cloud to be able to perform such tasks. A brand that is currently producing thesekind of technology is the so famous Tesla company and also Audi [46].
Safety Of Users: Many devices such as temperature sensors, eventually wearable devices orpacemakers, airplane sensors or any other small device capable of capturing some fundamentalcharacteristic must be extremely safe, any malfunction or technical error might happen thatwould lead to severe consequences. Any exploited vulnerability may lead to danger to life, sothese devices should be developed taking into account the kind of dangers they may lead to andprevent it [66].
Smart Agriculture: IoT is also helping farmers. One good example is the use of sensors forirrigation of plants and trees when needed. The irrigation schedule is done automatically by thoseapplications, so when the time to water these plants, there’s no need to go one by one wateringthem, everything is automatic. There are many more applications of IoT in agriculture, such asapplications to monitor soil and weather conditions. for example, soil moisture sensors send theirinformation to a gateway, wirelessly, which in turn forwards it to the cloud where farmers maycheck on their terrain and monitor its conditions. [72]
Consumer IoT: Also there’s a distinction from IoT systems and technologies that aredeveloped for consumers and those that are developed for Industries, bringing the so called theConsumer IoT and Industrial IoT. The Consumer IoT is related to applications where the mainfocus is on the costumers, such as smart houses, tracking systems or smart watches and manymore. these kind of services are very well received by the users because they are very appealingand smooth some small tasks.
Industrial IoT: In Industrial IoT, applications and systems are specifically developed forIndustrial environments. This means having heavy machinery involved with all these technologies.these kind of systems will minimize physical work, making some jobs automated, therefore havingmore productivity. A good example of a practical use of IoT in such environment is the management
49 Jose Soares

of storage systems, checking the stock with a device sending the data to an application that handleshow much stock should be available and when to get more of the specific product would help a lot[121].
Another practical example are the use of devices capable of measuring energy, water ornatural gas consumption, so that service providers may be able to adjust prices according to theconsumption, time of day or season. these features allow users and consumers to automate tasksand reduce costs [120].
3.2 Requirements• Interoperability: The number of devices in an IoT system is very large, which means
many manufacturers and companies will be involved in the production of these devices.For devices to be able to cooperate as a group or to be integrated in one, they must beinteroperable. For example, if a device is only able to send data through MQTT, it wont beable to communicate with another one that only is able to receive, for example, from CoAP.In this case our proposal should be able to greatly help;
• Reliability: An IoT system should always be reliable, because many data is flowing fromend to end, and if some of these data is sent to the wrong place, not sent at all or sent withthe wrong information, many costs may be applied, and this means not only monetarily. Forexample, a device that tracks the heart beat of a patient that is in risk of a heart attack failingto send an alert with the correct state of the patient condition could be very problematic;
• Scalability: In IoT systems, billions of devices may be running and sending data at thesame time. Since this number may increase or decrease the system should be able to acquireor withdraw resources as needed. This allows for better use of resources, because if there isa need for more processing power, for example, the system will respond well without havingits performance diminished, but if the number of devices sending data decreases and someresources aren’t needed anymore, then they won’t be reserved anymore, being able to be usedin other tasks [66];
• Security: Since a huge number of data is flowing from hop to hop, personal informationmight be at risk along the way and should be protected. This protection must ensure Confi-dentiality, Integrity and Availability of the user personal data [66]. This is extremely crucialwhen data contains personal information such as bank transactions or facial recognition [76].There are already many technologies developed for security, but many of them don’t fit theIoT requirements, such as entering a password everytime access to a device is needed. Inthe case of IoT, many complex keys to authenticate devices isn’t viable, otherwise it wouldbe too complex. New security concepts are needed allowing ease of use at certain levels ofprivacy and protection [53]. One way to do this is by securing all devices of the networkone by one before connecting them to the network. Another way is to make every device tofollow standards from regulatory bodies like GSMA [10] or any relevant industry standard;
• Resilience: The system may have numerous reasons to fail, from network failure to protocolor implementation errors, anything might cause a failure as there are many devices involved inthe system. Therefore, responding to these failures in the best way possible is very important.The system should recover from faults and try to avoid them. This is divided in two differentmodes. In the first one, the reactive mode, the system detects and recovers from faults asthey happen. On the second mode, the proactive mode, systems save and monitor their ownstate. Before an undesired state is detected the system adjusts to prevent it [110];
• Availability: These kind of system is always running all day, if any update or adjustmentis needed, stopping it is not a reliable option, the system must be running constantly. Theremust be mechanisms that allow the system to be available no matter what. A good optionfor this would be the use of micro-services and Kubernetes to manage them without the needto stop the entire system;
• Device Management: Changes in the devices collecting the data should be available, forexample, if we have a device monitoring the temperature of a fridge, if it’s Summer time, we
50 Jose Soares

may want temperature alerts on a certain level of degree, but if it’s Winter time, this levelmay change, we don’t want to have to go to all the devices and make the change one by one,it is essential that devices can receive at least some orders or change some configurations;
• Real time Transmission: In some case, the data collected by sensors should be transmittedin real-time. For example, a sensor capturing data of the water level on a dam at each secondmight be too slow, maybe the need for the information is more urgent, perhaps if the rateisn’t less or equal to 5ms the water would overflow [46, 36];
• Robust connectivity: One of the biggest problems or difficulties in IoT systems is thatdevices used in such systems are often very small with very low computing power andenergy capacity, plus the network links are many times weak (the internet connection maybe unstable). To improve this situation, more efficient devices with more energy capacityare needed. [53];
• Big Data/Analytics: Big data means big amount of data, with lots of variety and velocity.Big data is directly related to storage struggles. Such amount of data is very hard to storeand to analyse because we don’t usually need all of the data. The biggest problem hereis to have good analytics and semantics to ensure that from all the data being received,the relevant parts are identified and collected properly. For this, there are already somemechanisms in place to filter irrelevant data [53].
51 Jose Soares

4: Fault-Tolerant and Interoperable IoTarchitecture
In this chapter we present a fault tolerant and interoperable IoT architecture. The proposedarchitecture is able to provide a resilient, ensuring availability, scalability, fault tolerance, inter-operability and simple management system. It was designed to satisfy all requirements exposed insection 3.2.
First of all, we describe the system architecture as a whole which can be seen in figure 4.1.The proposed IoT solution consists on a framework capable of receiving and processing data that
is sent using one of the following protocols: MQTT, CoAP, REST and LoRaWAN. LoRaWAN wasa protocol that we implemented using LMIC library, unfortunately in order to perform tests on thisprotocol, we would have to make the experiments on an urban or rural area, which was un-doabledue to Corona Virus pandemic. Additionally, LoRaWAN protocol was not implemented inside thesystem because LoRa requires a special ship to receive LoRa packets. In our implementation agateway was used. This gateway is composed by a Draguino LoRa Shield on top of a RaspberryPi.
The system stores data in Kafka and uses kubernetes cluster. It is based on micro-servicesimplemented by docker containers that runs inside kubernetes pods. Each pod in the Kubernetescluster runs only one container because Kubernetes allows scaling of pods, not containers. Inorder to scale every individual container, each pod must contain only one container, otherwise allcontainers in a pod would be scaled.
The proposed architecture is based on the following containers: the MQTT Broker, CoAPServer, REST Server, Kafka system with Zookeeper, Proxy and Controller. All of these container-s/components are inside of the Kubernetes cluster and are described below.
Besides these components there are also two more participants in the system. From outsideof the cluster, we have Producers who are devices that generate/collect data and send it to thesystem, and the Receivers that will subscribe data feeds and consume it.
In order to handle different protocols receiving and sending data on our system we created aKafka solution. Every time data is requested by any protocol, the data sent is the data that waspreviously stored in Kafka, this way a protocol A requesting data that only was sent using protocolB may be received, moreover these data is persisted and we may even request for older messagesor a bunch of them using a bulk command (explained later).
Internally, the Librdkafka library was used to establish the communication with Kafka. Thecomplexity of using this library within each broker and server was high due to the fact that itwould have to be compiled along with all of them (Mosquitto, CoaP Server and REST).
In order to solve this problem we created the Proxy component which is responsible to receivedata from the brokers/servers and send it to Kafka.
52

Figure 4.1: System Architecture
4.1 Components of the architectureMQTT Broker:
In order to handle the MQTT protocol, our proposal uses the Mosquitto 1 framework as MQTTBroker. This broker was incorporated in the kubernetes cluster. There are two pods runninginstances of the Mosquitto, one that deals with incoming data into the cluster Mosquitto In andanother one that deals with MQTT data going out of the cluster Mosquitto Out.
Since our objective is to prevent data loss, all data is secured in Kafka, meaning that everyclient that wants data, must get it from Kafka. To send data to Kafka our Proxy is used withthe Librdkafka library. Both pods running the Mosquitto In and the Mosquitto Out also have ourProxy running inside of them running a socket server that listens to connections on port 5151.When requests arrive to the socket server a new thread is created to handle the request. Thishandler is the one that uses the Librdkafka to perform actions on Kafka.
When a Producer sends data, that data is received by the Mosquitto In instance that uses ourProxy to send it to Kafka where data is stored.
Receivers that want data subscribe to the Mosquitto Out instance. In this case (MQTT proto-col) our Proxy is responsible for continuously publish data stored on Kafka to the Mosquitto Out.Mosquitto In listens to the port 1883 and Mosquitto out listens to the port 1884.
If only one instance of Mosquitto was used, that Mosquitto would be listening on a single portfor incoming and outgoing data, which means that a Producer would send data to the Mosquittoon a chosen port, for example 1883, and that data would be sent to Kafka for storage, which inturn would be published to the Mosquitto again in port 1883 creating a loop where mosquito sendsdata to Kafka and vice versa. Having two instances allows data to flow from one end of the clusterto the other with no loops involved.
The data flow of MQTT packets in the system can be seen in figure 4.2.
1https://github.com/eclipse/mosquitto
53 Jose Soares

Figure 4.2: MQTT data flow
CoAP Server:
This server deals with incoming and outgoing CoAP data. When a Producer needs to senddata to our system using CoAP protocol, that data is sent to this server, which then forwards itto Kafka using our proxy, much like the Mosquitto broker.
Similarly to the Mosquitto Broker, Proxy is running alongside the CoAP server in the samepod and it runs a socket server that listens to TCP requests on port 5151. When Producers senddata to the CoAP server, the server sends the received request to this socket server. For eachrequest received the socket server creates a new thread to handle the request. This handler callsthe Librdkafka library to perform actions on Kafka (in this case to store data). The same thinghappens when the request is sent by a Receiver to get data. The request is sent to the socket servercreating a new thread to request data from Kafka.
Since in this case the pattern used is request-response, there is no need to have Kafka con-tinuously sending the data stored again to CoAP server, which means there is no possible loop.Consequently, in this case only one instance of the server is needed.
POST requests are used to send data to CoAP and GET requests to ask the server for data.When a Producer uses CoAP to send data to the cluster, the pod running CoAP server receivesthat request and sends it to Kafka using the Proxy. When a Receiver wants data, a GET requestis sent to the CoAP server inside the cluster that uses the Proxy to get that data from Kafka.
The implemented server is based on libcoap 2 library. It includes resources to interact with theProxy that is responsible for getting data from Kafka. To send POST requests the client must usethe following command:
$ echo <mymessage> | coap-client -m put coap+tcp://[<address>]/<topic> -f -
There is a limitation concerning the transport layer protocol. According to the CoAP specifi-cations, it is a protocol able of working with TCP and UDP protocols. However, in our system itworks only with TCP requests. This is a limitation that comes from the use of Bare Metal loadbalancer [6] in kubernetes cluster.
In the future work this should be changed to allow UDP requests. A possible solution may bethe use of other load balancer to handle incoming traffic. The same thing happens with Receivers,only TCP requests are handled.
In terms of protocol operation, there are two different options to perform GET requests, thenormal way which uses the command
$ ./coap-client -m get coap+tcp://[<address>]/<topic>
to request for the last message, and the bulk way that requests for the last given number ofmessages from the system (counting from the last message received on Kafka), e.g.
$ ./coap-client -m get coap+tcp://[<address>]/iotbulk -e 3
which will return the last 3 messages that were received on Kafka.
2https://github.com/obgm/libcoap
54 Jose Soares

REST Server:
Very similarly to the CoAP server, the REST server is the one responsible for receiving datasent via REST protocol. The implemented REST server is based on ulfius library 3.
When a Producer sends data to the REST server, that is running on a specific pod alongside the Proxy, it forwards that data to the Proxy, which uses a socket server, listening for TCPconnections on port 5151, and threads to handle the requests. This handler uses Librdkafka toperform the requested actions on Kafka (POST or GET).
In this case, the following command is used to send data to the system.
$ ./simple_client <address> <port> POST "/mibroker/iot/" "name=mymessage""Content-Type: application/x-www-form-urlencoded"
This command will post the message ”mymessage” on the resource named ”iot” to the RESTserver using the given address and port. The resource ”iot” is used as topic when sending the datato Kafka because Kafka doesn’t work with resources.
In order to retrieve data from the system, Receivers may use one of the following options: thenormal or bulk options.
The normal option or command requests for the last message introduced in Kafka, while thebulk command requests for the last given number of messages introduced in Kafka.
Both commands are equivalent if a bulk size of one is considered. Otherwise, they will differfrom the quantity of data that will be returned.
The normal command is expressed as:
$ ./simple_client <address> <port> GET "/mibroker/iot"
The bulk option or command, that allows requesting the server for the last n messages (e.g., 3)can be expressed as:
$ ./simple_client <address> <port> GET "/mibroker/iot:3"
Kafka Cluster:
As explained in section 2.4, Kafka is a system that follows the publish-subscribe pattern andallows message delivery to be scalable, replicated between many Kafka brokers which contributesto fault tolerance and parallel consumption using partitions, offsets and replication.
Being a publish-subscribe system, messages are distinguished with the use of topics. Thesetopics must be created taking into account the replication factor and the desired number of par-titions, which will be used to provide fault-tolerance and high consuming performance over datainside the system. Each topic is created by issuing the following command:
$ ./kafka-topics.sh --create --zookeeper <zook_addr> --replication-factor<num_rep_factor> --partitions <num_part> --topic <topic>
These topics are divided in partitions and each partition has internal offsets. The partitioningallows replication of each partition between the available Kafka brokers in a Kafka cluster, henceallowing parallel processing. The offset is used as an identifier of each message in a partition. Theanatomy of a topic can be seen in figure 4.3 where three different partitions for a single topic withmultiple offsets are represented. When Producers send data to that topic the most recent datais set with a higher offset value (identified), so older messages are the ones with the lowest value[116].
3https://github.com/babelouest/ulfius
55 Jose Soares

Figure 4.3: Kafka topic anatomy
Our system was designed to be scalable and fault-tolerant. To achieve this, the number ofKafka servers or brokers available, at an instant, must be controlled so that if one of them failthe system would still deliver messages. Hence in our system we created a cluster with 3 Kafkabrokers. This number is scaled very easily, due to the Kubernetes capabilities.
Each Kafka broker is used to store the incoming data and keep that data available to beused for a retention period. This retention period is controlled by the administrator, through theconfiguration files, and it assumes, by default, a value of 7 days. It can be changed with thecommand:
$ ./kafka_2.12-2.5.0/bin/kafka-topics.sh --zookeeper <address> --alter--topic <topic> --config retention.ms=1000
This command will change the retention period to 1 second, meaning that messages will besaved in Kafka in the given topic for 1 second and then they will be deleted.
When replication is used, Kafka nominates a leader for each partition. This leader will receiveall messages targeted to that partition and then replicates it to the other replicas. If the leaderpartition fails for any reason, a new leader election begins and the elected partition takes over.Besides allowing fault tolerance, the use of partitions also allows multiple consumers to readfrom a topic in parallel [116] granting faster throughput processing. In figure 4.4 the concept ofpartitions is illustrated.
Figure 4.4: Kafka Partitions
Regarding the consumers, they are able to read data starting from a chosen offset. Eachmessage in the Kafka system is identified by a tuple defined by the message topic, partition andoffset within the partition.
56 Jose Soares

Zookeeper Cluster:
Since Kafka works in cluster fashion, there is a need for server coordination. Zookeeper isresponsible for helping Kafka instances on its coordination. The zookeeper is the brain that doesthe election of the Kafka leader. Without zookeeper, Kafka could not operate well.
If only one zookeeper instance is present in the cluster and it crashes for any reason, Kafkainstances would become not coordinated and they would crash leading to a failure of the wholesystem.
To avoid possible crashes of single Zookeeper node, the same strategy that is used in Kafkamust be used here. If Zookeeper instances are replicated and if one instance crashes there arestill other instances to control Kafka cluster. Hence there is in fact a cluster of Zookeepers in thesystem instead of a single instance.
Services & Exposed Services:
The proposed solution makes use of many components and those components receive data fromoutside of the cluster and send it to other components, but this link is not so trivial.
In order to allow the communication between components, services must defined to expose thefunctionalities of each pod to outside the cluster, using IP addresses or hostnames.
However, general Services aren’t visible from outside of the Kubernetes cluster. Exposed ser-vices have external IP addresses assigned to them. The assignment of external IP addresses in thecloud is made by LoadBalancers and/or Ingresses but since our environment is on bare metal, weused a framework called metalLB [6] (an open-source LoadBalancer built to work on bare metalkubernetes systems) to have external IP addresses on our external services.
Internal Services were created for each component. They are used to establish the connectionbetween all components inside the kubernetes cluster.
These services are specified in YAML files created by us. They are available in the GitHubpage 4 and are also described in section 4.2.
Besides Internal services, External services were also created. They were created by using aspecific command in the terminal:
$ kubectl expose deployment <deployment_name> --port=<port_number(s)>--type=LoadBalancer --name=<service_name> -n <namespace>
This command was used to create external services for Mosquitto In, Mosquitto Out, CoAPserver and REST Server. It configures TCP connections on ports 1883 for Mosquitto In, 1884 forMosquitto Out, 5683 for CoAP, 8000 for REST and 7000 for WebSocket connections. All portsand respective pods are visible in figure 4.1.
Clients trying to send or receive data from any of these components use the external IP addressprovided by these external services. The presented command exposes the service on a deployment,meaning that all instances of that deployment become endpoints of the external service created(many instances may exist if the number of replicas is more then one). Data coming to theexternal service is then redirected for one of these endpoints.
Pod PortsMosquitto In 1883
Mosquitto Out 1884CoAP 5683REST 8000
WebSocket 7000
Table 4.1: Summary of all ports used for each Pod
4https://github.com/jsoares11/MasterThesisExperiences/tree/main/YAML%20files
57 Jose Soares

Proxy:
The proposed architecture builds an intermediate computing layer which will serve as an ab-straction hiding different protocol implementations which we called Proxy. Proxy is the one respon-sible for the communication between every server or broker with the Kafka system. By allowing thiscommunication, it is possible to use Kafka to store the incoming data, and also to request for olderdata when receivers ask for it. This communication was build using sockets and a library namedLibrdkafka that can be found on the following url: https://github.com/edenhill/librdkafka.
When a pod with a server or broker runs in the kubernetes system, it also runs our proxy, so infact there are many proxy instances as servers or brokers in the system. Resuming, our Proxy isa middleware that allows communication between any server/broker and Kafka. Hence, allowingdevices that use different protocols to interact with each other, all implemented protocols can betranslated between them (MQTT, CoAP, REST).
The Proxy is composed by four different threads started by proxy.c. The threads are: theproducer.c, kafka socket server.c, kafka publisher.c and mqtt publisher.c. Each of them have theirown responsibilities inside the proxy which are described next.
To make sure that data isn’t lost in case the proxy isn’t able to handle the throughput (databeing send faster than it is being forwarded) a linked list is used in order to form a queue ofmessages that will be sent to Kafka. If a message can’t be sent because a previous message isstill being processed it will be waiting in the queue (linked list). Figure 4.5 represents the proxyarchitecture.
• producer.c: When a Producer sends data to our system, it sends the data to an externalservice that forwards it to the desired server or broker. For example, a Producer sendingdata using MQTT protocol sends data to the ”mosquitto-service-in”, because this is theexternal service that grants Mosquitto In external access. Inside of the pod Mosquitto Inthere are three separated programs running, a Mosquitto broker accepting incoming data,a Mosquitto client subscribing to that same Mosquitto broker and our Proxy. When dataarrives to Mosquitto IN, it arrives in the Mosquitto broker, that forwards it to anyone sub-scribing, so the Mosquitto client receives the data and outputs it to the stdin. Our Proxyuses the thread producer.c and the PIPE command in linux to keep listening to the outputof the Mosquitto client stdin and also receive the data. Data is then placed on the queue tobe saved in Kafka.
• kafka socket server.c: Starts a socket server listening and accepting connections fromthe CoAP and REST servers on port 5151. When a server connection request is ac-cepted, the kafka socket server calls a connection handler thread to deal with it, this waykafka socket server doesn’t take much time to answer other requests because the previousrequests are being processed by the connection handler in other threads. Requests assumesonly two types, consumer or producer (mode ”C” or mode ”P” respectively). The handlermakes a call to kafka interface.c where the librdkafka library is used to send data to kafkadepending on the mode used. If the mode used was the consumer mode, kafka will returnthe requested messages, otherwise the data sent to kafka will be stored.
• kafka publisher.c: This thread handles the queued data. Its responsibility is to check ifthere is data in the queue, if so kafka interface.c is called and used to publish the data inKafka with the use of Librdkafka library.
• mqtt publisher.c: In this thread the ”Online” mode is handled (mode ”O”). It is responsiblefor continuously consume data from Kafka and publishing it to Mosquitto Out, allowingsubscribers to receive data from the system.
58 Jose Soares

Figure 4.5: Proxy Architecture
4.2 Kubernetes Environment
Previously, we have seen that having the cloud working along side with IoT systems helps themsatisfy many IoT requirements but even though this would be a good path to explore, it was decidedto use a bare metal Kubernetes system instead (instead of using a well known cloud infrastructure,we decide do build our own cloud). This decision was due to the prices of the cloud.
In order to test the proposed system, we would need many instances, at least one to work asthe master node, and three other nodes to work as slaves. Besides this, we are going to need twomore nodes to make requests to the cluster, meaning that we would need a minimum of 6 machinesto be running while implementing our system and while running experiments on it.
There is another factor that had a big impact on this decision, since kubernetes requestsmachines with at least two CPUs, the use of the simplest machines on cloud providers wouldn’tbe enough to run it, so the machines reserved to the system would be more expensive. This wouldbring considerable high charges. With a bare metal system, we can have a kubernetes systemrunning on any desired set of machines for free, with the downside of not having access to all thepreviously mentioned features that the cloud provides.
In this work, a Kubernetes Cluster composed by 5 nodes, one master node and four slave nodeswas created. To install the cluster we had to make some actions which are described in appendixA. Here, steps we took in order to install the Kubernetes cluster on dual-core devices running onUbuntu 18.04 operating system are demonstrated. It’s important to notice that although thesesteps allow kubernetes to be installed there are scripts available on our GitHub page 5 to facilitatethe installation.
After installing the kubernetes cluster, we need to specify some YAML files that are used tocreate/running our components in the cluster.
These YAML files contain the desired configurations for each component. In order to buildour proposal, we created a set of YAML files, that is composed by: kafka.yaml, zookeeper.yaml,mosquitto-in.yaml, mosquitto-out.yaml, coap.yaml, rest-api.yaml, controller.yaml and pv-rwo.yaml.
The container image used is the same for all components and is named ”josesoares/proxy”.
5https://github.com/jsoares11/MasterThesisExperiences
59 Jose Soares

This image is available on docker hub [73] 6.Although having the same image, the behaviour is not the same for all components because
inside each of these files there is a specific command that executes the desired functionality of theinstance. The command calls one of four scripts: ”start-mqtt-rep3”, ”start-coap-rep3”, ”start-rest-rep3”, ”controller”. These scripts are available in this Thesis GitHub page 7
Additionally, two types of components/services were defined: stateless and stateful services.Zookeeper and Kafka were defined as StatefulSets (stateful components/services) because wewanted Zookeeper and Kafka to be able to keep their state across different states of the clus-ter. This is also the reason why they are both the only ones that claim Persistent Volumes. On theother side we have Deployments (stateless components/services) that do not keep their state. Inour implementation, all protocol specific server uses Deployments to run inside the cluster. Sincedata is kept by kafka, keeping specific protocol server state is not important for global achievementsof the system.
A brief description of each YAML file is presented below. All of these files can be found in therepository of this thesis.
• kafka.yaml:The purpose of this file is to define the configurations of Kafka cluster that will run insidekubernetes cluster as part of our system architecture. This definition includes a specificationof services that are associated with it. A kafka-hs service is defined. The ”hs” stands forHeadless Service [31] which is the type of service used when there is no need for load-balancing, these kind of services don’t have a cluster IP allocated, instead the name of theStatefulSet is used to associate the Service with the StatefulSet. This is done by using a fieldnamed ”selector” in the Service definition with the name of the StatefulSet to be associatedwith, in this case ”kafka” which is visible in figure 4.6. DNS is then able to understand thatdata coming to the headless service must be mapped to an available pod from the KafkaStatefulSet. The kafka-hs service listens to TCP connections on port 9093.The Kafka cluster is defined as a StatefulSet, as we can see in the field named ”kind”, shownin 4.7. The field ”name” defines the name of the StatefulSet that is used by the Serviceselector. Since we are interested in fault-tolerance, the number of Kafkas in the clustershould be more than one, so the ”replicas” field is set to 3. To have access to PersistentVolumes a volume claim is defined in the field ”volumeClaimTemplates” as visible in figure4.7. Here, the access mode is defined as ReadWriteOnce, meaning that the volume can onlybe mounted as read-write by a single node, and some resources are requested (100Mi - onehundred MebiBytes).In order to execute Kafka inside the container a specific command must be used. Thecommand used is the following:
$ kafka_2.12-2.5.0/bin/kafka-server-start.sh kafka_2.12-2.5.0/config/server.properties
This command starts Kafka using the Kafka configurations inside of the file server.properties.Kafka.yaml file uses this command on a field named ”command” that is visible in figure 4.7.
6https://hub.docker.com/repository/docker/josesoares/proxy7https://github.com/jsoares11/MasterThesisExperiences/tree/main/YAML%20files/scripts.
60 Jose Soares

---- apiVersion: v1
kind: Servicemetadata:
labels:app: kafka
name: kafka-hsspec:
ports:- name: kafkaport
port: 9093protocol: TCP
selector:app: kafka
Figure 4.6: Excerpt of kafka.yaml with the configurations of the Service
---- apiVersion: apps/v1
kind: StatefulSetmetadata:
labels:app: kafka
name: kafkaspec:
replicas: 3(...)containers:- command:
- sh- −c- ”exec kafka\ 2.12−2.5.0/bin/kafka−server−start.sh
kafka\ 2.12−2.5.0/config/server.properties”(...)
image: josesoares/proxy(...)volumeClaimTemplates:- apiVersion: v1
kind: PersistentVolumeClaimmetadata:
creationTimestamp: nulldatadir
spec:accessModes:- ReadWriteOnceresources:
requests:storage: 100Mi
Figure 4.7: Excerpt of Kafka.yaml with the configurations of the StatefulSet
• zookeeper.yamlThe zookeeper.yaml file is very similar to the kafka.yaml in the sense that it also defines aheadless service named ”zk-hs”, a StatefulSet named ”zk”, a Persistent Volume Claim andthree replicas. Besides that, it also defines a normal service named ”zk-cs”. The ”cs” standsfor client service which is a normal service meaning that it has an assigned IP address, but
61 Jose Soares

that address is internal (only valid inside the cluster).The headless service accepts TCP data on ports 2888 and 3888 and the client service alsolistens for TCP connections on port 2181. Port 2888 is used by zookeepers to exchangeinformation between them, while port 3888 is reserved for the process of leader election. Theport 2181 is used by Kafka instances to connect to a running Zookeeper, this is defined inthe server properties file, the Kafka configuration file. All these configurations are presentedin figures 4.8 and 4.9.To run the zookeeper inside the cluster, the following command was used:
$ ./kafka_2.12-2.5.0/bin/zookeeper-server-start.sh kafka_2.12-2.5.0/config/zookeeper.properties
It starts the zookeeper with the configuration file zookeeper.properties, where some parameterssuch as client/connection timeout, maximum number of connections or maximum number ofclients at the same time are defined.
---- apiVersion: v1
kind: Servicemetadata:
labels:app: zk
name: zk-hsspec:
ports:- name: server
port: 2888protocol: TCPtargetPort: 2888
- name: leader−electionport: 3888protocol: TCPtargetPort: 3888
selector:app: zk
---- apiVersion: v1
kind: Servicemetadata:
labels:app: zk
name: zk-csspec:
ports:- name: client
port: 2181protocol: TCPtargetPort: 2181
selector:app: zk
Figure 4.8: Excerpt of zookeeper.yaml with the configurations of its Services
62 Jose Soares

---- apiVersion: apps/v1
kind: StatefulSetmetadata:
labels:app: zk
name: zkspec:
replicas: 3(...)containers:- command:
- sh- −c- ./kafka 2.12−2.5.0/bin/zookeeper−server−start.sh
./kafka 2.12−2.5.0/config/zookeeper.properties(...)image: josesoares/proxy(...)volumeClaimTemplates:- apiVersion: v1
kind: PersistentVolumeClaimmetadata:
creationTimestamp: nullname: datadir
spec:accessModes:- ReadWriteOnceresources:
requests:storage: 100Mi
Figure 4.9: Excerpt of zookeeper.yaml with the configurations of the StatefulSet
• mosquitto-in.yamlThe Mosquitto In YAML file contains the configuration to run a Mosquitto Broker with aset of configurations, like listening ports or connection timeout. Associated with Mosquittoitself, there is a service named ”mosquitto-cs-in” that listens for TCP connections on port1883 (default port for MQTT communication) as shown in figure 4.10.The Mosquitto In YAML also defines its content as a deployment (figure 4.11). This deploy-ment is named ”moquitto-deployment-in”.Inside the image josesoares/proxy there is a script named ”start-mqtt-rep3”, which receivesfive parameters, the mode (”in” or ”out”), the topic that is going to be used, the Kafka andZookeeper addresses, and the MQTT port that will be used. In this case the mode is ”in”,telling our Proxy that the container will run a Mosquitto In. To use the script the followingcommand was used:
$ ./start-mqtt-rep3 in iot Kafka-hs.kafka.svc.cluster.local:9093zk-cs.kafka.svc.cluster.local:2181 1883
This command will start a Mosquitto broker on the former container in the given MQTTport and will also start the Proxy.
63 Jose Soares

---- apiVersion: v1
kind: Servicemetadata:
labels:app: mosquitto−in
name: mosquitto-cs-inspec:
ports:- name: clientin
port: 1883protocol: TCPtargetPort: 1883
selector:app: mosquitto−in
Figure 4.10: Excerpt of mosquitto-in.yaml with the configurations of the Service
---- apiVersion: apps/v1
kind: Deploymentmetadata:
name: mosquitto-deployment-inlabels:
app: mosquitto−inspec:
replicas: 1(...)containers:- name: mosquitto−in
command:- sh- −c- ./start−mqtt−rep3 in iot kafka−hs.kafka.svc.cluster.local:9093
zk−cs.kafka.svc.cluster.local:2181 1883(...)image: josesoares/proxy
Figure 4.11: Excerpt of mosquitto-in.yaml with the configurations of the Deployment
• mosquitto-out.yamlThis YAML file is very similar to the previous one (mosquitto-in.yaml). The main differenceis the mode and the port that is used. This instance is listening for TCP connections onports 1884 and a service named ”mosquitto-cs-out” was created 4.12.This component is deployed as a Deployment with the name mosquitto-deployment-out 4.13.To run the instance we used the command:
$ ./start-mqtt-rep3 out iot kafka-hs.kafka.svc.cluster.local:9093zk-cs.kafka.svc.cluster.local:2181 1884
This command uses the same script used for mosquitto-in.yaml named ”start-mqtt-rep3” andreceives the same arguments, but the mode and port used was ”out” and 1884, respectively.Since mosquitto allows to feed data in near real-time from our system, and to offer moreways to retrieve data in real-time, a websocket service was also included in this component.This websocket is listening for incoming connections in port 7000 and when new data arrives
64 Jose Soares

at mosquitto out, this websocket server also receives that data and forwards it to all clientsregistered on it.
---- apiVersion: v1
kind: Servicemetadata:
labels:app: mosquitto−out
name: mosquitto-cs-outspec:
ports:- name: clientout
port: 1884protocol: TCPtargetPort: 1884
- name: gwsocketport: 7000protocol: TCPtargetPort: 7000
selector:app: mosquitto−ou
Figure 4.12: Excerpt of mosquitto-out.yaml with the configurations of its Services
---- apiVersion: apps/v1
kind: Deploymentmetadata:name: mosquitto-deployment-outlabels:
app: mosquitto−outspec:
replicas: 1(...)containers:- name: mosquitto−out
command:- sh- −c- ./start−mqtt−rep3 out iot kafka−hs.kafka.svc.cluster.local:9093
zk−cs.kafka.svc.cluster.local:2181 1884(...)image: josesoares/proxy
Figure 4.13: Excerpt of mosquitto-out.yaml with the configurations of the Deployment
65 Jose Soares

• coap.yamlThe coap.yaml file contains the configurations to build a pod with a container running aCoAP server and the Proxy. To do this, the following command was used:
$ ./start-coap-rep3 iot kafka-hs.kafka.svc.cluster.local:9093zk-cs.kafka.svc.cluster.local:2181
This command uses a script named start-coap-rep3 that receives as arguments the CoAPresource (that will be used as topic in Kafka), the Kafka and Zookeeper addresses. The useof this script can be seen in figure 4.15. In the same figure is also visible that a Deploymentwas used. To allow communication between this and other components a service was definedwith the name ”coap-cs”, which listens to TCP connections on port 5683. This componentwas configured to also listen to UDP connections, but these packets would not arrive to thepod. This is still a limitation of our system and should be fixed in a future work. Theseconfigurations can be seen in 4.14.
---- apiVersion: v1
kind: Servicemetadata:
labels:app: coap
name: coap-csspec:
ports:- name: clientinudp
port: 5683protocol: UDPtargetPort: 5683
- name: clientintcpport: 5683protocol: TCPtargetPort: 5683
selector:app: coap
Figure 4.14: Excerpt of coap.yaml with the configurations of its Service
66 Jose Soares

---- apiVersion: apps/v1
kind: Deploymentmetadata:
name: coap-deploymentlabels:
app: coapspec:
replicas: 1(...)containers:- name: coap
command:- sh- −c- ./start−coap−rep3 iot kafka−hs.kafka.svc.cluster.local:9093
zk−cs.kafka.svc.cluster.local:2181(...)image: josesoares/proxy
Figure 4.15: Excerpt of coap.yaml with the configurations of the Deployment
• rest-api.yamlThe rest-api.yaml file contains the configurations needed to start a pod with a containerrunning a REST server and the Proxy. These configurations are described here and canbe seen in figures 4.16 and 4.17. The defined service listens TCP connections on port 8000and is named ”rest-cs”. The defined Deployment is named ”rest-deployment”. The followingcommand was used to start both the REST server and Proxy:
$ ./start-rest-rep3 iot kafka-hs.kafka.svc.cluster.local:9093zk-cs.kafka.svc.cluster.local:2181
This command uses a script named start-rest-rep3 that receives as arguments the resourcethat should be used (which will be used as topic in Kafka), the Kafka and Zookeeper addressesto be used, by order.
---- apiVersion: v1
kind: Servicemetadata:
labels:app: rest
name: rest-csspec:
clusterIP: Nonetype: LoadBalancerports:- name: clientin
port: 8000protocol: TCPtargetPort: 8000
selector:app: rest
Figure 4.16: Excerpt of rest.yaml with the configurations of its Service
67 Jose Soares

---- apiVersion: apps/v1
kind: Deploymentmetadata:
name: rest-deploymentlabels:
app: restspec:
replicas: 1(...)containers:- name: rest
command:- sh- −c- ./start−rest−rep3 iot kafka−hs.kafka.svc.cluster.local:9093
zk−cs.kafka.svc.cluster.local:2181(...)image: josesoares/proxy
Figure 4.17: Excerpt of rest.yaml with the configurations of the Deployment
• controller.yamlThe controller.yaml file is used to define the configuration component. In our implementation,this controller does not require a specific service. It is composed only by a Deployment andis named ”controller-deployment”. The configurations of this Deployment may be seen infigure 4.18.The controller component was configured to have only one instance and to listening foradministrator commands. This means that the container is available to be used by advancedusers or admins. To access this container the following command may be used on the cluster:
$ kubectl exec -n kafka --stdin --tty podname -- /bin/bash
Once inside, it gives access to all micro-services defined by the proposed architecture andrunning over the kubernetes cluster.Inside this component, there is a script named ”controller”, which allows to list, delete orcreate a topic from Kafka.To use the script the following arguments must be given: method ( ”create”, ”list” or ”delete”),the topic to be used, the replication factor, the number of partitions and the zookeeper’saddress to use.
68 Jose Soares

---- apiVersion: apps/v1
kind: Deploymentmetadata:
name: controller-deploymentlabels:
app: controllerspec:
replicas: 1(...)containers:- name: controller
command:- sh- −c- tail −f /dev/null
(...)image: josesoares/proxy
Figure 4.18: Excerpt of controller.yaml with its configurations
• pv-rwo.yamlLastly, the pv-rwo.yaml file is responsible for creating the Persistent Volumes that are usedby the Kafka and Zookeeper clusters. Sixteen Persistent Volumes were created to allow anycomponent of the system to claim them if needed. The name of the Persistent Volumes createdvary from ”pv001” to ”pv016”, and each of them is configured to provide 500Mi of storage,have access mode ”ReadWriteOnce” and have the contents on the path ”share/pvXXX”where ”XXX” represents the number of the persistent volume in question. After applyingthis YAML file the Persistent Volumes are created and the components may use PersistentVolume Claims to request their use. All of these configurations can be seen in 4.19.
---apiVersion: v1kind: PersistentVolumemetadata:
name: pv016spec:
capacity:storage: 500Mi
accessModes:- ReadWriteOnce
hostPath:path: ”/share/pv016”
Figure 4.19: Excerpt of pq-rwo.yaml with its configurations
All these YAML files are available at https://github.com/jsoares11/MasterThesisExperiences/tree/main/YAML%20files. They allow anyone to replicate oursystem and/or adjust some values to configure the cluster to have more containers (components)or replicas of a specific component.
In terms of loading these configurations (YAML files), the command ”kubectl apply” is used.
$ kubectl apply -f <filename.yaml>
When this command is applied all configurations are loaded to a default namespace. In orderto change the namespace, the command must be change to include the ”-n” flag and the name of
69 Jose Soares

new namespace. Note that there is no default mechanisms to establish the communication betweendifferent namespaces.
e.g., $ kubectl apply -f filename.yaml -n kafka
Since we have many YAML files to be loaded, we simplify the loading process by creating ashell script (named create-kafka-env) that loads all YAML files at once. This script is also availablein the thesis repository 8.
This script contains the commands needed to create the namespace, to configure the loadbalancer (metalLB), to load the system (all defined YAML files) and to define the external servicesneeded to expose our system.
Upon concluded the loading process, this script lists the created services, giving the externalIP addresses that are used to exchange data with the system. The script is described next:
kubectl create ns kafkakubectl apply -f metalLBkubectl apply -f pv-rwo.yaml -n kafkakubectl apply -f zookeeper.yaml -n kafkakubectl apply -f kafka.yaml -n kafkakubectl apply -f mosquitto-in.yaml -n kafkakubectl apply -f mosquitto-out.yaml -n kafkakubectl expose mosquitto-service-in -n kafkakubectl expose mosquitto-service-out -n kafkakubectl apply -f rest-api.yaml -n kafkakubectl expose rest-external-service -n kafkakubectl apply -f coap.yaml -n kafkakubectl expose coap-external-service -n kafkakubectl apply -f controller.yaml -n kafkakubectl get svc -n kafka | grep "mosquitto-service-in"kubectl get svc -n kafka | grep "mosquitto-service-out"kubectl get svc -n kafka | grep "rest-external-service"kubectl get svc -n kafka | grep "coap-external-service"
8https://github.com/jsoares11/MasterThesisExperiences
70 Jose Soares

5: Experiments
As discussed before IoT applications are growing in number. We need new IoT solutions tobe resilient, able to respond as soon and efficiently as possible in case of failure of any service.Furthermore, we don’t want the system to be dependent of every component, since there are manycomponents and one failure must not lead to the whole system failure, hence the use of microservices is crucial.
We want to see if the system will still deliver messages even if a node dies, see if the number oftopics in the system have a significant influence on its performance. Also, we want to investigateif the number of Kafka instances in the Kafka cluster or Zookeepers instances in the Zookeepercluster has a big impact on the system’s behaviour. These behaviours must be studied on oursystem, therefore experiments were performed.
Since we have a big IoT system with many functionalities, as described in chapter 4, we dividethe experiments in 4 groups:
• the first group corresponds to testing communication protocols
• the second group corresponds to the test of the system as a whole
• the third group is the test of the Kafka system
• finally the test of Kubernetes cluster functionalities
These experiments should help us to evaluate if our IoT system is interoperable, resilient,scalable, easy to manage and that ensures data availability. All of the experiments aredescribed in section 5.2. With these experiments we are be able to understand what greatly changesour system’s behaviour, what are the key aspects that have the most impact on its performance.
This chapter first describes the setup used to make the experiments, then the testing scenariosare presented where each test is described. After that, the implementation that allowed thoseexperiments to be made is presented. In the next chapter Results of these tests can be found alongwith conclusions on the system’s behaviour.
5.1 Setup ConfigurationA kubernetes cluster with five virtual nodes, one acting as the master node, and four acting as theslave nodes was used to run the experiments. Two more virtual machines were used to act as theProducer and Receiver. All virtual machines run the Ubuntu 18.04 operating system and have twoCPUs. The master, producer and receiver nodes were all given 3108 MB of RAM while the slaveshad only 2048MB of RAM.
Nodes/Stats Master Slave1 Slave2 Slave3 Slave4 Producer Receiver
RAM (MB) 3108 2648 2648 2648 2648 3108 3108Storage (GB) 40 40 40 40 40 40 40
#CPUs 2 2 2 2 2 2 2
OS Ubuntu18.04
Ubuntu18.04
Ubuntu18.04
Ubuntu18.04
Ubuntu18.04
Ubuntu18.04
Ubuntu18.04
Table 5.1: Virtual Machine Node’s Configuration
71

5.2 Testing Scenarios
5.2.1 ProtocolsScenario 1: Delay and Packet Loss
The objective of this experiment is to understand how the protocols behave when passingthrough the whole system. We want to check the packets lost and delay from the Producer to aReceiver (on the other side of the architecture).
At the end we should be able to compare the delay and packet loss of all protocols and comparethem in order to determine its main differences.
To calculate the delay and packet loss a timestamp is captured in the moment that eachmessage is being sent and a sequential number starting with the value 0 is added to the payloadof the message. This way the receiver will get the message with sequential number 0, 1, 2, 3 andso on. Afterwards, we can check if any message got lost. The experiment was taken under threedifferent sending rates:
• one message for each second,
• one message for each 100 milliseconds and
• one message for each 10 milliseconds.
Each test ran during two hours (each protocol and rate).
5.2.2 SystemScenario 2: Messages with big size - delay vs msg size
The experiments done under scenario 1 were made with a fixed message size comprised of 39Bytes. To understand the capacities of the system in terms of handling big sized messages thistest comprises sending messages with size of 2000Bytes. By checking the delay it’s possible tocompare the results with the results from scenario 1 and see if the delay increased, if so it’s fairto infer that system performance is changed depending on the message size.
Scenario 3: Messages with variable size - delay vs msg size variation
In order to evaluate if the performance of the system is affected by the variation of messages’ssize being sent, in this test messages are sent following the same behaviour as in scenario 1, but thepayload of messages varies from 100Bytes to 1000Bytes (randomly). If any node crashes or the de-lay is substantially increased it means the system wasn’t well prepared to handle such size variation.
Scenario 4: fail recovery (node suddenly unavailable)
The objective of this experiment is to understand how the system handles nodes that fail dueto lack of resources or eventual crashes caused by bugs. With the use of Kubernetes it is expectedthat after approximately five minutes [103], kubernetes recognizes that the node is unavailableand try to reallocate its pods on other available worker. By manually turning off a node whilea Producer sends data to a Receiver each second, we will be able to understand if the pods aretransferred to other available node. If data stops being received the moment the node goes downand after a reasonable amount of time (the time needed to get pods reallocated and restarted)data starts being received again, then we are able to confirm that the system is resilient and faulttolerant.
Scenario 5: low vs high throughput
Having one Producer versus having many Producers must have some impact on the system.With this experiment we have one producer sending data every second versus 10 Producerssimultaneously, all starting at the same time. At the end of both tests, we compare the levels
72 Jose Soares

of CPU and RAM of all slave nodes to determine if there was indeed an impact on the systembehaviour.
5.2.3 kubernetesScenario 6: Time spent to add a node on a cluster with few vs many nodes
To study the influence of adding a node to a system we will start a cluster containing only onenode and will add another node to it, checking the time it takes from the ”Not ready” state to”Ready” state. The Kubectl get nodes command is used.
In order to run this experiment, we used a script called add node time.sh that can be found inthe GitHub repository of this thesis 1. This script is called with a Linux method named timeoutthat allows us to run our script for a specific amount of time (in our case for 5 minutes). In thistime the script keeps executing the command Kubectl get nodes and saves the state of the nodeswith a timestamp on a file, when the state changes from ”Not Ready” to ”Ready” we calculatethe amount of time that kubernetes needs to add the node. This test is repeated on clusterscontaining 5 and 10 nodes. At the end we compare the time spent when adding the node on thedifferent clusters to understand if the number of nodes in a cluster has an important impact onthe time needed by the cluster to add a new node.
Scenario 7: Scaling delay
To understand the time that Kubernetes requires to scale pods, in this experiment a clustercontaining one pod running Mosquitto IN will be scaled to ten pods, twenty, thirty, forty, fifty,sixty and seventy pods.
The time needed by Kubernetes to execute the scale command on each of these cases is savedand afterwards they are all compared.
This way we are able to study the behaviour of Kubernetes in terms of scale time. The timespent to execute the scaling is calculated by checking the time taken for the pods status changefrom ”Creating to Running”. This status is visible by using the command Kubectl get pods.
5.2.4 KafkaScenario 8: Replication Factor
With this experiment we intend to verify if the system is affected by the number of Kafkapods. Summing up, we want to see the impact of having a big replication factor vs having a lowreplication factor and compare the results to understand if this factor is crucial on the system’sperformance. To verify this, the same method as in scenario 1 will be used: data will be flowingfrom the Producer to the Receiver and the delay will be calculated for both cases along withthe CPU and RAM usage of the slaves running Kafka pods. If the delay, RAM or CPU usageincreases it means that replication factor has a big impact on the system.
Scenario 9: Number of partitions
In order to understand if the number of partitions has an impact on our system we performthe same test done in scenario 7 where data is flowing from the Producer to the Receiver and seeif the delay is directly affected by the number of partitions using the measured delay plus CPUand memory consumption.
5.3 Implementation:In order to evaluate all scenarios defined in section 5.2 it was necessary to implement the Producersand Receivers for all Protocols, the node state monotorization (state ”Ready” vs state ”NotReady”),
1https://github.com/jsoares11/MasterThesisExperiences/tree/main/implementation/add_node
73 Jose Soares

the code that allows a user to perform actions on the topic being used and the packet loss calcula-tion. For the Producers, Receivers and the Monitor we picked C as the programming language towork with, as for the remaining Shell scripts were used. Most experiments were made for a periodof two hours, for the cases where this was not true the period of the test is described in the Resultssection (section 6).
In this context the following list of files was generated. All of these files are available in theGitHub repository of this thesis 2.
• ”exp mqtt pub”: Producer that uses MQTT protocol to send packets;• ”exp coap put”: CoAP Producer using CoAP protocol to send packets;• ”exp rest put”: Producer that sends packets using the REST protocol;• ”exp mqtt sub”: A Receiver that uses MQTT protocol to receive packets;• ”exp coap get”: Receiver responsible of getting CoAP packets;• ”exp rest get”: A Receiver using the REST protocol to receive packets;• ”monitor”: Script that monitors the cluster node’s status to evict pods on crashed nodes;• ”controller”: Script used by the ”Controller” pod with the only purpose of allowing a user
to list, delete or create a topic. This allows users to redefine the partitions and replicationfactor of the used topic;
• ”packet loss”: Script used for packet loss calculation given a file with the sequential numberof all received messages;
• ”get cpu usage.sh”: Script responsible for capturing the CPU being used over a period oftime;
• ”get mem usage.sh”: Script that captures the RAM being used in a period of time;
The message format used for all experiments was the same. They were sent to the systemas raw text, but once inside the system and the Proxy, the current timestamp is added at thebeginning of the message and the format is changed to conform with a JSON format. After this,the message is saved in Kafka, so Receivers get data in JSON format. In our experiments, themessage payload used in fixed message sizes had the following message:
fixed message: "standard test with fixed message size"
Once inside the Proxy, data would be translated to include the timestamp and to conform withJSON sintaxe/format:
{1598554879520:"standard test with fixed message size"}
5.3.1 ProducersThe Producers are programs that keep sending data to the system at a specific rate, during acertain amount of time. These parameters where configured directly in source code files, whichimplies a new source files compilation for each experimentation. Each message sent has a timestampthat indicates the sending instant from the producer. This timestamp is considered part of thepayload inside the rest of the system.
These programs receive as arguments the address of the Broker or Server that will be used tosend messages. The amount of time that the Producers were sending messages was the same forall experiments, and had a duration of two hours, while the rate was relative to each experiment(between 1 to 1000 message(s) per second).
The implementation of each Producer is similar for all protocols, in Algorithm 1 a pseudo-codeis presented to illustrate the logic behind the producers. Since they are similar we used the MQTTprotocol as example. All implemented Producers are available on this thesis repository with thenames ”exp mqtt put.c” for MQTT, ”exp coap put.c” for CoAP and ”exp rest put.c” for REST.
During the experiment, the producer will keep on sending messages. A system call to”mosquitto pub” is used to send messages. Each message is composed by a topic and messagepayload. In our experiments the topic used was always the same ”iot”.
2https://github.com/jsoares11/MasterThesisExperiences/tree/main/implementation
74 Jose Soares

Algorithm 1: Mqtt producer pseudo-code1 Producers(addr, log);
Input : addr - The address of the respective server/brokerlog - The name of the file to save the timestamp of sending
Output: log with timestamp2 do3 system(mosquitto pub addr message);4 log(timestamp);5 sleep(rate);6 while elapsed <finish time;
Regarding CoAP and REST protocols, clients based on libcoap and ”ulfius” libraries wereimplemented to support both these protocols.
As described before, each protocol implementation has an external service and address that isused to communicate with the system. Each of these Producers will establish the connection withthe corresponding service on the system, in this case MQTT producer is connected to MosquittoIn, CoAP to CoAP Server and REST to Rest Server.
5.3.2 ReceiversIn this work, the receivers did not follow the same approach for all protocols.
The MQTT receiver differs from the others because this protocol follows the publish-subscribepattern instead of request-response pattern.
This receiver receives as arguments the address of the Mosquitto and the name of the log filewhere the received messages and arriving timestamps are registered.
With the use of the functions ”popen” and ”fgets” from C library we are able to use”mosquitto sub” and get the messages it receives. The ”popen” command is used to create anotherprocess that runs a program and creates a pipe between them, returning a pointer to a streamthat can be used for read or write data.
In this case the Mosquitto client (”mosquitto sub”) is called and the ”fgets” function is used toread/obtain the received messages.
In Algorithm 2 a pseudo-code of the receiver behaviour is presented. First the ”popen” functionis used to get the stream, and then, while fgets is able to read data from that stream, the JSONmessage is unwrapped to get the wanted fields.
The unwrapping was done with the use of the function ”strtok”, which breaks a message intoa series of tokens using a delimiter (the delimiter used was the character ”:”). These fields are thetimestamp (current timestamp), sent timestamp (received in the payload), payload received andsequential number.
A log file is created at the beginning. Everytime a message is received the unwrapped fieldsare appended to the log file.
Algorithm 2: Mqtt receiver pseudo-code1 MQTT Receiver(addr, log);
Input : adr - The address of the respective brokerlog - The name of the logfile to use
Output: log with received timestamp, sent timestamp, payload and sequential number2 cmd = ”mosquitto sub addr”;3 fp = popen(cmd, ”read”);4 while fgets!=NULL do5 strtok(msg rcved);6 log(timestamp, sent tmstmp, payload, seq num);7 end
In the case of CoAP and REST implementations the Receiver is continuously sending getrequests to the system until a timeout without receiving data is reached, in our case 20 secondswithout receiving data means the experiment is over.
75 Jose Soares

These Receivers receive as arguments the address of the server that will be used and the logfile name. A pseudo-code is shown in Algorithm 3.
In this implementation the ”popen” function was used to call a CoAP client and/or a RESTclient that sends the get requests to the given address, while the ”fgets” function was used to readmessages that arrive from the server. Similar to MQTT the ”strtok” function was used to unwrapthe received messages in order to get the message fields which are stored in the log file.
Algorithm 3: CoAP and REST receiver pseudo-code1 CoAP and REST Receivers(addr, log);
Input : addr - The address of the respective serverlog - The name of the logfile to use
Output: log with received timestamp, sent timestamp, payload and sequential number2 cmd = ”./coap-client -m get addr”;3 # or ”./simple client GET addr” (for REST);4 while elapsed <timeout do5 fp = popen(cmd, ”read”);6 while fgets!=NULL do7 strtok(msg rcved);8 log(timestamp, sent tmstmp, payload, seq num);9 end
10 end
5.3.3 MonitorThe Monitor is responsible for continuously check the status of all nodes in the cluster. If a nodehas a ”Not Ready” status for more then 6 minutes, the monitor evicts pods from that node. If thenode never returns, it must be manually deleted from the cluster.
The monitor doesn’t have capabilities to delete any node, only starts the eviction of pods whosenodes had crashed.
If the node returns then the eviction will proceed and the node will be cordoned (meaning thatit is marked as an unschedulable node), hence to use it again you must uncordon the pod usingthe command:
$ kubectl uncordon <node_name> -n <namespace>
Once started, the Monitor runs forever, and checks the nodes’s status with the use of thefollowing command:
$ kubectl get nodes -o wide | awk '{if(NR>2) print $1 $2}';
This command uses the ”awk” function to get only the ”Status” column from the output ofthe command ”kubectl get nodes”, leaving out the columns ”Roles”, ”Age” and ”Version”. It isexecuted in Monitor using the ”popen” command, followed by ”fgets” to have access to the outputof the ”popen” command. This output is used to check if a node status is found as ”Not Ready”.When it happens, we need to check how long the node is ”Not Ready”. For that we need to executethe following command:
$ kubectl describe node <nodename> | grep "Ready" | awk '{ if(NR <= 1)print $3 $4 $5 $6 $7}');
This command uses the ”awk” command to get the last heartbeat heard from the node inkubernetes, leaving out unnecessary information. The numbers 3 through 7 represent the columnswhere the data of the last heartbeat is represented (e.g. Wed, 09 Sep 2020 14:41:51).
The ”fgets” function is used to get the output of the ”popen” function and the field heartbeatreceived is forwarded to ”is node dead” function, which evaluates if a node was ”Not Ready” forthe last 6 minutes.
This ”is node dead” function uses the function ”strtok” to separate the day, year, hour, minutesand seconds of the heartbeat and of the current time.
76 Jose Soares

Both timestamps are then evaluated in order to determine its difference. If the difference isbigger then six minutes then we assume that the node crashed and proceed to evict its pods. Toevict the pods a new thread is created allowing the monitor to keep checking other nodes whileothers are being evicted. The thread uses the following command to evict the pods:
$ kubectl drain <node_name> --force --ignore-daemonsets --delete-local-data
Algorithm 4 shows a pseudo-code that illustrates the logic of the monitor.
Algorithm 4: Monitor pseudo-code1 Monitor(finish time, rate);
Input : finish time - Time of the experimentrate - The time between each status observation
2 while elapsed <finish time do3 cmd = ”kubectl get nodes -o wide | awk print $1 $2”;4 fp = popen(cmd, ”read”);5 while fgets!=NULL do6 strcmp(status, ”Not Ready”);7 cmd2 = ”kubectl describe node <node name> | grep ’Ready’ | awk print $3 $4 $5
$6 $7”;8 fp = popen(cmd2, ”read”);9 if fgets!=NULL then
10 evict ← isNodeDead();11 if evict == true then12 cmd3 = ”kubectl drain <node name> force ignore-daemonsets
delete-local-data”13 end14 end
5.3.4 ControllerThe controller is used to create, list or delete a topic in Kafka. The following command is used toenter in the Controller pod:
$ kubectl kubectl exec -n kafka --stdin --tty podname -- /bin/bash
The Controller has a set of configurations that must be specified in its arguments. The config-urations are:
• ”Method” : The method to either Create, List or Delete topics from Kafka;
• ”Topic” : The topic to be created or deleted;
• ”Replication Factor” : Replication Factor on a newly created topic
• ”Number of Partitions” : Number of partitions on a newly created topic
• ”Zookeeper Server” : The address of the Zookeeper in the form ¡address¿:¡port¿
Taking into account the configurations given at the startup of the controller, it will executedifferent operations:
• If the method given as argument is ”create”, it executes the following command, which createsa new topic in Kafka.
$ ./kafka_2.12-2.5.0/bin/kafka-topics.sh --create --zookeeper <zook_addr>--replication-factor <rep_factor --partitions <num_partitions>--topic <topic>
• If the method passed as argument was ”list”, the Controller will execute the respectivecommand, which allows to list topics from Kafka.
77 Jose Soares
$ ./kafka_2.12-2.5.0/bin/kafka-topics.sh --list --zookeeper <zook_addr>
• If none of the above methods is passed as argument, the Controller checks if given method is”delete”. If true, the topic mentioned in arguments is deleted from Kafka. In order to do thisthe Controller will issue two different commands to the system: first will change the retentionperiod of messages in the topic to 1 second, which means that after 1 second messages aredestroyed; secondly deletes the topic. Both commands are listed next:
$ ./kafka_2.12-2.5.0/bin/kafka-topics.sh --zookeeper <zook_addr> --alter--topic <topic> --config retention.ms=1000
$ ./kafka_2.12-2.5.0/bin/kafka-topics.sh --zookeeper <zook_addr> --delete--topic <topic>
The first command is necessary because Kafka will not destroy topics that contain data.Without this command the deletion of the topic takes the time defined for data retention inKafka. In Algorithm 5 the script is illustrated.
Algorithm 5: Controller pseudocode1 Controller(method,topic,rep factor,num part,zook addr);
Input : method - create, list or deletetopic - the Kafka topic in questionrep factor - the number of replicas to use for the topic in questionnum part - the number of partitions to usezoo addr - the address of the zookeeper to use
2 if method=”create” then3 ./kafka-topics.sh –create <zook addr> <rep factor> <num partitions> <topic>4 if method=”list” then5 ./kafka-topics.sh -list <zook addr>6 if method=”delete” then7 ./kafka-topics.sh <zook addr> –alter–topic <topic> –config retention.ms=1000
./kafka-topics.sh <zook addr> –delete–topic <topic>
5.3.5 Packet LossTo calculate the number of messages that did not arrive into the system or arrived twice, a PacketLoss script was built. This script evaluates the sequential number generated by producers. Thissequential number is received in each message by the Receiver that logs the value in the log file.From that log, it was possible to get all the sequential numbers. If any number is missing, it meansthe correspondent message was lost, and it counts as a lost message.
It should be noted that since CoAP and REST send get requests instead of subscribing tothe respective servers if the get request gets to the server faster than the put request (from theProducer) the server will answer the Receiver the last message it has on the system, meaning thatthe Receiver will get the same message twice. These cases are not counted as messages lost.
To get data from Kafka, servers use the respective external Service, which uses metalLB to pickone available Kafka broker, meaning that the Kafka used is not always the same. Since replicationof data between Kafka brokers is not instantaneous, this means that for a short period some of theKafka Brokers might still have previous values when the Receiver asks for data. Hence, sometimesolder messages might be received by Receivers, these kind of situation is not counted as messageslost.
The implemented script is named ”check packet loss.c” and it receives as argument the nameof the file containing the sequential numbers (this file must contain only the sequential numbers).The script reads the file line by line, using the command ”fgets”, and compares the current lineto the previous one. If the current line has a smaller or equal value than the last line, then nopackets are lost (the value is assumed to be a duplicated). If the current message differs fromthe last message by one value, then the number is sequential, which means there was no packetslost. Otherwise, if the last message has a smaller value than the second last, and their difference
78 Jose Soares

is bigger than one, messages were lost. The number of messages lost is equal to the differencebetween the current line and the second last message minus one (current - second last - 1). Forexample, in a file with the sequential numbers {1,2,3,1,6} the script will assume that the secondvalue ”1” is duplicated and it is not counted as a message lost, but messages four and five werenot received and are counted as packets lost (6 - 3 - 1 = 2 messages lost). The script is betterillustrated in algorithm 6.
Algorithm 6: Packet Loss pseudo-code1 check packet loss(filename);
Input : filename - the name of the file containing all sequential numbers2 last = 0;3 sndlast = 0;4 while fgets != NULL do5 if current <= last then6 continue;7 if current - last == 1 then8 continue;9 if last <sndlast then
10 if current - sndlast >1 then11 lost += current-sndlast-1;12 else if last - sndlast == 1 then13 lost += current - last - 1;14 end
5.3.6 CPU ConsumptionAnother measure used to evaluate our system is CPU consumption. In order to quantify the metric,a CPU consumption script (”get cpu usage.sh”) was created. It can also be found at the thesisrepository. This script executes the ”mpstat” command in nodes to get the CPU consumption.The ”mpstat” command outputs in the standard output activities of all available processors in themachine. This output includes information about the following:
• %usr: Indicates the ”amount” of time spent, in percentage, by the CPU to run applications(at user level);
• %nice: In Linux, the CPU priority is measured in nice values (between -20 and 20) [97].The higher the nice value, the lowest the priority. The nice field in ”mqstat” indicates thepercentage of CPU usage when the execution happens at user level with nice priority (positivenice value, meaning low priority);
• %sys: Show the CPU percentage usage at the system level (kernel);
• %iowait: Indicates the percentage of time that the processors were idle at a moment thatthe system was overloaded with disk I/O requests;
• %irq: The percentage of time spent by processors to service hardware interrupts;
• %soft: Indicates the percentage of time spent by the processors to service software interrupts;
• %steal: Shows the percentage of time spent waiting by virtual CPUs while the hypervisorserved other virtual processors;
• %guest: Percentage of time spent by the CPU to run virtual processors;
• %idle: The percentage of time that the CPU was idle (no outstanding Input/Output (I/O)requests).
To use this script, a package called ”sysstat” must be installed in the Linux environment.The developed script ”get cpu usage.sh” receives three arguments: the rate to be used (the
amount of time between each ”get”), the number of times that is needed to ”get” the usage and
79 Jose Soares

the name of the file in which the usage values of all fields are going to be saved. To use the scriptconsider the following example:
$ ./get_cpu_usage 1 60 test
In this example the script reads the CPU usage every second for a total of 60 times (meaningfor a total of 60 seconds/1 minute) and place each value in a file named ”test”.
5.3.7 RAM ConsumptionTo capture the RAM consumption of slave nodes in the experiments defined in section 5.2, ascript named ”get mem usage.sh” was created. This script uses the ”free” command to access thememory usage. The ”free” [67] command provides information about the total amount of free andused physical and swap memory in the system. It also displays information about the buffers andcaches used by the kernel. The output of this command contains the following fields [80]:
• total: The total memory capacity in the machine;
• used: Represents the used memory and is calculated as total - free - buffers - cache;
• free: The unused memory in the machine;
• shared: Express the memory used by tmpfs (a virtual memory file system);
• buffers: The memory that is used by kernel buffers;
• cached: Represents the memory that is used for cache;
• buffers/cache: The sum of the previous buffers and cache fields (buffers cache);
• available: An estimation of the available memory that can be used to start new applications.
To use the ”free” command, a package must be installed in the Linux environment called”gawk”. The developed script ”get mem usage.sh” receives only one argument, the name of thefile to save the memory usage. It is important to notice that this script has an infinite loop (”whiletrue”), hence its usage should be heedful. The script is designed to work this way because it isintended to be used with the command ”timeout”. The ”timeout” command allows the user torun a command in Linux for a set amount of time. The amount of time between each execution of”free” is set by using the ”sleep” command that waits one second inside the loop, this way, withthe ”timeout” command, we tell the script to run until a specific amount of time every second. Anexample of the use of the script can be seen next:
$ timeout 5s ./get_mem_usage.sh test_ram
In this example, the ”get mem usage.sh” script runs for five seconds and saves the capturedmemory usage in the file named ”test ram”. The following Algorithm (7) shows the script in apseudo-code fashion.
Internally, the script uses three commands, the ”grep”, ”strftime” and ”awk” commands. The”grep” command is used to filter the output of ”free” command in order to get only the linecontaining the word ”Mem”. The ”strftime” command is used to get the timestamp, which allowsto understand the value of the RAM usage in a specific moment, and the ”awk” command is usedto add the timestamp to the line that is going to be saved in the log file.
Algorithm 7: get mem usage.sh pseudo-code1 get mem usage.sh(log);
Input : log - the name of the log file to save the usage2 while true do3 free -m | grep ”Mem” | awk {print strftime()} » log
sleep 14 end
80 Jose Soares
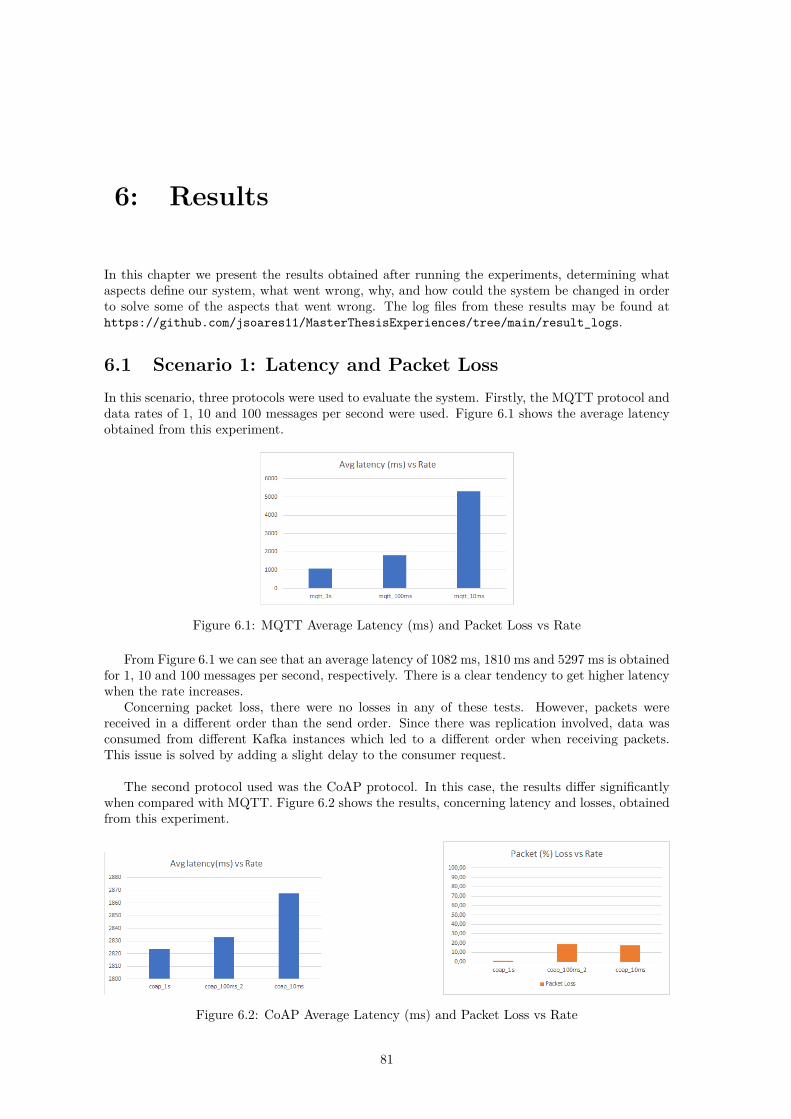
6: Results
In this chapter we present the results obtained after running the experiments, determining whataspects define our system, what went wrong, why, and how could the system be changed in orderto solve some of the aspects that went wrong. The log files from these results may be found athttps://github.com/jsoares11/MasterThesisExperiences/tree/main/result_logs.
6.1 Scenario 1: Latency and Packet LossIn this scenario, three protocols were used to evaluate the system. Firstly, the MQTT protocol anddata rates of 1, 10 and 100 messages per second were used. Figure 6.1 shows the average latencyobtained from this experiment.
Figure 6.1: MQTT Average Latency (ms) and Packet Loss vs Rate
From Figure 6.1 we can see that an average latency of 1082 ms, 1810 ms and 5297 ms is obtainedfor 1, 10 and 100 messages per second, respectively. There is a clear tendency to get higher latencywhen the rate increases.
Concerning packet loss, there were no losses in any of these tests. However, packets werereceived in a different order than the send order. Since there was replication involved, data wasconsumed from different Kafka instances which led to a different order when receiving packets.This issue is solved by adding a slight delay to the consumer request.
The second protocol used was the CoAP protocol. In this case, the results differ significantlywhen compared with MQTT. Figure 6.2 shows the results, concerning latency and losses, obtainedfrom this experiment.
Figure 6.2: CoAP Average Latency (ms) and Packet Loss vs Rate
81

The results showed an average latency of 2823 ms, 2833 ms and 2868 ms for rates of 1, 10 and100 messages per second, respectively. Similar to the first case, here there is also a very smalltendency to have more latency when the rate gets higher.
Concerning packet loss, for 1 message per second 0,93% of the packets were lost, while for 10messages per second 18,52% of the total packets sent were lost, and for 100 messages per second17,58% packets never arrived. In this experiment we noticed that the CoAP server shows lowperformance to handle a high number of requests per second.
The third protocol used was the REST protocol. In terms of latency the results obtained area little higher than CoAP. These results are presented in figure 6.3.
Figure 6.3: REST Average Latency (ms) and Packet Loss vs Rate
The average latency obtained in this experiment for 1 message per second rate was 3176ms,for 10 messages per second was 3115ms and for 100 messages per second was 251ms. In this case,contrary to MQTT and CoAP results, there doesn’t seem to be a tendency to have more latencywhen the rate gets higher.
In terms of packet loss, due to an internal error that occurred inside the experiment script(”exp rest get”) when sending the get request the receiver in the experiment would stop consumingdata. All data from that point on was not received, but not counted as packet loss because thesystem was still running (no nodes or pods have crashed). Nonetheless, checking the data that wasreceived until the crash it was possible to see that all rates had packets lost. For rate of 1 messageper second 0,5% of the packets were lost, for rate 10 messages per second 32,5% of the messageswere lost and for rate 100 messages per second 28,3% of the messages were lost.
6.2 Scenario 2: Messages with big size - latency vs msg size
In this scenario, the same tests made in scenario 1 for MQTT were repeated with a bigger messagesize (2000B). The results obtained from this experiment were compared with the results from theprevious experiment (scenario 1) in order to understand the impact of the message size in thesystem. The figure 6.4 shows a comparison of the results obtained from this experiment and fromthe experiment done in scenario 1 in terms of latency.
Figure 6.4: MQTT Small vs Big message latency
82 Jose Soares

From the above figure it is possible to see a latency of 1075ms, 1757ms and 1840ms for ratesof 1, 10 and 100 messages per second, respectively. There seems to be a tendency to have a biggerdelay for higher sending rates.
Excluding the latency obtained for a small sized message with rate of 100 messages per second,results from both experiments seem very similar when comparing small versus big sized messages.There seems to be a tendency to have a similar latency when messages have small or big messagesize.
Concerning the packets lost, there were no packets lost for all experiments.
6.3 Scenario 3: Messages with variable size - latency vsmessage size
In this experiment the same approach of scenario 2 was used. To evaluate the impact the messagesize, the same tests made for MQTT in scenario 1 are going to be repeated, but a variable messagesize (between 100 B and 1000 B) was used. The results from this experiment were comparedwith the results obtained in scenario 1. Figure 6.6 shows the comparison made between bothexperiments results obtained for each rate, concerning the latency and packet loss.
Figure 6.5: MQTT Small vs Big message la-tency
Figure 6.6: MQTT Small vs Big messagepackets lost
In terms of latency, the values obtained for rates of 1, 10 and 100 messages per second are1079 ms, 1760 ms and 2019 ms, respectively. These values seem to be similar to the valuesobtained in scenario 1, except for the results using rate of 100 messages per second.
Concerning packet loss, 21,5 %, 22,27 % and 86,6 % of packets were lost for rate of 1, 10 and100 of messages per second, respectively. Using messages with variable size, we found out thatthe system has a big struggle handling the requests. Higher rates originate higher the number ofpackets lost.
6.4 Scenario 4: fail recovery (node suddenly unavailable)In this experiment we had a Producer sending data with MQTT to a Receiver for 20 minutes. Whenthe timeline reached half the test (10 minutes), a node was manually ”crashed” (forced crashed)by turning off one of the slave nodes, in this case the Mosquitto IN service goes down, so thatwe could see data stop being received. The expected behaviour was that kubernetes would listento the heartbeats of the node and understand it had crashed. After that, kubernetes should waitabout five minutes before evicting the pods in the node and reschedule them to another availablenode. Unfortunately, we found out that there is a bug concerning Daemon Sets in Kubernetes,that leads to a misbehave of the Node Controller. The Node Controller is responsible for evictingthe pods out of the nodes that crash, but as we understood, it doesn’t deal well with Daemon Setsunless the cluster is on the cloud. ”Mosquitto In” doesn’t use Daemon Sets itself, but since weuse bare metal kubernetes cluster, to be able to communicate externally metalLB is used to giveexternal ip addresses to services, and metalLB uses Daemon Sets.
This way the actual behaviour was the node status becoming ”NotReady” but the pods werestill running as if the node was alive. To bypass this problem a script called node monitor wasbuilt. This script checks all node’s status, if it finds a status ”NotReady” first it checks for how
83 Jose Soares

long it has been in that status. If the node has been ”NotReady” for more then six minutes, thescript enforces an eviction of the pods in that node. The result is an instant rescheduling of thepods and the comeback of the service.
Figure 6.7 shows the packets received on the log file, where it’s visible that packets were beingreceived until around the packet number 350. After that, for a while no message arrived, thisis due to the fact that the node monitor hasn’t yet recognized the node as unfeasible (becausekubernetes takes some time to recognize the node as ”NotReady” and that time is added to thesix minutes monitor waits). The next message received is around the message number 400 andfrom then on the messages are received again. This shows us that the node has gone down (in ourcase intentionally), its status became ”NotReady” and the Monitor took action to evict the nodesand bringing the service back up.
In figure 6.7 the number 0 represents messages that have not arrived and the number 1represents the messages that have arrived. Meaning that from number 357 until 419 all messageswere lost on a total of 1062 messages sent. This totals a number of 62 packets lost from themoment the node crashed until the pods started running on a new node.
Figure 6.7: #Packets Received
6.5 Scenario 5: low vs high throughputTo evaluate the system behaviour on high vs low throughput we had a Producer sending data tothe Receiver using MQTT protocol and measured the CPU and RAM levels of all slave nodes.After this, the same experiment was repeated, but with 2 different virtual machines sending data.Each machine was responsible to run 5 Producers in parallel, having in total 10 Producers sendingdata to the system.
Figures 6.8, 6.9 and 6.10 show the results of this experiment in terms of CPU and RAM usagelevels. These figures show that for all slaves there is no much difference in CPU level from havinga single Producer sending data or having ten, hence having low vs high throughput has no impacton the system.
Figure 6.8: Slave 1 - CPU level - 1 Producer vs 10 Producers
84 Jose Soares

Figure 6.9: Slave 2 - CPU level - 1 Producer vs 10 Producers
Figure 6.10: Slave 3 - CPU level - 1 Producer vs 10 Producers
In terms of RAM, the same is not true. We found out that the usage of RAM increases inall slave nodes during the experiment. Hence, to determine if the throughput has impact on thesystem, we decided to compare the impact of one producer with the impact of 10 producers.Although, for tests with only one producer the starting point of RAM usage was around 1900 MB,and for 10 producers was around 1400 MB. After searching the logs for an explanation we foundout that the buffer/cache was higher for tests with 10 Producers, which means that in the firsttest each slave saved information in cache. Looking at the figures 6.11, 6.12 and 6.13 we cansee an orange line representing the free space, a blue line representing the memory used and agrey line representing the cache. The figures show that RAM level increases for both tests (lowand high throughput), but not which test had the highest increment of memory usage. It canbe identified in Tables 6.1 and 6.2, which represent the maximum and minimum values for RAMusage. With these tables we are able to compare the growth of memory usage in each slave node.
Figure 6.11: Slave 1 - CPU level - 1 vs 10 Producers
85 Jose Soares

Figure 6.12: Slave 2 - CPU level - 1 vs 10 Producers
Figure 6.13: Slave 3 - CPU level - 1 vs 10 Producers
Node vsRAM (MB) Slave1 Slave2 Slave3
Max Used 2108 2233 2143Min Used 1841 2071 1964Increased 267 162 179
Table 6.1: Increment of RAM usage on tests with one Producer
Node vsRAM (MB) Slave1 Slave2 Slave3
Max Used 1839 1558 1499Min Used 1431 1455 1479Increment 408 103 20
Table 6.2: Increment of RAM usage on tests with ten Producers
From tables 6.1 and 6.2 we can see the growth of the memory usage concerning the throughput.It is possible to see that on both cases (low and high throughput) the slave 1 has a higher increaseof RAM used than the other slaves. For low throughput slave 1 has the usage of RAM increasedby 267 MB, while slave 2 and 3 have 162 MB and 179 MB respectively. For high throughputslave 1 has the usage of RAM increased by 408 MB, while slave 2 and 3 have 103 MB and 20 MBrespectively. The reason for this behaviour is that the pod that handled the requests was runningon the slave node 1, hence, needed more memory to work than the other slaves.
Based on this experiment we conclude that throughput does indeed have an impact on thesystem behaviour, but it is mainly directed to the usage of RAM and only affects the nodes thatare directly connected to the work that is being done (in this case, Mosquitto In).
86 Jose Soares

6.6 Scenario 6: Time spent to add a node on a cluster withfew vs many nodes
The starting point for this experiment consists on a cluster with one master and one slave nodes.From here on forward we added nodes to the cluster checking the time it took to become ”Ready”.
A script named ”add node time.sh” is used along with the function timeout of the linux libraryin order to stop the program after a specific time. The script runs a while true that calls thecommand ”kubectl get nodes” and saves the state of a desired node on a pre-defined file along withthe timestamp.
The timestamp was calculated using the command strftime of the Linux distribution. Runningthis script before adding the node to the cluster and stopping it after the node is ready outputs afile containing the first moment that the node was recognized but wasn’t available on the cluster,status: ”Not Ready”, and also the moment when that status changed to ”Ready”.
With both those timestamps we were able to determine the time needed to add one single nodeto the kubernetes cluster having already 1, 3, 5, 8 and 10 nodes.
The results show that for any of these clusters the amount of time is very similar, around 30to 40 seconds. There is no sign of a tendency, maybe the tests were few and with a cluster withmore nodes would actually have an impact but with a cluster containing from one to ten nodesthe latency is very similar. The results are shown in figure 6.14. From this figure is clear that thetime spent doesn’t follow the number of nodes that are added (there is no direct relation in termsof time consuming).
Figure 6.14: #Nodes in the cluster vs time spent to add another node
6.7 Scenario 7: Scaling delayThis experiment started on a cluster with a master and three slave nodes. Firstly, we created adeploy of the system without replication of any component.
In order to evaluate how much time each scaling would take, a program called ”scale time.sh”was used along with the Linux command ”timeout” in order to run the script for a specific amountof time, similar to ”add node time.sh”.
This script runs a while true that calls the ”kubectl get replicasets -n kafka” command whichshows information (namely, the Desired number of pods, Current existing pods and those that areReady under a Replicaset) in the namespace kafka.
This information is saved in a given file and is used to find the first time that the cluster findsout about the need to scale the chosen pod (Desired) and also to find the first time that the numberof needed pods are all ready to be used in the cluster (Ready).
For our experiments we picked Mosquitto in as the pod subject and started by scaling it withthe command:
$ kubectl scale deployment mosquitto-deployment-in --replicas=10 -n kafka
A scale of 20, 30, 40, 50, 60 and 70 pods were performed. All went fine until the scale for 70pods. Apparently, our cluster can’t handle scaling 70 pods, the result of trying is a crash of one or
87 Jose Soares

more nodes. Until the 70 pod scaling the results obtained show that in fact the higher the numberof pods we tried to scale is too much and requires longer processing times from kubernetes.
Also, we learned that if the cluster doesn’t have slaves with enough resources to handle suchnumber, then nodes may crash, leading to a need to scale down the pods or increase the clusterresources. These results are illustrated in Figure 6.15.
Figure 6.15: #Instances vs time spent scaling them
6.8 Scenario 8: Replication Factor
In this scenario we had an MQTT Producer sending data to the system and an MQTT Receiversubscribing that data. The experiment comprised tests with replication factor 1, 3, 7, 10 and 15.
The initial system is composed by 3 slave nodes that comprises 3 Kafka pods. In this experimentthis setup was changed to support a replication factor bigger than 3. To do this we scaled theKafka pods with the command:
$ kubectl scale statefulsets kafka --replicas=<#replicas> -n kafka
Tests with replication factor (#replicas) 1, 3 and 7 had an average latency of 1644 ms, 1541 msand 1545 ms, respectively. In terms of packet loss, there were no packets lost in any of the tests.These results can be seen in figure 6.16.
Figure 6.16: Replication factor vs Avg. latency
Despite the difference of 100 ms in the test with replication factor 1, we assume that this isrelated to the lack of parallelism that is offered by the Kafka replication feature. In this caseproducers and consumers are using the same replica to write and read data, which may introducesome extra latency.
Hence we concluded that replication factor has some impact on write and read delays. Theperformance of the system improves when many replicas are used. Since many producers andconsumers may interact with the system, at the same time, it is important to distribute the loadof writing or reading by different replicas, which has impact on the behaviour of the system.
In this experiment we noticed that replication factors of 10 and 15 are not supported since slavenodes are constantly crashed. In our opinion this is due to the lack of resources, mainly RAMmemory that is allocated to each slave node.
88 Jose Soares
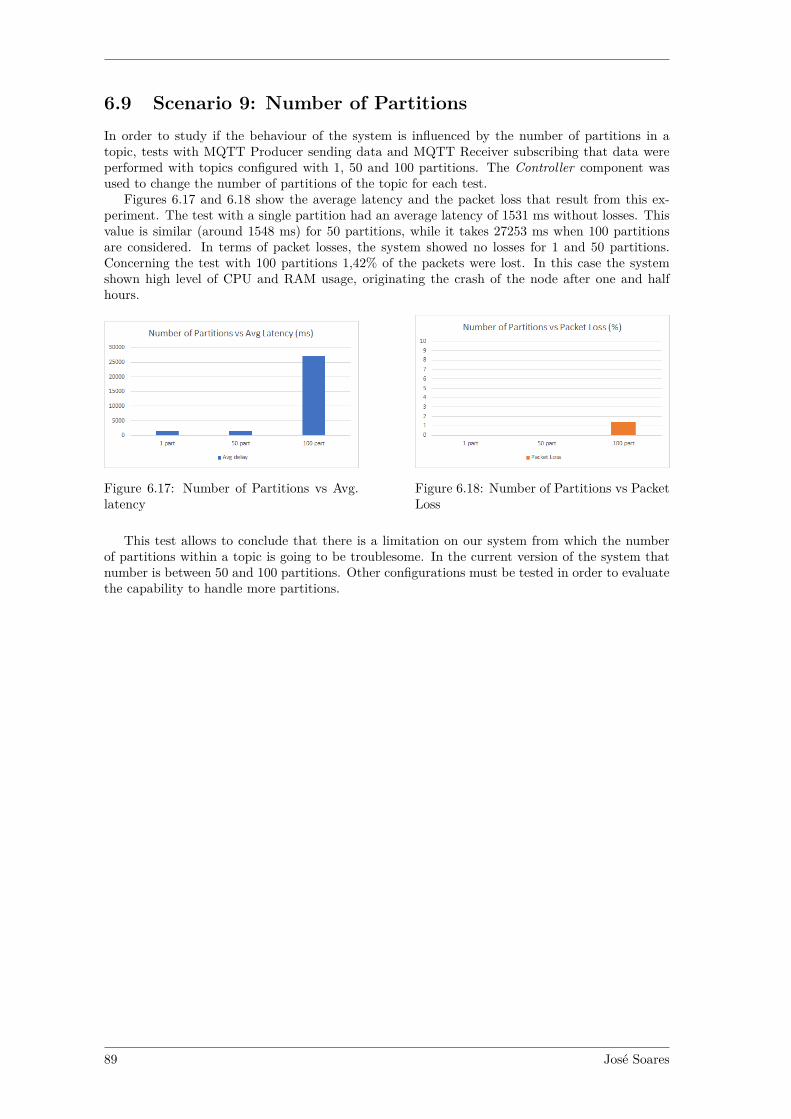
6.9 Scenario 9: Number of PartitionsIn order to study if the behaviour of the system is influenced by the number of partitions in atopic, tests with MQTT Producer sending data and MQTT Receiver subscribing that data wereperformed with topics configured with 1, 50 and 100 partitions. The Controller component wasused to change the number of partitions of the topic for each test.
Figures 6.17 and 6.18 show the average latency and the packet loss that result from this ex-periment. The test with a single partition had an average latency of 1531 ms without losses. Thisvalue is similar (around 1548 ms) for 50 partitions, while it takes 27253 ms when 100 partitionsare considered. In terms of packet losses, the system showed no losses for 1 and 50 partitions.Concerning the test with 100 partitions 1,42% of the packets were lost. In this case the systemshown high level of CPU and RAM usage, originating the crash of the node after one and halfhours.
Figure 6.17: Number of Partitions vs Avg.latency
Figure 6.18: Number of Partitions vs PacketLoss
This test allows to conclude that there is a limitation on our system from which the numberof partitions within a topic is going to be troublesome. In the current version of the system thatnumber is between 50 and 100 partitions. Other configurations must be tested in order to evaluatethe capability to handle more partitions.
89 Jose Soares

7: Conclusion
Summary
With this work we have gained a considerable amount of knowledge relative to IoT systems,namely, how IoT started to appear, what the community is working on, which tools are beingstudied and built in order to have systems fulfilling the most possible requirements defined in 3.2.
We had the opportunity to study many technologies such as the communication Technologies,the patterns and protocols that are used in the communication between devices and IoT platforms.
Additionally, we learned how systems work in the context of resource constrained environ-ments, where multiple failures may happen due to many different reasons, that vary from simpleprogramming bugs to bad design of the system as a whole.
In IoT systems it is very important to be prepared to accommodate new technologies anddevices that raise quickly. So it is important to have flexible and adaptable architectures. In thiscontext, Cloud computing, micro-services, Kubernetes and Kafka are frameworks that help tocreate good solutions. For example, with the use of the cloud infrastructure it is possible to obtainmore resources that allow, for instance, to use kubernetes to deal with large number of devicesfrom a single cluster. It is important to manage devices easily at a single point. Additionally, itis important to deal with large amount of data. For that, Kafka offers a good solution for datapersistence, fault tolerance and concurrent readings (high performance).
In this thesis we proposed, developed and evaluated an architecture designed for IoT applica-tions where a large number of devices, producing data and/or consuming it, may be connected.The proposed architecture is designed to run in a cluster fashion, where kubernetes and kafkabrokers are used to offer high degree of reliability and performance. Moreover, the architectureis supported by micro-services that offer capabilities to be easily scaled and updated. Thisstructure of micro-services is also important to add or remove data protocols that are used in thewhole system. As demonstrated in the experimental section, the architecture is able to deal withdifferent data protocols (e.g., MQTT, CoAP and REST), it is resilient, ensures data availability,is scalable and offer mechanisms to deal with faults (fault-tolerance mechanisms). In order tosimplify the use of the architecture, device and data management mechanisms were also includedin its design.
Accomplishments
Taking into account the final version of the architecture and the requirements specified forthis work, the major requirements were achieved. However, we do not deal with security aspects.This is an important requirement that should be addressed in the future work. In terms ofdata transmission, Robust connectivity was defined as requirement for this thesis. We do notaddress any issue related with data protocols, we just use them based on the default configurations.
Problems
The first problem that we found was related with the transport layer used by CoAP protocol.The CoAP protocol offers support to be used with UDP or TCP transport layer. However, in oursolution, due to the use of a basic load balancer (MetalLB), the architecture is limited to the useof TCP protocol.
The second problem that we found was related with kubernetes pods eviction. According tothe specification of kubernetes is should be done automatically. However, we noticed that this is
90

not true for our implementation, and we were forced to implement a solution to avoid this problemand redistribute the pods by other nodes automatically. A new process was needed to monitor thenodes and take care the needed actions.
Finally, testing conditions were not ideal. The experimental setup was composed byfour slave nodes with 2600 MB RAM, and therefore some experimental conditions were limitedto this setup, which may be insufficient to demonstrate all capabilities of the proposed architecture.
Future Work
As future work we would point some directions that we do not have time to explore:
• Evaluate the performance of the system when many data topics are used simultaneously;
• Develop a strategy to deal with UDP protocol, at the transport layer, when CoAP is used inthe system;
• Implementation of more micro-services to deal with other data communication protocols,such as AMQP or OPC-UA;
• Explore the possibility to integrate the LoRaWAN server inside the cluster;
• Study and implement mechanisms to automatically add or remove nodes from the cluster,in run-time, to avoid unnecessary resources when they are not needed, keeping the systemenergy efficient;
• Study and explore debugging tools and mechanisms to improve the system administration,allowing easy debugging and reconfiguration;
• Testing the whole architecture in a cluster environment with more resources and differentloads.
91 Jose Soares
Appendix A: Kubernetes Installation
To install a Kubernetes cluster some commands must be applied. These commands are appliedmanually or using scripts that were build to automate the installation.
The manual installation is presented below as a simple guide to help the user or ad-ministrator to replicate the work done in this thesis. In order to make it simple, a set ofscripts were created. One script creates and configures a master node and the other scriptallows to configure the slave nodes that will integrate the cluster. These scripts can befound in https://github.com/jsoares11/MasterThesisExperiences with the names ”kuber-netes installation master.sh” and ”kubernetes installation slave.sh”.
Installation and configuration based on scripts:
To install Kubernetes cluster through the scripts, firstly choose the node type (master or slave),download the corresponding file from the repository and give it permissions to run on the machine.The execution permissions can be changed through the terminal by using the following command:
Master node: $ sudo chmod +x kubernetes_installation_master.shSlave node: $ sudo chmod +x kubernetes_installation_slave.sh
After running the master script, a kubernetes cluster containing only the master node is createdand a token is generated as output (besides other information). This token must be saved becauseit will be used together with join function which allows slaves to join to the cluster.
In order to add nodes to the cluster, the script ”kubernetes installation slave.sh” must beexecuted in all slave nodes. This script receives as an argument the name of the slave node withinthe cluster (this will replace the hostname of the machine). The following commands are used toconfigure the master and slave nodes:
$ ./kubernetes_installation_master.sh$ ./kubernetes_installation_slave .sh slave1
When a slave wants to join to the cluster, it must run the join command where the argumentsmust be the ones retrieved by the execution of the ”kubernetes installation master.sh” script. Thejoin command must be similar to the following one, where ¡address:port¿, ¡token¿ and ¡generatedvalue¿ are filled with the information retrieved by the script.
$ kubeadm join <address:port> --token <token> --discovery-token-ca-cert-hashsha256:<generated value>
The kubernetes also includes a Dashboard. It is a feature that is not enabled by default.However, it can be turned on by following the manual installation (step 7), described next.
92

Installing Kubernetes manually:
Step 1: Docker Installation
The first tool needed to install Kubernetes is the Docker. Before installing Docker, an updatemust be done to keep the system updated in the last version and to avoid missing dependenciesthat might be needed later. After this, the Docker may be installed and enabled. This must bedone in all nodes that will be part of the cluster. The following commands are used to do theDocker installation:
$ sudo apt-get update$ sudo apt install docker.io$ sudo systemctl enable docker
In the process of software installation a ”Y/N” option might be shown, make sure to hit”Y” followed by ”Enter” to proceed with the installation. The command ”docker –version” canbe used to verify if the docker installation ran without any error. If the installation finishedsuccessfully, the docker version should be printed.
Step 2: Download Signing Key
After Docker installation, a signing key must be obtained, again for all the nodes. For this, thecurl command must be used, which is usually already installed in the Ubuntu 18.04 distribution.Otherwise, a previous installation of the curl command is necessary and only then the downloadof the key is possible:
$ sudo apt install curl$ curl -s https://packages.cloud.google.com/apt/doc/apt-key.gpg | sudo
apt-key add
Step 3: Download Kubernetes Repository
After getting the Kubernetes signing key on all the nodes, we need to add the Kubernetesrepository in our nodes and install the Kubeadm tool. This tool allows users to easily create asimple Kubernetes cluster and/or install other necessary tools. After installing kubeadm check theinstallation version to make sure that the installation was successful (optional). The followingcommands can be used to do that:
$ sudo apt-add-repository "deb http://apt.kubernetes.io/ kubernetes-xenialmain"
$ sudo apt install kubeadm$ sudo kubeadm version
Step 4: Disable Swapping
The swap memory should also be disabled on all the nodes because kubernetes doesn’t behaveproperly in systems with swap memory enabled. To enforce swap memory to be permanentlydisabled, the swapoff command must be used and a specific file must be edited (”/etc/fstab”, inUbuntu 18.04 distribution). In this file, the ”swap” field must be deleted or commented (last lineof the file). Otherwise swap memory will be enabled again after node restart.
$ sudo swapoff -a$ sudo nano /etc/fstab
Step 5: Changing hostnames
Suggestive hostnames should be given to all the nodes composing the cluster. On the masternode consider using, for example, ”master-node” and for the slaves ”slave-node-1, ”slave-node-2and so on for all the slave nodes in the system. The following commands are used to perform theseactions:
93 Jose Soares

$ sudo hostnamectl set-hostname master-node$ sudo hostnamectl set-hostname slave-node-1
Step 6: Run Kubernetes and Join slave nodes
The Kubernetes cluster may now be created in the master node. To do this, run the followingcommand on the master node:
$ sudo kubeadm init --pod-network-cidr=10.244.0.0/16
It is important to notice that kubernetes will trow some warnings related to the number ofCPUS, when trying to install Kubernetes on machines with less than two CPUs. It is possible toproceed the installation by ignoring the warnings, but this is not recommended since the systemwill crash by lack of resources when synchronization and node analysis are performed. To ignorethe warnings use the option -ignore-preflight-errors=NumCPU as shown below. To avoid thisproblem, it is recommended that the devices used in the Kubernetes cluster have, at least, twoCPUs.
sudo kubeadm init --pod-network-cidr=10.244.0.0/16 kubectl--ignore-preflight-errors=NumCPU
This command will output four other commands. The first three commands are used to create adirectory named ”.kube” where a configuration file, named ”config”, is created. The last commandin the output should be saved because it is going to be used to join slave nodes into the cluster.
$ mkdir -p ˜/.kube$ sudo cp -i /etc/kubernetes/admin.conf ˜/.kube/config$ sudo chown $(id -u):$(id -g) ˜/.kube/config$ kubeadm join <address:port> --token <token> --discovery-token-ca-cert-hash
sha256:<generated value>
Before executing the last command in all slave nodes, a pod network acting as an intermediatebetween the nodes and the network should be deployed. To do this, use the apply command:
$ sudo kubectl apply -f https://raw.githubusercontent.com/coreos/flannel/master/Documentation/kube-flannel.yml
After running the join command on all slave nodes, the created cluster can be verified in themaster node through the following command:
$ kubectl get nodes
Step 7(optional): Enabling Kubernetes Dashboard
It is possible to do everything on Kubernetes through the terminal, but there is also a Dashboardavailable to be used. The Dashboard allows to perform the same actions on the cluster as theterminal however in a more pleasant way.
The Dashboard isn’t enabled by default, to enable it, some steps are needed. First, the deploy-ment of the Dashboard must be done, to do that a YAML file available on the Kubernetes GitHub1 must be applied. After doing this, access to the Dashboard is possible, locally, but to sign-in atoken is needed.
The token is used by kubernetes to protect the access to the Dashboard. To get this token, aService Account must be created by applying another YAML file available on our GitHub repository2.
1https://kubernetes.io/docs/tasks/access-application-cluster/web-ui-dashboard/2https://github.com/jsoares11/MasterThesisExperiences/blob/main/k8s-dashboard-admin-user.yaml
94 Jose Soares

After applying it, the token will be created. To access the token the command kubectl must beused with the option describe to describe the admin-user and check the existing secrets.
After finding the secret, we are now able to use the describe option again and check whattoken it has. After accessing the token, it may be used in the dashboard to login. The code to allof these steps is described below:
Deploy the Dashboard:
$ kubectl apply -f https://raw.githubusercontent.com/kubernetes/dashboard/v2.0.1/aio/deploy/recommended.yaml
Run the Dashboard:
$ kubectl proxy
Access the Dashboard locally:
http://localhost:8001/api/v1/namespaces/kubernetes-dashboard/services/https:kubernetes-dashboard:/proxy/
Sign-in to the Dashboard:
Create Service Account
$ kubectl apply -f https://gist.githubusercontent.com/chukaofili/9e94d966e73566eba5abdca7ccb067e6/raw/0f17cd37d2932fb4c3a2e7f4434d08bc64432090/k8s-dashboard-admin-user.yaml
or
$ kubectl apply -f https://github.com/jsoares11/MasterThesisExperiences/blob/main/k8s-dashboard-admin-user.yaml}
Find the token:
$ kubectl get sa admin-user -n kube-system$ kubectl describe sa admin-user -n kube-system$ kubectl describe secret admin-user-token-<generatedValue> -n kube-system
95 Jose Soares

Bibliography
[1] Paul Adamczyk et al. “REST and Web Services: In Theory and in Practice”. In: REST:From Research to Practice (June 2011). doi: 10.1007/978-1-4419-8303-9_2.
[2] Chris Adams. Scalability Versus Elasticity: What’s the Difference, and Why Does It Mat-ter? url: https://www.parkplacetechnologies.com/knowledge-center/blog/data-center / scalability - versus - elasticity - whats - difference - matter/. (accessed:25.05.2020).
[3] SS Ahamed. “THE ROLE OF ZIGBEE TECHNOLOGY IN FUTURE DATA COMMU-NICATION SYSTEM.” In: Journal of Theoretical & Applied Information Technology 5.2(2009).
[4] Saad Albishi et al. “Challenges and Solutions for Applications and Technologies in theInternet of Things”. In: Procedia Computer Science 124 (2017), pp. 608–614.
[5] LoRa Alliance. “White paper: A technical overview of LoRa and LoRaWAN”. In: The LoRaAlliance: San Ramon, CA, USA (2015), pp. 7–11.
[6] Dave Anderson. METALLB. url: https : / / metallb . universe . tf/. (accessed:20.09.2020).
[7] Mehdi Anteur et al. “Ultra narrow band technique for low power wide area communications”.In: 2015 IEEE Global Communications Conference (GLOBECOM). IEEE. 2015, pp. 1–6.
[8] Joe Armstrong. “erlang”. In: Communications of the ACM 53.9 (2010), pp. 68–75.[9] Matthew Arrot et al. “AMQP, Advanced Message Queuing Protocol, Protocol Specifica-
tion”. In: JPMorgan Chase & Co., Cisco Systems, Inc, 2006.[10] GSM Association. Introduction to the GSMA IoT Security Guidelines and Assessment.
url: https://www.gsma.com/iot/introduction-gsma-iot-security-guidelines-assessment/. (accessed: 24.09.2020).
[11] GSM Association. Narrowband – Internet of Things (NB-IoT). url: https://www.gsma.com/iot/narrow-band-internet-of-things-nb-iot/. (accessed: 03.01.2020).
[12] Jonas Auer. “Distributed Data Store for Internet of Things Environments”. Bachelor’s The-sis.
[13] Aloys Augustin et al. “A study of LoRa: Long range & low power networks for the internetof things”. In: Sensors 16.9 (2016), p. 1466.
[14] The Kubernetes Authors. Concepts. url: https://kubernetes.io/docs/concepts/.(accessed: 14.05.2020).
[15] The Kubernetes Authors. Containers overview. url: https : / / kubernetes . io / docs /concepts/containers/overview/. (accessed: 27.05.2020).
[16] The Kubernetes Authors. Daemonset. url: https://kubernetes.io/docs/concepts/workloads/controllers/daemonset/. (accessed: 27.05.2020).
[17] The Kubernetes Authors. Deployments. url: https://kubernetes.io/docs/concepts/workloads/controllers/deployment/. (accessed: 27.05.2020).
[18] The Kubernetes Authors. Ingress. url: https : / / kubernetes . io / docs / concepts /services-networking/ingress/. (accessed: 29.05.2020).
[19] The Kubernetes Authors. Jobs. url: https : / / kubernetes . io / docs / concepts /workloads/controllers/jobs-run-to-completion/. (accessed: 29.05.2020).
96

[20] The Kubernetes Authors. Kube-apiserver. url: https : / / kubernetes . io / docs /reference/command-line-tools-reference/kube-apiserver/. (accessed: 27.05.2020).
[21] The Kubernetes Authors. Kube-controller-manager. url: https://kubernetes.io/docs/reference/command- line- tools- reference/kube- controller- manager/. (accessed:27.05.2020).
[22] The Kubernetes Authors. Kube-proxy. url: https://kubernetes.io/docs/reference/command-line-tools-reference/kube-proxy/. (accessed: 27.05.2020).
[23] The Kubernetes Authors. Kube-Scheduler. url: https : / / kubernetes . io / docs /reference/command-line-tools-reference/kube-scheduler/. (accessed: 26.05.2020).
[24] The Kubernetes Authors. Kubelet. url: https : / / kubernetes . io / docs / reference /command-line-tools-reference/kubelet/. (accessed: 26.05.2020).
[25] The Kubernetes Authors. Kubernetes Components. url: https://kubernetes.io/docs/concepts/overview/components/. (accessed: 26.05.2020).
[26] The Kubernetes Authors. Kubernetes Pod Overview. url: https://kubernetes.io/docs/concepts/workloads/pods/pod-overview/. (accessed: 26.05.2020).
[27] The Kubernetes Authors. Learn Kubernetes Basics. url: https://kubernetes.io/docs/tutorials/kubernetes-basics/. (accessed: 29.04.2020).
[28] The Kubernetes Authors. Namespaces. url: https://kubernetes.io/docs/concepts/overview/working-with-objects/namespaces/. (accessed: 27.05.2020).
[29] The Kubernetes Authors. Persistent Volumes. url: https : / / kubernetes . io / docs /concepts/storage/persistent-volumes/. (accessed: 24.09.2020).
[30] The Kubernetes Authors. Replicaset. url: https://kubernetes.io/docs/concepts/workloads/controllers/replicaset/. (accessed: 27.05.2020).
[31] The Kubernetes Authors. Service. url: https : / / kubernetes . io / docs / concepts /services-networking/service/. (accessed: 30.04.2020).
[32] The Kubernetes Authors. Statefulset. url: https://kubernetes.io/docs/concepts/workloads/controllers/statefulset/. (accessed: 27.05.2020).
[33] The Kubernetes Authors. Volumes. url: https : / / kubernetes . io / docs / concepts /storage/volumes/. (accessed: 27.05.2020).
[34] The Kubernetes Authors. What is Kubernetes? url: https://kubernetes.io/docs/concepts/overview/what-is-kubernetes/. (accessed: 25.05.2020).
[35] The open62541 authors. open62541 Documentation. (accessed: 4.12.2019).[36] Gaurav Awasthi. The Five Essential IoT Requirements and How to Achieve Them. Cog-
nizant Connected Products, 2019.[37] Microsoft Azure. What are public, private, and hybrid clouds? url: https : / / azure .
microsoft.com/en-us/overview/what-are-private-public-hybrid-clouds/. (ac-cessed: 23.05.2020).
[38] A Banks et al. MQTT Version 5.0: OASIS Standard. 2019.[39] Rui Miguel Ribeiro Barbosa. “Sistema de monitorizacao de consumo de agua utilizando
tecnologia Sigfox”. In: (2017).[40] Olaf Bergmann. C-Implementation of CoAP. url: https : / / libcoap . net/. (accessed:
11.12.2019).[41] Pravin Bhagwat. “Bluetooth: technology for short-range wireless apps”. In: IEEE Internet
Computing 5.3 (2001), pp. 96–103.[42] Bjorn A Bjerke. “LTE-advanced and the evolution of LTE deployments”. In: IEEE Wireless
Communications 18.5 (2011), pp. 4–5.[43] Carsten Bormann. Implementations. url: https://coap.technology/impls.html. (ac-
cessed: 10.12.2019).[44] Jonathan de Carvalho Silva et al. “LoRaWAN—A low power WAN protocol for Internet of
Things: A review and opportunities”. In: 2017 2nd International Multidisciplinary Confer-ence on Computer and Energy Science (SpliTech). IEEE. 2017, pp. 1–6.
97 Jose Soares

[45] Jose Cecılio et al. “Experimental Evaluation of LoRa Network Reliability over Water Sur-faces”. In: (2019).
[46] Confluent. Internet of Things (IoT) and Event Streaming at Scale with Apache Kafkaand MQTT. url: https : / / www . confluent . io / blog / iot - with - kafka -connect - mqtt - and - rest - proxy / ?fbclid = IwAR35FDxWmp6q6y7zd1716VPSsn0LocCc _MDhFUqIPTDvoElsD5pNtV6hBYQ. (accessed: 16.05.2020).
[47] P. Costa et al. “The RUNES middleware: a reconfigurable component-based approach tonetworked embedded systems”. In: 2005 IEEE 16th International Symposium on Personal,Indoor and Mobile Radio Communications. Vol. 2. Sept. 2005, 806–810 Vol. 2. doi: 10.1109/PIMRC.2005.1651554.
[48] Michelle Cotton et al. “Internet Assigned Numbers Authority (IANA) Procedures for theManagement of the Service Name and Transport Protocol Port Number Registry.” In: RFC6335 (2011), pp. 1–33.
[49] McGrew D. and D. Bailey. “AES-CCM Cipher Suites for Transport Layer Security (TLS)”.In: RFC 5246 (2008).
[50] Dialogic. E-UTRAN. url: https://www.dialogic.com/glossary/e-utran-. (accessed:30.09.2020).
[51] Jasenka Dizdarevic et al. “A Survey of Communication Protocols for Internet of Things andRelated Challenges of Fog and Cloud Computing Integration”. In: (Jan. 2019).
[52] Adam Fendelman. What Is GSM in Cellular Networking? url: https://www.lifewire.com/definition-of-gsm-578670. (accessed: 14.12.2019).
[53] Stefan Ferber. Ten challenges the international IoT community needs to master(1/2). url: https : / / blog . bosch - si . com / internetofthings / ten -challenges - the - international - iot - community - needs - to - master - 12 /?fbclid = IwAR0XkCQ2MiJ9RiDUmQoIup2jaYJNP6o _ vDNYmFw4mtt5qzKmX46h6nRJyCU. (ac-cessed: 16.05.2020).
[54] Joel L Fernandes et al. “Performance evaluation of RESTful web services and AMQP proto-col”. In: 2013 Fifth International Conference on Ubiquitous and Future Networks (ICUFN).IEEE. 2013, pp. 810–815.
[55] Erina Ferro and Francesco Potorti. “Bluetooth and Wi-Fi wireless protocols: a survey anda comparison”. In: IEEE Wireless Communications 12.1 (2005), pp. 12–26.
[56] Apache Software Foundation. Complex Event Processing. url: https://databricks.com/glossary/complex-event-processing. (accessed: 30.09.2020).
[57] Eclipse Foundation. Eclipse Mosquitto™ An open source MQTT broker. url: https://mosquitto.org/. (accessed: 7.12.2019).
[58] OPC Foundation. OPC UA Online Reference. url: https://reference.opcfoundation.org/v104/Core/docs/Part6/7.1.2/. (accessed: 4.12.2019).
[59] OPC Foundation. Unified Architecture. url: https://opcfoundation.org/about/opc-technologies/opc-ua/. (accessed: 29.11.2019).
[60] OPC Foundation. What is OPC? url: https://opcfoundation.org/about/what-is-opc/. (accessed: 29.11.2019).
[61] The Apache Softare Foundation. ZooKeeper Recipes and Solutions. url: https : / /zookeeper.apache.org/doc/r3.6.1/recipes.html. (accessed: 29.05.2020).
[62] 3GPP MCC Frederic Firmin. The Evolved Packet Core. url: https : / / www . 3gpp .org/technologies/keywords- acronyms/100- the- evolved- packet- core. (accessed:30.09.2020).
[63] Ala Al-Fuqaha et al. “Internet of Things: A Survey on Enabling Technologies, Protocols,and Applications”. In: (2015).
[64] G.Tanganelli, C. Vallati, and E.Mingozzi. “CoAPthon: Easy Development of CoAP-basedIoT Applications with Python”. In: (2015).
[65] David Gay et al. “The nesC Language: A Holistic Approach to Networked Embedded Sys-tems”. In: SIGPLAN Not. 49.4 (July 2014), pp. 41–51. issn: 0362-1340. doi: 10.1145/2641638.2641652. url: http://doi.acm.org/10.1145/2641638.2641652.
98 Jose Soares
[66] GeeksforGeeks. Challenges in World Of IoT. url: https://www.geeksforgeeks.org/challenges-in-world-of-iot/?fbclid=IwAR3YR88X-xYHCc6sxDkHwPR6sPZJ0v0Yp4l7_RsoP2pC1u_4pI2cq8bYbiM. (accessed: 16.05.2020).
[67] GeeksforGeeks. free Command in Linux with examples. url: https://www.geeksforgeeks.org/free-command-linux-examples/. (accessed: 1.10.2020).
[68] Amitava Ghosh et al. “LTE-advanced: next-generation wireless broadband technology”. In:IEEE wireless communications 17.3 (2010), pp. 10–22.
[69] Shariq Haseeb et al. “Connectivity, interoperability and manageability challenges in inter-net of things”. In: AIP Conference Proceedings. Vol. 1883. 1. AIP Publishing LLC. 2017,p. 020004.
[70] Danny Hughes et al. “LooCI: a loosely-coupled component infrastructure for networkedembedded systems”. In: Proceedings of the 7th International Conference on Advances inMobile Computing and Multimedia. ACM. 2009, pp. 195–203.
[71] Augustine Ikpehai et al. “Low-power wide area network technologies for Internet-of-things:A comparative review”. In: IEEE Internet of Things Journal 6.2 (2018), pp. 2225–2240.
[72] Digi International Inc. About the Industrial IoT: Definition, Use Cases and ApplicationExamples. url: https://www.digi.com/blog/post/about- the- industrial- iot-definition-use-cases-and. (accessed: 18.05.2020).
[73] Docker Inc. Docker Hub Quickstart. url: https : / / docs . docker . com / docker - hub/.(accessed: 26.09.2020).
[74] Docker Inc. What is a Container? url: https://www.docker.com/resources/what-container. (accessed: 26.05.2020).
[75] SM Riazul Islam, M Nazim Uddin, and Kyung Sup Kwak. “The IoT: Exciting possibilitiesfor bettering lives: Special application scenarios”. In: IEEE Consumer Electronics Magazine5.2 (2016), pp. 49–57.
[76] Nick Ismail. IoT in the enterprise: Requirements, challenges and predictions. url: https://www.information-age.com/iot-enterprise-challenges-predictions-123469561/.(accessed: 20.05.2020).
[77] Asad Javed et al. “CEFIoT: a fault-tolerant IoT architecture for edge and cloud”. In: 2018IEEE 4th world forum on internet of things (WF-IoT). IEEE. 2018, pp. 813–818.
[78] Container Journal. 5 Container Alternatives to Docker. url: https://containerjournal.com/topics/container- ecosystems/5- container- alternatives- to- docker/. (ac-cessed: 19.09.2020).
[79] Luc Juggery. A Closer Look at Etcd: The Brain of a Kubernetes Cluster. url: https://medium.com/better- programming/a- closer- look- at- etcd- the- brain- of- a-kubernetes-cluster-788c8ea759a5. (accessed: 20.09.2020).
[80] Michael Kerrisk. free(1) — Linux manual page. url: https://man7.org/linux/man-pages/man1/free.1.html. (accessed: 2.10.2020).
[81] Jaehyu Kim and JooSeok Song. “A dual key-based activation scheme for secure LoRaWAN”.In: Wireless Communications and Mobile Computing 2017 (2017).
[82] Joonsuk Kim and Inkyu Lee. “802.11 WLAN: history and new enabling MIMO techniquesfor next generation standards”. In: IEEE Communications Magazine 53.3 (2015), pp. 134–140.
[83] Patrick Kinney et al. “Zigbee technology: Wireless control that simply works”. In: Commu-nications design conference. Vol. 2. 2003, pp. 1–7.
[84] Evgenii Kosenko. “Industrial IoT development for condition monitoring purposes”. In:(2018).
[85] Jay Kreps, Neha Narkhede, Jun Rao, et al. “Complex event processing for integration ofInternet of Things devices”. Bachelor’s Thesis.
[86] Mads Lauridsen et al. “From LTE to 5G for Connected Mobility.” In: IEEE CommunicationsMagazine 55.3 (2017), pp. 156–162.
99 Jose Soares

[87] Stefan-Helmut Leitner and Wolfgang Mahnke. “OPC UA–service-oriented architecture forindustrial applications”. In: ABB Corporate Research Center 48 (2006), pp. 61–66.
[88] P. Levis et al. “TinyOS: An Operating System for Sensor Networks”. In: Ambient Intelli-gence. Ed. by Werner Weber, Jan M. Rabaey, and Emile Aarts. Berlin, Heidelberg: SpringerBerlin Heidelberg, 2005, pp. 115–148. isbn: 978-3-540-27139-0. doi: 10 . 1007 / 3 - 540 -27139-2_7. url: https://doi.org/10.1007/3-540-27139-2_7.
[89] Roger Light. Eclipse Mosquitto - An open source MQTT broker. url: https://github.com/eclipse/mosquitto. (accessed: 11.12.2019).
[90] Roger Light. pika 1.1.0. url: https://pypi.org/project/pika/. (accessed: 9.12.2019).[91] Wolfgang Mahnke, Stefan-Helmut Leitner, and Matthias Damm. OPC unified architecture.
Springer Science & Business Media, 2009.[92] Srijan Manandhar. “MQTT based communication in IoT”. MA thesis. Tampere University
of Technology, 2017.[93] Borja Martinez et al. “Exploring the performance boundaries of NB-IoT”. In: IEEE Internet
of Things Journal 6.3 (2019), pp. 5702–5712.[94] Kais Mekki et al. “A comparative study of LPWAN technologies for large-scale IoT deploy-
ment”. In: ICT express 5.1 (2019), pp. 1–7.[95] Microsoft. [MS-DCOM]: Distributed Component Object Model (DCOM) Remote Protocol.
url: https : / / docs . microsoft . com / en - us / openspecs / windows _ protocols / ms -dcom/4a893f3d-bd29-48cd-9f43-d9777a4415b0. (accessed: 2.12.2019).
[96] Microsoft. Component Object Model (COM). url: https://docs.microsoft.com/en-us/windows/win32/com/component-object-model--com--portal. (accessed: 2.12.2019).
[97] Chetan Mishra. A brief guide to priority and nice values in the linux ecosystem. url: https://medium.com/@chetaniam/a-brief-guide-to-priority-and-nice-values-in-the-linux-ecosystem-fb39e49815e0. (accessed: 1.10.2020).
[98] The Things Network. Session Keys. url: https://www.thethingsnetwork.org/docs/lorawan/security.html. (accessed: 11.12.2019).
[99] Yoav Nir and Adam Langley. “ChaCha20 and Poly1305 for IETF Protocols”. In: RFC 7539(Informational), Internet Engineering Task Force (2015).
[100] Bob O’Hara and Al Petrick. IEEE 802.11 handbook: a designer’s companion. IEEE Stan-dards Association, 2005.
[101] OASIS. Summary of new features in MQTT v5.0 (non-normative). url: https://docs.oasis-open.org/mqtt/mqtt/v5.0/os/mqtt-v5.0-os.pdf#page=136&zoom=100,0,96.(accessed: 6.12.2019).
[102] Eldad Perahia and Michelle X Gong. “Gigabit wireless LANs: an overview of IEEE 802.11ac and 802.11 ad”. In: ACM SIGMOBILE Mobile Computing and Communications Review15.3 (2011), pp. 23–33.
[103] Andrew Pruski. Adjusting pod eviction time in Kubernetes. url: https://dbafromthecold.com / 2020 / 04 / 08 / adjusting - pod - eviction - time - in - kubernetes/. (accessed:30.09.2020).
[104] Gowri S. R., Kwame-Lante W., and Bhaskar K. “A Distributed Publish-Subscribe Brokerwith Blockchain-based Immutability”. In: (2018).
[105] R. A. Rahman and B. Shah. “Security analysis of IoT protocols: A focus in CoAP”. In:2016 3rd MEC International Conference on Big Data and Smart City (ICBDSC). Mar.2016, pp. 1–7. doi: 10.1109/ICBDSC.2016.7460363.
[106] Usman Raza, Parag Kulkarni, and Mahesh Sooriyabandara. “Low power wide area networks:An overview”. In: IEEE Communications Surveys & Tutorials 19.2 (2017), pp. 855–873.
[107] Siegmund Redl, Matthias Weber, and Malcolm Oliphant. GSM and personal communica-tions handbook. Artech House, Inc., 1998.
[108] Brecht Reynders and Sofie Pollin. “Chirp spread spectrum as a modulation technique forlong range communication”. In: 2016 Symposium on Communications and Vehicular Tech-nologies (SCVT). IEEE. 2016, pp. 1–5.
100 Jose Soares

[109] J.J. Schutte. “Design of a development platform to monitor and manage Low Power, WideArea WSNs”. Master’s Thesis. University of Twente, 2019.
[110] Scratch. Iot A Uni. url: https://scratch-itea3.eu/sota/iot_a_uni/list?orderby=req_type&ordertype=ASC. (accessed: 21.05.2020).
[111] TechTarget SearchSecurity. timing attack. url: https://searchsecurity.techtarget.com/definition/timing-attack. (accessed: 07.12.2019).
[112] Keith Shaw. 802.11: Wi-Fi standards and speeds explained. url: https : / / www .networkworld . com / article / 3238664 / 80211 - wi - fi - standards - and - speeds -explained.html. (accessed: 27.12.2019).
[113] Zach Shelby et al. “RFC 7252: The constrained application protocol (CoAP)”. In: InternetEngineering Task Force (2014).
[114] Z Shelby et al. “Constrained application protocol (coap), draft-ietf-core-coap-13”. In: Or-lando: The Internet Engineering Task Force–IETF (2012).
[115] Pivotal Software. Understanding RabbitMQ. url: https://www.rabbitmq.com/. (accessed:14.12.2019).
[116] Kevin Sookocheff. Kafka in a Nutshell. url: https://sookocheff.com/post/kafka/kafka-in-a-nutshell/. (accessed: 4.10.2020).
[117] OASIS Standard. “Oasis advanced message queuing protocol (amqp) version 1.0”. In: In-ternational Journal of Aerospace Engineering Hindawi www. hindawi. com 2018 (2012).
[118] Dierks T. and E. Rescorla. “The Transport Layer Security (TLS) Protocol Version 1.2”. In:RFC 6655 (2012).
[119] The HiveMQ Team. Quality of Service 0,1 & 2 - MQTT Essentials: Part 6. Online. 2019.url: https://www.hivemq.com/blog/mqtt-essentials-part-6-mqtt-quality-of-service-levels/.
[120] Phillip Tracy. The top 5 industrial IoT use cases. url: https : / / www . ibm .com / blogs / internet - of - things / top - 5 - industrial - iot - use - cases /?fbclid = IwAR1n90JBVo64R56UbWZzmN0UWUt9h6mg1SAg6UkAkgCQBEv7ljUgqXuVWnM. (ac-cessed: 17.05.2020).
[121] Team Tweaks. Consumer IoT vs. Industrial IoT – What are the Differences? url: https://www.teamtweaks.com/blog/consumer- iot- vs- industrial- iot- what- are- the-differences. (accessed: 17.05.2020).
[122] Nadeem Unuth. WiFi Explained: The Most Common Wireless LAN Network. url: https://www.lifewire.com/wifi-explained-3426413. (accessed: 14.12.2019).
[123] S. Vinoski. “Advanced Message Queuing Protocol”. In: IEEE Internet Computing 10.06(Nov. 2006), pp. 87–89. issn: 1941-0131. doi: 10.1109/MIC.2006.116.
[124] environment & expert systems WAVES - Wireless Acoustics. Wireless Body Area Networks(WBAN). url: https://www.waves.intec.ugent.be/research/wireless-body-area-networks. (accessed: 20.05.2020).
[125] Chris Woodford. Bluetooth. url: https : / / www . explainthatstuff . com /howbluetoothworks.html. (accessed: 14.12.2019).
[126] Muneer Bani Yassein, Mohammed Q Shatnawi, et al. “Application layer protocols for theInternet of Things: A survey”. In: 2016 International Conference on Engineering & MIS(ICEMIS). IEEE. 2016, pp. 1–4.
101 Jose Soares