FAUJI · We have reviewed the accompanying condensed interim balance sheet of Fauji Fertilizer...
36
Transcript of FAUJI · We have reviewed the accompanying condensed interim balance sheet of Fauji Fertilizer...

FAUJI


Company Information
BOARD OF DIRECTORS Lt Gen Khalid Nawaz Khan, HI(M), Sitara-i-Esar, (Retd)ChairmanLt Gen Shafqaat Ahmed, HI(M) (Retd)Chief Executive & Managing DirectorMr Qaiser Javed Dr Nadeem InayatEngr Rukhsana ZuberiMr Farhad Shaikh MohammadMaj Gen Muhammad Farooq Iqbal, HI(M) (Retd)Brig Dr. Gulfam Alam, SI(M) (Retd)Mr Shahid Ghaffar Ms Nargis Ghaloo Maj Gen Mumtaz Ahmad Bajwa, HI(M) (Retd)Mr Muhammad Arif AzimMr Per Kristian Bakkerud
CHIEF FINANCIAL OFFICER Syed Shahid Hussain Tel No.92-51-8456101, Fax No. 92-51-8459961 E-mail: [email protected]
COMPANY SECRETARY Brig Sher Shah, SI(M) (Retd)Tel No. 92-51-8453101, Fax No. 92-51-8459931E-mail: [email protected]
REGISTERED OFFICE 156 The Mall, Rawalpindi Cantt, PakistanWebsite: www.ffc.com.pkTel No. 92-51-111-332-111, 8450001, Fax No. 92-51-8459925E-mail: [email protected]
PLANTSITES Goth Machhi, Sadiqabad(Distt: Rahim Yar Khan), PakistanTel No. 92-68-5786420-9, Fax No. 92-68-5786401Mirpur Mathelo(Distt: Ghotki), PakistanTel No. 92-723-661500-09Fax No. 92-723-661462
MARKETING DIVISION Lahore Trade Centre, 11 Shahrah-e-Aiwan-e-Tijarat, Lahore, PakistanTel No. 92-42-36369137-40, Fax No. 92-42-36366324
KARACHI OFFICE B-35, KDA Scheme No.1, Karachi, PakistanTel No. 92-21-34390115-16, Fax No. 92-21-34390117 & 34390122
AUDITORS KPMG Taseer Hadi & CoChartered Accountants6th Floor, State Life Building, Jinnah Avenue, Islamabad, Pakistan Tel No. 92-51-2823558, Fax No. 92-51-2822671
SHARES REGISTRAR THK Associates (Pvt) LimitedGround Floor, State Life Building – 3, Dr. Ziauddin Ahmed Road Karachi – 75530, Pakistan. Tel No. 92-21-111-000-322, Fax No. 92-21-35655595

Half Yearly Financial Statements 2015
Directors’ Review For the Half Year ended June 30, 2015
Dear Members,
On behalf of the Board of Directors, I am pleased to report net earnings of Rs. 8.27 billion for the half year ended June 30, 2015, translating into per share earnings of Rs. 6.50.
Sona urea production of 1,188 thousand tonnes during the six months was higher by 1% compared to last year despite major planned turnaround at Plant II Goth Machhi, due to improved operating efficiency, whereas Sona urea sales were recorded at 1,219 thousand tonnes, 4% above last year.
Two new benchmarks were created during the period in terms of highest ever sales revenue with turnover of Rs. 39.19 billion (9% above last year) and record investment income of Rs. 1.25 billion, almost twice the earnings for 2014, owing to effective treasury management.
Despite above achievements, profitability for the period recorded a marginal improvement of Rs. 105 million only, over the last year, mainly due to suppressed urea prices and levy of 3% Super Tax on last year’s earnings, besides incidence of higher tax on dividend income.
In view of sustained earnings, the Board is pleased to announce second interim dividend of 17.50 % (Rs. 1.75 per share), for the period.
Looking ahead, Company margins are forecast to remain suppressed due to anticipated increase in cost of gas, higher financial charges and reduction of investment income owing to increased borrowings, besides liquidation of investments, for payment of around Rs. 33 billion on account of GIDC during the period. In order to remain competitive and improve the profitability of the Company, installation of a Coal Fired Boiler at Goth Machhi is being planned to enhance the Urea production capacity, through conservation of gas, currently being used for power generation, which is expected to come online by early 2018.
The Company remains focused on cost economization, and enhancement of production efficiencies to remain competitive and the matter for reallocation of 34 MMSCFD curtailed gas, which was earlier diverted temporarily to the power sector, is actively being pursued with the Government, to increase productivity and keep the shareholders’ earnings at an acceptable level in the long run.
On behalf of the Board,
RawalpindiJuly 30, 2015
ChairmanLt Gen Khalid Nawaz Khan
HI (M), (Retired)

AUDITOR’S REPORT TO THE MEMBERS ON REVIEW OF INTERIM FINANCIAL INFORMATION
INTRODUCTION
We have reviewed the accompanying condensed interim balance sheet of Fauji Fertilizer Company Limited (“the Company”) as at 30 June 2015 and the related condensed interim profit and loss account, condensed interim statement of comprehensive income, condensed interim cash flow statement, condensed interim statement of changes in equity and notes to the accounts for the six month period then ended (here-in-after referred as the “interim financial information”). Management is responsible for the preparation and presentation of this interim financial information in accordance with approved accounting standards as applicable in Pakistan for the interim financial reporting. Our responsibility is to express a conclusion on this interim financial information based on our review.
SCOPE OF REVIEW
We conducted our review in accordance with International Standards on Review Engagement 2410, “Review of Interim Financial Information Performed by the Independent Auditor of the Entity.” A review of interim financial information consists of making inquiries, primarily of persons responsible for financial and accounting matters, and applying analytical and other review procedures. A review is substantially less in scope than an audit conducted in accordance with International Standards on Auditing and consequently does not enable us to obtain assurance that we would become aware of all significant matters that might be identified in an audit. Accordingly, we do not express an audit opinion.
CONCLUSION
Based on our review, nothing has come to our attention that causes us to believe that the accompanying interim financial information in not prepared, in all material respects in accordance with approved accounting standards as applicable in Pakistan for interim financial reporting.
OTHER MATTERS
The figures for the three months’ period ended 30 June 2015 and 30 June 2014, in condensed interim profit and loss account and condensed interim statement of comprehensive income have not been reviewed and we do not express a conclusion on them.
The condensed interim financial information and financial statements of the Company for the six months’ period ended 30 June 2014 and year ended 31 December 2014 were reviewed and audited by another auditor whose reports dated 24 July 2014 and 30 January 2015 respectively, expressed an unqualified conclusion and opinion thereon.
IslamabadDate: 30 July 2015
KPMG Taseer Hadi & Co.Chartered AccountantsSyed Bakhtiyar Kazmi


Condensed Interim Financial Information

Half Yearly Financial Statements 2015
Condensed Interim Balance Sheet As at June 30, 2015
Note
Un-auditedJune 30,
2015
AuditedDecember 31,
2014(Rupees ‘000)
EQUITY AND LIABILITIES
EQUITYShare capital 4 12,722,382 12,722,382 Capital reserves 160,000 160,000 Revenue reserves 5 11,283,944 12,483,585 Surplus on remeasurement of investments available for sale to fair value - net 789,730 303,564
24,956,056 25,669,531
NON - CURRENT LIABILITIESLong term borrowings 6 14,739,375 2,500,000 Deferred liabilities 4,269,883 4,574,028
19,009, 258 7,074,028 CURRENT LIABILITIES
Trade and other payables 7 13,745,468 37,904,434 Interest and mark - up accrued 115,045 30,117 Short term borrowings 8 9,197,204 11,602,443 Current portion of long term borrowings 2,975,625 1,780,000 Taxation 2,152,895 2,501,109
28,186,237 53,818,103
72,151,551 86,561,662CONTINGENCIES AND COMMITMENTS 9
The annexed notes 1 to 18 form an integral part of this condensed interim financial information.

Note
Un-auditedJune 30,
2015
AuditedDecember 31,
2014(Rupees ‘000)
ASSETS
NON - CURRENT ASSETSProperty, plant and equipment 10 21,278,209 20,093,898 Intangible assets 1,573,146 1,611,204 Long term investments 11 28,749,908 28,134,520 Long term loans and advances 921,742 823,188 Long term deposits and prepayments 14,470 15,624
52,537,475 50,678,434
CURRENT ASSETSStores, spares and loose tools 3,213,426 3,314,823 Stock in trade 1,022,234 981,750 Trade debts 1,871,855 822,460 Loans and advances 1,355,390 1,058,754 Deposits and prepayments 681,264 26,376 Other receivables 1,056,744 1,072,461 Short term investments 12 8,282,312 27,432,837 Cash and bank balances 2,130,851 1,173,767
19,614,076 35,883,228
72,151,551 86,561,662
Chief ExecutiveChairman Director
Half Yearly Financial Statements 2015
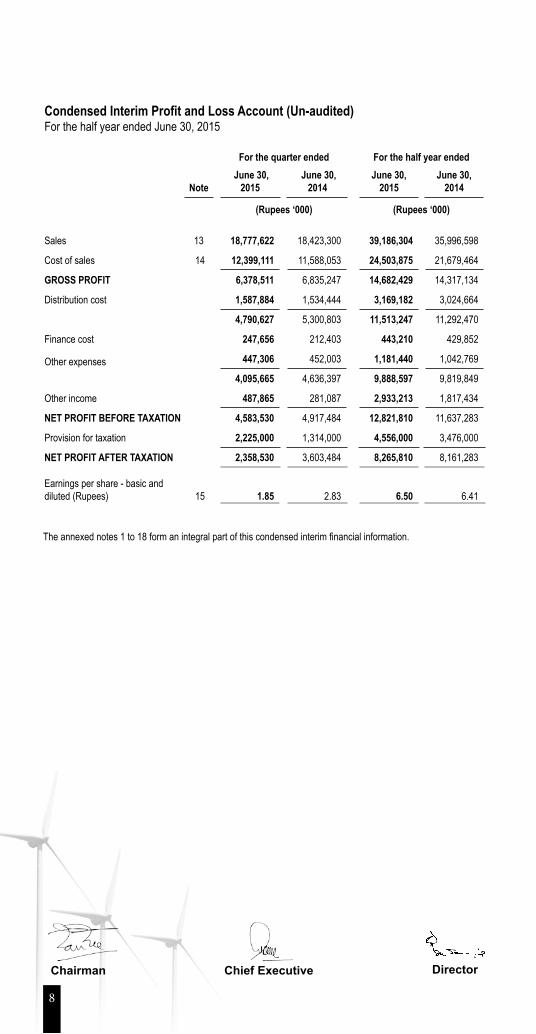
Condensed Interim Profit and Loss Account (Un-audited)For the half year ended June 30, 2015
For the quarter ended For the half year ended
Note June 30,
2015 June 30,
2014June 30,
2015June 30,
2014
(Rupees ‘000) (Rupees ‘000)
Sales 13 18,777,622 18,423,300 39,186,304 35,996,598
Cost of sales 14 12,399,111 11,588,053 24,503,875 21,679,464
GROSS PROFIT 6,378,511 6,835,247 14,682,429 14,317,134
Distribution cost 1,587,884 1,534,444 3,169,182 3,024,664
4,790,627 5,300,803 11,513,247 11,292,470
Finance cost 247,656 212,403 443,210 429,852
Other expenses 447,306 452,003 1,181,440 1,042,769
4,095,665 4,636,397 9,888,597 9,819,849
Other income 487,865 281,087 2,933,213 1,817,434
NET PROFIT BEFORE TAXATION 4,583,530 4,917,484 12,821,810 11,637,283
Provision for taxation 2,225,000 1,314,000 4,556,000 3,476,000
NET PROFIT AFTER TAXATION 2,358,530 3,603,484 8,265,810 8,161,283
Earnings per share - basic and diluted (Rupees) 15 1.85 2.83 6.50 6.41
The annexed notes 1 to 18 form an integral part of this condensed interim financial information.
Chief ExecutiveChairman Director

Condensed Interim Statement of Comprehensive Income (Un-audited)For the half year ended June 30, 2015
For the quarter ended For the half year endedJune 30, June 30, June 30, June 30,
2015 2014 2015 2014(Rupees ‘000) (Rupees ‘000)
Net profit after taxation 2,358,530 3,603,484 8,265,810 8,161,283
Other comprehensive income for the period
Items that may be subsequently reclassified to profit or lossSurplus on remeasurement of investments available for sale to fair value - net 322,203 (2,810) 486,166 775
Total comprehensive income for the period 2,680,733 3,600,674 8,751,976 8,162,058
The annexed notes 1 to 18 form an integral part of this condensed interim financial information.
Chief ExecutiveChairman Director

Half Yearly Financial Statements 2015
Condensed Interim Cash Flow Statement (Un-audited)For the half year ended June 30, 2015
Note June 30,
2015June 30,
2014
(Rupees ‘000) CASH FLOWS FROM OPERATING ACTIVITIES
Cash (used in) / generated from operations 16 (14,324,619) 15,260,105 Finance cost paid (358,282) (338,732)Income tax paid (5,386,656) (4,518,698)Net cash (used in ) / generated from operating activities (20,069,557) 10,402,675
CASH FLOWS FROM INVESTING ACTIVITIESFixed capital expenditure (2,163,598) (1,790,405)Proceeds from sale of property, plant and equipment 10,998 13,986 Investments - net 1,408,388 (1,441,686)Interest received 1,168,167 735,281 Dividends received 1,685,775 1,139,587 Net cash generated from / (used in ) investing activities 2,109,730 (1,343,237)
CASH FLOWS FROM FINANCING ACTIVITIESLong term financing - Disbursements 14,352,500 -
- Repayments (917,500) (730,000)Dividends paid (9,754,875) (8,908,658)Net cash generated from / (used in) financing activities 3,680,125 (9,638,658)Net decrease in cash and cash equivalents (14,279,702) (579,220)Cash and cash equivalents at beginning of the period 15,281,142 13,012,602 Effect of exchange rate changes 16,451 (65,825)Cash and cash equivalents at end of the period 1,017,891 12,367,557
CASH AND CASH EQUIVALENTSCash and bank balances 2,130,851 1,823,986 Short term highly liquid investments 8,084,244 17,270,279 Short term running finance (9,197,204) (6,726,708)
1,017,891 12,367,557
The annexed notes 1 to 18 form an integral part of this condensed interim financial information.
Chief ExecutiveChairman Director

Condensed Interim Statement of Changes In Equity (Un-audited)For the half year ended June 30, 2015
Share capital
Capital reserves
Revenue reserves Surplus onremeasurement of available for saleinvestments to
fair value
TotalGeneral reserve
Unappropriated profit
(Rupees ‘000)
Balance as at January 1, 2014 12,722,382 160,000 6,802,360 5,456,013 10,508 25,151,263
Total comprehensive income for the period
Profit after taxation - - - 8,161,283 - 8,161,283
Other comprehensive income - net of tax - - - - 775 775
Total comprehensive income for the period - net of tax - - - 8,161,283 775 8,162,058
Distribution to owners - recorded directly in equity
Final dividend 2013: Rs 4.00 per share - - - (5,088,952) - (5,088,952)
First interim dividend 2014: Rs 3.00 per share - - - (3,816,714) - (3,816,714)
- - - (8,905,666) - (8,905,666)
Balance as at June 30, 2014 12,722,382 160,000 6,802,360 4,711,630 11,283 24,407,655
Balance as at January 1, 2015 12,722,382 160,000 6,802,360 5,681,225 303,564 25,669,531
Total comprehensive income for the period
Profit after taxation - - - 8,265,810 - 8,265,810
Other comprehensive income - net of tax - - - - 486,166 486,166
Total comprehensive income for the period - net of tax - - - 8,265,810 486,166 8,751,976
Distribution to owners - recorded directly in equity
Final dividend 2014: Rs 3.50 per share - - - (4,452,833) - (4,452,833)
First interim dividend 2015: Rs 3.94 per share - - - (5,012,618) - (5,012,618)
- - - (9,465,451) - (9,465,451)
Balance as at June 30, 2015 12,722,382 160,000 6,802,360 4,481,584 789,730 24,956,056
The annexed notes 1 to 18 form an integral part of this condensed interim financial information.
Chief ExecutiveChairman Director

Half Yearly Financial Statements 2015
Notes To The Condensed Interim Financial Information (Un-audited)For the half year ended June 30, 2015
1. Fauji Fertilizer Company Limited (the Company) is a public company incorporated in Pakistan under the Companies Act, 1913, (now the Companies Ordinance, 1984) and its shares are quoted on the Karachi, Lahore and Islamabad stock exchanges of Pakistan. The registered office of the Company is situated at 156 - The Mall, Rawalpindi, Pakistan. The Company is domiciled in Rawalpindi. The principal activity of the Company is manufacturing, purchasing and marketing of fertilizers and chemicals, including investment in other fertilizer, chemical, other manufacturing, energy generation and banking operations.
2. This condensed interim financial information of the Company for the half year ended June 30, 2015 has been prepared in accordance with the requirements of International Accounting Standard 34 - “Interim Financial Reporting” and provisions of and directives issued under the Companies Ordinance, 1984. In case where requirements differ, the provisions of or directives issued under the Companies Ordinance, 1984 have been followed.
The disclosures in this condensed interim financial information do not include the information reported for full annual financial statements and should therefore be read in conjunction with the financial statements of the Company for the year ended December 31, 2014. Comparative condensed interim balance sheet is extracted from annual financial statements as of December 31, 2014 whereas comparative condensed interim profit and loss account, condensed interim statement of comprehensive income, condensed interim cash flow statement and condensed interim statement of changes in equity are extracted from unaudited condensed interim financial information of the Company for the half year ended June 30, 2014.
This condensed interim financial information is unaudited and is being submitted to the members as required under Section 245 of the Companies Ordinance, 1984 and the listing regulations of the Karachi, Lahore and Islamabad Stock Exchanges.
3. The accounting policies, significant judgements made in the application of accounting policies, key sources of estimations, the methods of computation adopted in preparation of this condensed interim financial information and financial risk management policy are the same as those applied in preparation of financial statements of the Company for the year ended December 31, 2014.
4. SHARE CAPITAL
AUTHORISED SHARE CAPITALThis represents 1,500,000,000 (2014: 1,500,000,000) ordinary shares of Rs 10 each amounting to Rs 15,000,000 thousand (2014: Rs 15,000,000 thousand).
ISSUED, SUBSCRIBED AND PAID UP CAPITAL
Un-auditedJune 30,
2015
AuditedDecember 31,
2014June 30,
2015December 31,
2014(Number of shares) (Rupees ‘000)
256,495,902 256,495,902 Ordinary shares of Rs 10 each, issued for consideration in cash 2,564,959 2,564,959
1,015,742,345 1,015,742,345 Ordinary shares of Rs 10 each, issued as fully paid bonus shares 10,157,423 10,157,423
1,272,238,247 1,272,238,247 12,722,382 12,722,382
5. REVENUE RESERVES
General reserve 6,802,360 6,802,360
Unappropriated profit 4,481,584 5,681,22511,283,944 12,483,585

Notes To The Condensed Interim Financial InformationFor the half year ended June 30, 2015
Note
Un-auditedJune 30,
2015
AuditedDecember 31,
2014
(Rupees ‘000) 6. LONG TERM BORROWINGS
Long term borrowings - secured 6.1 17,715,000 4,280,000 Less: Current portion shown under current liabilities 2,975,625 1,780,000
14,739,375 2,500,000
6.1 Movement in this account during the period / year is as follows:Opening balance 4,280,000 5,740,000 Draw-downs during the period / year 14,352,500 - Repayments during the period / year (917,500) (1,460,000)Closing balance 6.2 17,715,000 4,280,000
6.2 These finances are secured by charge on all Company assets including plant, machinery, tools & spares and all other moveable properties including stocks and book debts, ranking pari passu with each other with 25% margin besides lien over certain Pakistan Investment Bonds (PIBs) with 10% margin.
These carry mark up ranging between 6 months KIBOR + 0.05% to 0.50% per annum (December 31, 2014: 6 month KIBOR + 0.35 % to 0.50% per annum) and are repayable upto June 2020 (December 31, 2014: December 2018).
Note
Un-auditedJune 30,
2015
Audited December 31,
2014
(Rupees ‘000) 7. TRADE AND OTHER PAYABLES
Creditors 7.1 1,260,643 25,417,864 Accrued liabilities 2,402,016 2,415,831 Consignment account with
Fauji Fertilizer Bin Qasim Limited - unsecured 2,053,592 131,667 Sales tax payable - net - 1,090,128 Deposits 229,660 215,453 Retention money 148,553 162,956 Advances from customers 4,951,957 6,378,845 Workers’ Welfare Fund 1,456,722 1,191,661 Workers’ Profit Participation Fund 633,483 - Unclaimed dividend 577,057 866,481 Other liabilities 31,785 33,548
13,745,468 37,904,434
7.1 Creditors include Rs. 775,098 thousand (2014: Rs. 24,740,966 thousand) on account of Gas Infrastructure Development Cess (GIDC).
8. SHORT TERM BORROWINGS
The Company has short term running finance / istisna facilities limits aggregating Rs. 13.00 billion (December 31, 2014: Rs. 13.30 billion). These are secured by first pari passu and ranking hypothecation charge over assets of the Company and carry mark up ranging between one month KIBOR + 0.05% to 0.35% and three months KIBOR + 0.10% to 0.30% per annum (December 31, 2014: one month KIBOR + 0.05 % to 0.35% and three months KIBOR + 0.05% to 0.15% per annum).
Facilities amounting to Rs 2.8 billion (2014: Rs 1.0 billion) are secured against Term Deposit Receipts / Pakistan Investment Bonds.

Half Yearly Financial Statements 2015
Notes To The Condensed Interim Financial InformationFor the half year ended June 30, 2015
Un-auditedJune 30,
2015
Audited December 31,
2014
(Rupees ‘000) 9. CONTINGENCIES AND COMMITMENTS
a) Contingencies:(i) Guarantees issued by banks on behalf of the Company 21,412 50,997
(ii) Claims against the Company and / or potential exposure not acknowledged as debt 50,696 50,696
(iii) The Competition Commission of Pakistan has imposed a penalty of Rs 5.5 billion on the Company for alleged unreasonable increase in urea prices during the year 2011. However, the fact remains that price increase was essentially caused by extended gas curtailment and delayed urea imports by the Government of Pakistan resulting in product shortage leading to market imbalance and price hike. The Company has filed an appeal against the above penalty before the Competition Appellate Tribunal. Based on legal advice from the Company’s legal advisor, the Company is confident that there are reasonable grounds for a favourable decision.
Note
Un-auditedJune 30,
2015
Audited December 31,
2014 (Rupees ‘000)
b) Commitments in respect of:(i) Capital expenditure 1,505,400 2,913,033
(ii) Purchase of fertilizer, stores, spares and other revenue items 603,255 2,869,125
(iii) Investment in Fauji Fresh n Freeze Limited 435,000 435,000
(iv) Rentals under lease agreements:
Premises 203,015 184,136
Vehicles 98,824 95,460
10. PROPERTY, PLANT AND EQUIPMENTOpening written down value 20,093,898 18,444,188 Additions during the period / year 10.1 2,163,598 3,470,092Written down value of disposals (14,206) (12,211)Depreciation during the period / year (965,081) (1,808,171)Closing written down value 21,278,209 20,093,898
10.1 Additions in and depreciation on property, plant and equipment during the half year ended June 30, 2014 were Rs 1,790,405 thousand and Rs 861,840 thousand respectively.

Notes To The Condensed Interim Financial InformationFor the half year ended June 30, 2015
Note
Un-auditedJune 30,
2015
AuditedDecember 31,
2014 (Rupees ‘000)
11. LONG TERM INVESTMENTS Investment in subsidiaries - at cost
FFC Energy Limited (FFCEL) 2,438,250 2,438,250Fauji Fresh n Freeze Limited (FFF) 1,035,500 1,035,500
Investment in associates - at costFauji Cement Company Limited (FCCL) 1,500,000 1,500,000 Fauji Fertilizer Bin Qasim Limited (FFBL) 4,658,919 4,658,919 Askari Bank Limited (AKBL) 10,461,921 10,461,921
16,620,840 16,620,840
Investment in joint venture - at costPakistan Maroc Phosphore S.A., Morocco (PMP) 705,925 705,925
Investments available for saleCertificates of Investment (COIs) / Term Deposit Receipts (TDRs) 120,535 113,868 Pakistan Investment Bonds (PIBs) 7,786,638 7,178,198 Term Finance Certificates (TFCs) 101,750 99,500
8,008,923 7,391,566 28,809,438 28,192,081
Less: Current portion shown under short term investments 12
Investments available for saleCertificates of Investment (COIs) / Term Deposit Receipts (TDRs) 28,128 27,094 Pakistan Investment Bonds (PIBs) 31,402 30,467
59,530 57,561 28,749,908 28,134,520
12. SHORT TERM INVESTMENTS
Loans and receivablesTerm deposits with banks and financial institutions
Local currency 6,700,000 25,400,000 Foreign currency 1,343,499 1,309,818
Investments at fair value through profit or loss - Held for trading 179,283 665,458 Current maturity of long term investments
Investments available for sale 11 59,530 57,561 8,282,312 27,432,837
Half Yearly Financial Statements 2015
Notes To The Condensed Interim Financial Information (Un-audited)For the half year ended June 30, 2015
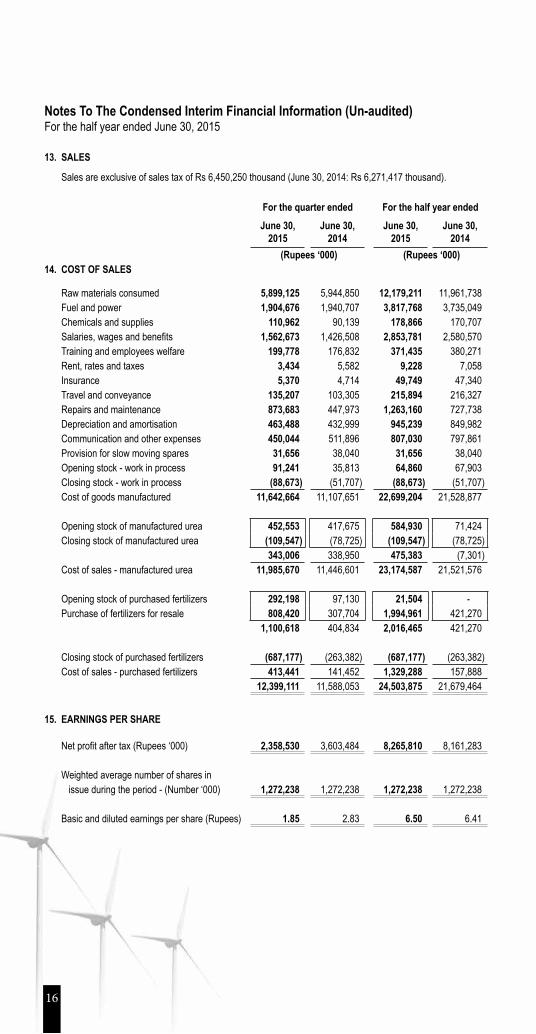
13. SALES
Sales are exclusive of sales tax of Rs 6,450,250 thousand (June 30, 2014: Rs 6,271,417 thousand).
For the quarter ended For the half year endedJune 30,
2015June 30,
2014June 30,
2015June 30,
2014 (Rupees ‘000) (Rupees ‘000)
14. COST OF SALES
Raw materials consumed 5,899,125 5,944,850 12,179,211 11,961,738 Fuel and power 1,904,676 1,940,707 3,817,768 3,735,049 Chemicals and supplies 110,962 90,139 178,866 170,707 Salaries, wages and benefits 1,562,673 1,426,508 2,853,781 2,580,570 Training and employees welfare 199,778 176,832 371,435 380,271 Rent, rates and taxes 3,434 5,582 9,228 7,058 Insurance 5,370 4,714 49,749 47,340 Travel and conveyance 135,207 103,305 215,894 216,327 Repairs and maintenance 873,683 447,973 1,263,160 727,738 Depreciation and amortisation 463,488 432,999 945,239 849,982 Communication and other expenses 450,044 511,896 807,030 797,861 Provision for slow moving spares 31,656 38,040 31,656 38,040 Opening stock - work in process 91,241 35,813 64,860 67,903 Closing stock - work in process (88,673) (51,707) (88,673) (51,707)Cost of goods manufactured 11,642,664 11,107,651 22,699,204 21,528,877
Opening stock of manufactured urea 452,553 417,675 584,930 71,424 Closing stock of manufactured urea (109,547) (78,725) (109,547) (78,725)
343,006 338,950 475,383 (7,301)Cost of sales - manufactured urea 11,985,670 11,446,601 23,174,587 21,521,576
Opening stock of purchased fertilizers 292,198 97,130 21,504 - Purchase of fertilizers for resale 808,420 307,704 1,994,961 421,270
1,100,618 404,834 2,016,465 421,270
Closing stock of purchased fertilizers (687,177) (263,382) (687,177) (263,382)Cost of sales - purchased fertilizers 413,441 141,452 1,329,288 157,888
12,399,111 11,588,053 24,503,875 21,679,464
15. EARNINGS PER SHARE
Net profit after tax (Rupees ‘000) 2,358,530 3,603,484 8,265,810 8,161,283
Weighted average number of shares in issue during the period - (Number ‘000) 1,272,238 1,272,238 1,272,238 1,272,238
Basic and diluted earnings per share (Rupees) 1.85 2.83 6.50 6.41

Notes To The Condensed Interim Financial Information (Un-audited)For the half year ended June 30, 2015
June 30,
2015June 30,
2014
(Rupees ‘000)
16. CASH GENERATED FROM OPERATIONSNet profit before taxation 12,821,810 11,637,283 Adjustments for:
Depreciation and amortisation 1,003,139 900,891 Provision for slow moving spares 31,656 38,040 Finance cost 443,210 429,852 Loss / (gain) on sale of property, plant and equipment 3,208 (13,038)Income on loans, deposits and investments (1,137,375) (645,731)Exchange (gain) / loss - net (25,905) 58,789 Gain on remeasurement of investment at fair value through profit or loss (3,205) (3,556)Dividend Income (1,685,775) (1,139,587)
(1,371,047) (374,340)11,450,763 11,262,943
Changes in working capital:Decrease / (increase) in current assets
Stores, spares and loose tools 69,741 (115,254)Stock in trade (40,484) (298,691)Trade debts (1,049,395) (1,772,165)Loans and advances (296,636) 320,953 Deposits and prepayments (654,888) (181,826)Other receivables (15,075) (487,562)
(Decrease) / increase in current liabilitiesTrade and other payables (23,869,542) 6,448,230
(25,856,279) 3,913,685
Changes in long term loans and advances (98,554) (76,604)Changes in long term deposits and prepayments 1,154 (11,703)Changes in deferred liabilities 178,297 171,784
(14,324,619) 15,260,105

Half Yearly Financial Statements 2015
Notes To The Condensed Interim Financial Information (Un-audited)For the half year ended June 30, 2015
17. TRANSACTIONS AND BALANCES WITH RELATED PARTIESSignificant transactions and balances with the related parties are as follows:
June 30, 2015
June 30,2014
(Rupees ‘000) Transactions with subsidiary companiesExpenses charged on account of marketing of fertilizer on behalf of subsidiary company - 293,825 Commission on sale of subsidiary company’s products - 6,059 Payment under consignment account - 19,065,171Dividend income - 1,069,274Long term investment - 100,000Term deposits - 2,207,695 Bank balance - 178,360Balance receivable - unsecured 908,746 619,603*
Transactions with associated undertaking / companies due to common directorshipExpenses charged on account of marketing of fertilizer on behalf of associated company 319,963 -Commission on sale of products 6,729 -Payments under consignment account 17,710,356 -Purchase of gas as feed and fuel stock 15,274,508 14,893,940Services and materials received - 174,123Sale of fertilizer 1,090 1,073Dividend income 1,685,775 70,313Dividend paid 4,197,928 3,949,663Long term investments 120,536 -Bank balance 74,690 -Balance receivable - unsecured 51,511 8,353*Balance payable - unsecured 3,569,826 26,119,281*
Other related partiesRemuneration of Chief Executive and Executives:Remuneration including benefits and perquisites of chief executive and other executives. No of persons 2015: 1 and 764 (2014: 1 and 712) respectively. 2,609,962 2,223,941
Payments to:Employees’ Provident Fund Trust 179,315 156,802 Employees’ Gratuity Fund Trust 74,893 586,201 Employees’ Pension Fund Trust 459,371 94,067
Others:Balance receivable from Gratuity Fund Trust 53,546 28,090*Balance receivable from Pension Fund Trust 449,018 59,019*
* Comparative figures of receivable / payable balances are as of December 31, 2014.
18. GENERAL18.1 Figures have been rounded off to the nearest thousand of rupees unless otherwise stated.
18.2 The Board of Directors in its meeting held on July 30, 2015 proposed a second interim dividend of Rs 1.75 per share.
18.3 This condensed interim financial information has been authorised for issue by the Board of Directors of the Company on July 30, 2015.
Chief ExecutiveChairman Director

Condensed Interim ConsolidatedFinancial Information
Half Yearly Financial Statements 2015
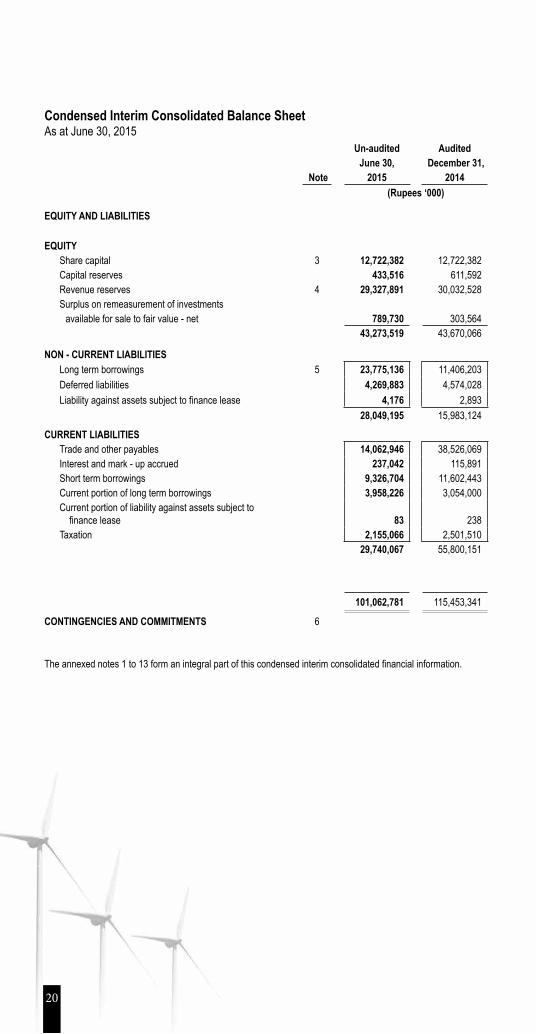
Condensed Interim Consolidated Balance SheetAs at June 30, 2015
Un-audited AuditedJune 30, December 31,
Note 2015 2014(Rupees ‘000)
EQUITY AND LIABILITIES
EQUITYShare capital 3 12,722,382 12,722,382 Capital reserves 433,516 611,592 Revenue reserves 4 29,327,891 30,032,528 Surplus on remeasurement of investments
available for sale to fair value - net 789,730 303,564 43,273,519 43,670,066
NON - CURRENT LIABILITIESLong term borrowings 5 23,775,136 11,406,203 Deferred liabilities 4,269,883 4,574,028 Liability against assets subject to finance lease 4,176 2,893
28,049,195 15,983,124
CURRENT LIABILITIESTrade and other payables 14,062,946 38,526,069 Interest and mark - up accrued 237,042 115,891 Short term borrowings 9,326,704 11,602,443 Current portion of long term borrowings 3,958,226 3,054,000 Current portion of liability against assets subject to finance lease 83 238 Taxation 2,155,066 2,501,510
29,740,067 55,800,151
101,062,781 115,453,341
CONTINGENCIES AND COMMITMENTS 6
The annexed notes 1 to 13 form an integral part of this condensed interim consolidated financial information.

Un-audited AuditedJune 30, December 31,
Note 2015 2014
(Rupees ‘000)
ASSETS
NON - CURRENT ASSETSProperty, plant and equipment 7 34,826,662 33,104,620 Intangible assets 1,936,314 1,974,531 Long term investments 8 42,420,995 41,787,131 Long term loans and advances 921,742 823,188 Long term deposits and prepayments 16,650 17,804
80,122,363 77,707,274
CURRENT ASSETS Stores, spares and loose tools 3,213,426 3,314,823
Stock in trade 1,128,191 985,347 Trade debts 3,325,270 2,221,263Loans and advances 602,459 531,379Deposits and prepayments 692,593 27,589Other receivables 1,258,935 1,182,227Short term investments 9 8,282,312 27,432,837 Cash and bank balances 2,437,232 2,050,602
20,940,418 37,746,067
101,062,781 115,453,341
Chief ExecutiveChairman Director

Half Yearly Financial Statements 2015
24
Condensed Interim Consolidated Profit and Loss Account (Un-audited)For the half year ended June 30, 2015
For the quarter ended For the half year ended(Re-presented) (Re-presented)
June 30,2015
June 30,2014
June 30,2015
June 30,2014Note
(Rupees’000) (Rupees’000)Sales 19,898,242 19,301,193 40,572,291 37,208,486
Cost of sales 10 12,592,706 11,768,177 24,887,562 22,045,570
GROSS PROFIT 7,305,536 7,533,016 15,684,729 15,162,916
Administrative expenses and distribution cost 1,665,711 1,584,667 3,280,832 3,105,876
5,639,825 5,948,349 12,403,897 12,057,040
Finance cost 564,251 545,687 1,062,595 1,078,104
Other expenses 443,466 452,003 1,183,599 1,042,769
4,632,108 4,950,659 10,157,703 9,936,167
Other income 508,833 214,954 1,281,241 722,921Share of profit / (loss) of associate and joint venture 1,293,520 (256,951) 1,882,327 190,285
NET PROFIT BEFORE TAXATION 6,434,461 4,908,662 13,321,271 10,849,373
Provision for taxation 2,227,877 1,376,783 4,560,456 3,538,783
NET PROFIT AFTER TAXATION FROM CONTINUING OPERATIONS 4,206,584 3,531,879 8,760,815 7,310,590
Discontinued operations - net of tax - 754,011 - 801,943
Profit for the period 4,206,584 4,285,890 8,760,815 8,112,533
The annexed notes 1 to 13 form an integral part of this condensed interim consolidated financial information.
Chief ExecutiveChairman Director
25
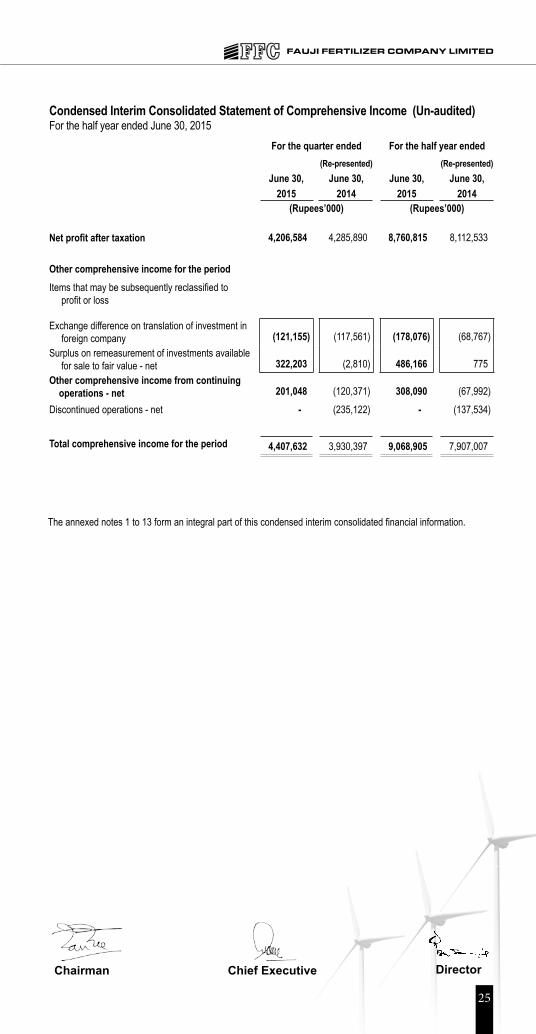
Condensed Interim Consolidated Statement of Comprehensive Income (Un-audited)For the half year ended June 30, 2015
For the quarter ended For the half year ended(Re-presented) (Re-presented)
June 30, June 30, June 30, June 30,2015 2014 2015 2014
(Rupees’000) (Rupees’000)
Net profit after taxation 4,206,584 4,285,890 8,760,815 8,112,533
Other comprehensive income for the periodItems that may be subsequently reclassified to profit or loss
Exchange difference on translation of investment in foreign company (121,155) (117,561) (178,076) (68,767)Surplus on remeasurement of investments available
for sale to fair value - net 322,203 (2,810) 486,166 775 Other comprehensive income from continuing operations - net 201,048 (120,371) 308,090 (67,992)Discontinued operations - net - (235,122) - (137,534)
Total comprehensive income for the period 4,407,632 3,930,397 9,068,905 7,907,007
The annexed notes 1 to 13 form an integral part of this condensed interim consolidated financial information.
Chief ExecutiveChairman Director

Half Yearly Financial Statements 2015
Condensed Interim Consolidated Cash Flow Statement (Un-audited)For the half year ended June 30, 2015
(Re-presented)
NoteJune 30,
2015June 30,
2014
(Rupees ‘000)CASH FLOWS FROM OPERATING ACTIVITIES
Cash (used in) / generated from operations 11 (13,456,498) 15,328,782 Finance cost paid (1,002,301) (713,671)Income tax paid (5,389,341) (4,518,712)
(6,391,642) (5,232,383)Net cash (used in) / generated from operating activities (19,848,140) 10,096,399
CASH FLOWS FROM INVESTING ACTIVITIESFixed capital expenditure (2,927,913) (1,999,248)Proceeds from sale of property, plant and equipment 37,211 130,931 Interest received 1,168,167 729,411 Dividend / (increase) in investment 1,408,388 (1,320,608) Dividend received 1,685,775 84,375Net cash generated from / (used in) investing activities 1,371,628 (2,375,139)
CASH FLOWS FROM FINANCING ACTIVITIESLong term financing - disbursements 15,116,250 -
- repayments (1,864,519) (875,817) Dividends paid (9,754,875) (7,654,079)Net cash generated from / (used in) investing activities 3,496,856 (8,529,896)
CASH FLOWS FROM DISCONTINUED OPERATIONSOperating cash flows - (2,220,378)Investing cash flows - (379,934) Financing cash flows - (4,335,373) Net cash used in discontinued operations - (6,935,685)
Net decrease in cash and cash equivalents (14,979,656) (7,744,321)Cash and cash equivalents at beginning of the period 16,157,977 16,409,752 Effect of exchange rate changes 16,451 (65,825) Cash and cash equivalents at end of the period 1,194,772 8,599,606
CASH AND CASH EQUIVALENTSCash and bank balances 2,437,232 7,025,478 Short term highly liquid investments 8,084,244 17,670,279 Short term running finances (9,326,704) (16,096,151)
1,194,772 8,599,606
The annexed notes 1 to 13 form an integral part of this condensed interim consolidated financial information.
Chief ExecutiveChairman Director
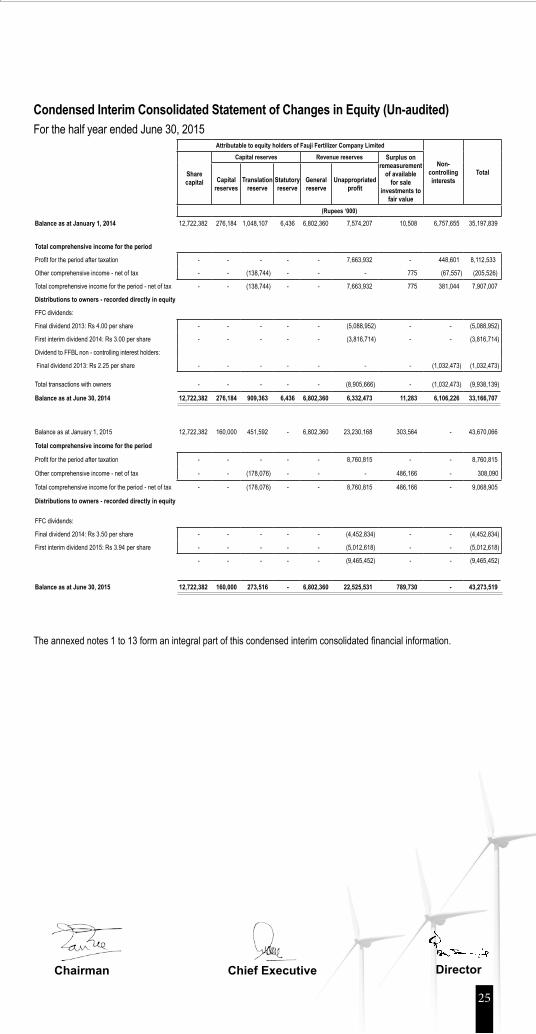
Condensed Interim Consolidated Statement of Changes in Equity (Un-audited)For the half year ended June 30, 2015
Attributable to equity holders of Fauji Fertilizer Company Limited
Non-controlling interests
TotalSharecapital
Capital reserves Revenue reserves Surplus onremeasurement
of available for sale
investments tofair value
Capitalreserves
Translationreserve
Statutory reserve
General reserve
Unappropriatedprofit
(Rupees ‘000)
Balance as at January 1, 2014 12,722,382 276,184 1,048,107 6,436 6,802,360 7,574,207 10,508 6,757,655 35,197,839
Total comprehensive income for the period
Profit for the period after taxation - - - - - 7,663,932 - 448,601 8,112,533
Other comprehensive income - net of tax - - (138,744) - - - 775 (67,557) (205,526)
Total comprehensive income for the period - net of tax - - (138,744) - - 7,663,932 775 381,044 7,907,007
Distributions to owners - recorded directly in equity
FFC dividends:
Final dividend 2013: Rs 4.00 per share - - - - - (5,088,952) - - (5,088,952)
First interim dividend 2014: Rs 3.00 per share - - - - - (3,816,714) - - (3,816,714)
Dividend to FFBL non - controlling interest holders:
Final dividend 2013: Rs 2.25 per share - - - - - - - (1,032,473) (1,032,473)
Total transactions with owners - - - - - (8,905,666) - (1,032,473) (9,938,139)
Balance as at June 30, 2014 12,722,382 276,184 909,363 6,436 6,802,360 6,332,473 11,283 6,106,226 33,166,707
Balance as at January 1, 2015 12,722,382 160,000 451,592 - 6,802,360 23,230,168 303,564 - 43,670,066
Total comprehensive income for the period
Profit for the period after taxation - - - - - 8,760,815 - - 8,760,815
Other comprehensive income - net of tax - - (178,076) - - - 486,166 - 308,090
Total comprehensive income for the period - net of tax - - (178,076) - - 8,760,815 486,166 - 9,068,905
Distributions to owners - recorded directly in equity
FFC dividends:
Final dividend 2014: Rs 3.50 per share - - - - - (4,452,834) - - (4,452,834)
First interim dividend 2015: Rs 3.94 per share - - - - - (5,012,618) - - (5,012,618)
- - - - - (9,465,452) - - (9,465,452)
Balance as at June 30, 2015 12,722,382 160,000 273,516 - 6,802,360 22,525,531 789,730 - 43,273,519
The annexed notes 1 to 13 form an integral part of this condensed interim consolidated financial information.
Chief ExecutiveChairman Director

Half Yearly Financial Statements 2015
Notes To The Condensed Interim Consolidated Financial Information (Un-audited)For the half year ended June 30, 2015
1. Fauji Fertilizer Company Limited (the Company) is a public company incorporated in Pakistan under the Companies Act, 1913, (now the Companies Ordinance, 1984) and its shares are quoted on the Karachi, Lahore and Islamabad stock exchanges of Pakistan. The registered office of the Company is situated at 156 - The Mall, Rawalpindi, Pakistan. The Company is domiciled in Rawalpindi. The principal activity of the Company is manufacturing, purchasing and marketing of fertilizers and chemicals, including investment in other fertilizer, chemical, other manufacturing, energy generation and banking operations.
1% equity of Fauji Fertilizer Bin Qasim Limited (FFBL) aggregating to 9,341,100 ordinary shares, held by the Company, were sold to Fauji Foundation (FF) on October 3, 2014 at the closing market price. Further, the Company irrevocably appointed FF as its proxy, to represent the Company in the general meetings of FFBL and Askari Bank Limited (AKBL) allowing FF to vote for and on behalf of the Company and resolved that representatives of FF may be elected or co-opted or appointed on the Board of Directors of FFBL and AKBL, as nominated by FF. This resulted in loss of control over FFBL and AKBL. Accordingly, the status of FFBL and AKBL has been changed to associated companies of the Company and therefore the group has classified FFBL and AKBL as discontinued operations, for the year ended December 31, 2014.
2. This condensed interim consolidated financial report is un-audited and is being submitted to the shareholders in accordance with the requirements of Section 245 of the Companies Ordinance, 1984. This condensed interim consolidated financial report of the Group for the period ended June 30, 2015 has been prepared in accordance with the requirements of the International Accounting Standard - 34: “Interim Financial Reporting” and provisions of and directives issued under the Companies Ordinance, 1984. In case where requirements differ, the provisions of or directives issued under the Companies Ordinance, 1984 have been followed. The applicable financial framework for banks also includes the Banking Companies Ordinance, 1962 and the provisions of and directives issued by the State Bank of Pakistan (SBP).
This condensed interim consolidated financial report does not include all the information required for full annual financial statements and should be read in conjunction with the annual financial statements of the Group for the year ended December 31, 2014. Comparative condensed interim consolidated balance sheet is extracted from annual audited financial statements for the year ended December 31, 2014 where as comparative condensed interim consolidated profit and loss account, condensed interim consolidated statement of comprehensive income, condensed interim consolidated cash flow statement and condensed interim consolidated statement of changes in equity are stated from un-audited condensed interim financial report for the period ended June 30, 2014.
3. SHARE CAPITALAUTHORISED SHARE CAPITALThis represents 1,500,000,000 (2014: 1,500,000,000) ordinary shares of Rs 10 each amounting to Rs 15,000,000 thousand (2014: Rs 15,000,000 thousand).
ISSUED, SUBSCRIBED AND PAID UP CAPITALUn-audited June 30,
2015
Audited December 31,
2014June 30, December 31,
2015 2014(Number of shares) (Rupees ‘000)
256,495,902 256,495,902 Ordinary shares of Rs.10 each issued for consideration in cash 2,564,959 2,564,959
1,015,742,345 1,015,742,345 Ordinary shares of Rs.10 each issued as fully paid bonus shares 10,157,423 10,157,423
1,272,238,247 1,272,238,247 12,722,382 12,722,382

Notes To The Condensed Interim Consolidated Financial InformationFor the half year ended June 30, 2015
Note
Un-audited June 30,
2015
Audited December 31,
2014(Rupees ‘000)
4. REVENUE RESERVESGeneral reserve 6,802,360 6,802,360 Unappropriated profit 22,525,531 23,230,168
29,327,891 30,032,528
5. LONG TERM BORROWINGSLoans from banking companies - secured 5.1 17,715,000 4,280,000Long term loan - Government of Pakistan loan FFBL (un-secured) 5.2 - -Long term loan - FFCEL (secured) 5.3 8,037,278 8,963,275Long term loan - FFF (MCB) 5.4 1,981,083 1,216,928
27,733,361 14,460,203Less: Current portion shown under current liabilities 3,958,225 3,054,000
23,775,136 11,406,203
5.1 Movement in this account during the period / year is as follows:Opening balance 4,280,000 5,740,000Draw-downs during the period / year 14,352,500 -Repayments during the period / year (917,500) (1,460,000)Closing balance 17,715,000 4,280,000
5.2 Movement in this account during the period / year is as follows:Opening balance - 2,592,802Adjustment during the period / year - (2,592,802)Closing balance - -
5.3 Movement in this account during the period / year is as follows:Opening balance 8,210,119 9,157,138Less: Transaction Cost
Initial transaction cost (269,797) (269,797)Amortised during the period / year 96,956 75,934
Closing balance 8,037,278 8,963,275
5.4 Movement in this account during the period / year is as follows:Opening balance 1,216,928 1,220,000Disbursements during the period / year 766,822 -Less: Transaction Cost (4,000) (4,000)
Amortised during the period / year 1,333 928Closing balance 1,981,083 1,216,928
Half Yearly Financial Statements 2015
Notes To The Condensed Interim Consolidated Financial InformationFor the half year ended June 30, 2015
Un-auditedJune 30,
2015
Audited December 31,
2014(Rupees ‘000)
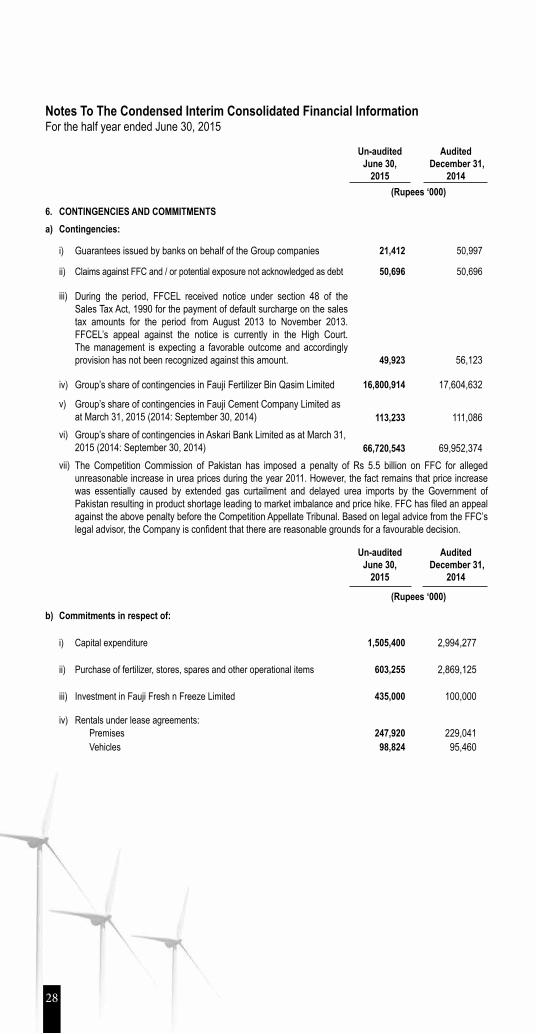
6. CONTINGENCIES AND COMMITMENTSa) Contingencies:
i) Guarantees issued by banks on behalf of the Group companies 21,412 50,997
ii) Claims against FFC and / or potential exposure not acknowledged as debt 50,696 50,696
iii) During the period, FFCEL received notice under section 48 of the Sales Tax Act, 1990 for the payment of default surcharge on the sales tax amounts for the period from August 2013 to November 2013. FFCEL’s appeal against the notice is currently in the High Court. The management is expecting a favorable outcome and accordingly provision has not been recognized against this amount. 49,923 56,123
iv) Group’s share of contingencies in Fauji Fertilizer Bin Qasim Limited 16,800,914 17,604,632
v) Group’s share of contingencies in Fauji Cement Company Limited as
at March 31, 2015 (2014: September 30, 2014) 113,233 111,086 vi) Group’s share of contingencies in Askari Bank Limited as at March 31,
2015 (2014: September 30, 2014) 66,720,543 69,952,374vii) The Competition Commission of Pakistan has imposed a penalty of Rs 5.5 billion on FFC for alleged
unreasonable increase in urea prices during the year 2011. However, the fact remains that price increase was essentially caused by extended gas curtailment and delayed urea imports by the Government of Pakistan resulting in product shortage leading to market imbalance and price hike. FFC has filed an appeal against the above penalty before the Competition Appellate Tribunal. Based on legal advice from the FFC’s legal advisor, the Company is confident that there are reasonable grounds for a favourable decision.
Un-auditedJune 30,
2015
Audited December 31,
2014
(Rupees ‘000)
b) Commitments in respect of:
i) Capital expenditure 1,505,400 2,994,277
ii) Purchase of fertilizer, stores, spares and other operational items 603,255 2,869,125
iii) Investment in Fauji Fresh n Freeze Limited 435,000 100,000
iv) Rentals under lease agreements: Premises 247,920 229,041 Vehicles 98,824 95,460

Notes To The Condensed Interim Consolidated Financial InformationFor the half year ended June 30, 2015
Note
Un-audited June 30,
2015
Audited December 31,
2014(Rupees ‘000)
7. PROPERTY, PLANT AND EQUIPMENT Opening written down value 33,104,620 44,314,880 Additions during the period / year 7.1 3,010,198 7,829,632 Written down value of disposals / adjustments (14,267) (2,287,916) Depreciation during the period / year (1,273,889) (3,471,748)
34,826,662 46,384,848 Discontinued operations - (13,280,228) 34,826,662 33,104,620
7.1 Additions in and depreciation on property, plant and equipment during the half year ended June 30, 2014 were Rs 2,317,475 thousand and Rs 1,859,880 thousand respectively.
Note
Un-audited June 30,
2015
Audited December 31,
2014(Rupees ‘000)
8. LONG TERM INVESTMENTSEquity accounted investments 8.1 34,471,602 34,453,126Other long term investments 8.2 7,949,393 7,334,005
42,420,995 41,787,1318.1 Equity accounted investments
Investment in associated companies - under equity method
Fauji Fertilizer Bin Qasim Limited (FFBL)Balance at the beginning 19,479,310 18,710,223Share of profit for the period / year 646,336 1,118,510Dividend received (1,048,257) (349,423)
19,077,389 19,479,310Askari Bank Limited (AKBL)Balance at the beginning 11,859,580 11,859,580Share of profit for the period / year 947,592 -Dividend received (543,768) -
12,263,404 11,859,580Fauji Cement Company Limited (FCCL)Balance at the beginning 1,824,000 2,149,878 Share of profit for the period / year 135,860 207,670Dividend received (93,750) (168,750)
1,866,110 2,188,798Discontinued operations - (364,798)
1,866,110 1,824,000Foundation Wind Energy - I LimitedAdvance for issue of shares - balance at beginning - 923,941Advance for issue of shares during the period / year - 189,043Share of loss for the year - (10,631)
- 1,102,353 Discontinued operations - (1,102,353)
- -Foundation Wind Energy - II (Private) LimitedAdvance for issue of shares - balance at beginning - 971,100Advance during the period / year - 96,226Share of profit / (loss) for the period / year - (1,653)
- 1,065,673Discontinued operations - (1,065,673)
- -
Half Yearly Financial Statements 2015
Note
Un-audited June 30,
2015
Audited December 31,
2014(Rupees ‘000)
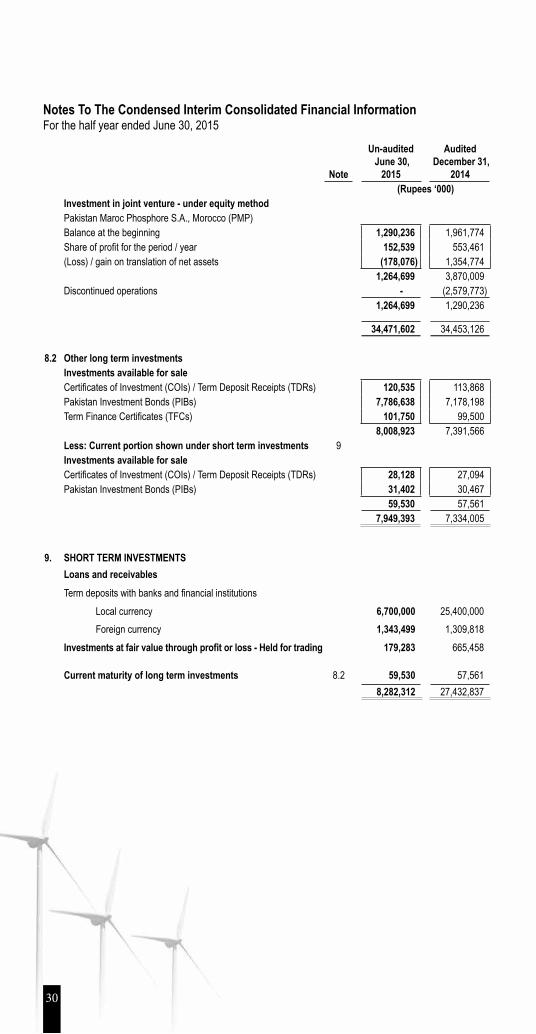
Investment in joint venture - under equity methodPakistan Maroc Phosphore S.A., Morocco (PMP)Balance at the beginning 1,290,236 1,961,774Share of profit for the period / year 152,539 553,461(Loss) / gain on translation of net assets (178,076) 1,354,774
1,264,699 3,870,009Discontinued operations - (2,579,773)
1,264,699 1,290,236
34,471,602 34,453,126
8.2 Other long term investmentsInvestments available for saleCertificates of Investment (COIs) / Term Deposit Receipts (TDRs) 120,535 113,868Pakistan Investment Bonds (PIBs) 7,786,638 7,178,198Term Finance Certificates (TFCs) 101,750 99,500
8,008,923 7,391,566Less: Current portion shown under short term investments 9Investments available for saleCertificates of Investment (COIs) / Term Deposit Receipts (TDRs) 28,128 27,094Pakistan Investment Bonds (PIBs) 31,402 30,467
59,530 57,5617,949,393 7,334,005
9. SHORT TERM INVESTMENTSLoans and receivablesTerm deposits with banks and financial institutions
Local currency 6,700,000 25,400,000 Foreign currency 1,343,499 1,309,818
Investments at fair value through profit or loss - Held for trading 179,283 665,458
Current maturity of long term investments 8.2 59,530 57,5618,282,312 27,432,837
Notes To The Condensed Interim Consolidated Financial InformationFor the half year ended June 30, 2015
Notes To The Condensed Interim Consolidated Financial Information (Un-audited)For the half year ended June 30, 2015
For the quarter ended For the half year ended
(Re-presented) (Re-presented)June 30,
2015June 30,
2014June 30,
2015June 30,
2014(Rupees’000) (Rupees’000)
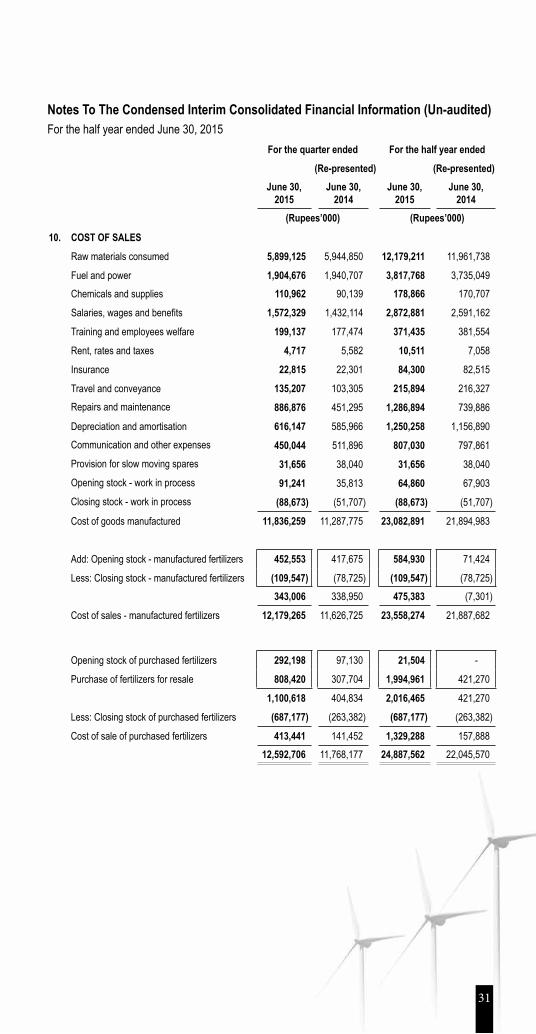
10. COST OF SALES
Raw materials consumed 5,899,125 5,944,850 12,179,211 11,961,738
Fuel and power 1,904,676 1,940,707 3,817,768 3,735,049Chemicals and supplies 110,962 90,139 178,866 170,707
Salaries, wages and benefits 1,572,329 1,432,114 2,872,881 2,591,162
Training and employees welfare 199,137 177,474 371,435 381,554
Rent, rates and taxes 4,717 5,582 10,511 7,058
Insurance 22,815 22,301 84,300 82,515
Travel and conveyance 135,207 103,305 215,894 216,327Repairs and maintenance 886,876 451,295 1,286,894 739,886
Depreciation and amortisation 616,147 585,966 1,250,258 1,156,890Communication and other expenses 450,044 511,896 807,030 797,861Provision for slow moving spares 31,656 38,040 31,656 38,040Opening stock - work in process 91,241 35,813 64,860 67,903Closing stock - work in process (88,673) (51,707) (88,673) (51,707)
Cost of goods manufactured 11,836,259 11,287,775 23,082,891 21,894,983
Add: Opening stock - manufactured fertilizers 452,553 417,675 584,930 71,424
Less: Closing stock - manufactured fertilizers (109,547) (78,725) (109,547) (78,725)343,006 338,950 475,383 (7,301)
Cost of sales - manufactured fertilizers 12,179,265 11,626,725 23,558,274 21,887,682
Opening stock of purchased fertilizers 292,198 97,130 21,504 -
Purchase of fertilizers for resale 808,420 307,704 1,994,961 421,270
1,100,618 404,834 2,016,465 421,270
Less: Closing stock of purchased fertilizers (687,177) (263,382) (687,177) (263,382)
Cost of sale of purchased fertilizers 413,441 141,452 1,329,288 157,88812,592,706 11,768,177 24,887,562 22,045,570

Half Yearly Financial Statements 2015
Notes To The Condensed Interim Consolidated Financial Information (Un-audited)For the half year ended June 30, 2015
(Re-presented)June 30,
2015June 30,
2014
(Rupees ‘000)11. CASH GENERATED FROM OPERATIONS
Net profit before taxation 13,321,271 10,849,373
Adjustments for:
Depreciation and amortisation 1,332,969 1,209,780Provision for slow moving spares 31,656 38,040 Finance cost 1,041,572 918,082 Income on loans, deposits and investments (1,163,587) (645,767)Share of profit of associate and joint venture (1,882,327) (190,286)Loss / (gain) on sale of property, plant and equipment 3,208 (13,038)
Exchange (gain) / loss (26,319) 16,267 Gain on remeasurement of investments at fair value through profit or loss (3,205) (3,556)
(666,033) 1,329,52212,655,238 12,178,895
Changes in working capitalDecrease / (increase) in current assets:
Stores and spares 69,741 (115,254)Stock in trade (142,844) (298,691)Trade debts (1,104,008) (2,080,132) Loans and advances (71,569) 324,442Deposits and prepayments (665,003) (194,663)Other receivables (92,939) 129,895
(Decrease) / increase in current liabilities:Trade and other payables (24,727,422) 5,244,400
(26,734,044) 3,009,997Changes in long term loans and advances 442,857 (76,604)Changes in long term deposits and prepayments 1,154 (12,478)Changes in deferred liabilities 178,297 228,972
(13,456,498) 15,328,782

Notes To The Condensed Interim Consolidated Financial Information (Un-audited)For the half year ended June 30, 201512. TRANSACTIONS AND BALANCES WITH RELATED PARTIES
Significant transactions and balances with the related parties are as follows:
June 30,2015
June 30,2014
(Rupees ‘000)
Transactions with associated undertakings / companies due to common directorshipLong term investments 120,536 179,346Sale of fertilizer 1,090 1,073 Dividends paid 4,197,928 4,313,041 Purchase of gas as feed and fuel stock 15,274,508 14,893,948Expenses charged on account of marketing of fertilizer 319,963 -Commission on sale of products 6,729 -Payment under consignment account 17,710,356 - Services received - 174,123Balance payable 3,569,826 26,119,281*Balance receivable 51,511 3,275,428*
Transactions with joint venture companyRaw material purchased - 10,726,841Expenses incurred on behalf of joint venture company - 7,201Balance receivable - 8,353*
Other related partiesRemuneration including benefits and perquisites of chief executive and executives, No. of persons 2015: 1 and 764 (2014: 1 and 647). 2,609,962 2,335,943
Payments to:Employees’ Provident Fund Trust 179,315 185,618 Employees’ Gratuity Fund Trust 74,893 621,975Employees’ Pension Fund Trust 459,371 94,067
Others:Balance receivable from Gratuity Fund Trust 53,546 28,090*Balance receivable from Pension Fund Trust 449,018 59,019*
*Comparative figures of receivable / payable balances are as of December 31, 2014.
13. GENERAL 13.1 Figures have been rounded off to the nearest thousand of rupees unless otherwise stated.
13.2 The Board of Directors of FFC in its meeting held on July 30, 2015 proposed a second interim dividend of Rs.1.75 per share.
13.3 This condensed interim consolidated financial information has been authorized for issue by the Board of Directors of FFC on July 30, 2015.
Chief ExecutiveChairman Director

Half Yearly Financial Statements 2015
FAUJI