FAUJI CEMENT COMPANY L (FCCL) Nov 10, 2015 · 2017-09-28 · FAUJI CEMENT COMPANY LIMITED (FCCL)...
10
FAUJI CEMENT COMPANY LIMITED (FCCL) Nov 10, 2015 INITIATION BUY Price Target : PKR 43.02/share Closing Price : PKR 35.63/share COMPANY DATA 52-week Price Range (PKR) 38.61-21.78 No. of Shares Outstanding (mn) 1331.12 Market Cap (PKRmn) 47427.66 Market Cap (USDmn) 449.68 Free Float (mn shares) 732.11 Year End Jun KATS Code FCCL Source: KSE CHART: STOCK PERFORMANCE Source: Company Accounts, NAEL Research Source: KSE FCCL FINANCIAL HIGHLIGHTS FY14 FY15 FY16E FY17E FY18E FY19E FY20E EPS 1.80 2.91 3.50 3.78 4.02 4.08 3.96 DPS 1.50 2.50 3.00 3.00 3.50 3.50 3.50 BVPS 11.86 13.09 14.27 15.24 16.43 17.20 17.84 PE (x) 11.10 11.32 10.17 9.41 8.87 8.73 9.00 Div Payout (%) 76 81 81 76 83 82 85 EBITDA Margin (%) 41 43 50 48 46 45 42 ROA (%) 9 13 16 18 18 18 17 ROE (%) 17 24 26 26 26 25 23 Gross Margin (%) 35 38 44 43 41 40 37 Net Profit Margin (%) 15 22 25 25 25 24 23 EQUITY RESEARCH Please refer to the last page for important disclosures Jawad Ameer Ali AC [email protected] (+92-21) 32461812-13 We initiate our coverage on FCCL with ‘Buy’ rating: Our Jun-16 DCF based price target of PKR 43.02/sh implies 21% upside from current price levels of PKR 35.63/sh. Improvement in margins: The gross margin of FCCL is expected to surge by massive 655bps to ~44% for FY16 as against ~38% observed in FY15. This is mainly attributable to 1) operation of 10MW WHR power plant 2) decline in international oil & coal prices Volumetric growth: The recent CPEC projects and FCCL’s strategic location in north along with proximity to cement driving project allows local volumetric growth in near future. Financial Deleverage: The reduction in finance cost owing to 1) monetary easing 2) swift repayments of long term loans. Investment Risk: Key risks to our investments thesis are 1) Price war 2) upsurge in international coal & oil prices 3) decline in local demand 4) Reversal of interest rate. 0 5,000,000 10,000,000 15,000,000 20,000,000 25,000,000 30,000,000 35,000,000 40,000,000 45,000,000 50,000,000 80 100 120 140 160 180 200 5-Nov-14 5-Dec-14 5-Jan-15 5-Feb-15 5-Mar-15 5-Apr-15 5-May-15 5-Jun-15 5-Jul-15 5-Aug-15 5-Sep-15 5-Oct-15 Volume KSE FCCL
Transcript of FAUJI CEMENT COMPANY L (FCCL) Nov 10, 2015 · 2017-09-28 · FAUJI CEMENT COMPANY LIMITED (FCCL)...

FAUJI CEMENT COMPANY LIMITED (FCCL) Nov 10, 2015
INITIATION
BUY
Price Target : PKR 43.02/share
Closing Price : PKR 35.63/share
COMPANY DATA
52-week Price Range (PKR) 38.61-21.78
No. of Shares Outstanding (mn) 1331.12
Market Cap (PKRmn) 47427.66
Market Cap (USDmn) 449.68
Free Float (mn shares) 732.11
Year End Jun
KATS Code FCCL
Source: KSE
CHART: STOCK PERFORMANCE
Source: Company Accounts, NAEL Research
Source: KSE
FCCL FINANCIAL HIGHLIGHTS
FY14 FY15 FY16E FY17E FY18E FY19E FY20E
EPS 1.80 2.91 3.50 3.78 4.02 4.08 3.96
DPS 1.50 2.50 3.00 3.00 3.50 3.50 3.50
BVPS 11.86 13.09 14.27 15.24 16.43 17.20 17.84
PE (x) 11.10 11.32 10.17 9.41 8.87 8.73 9.00
Div Payout (%) 76 81 81 76 83 82 85
EBITDA Margin (%) 41 43 50 48 46 45 42
ROA (%) 9 13 16 18 18 18 17
ROE (%) 17 24 26 26 26 25 23
Gross Margin (%) 35 38 44 43 41 40 37
Net Profit Margin (%) 15 22 25 25 25 24 23
EQUITY RESEARCH
Please refer to the last page for important disclosures
Jawad Ameer Ali AC
[email protected] (+92-21) 32461812-13
We initiate our coverage on FCCL with ‘Buy’ rating: Our Jun-16 DCF based price
target of PKR 43.02/sh implies 21% upside from current price levels of PKR
35.63/sh.
Improvement in margins: The gross margin of FCCL is expected to surge by
massive 655bps to ~44% for FY16 as against ~38% observed in FY15. This is
mainly attributable to
1) operation of 10MW WHR power plant
2) decline in international oil & coal prices
Volumetric growth: The recent CPEC projects and FCCL’s strategic location in
north along with proximity to cement driving project allows local volumetric
growth in near future.
Financial Deleverage: The reduction in finance cost owing to 1) monetary easing
2) swift repayments of long term loans.
Investment Risk: Key risks to our investments thesis are 1) Price war 2) upsurge
in international coal & oil prices 3) decline in local demand 4) Reversal of interest
rate.
0
5,000,000
10,000,000
15,000,000
20,000,000
25,000,000
30,000,000
35,000,000
40,000,000
45,000,000
50,000,000
80
100
120
140
160
180
200
5-N
ov-
14
5-D
ec-1
4
5-J
an-1
5
5-F
eb-1
5
5-M
ar-1
5
5-A
pr-
15
5-M
ay-1
5
5-J
un
-15
5-J
ul-
15
5-A
ug-
15
5-S
ep-1
5
5-O
ct-1
5
Volume KSE FCCL
2
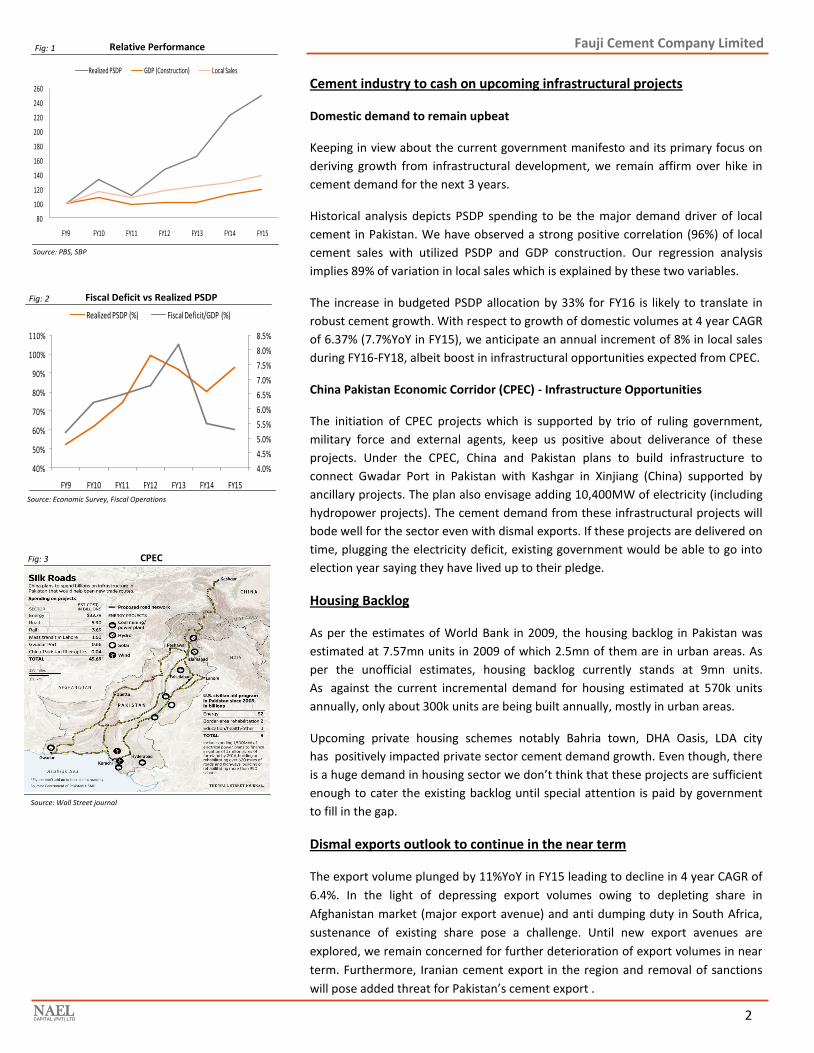
Cement industry to cash on upcoming infrastructural projects
Domestic demand to remain upbeat
Keeping in view about the current government manifesto and its primary focus on
deriving growth from infrastructural development, we remain affirm over hike in
cement demand for the next 3 years.
Historical analysis depicts PSDP spending to be the major demand driver of local
cement in Pakistan. We have observed a strong positive correlation (96%) of local
cement sales with utilized PSDP and GDP construction. Our regression analysis
implies 89% of variation in local sales which is explained by these two variables.
The increase in budgeted PSDP allocation by 33% for FY16 is likely to translate in
robust cement growth. With respect to growth of domestic volumes at 4 year CAGR
of 6.37% (7.7%YoY in FY15), we anticipate an annual increment of 8% in local sales
during FY16-FY18, albeit boost in infrastructural opportunities expected from CPEC.
China Pakistan Economic Corridor (CPEC) - Infrastructure Opportunities
The initiation of CPEC projects which is supported by trio of ruling government,
military force and external agents, keep us positive about deliverance of these
projects. Under the CPEC, China and Pakistan plans to build infrastructure to
connect Gwadar Port in Pakistan with Kashgar in Xinjiang (China) supported by
ancillary projects. The plan also envisage adding 10,400MW of electricity (including
hydropower projects). The cement demand from these infrastructural projects will
bode well for the sector even with dismal exports. If these projects are delivered on
time, plugging the electricity deficit, existing government would be able to go into
election year saying they have lived up to their pledge.
Housing Backlog
As per the estimates of World Bank in 2009, the housing backlog in Pakistan was
estimated at 7.57mn units in 2009 of which 2.5mn of them are in urban areas. As
per the unofficial estimates, housing backlog currently stands at 9mn units.
As against the current incremental demand for housing estimated at 570k units
annually, only about 300k units are being built annually, mostly in urban areas.
Upcoming private housing schemes notably Bahria town, DHA Oasis, LDA city
has positively impacted private sector cement demand growth. Even though, there
is a huge demand in housing sector we don’t think that these projects are sufficient
enough to cater the existing backlog until special attention is paid by government
to fill in the gap.
Dismal exports outlook to continue in the near term
The export volume plunged by 11%YoY in FY15 leading to decline in 4 year CAGR of
6.4%. In the light of depressing export volumes owing to depleting share in
Afghanistan market (major export avenue) and anti dumping duty in South Africa,
sustenance of existing share pose a challenge. Until new export avenues are
explored, we remain concerned for further deterioration of export volumes in near
term. Furthermore, Iranian cement export in the region and removal of sanctions
will pose added threat for Pakistan’s cement export .
Source: Wall Street journal
CAPITAL (PVT) LTD NAEL
Source: PBS, SBP
Fig: 1
Fig: 3 CPEC
Fauji Cement Company Limited Relative Performance
Source: Economic Survey, Fiscal Operations
Fig: 2 Fiscal Deficit vs Realized PSDP
4.0%
4.5%
5.0%
5.5%
6.0%
6.5%
7.0%
7.5%
8.0%
8.5%
40%
50%
60%
70%
80%
90%
100%
110%
FY9 FY10 FY11 FY12 FY13 FY14 FY15
Realized PSDP (%) Fiscal Deficit/GDP (%)
80
100
120
140
160
180
200
220
240
260
FY9 FY10 FY11 FY12 FY13 FY14 FY15
Realized PSDP GDP (Construction) Local Sales
3
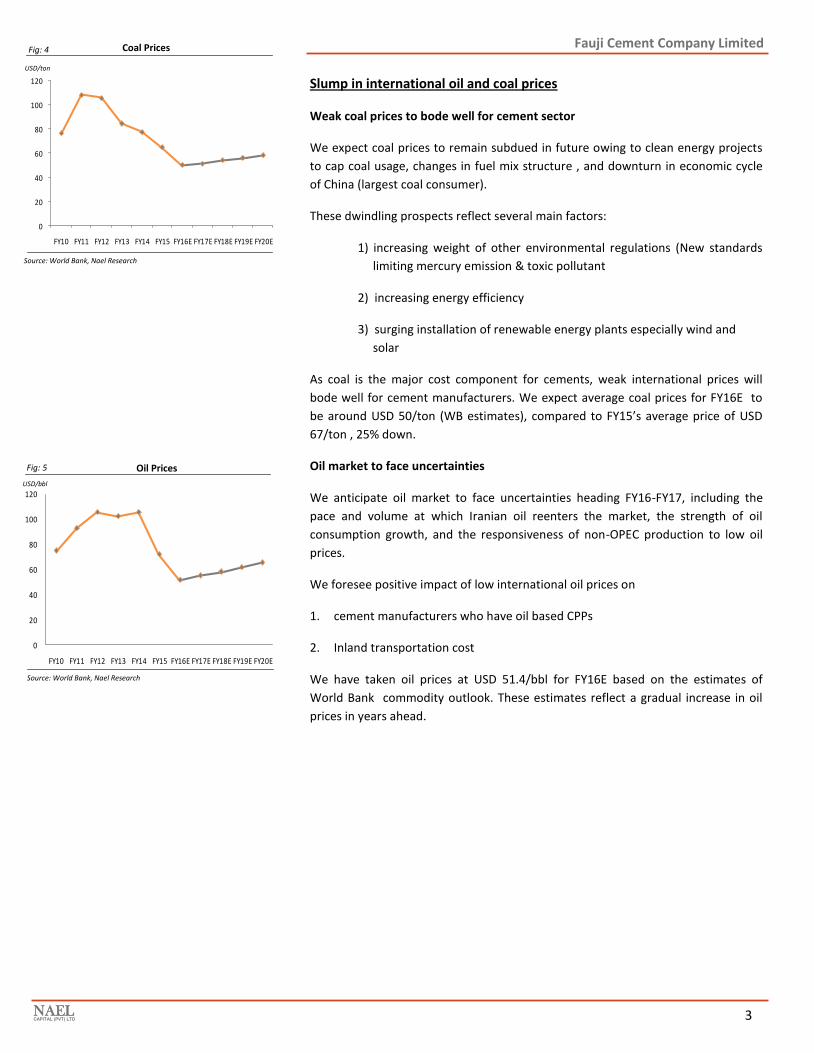
Slump in international oil and coal prices
Weak coal prices to bode well for cement sector
We expect coal prices to remain subdued in future owing to clean energy projects
to cap coal usage, changes in fuel mix structure , and downturn in economic cycle
of China (largest coal consumer).
These dwindling prospects reflect several main factors:
1) increasing weight of other environmental regulations (New standards
limiting mercury emission & toxic pollutant
2) increasing energy efficiency
3) surging installation of renewable energy plants especially wind and
solar
As coal is the major cost component for cements, weak international prices will
bode well for cement manufacturers. We expect average coal prices for FY16E to
be around USD 50/ton (WB estimates), compared to FY15’s average price of USD
67/ton , 25% down.
Oil market to face uncertainties
We anticipate oil market to face uncertainties heading FY16-FY17, including the
pace and volume at which Iranian oil reenters the market, the strength of oil
consumption growth, and the responsiveness of non-OPEC production to low oil
prices.
We foresee positive impact of low international oil prices on
1. cement manufacturers who have oil based CPPs
2. Inland transportation cost
We have taken oil prices at USD 51.4/bbl for FY16E based on the estimates of
World Bank commodity outlook. These estimates reflect a gradual increase in oil
prices in years ahead.
CAPITAL (PVT) LTD NAEL
Fauji Cement Company Limited
Oil Prices
Source: World Bank, Nael Research
Fig: 5
Coal Prices
Source: World Bank, Nael Research
Fig: 4
USD/ton
USD/bbl
0
20
40
60
80
100
120
FY10 FY11 FY12 FY13 FY14 FY15 FY16E FY17E FY18E FY19E FY20E
0
20
40
60
80
100
120
FY10 FY11 FY12 FY13 FY14 FY15 FY16E FY17E FY18E FY19E FY20E
4
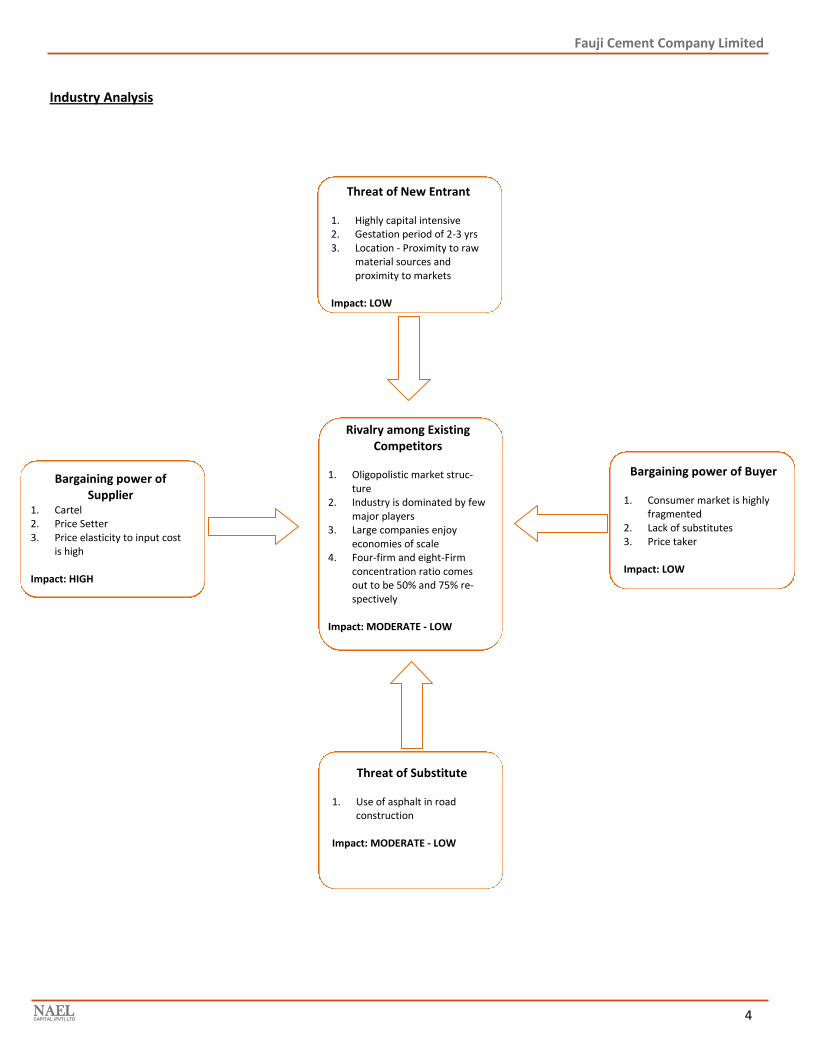
Industry Analysis
Threat of New Entrant 1. Highly capital intensive 2. Gestation period of 2-3 yrs 3. Location - Proximity to raw
material sources and proximity to markets
Impact: LOW
Bargaining power of Supplier
1. Cartel 2. Price Setter 3. Price elasticity to input cost
is high Impact: HIGH
Bargaining power of Buyer 1. Consumer market is highly
fragmented 2. Lack of substitutes 3. Price taker Impact: LOW
Fauji Cement Company Limited
NAEL CAPITAL (PVT) LTD
Rivalry among Existing Competitors
1. Oligopolistic market struc-
ture 2. Industry is dominated by few
major players 3. Large companies enjoy
economies of scale 4. Four-firm and eight-Firm
concentration ratio comes out to be 50% and 75% re-spectively
Impact: MODERATE - LOW
Threat of Substitute 1. Use of asphalt in road
construction Impact: MODERATE - LOW
5
Valuation
We initiate our coverage on FCCL with ‘Buy’ recommendation using discounted free
cash flow method. We have used discounted cash flow (Free Cash Flow) method to
derive the intrinsic value of FCCL at PKR 43.02/sh. We have made the following
assumptions to arrive at the our target price
Terminal growth rate of 4%
Risk free rate of 9.75%, Beta of 1.2 & Market Risk Premium of 6%
Based on above assumptions, FCCL’s Jun-16 PT comes out to be PKR 43.02/share,
offering an upside potential of 21% from its closing price of Nov 9, 2015 with a
dividend yield of 8% for FY16E.
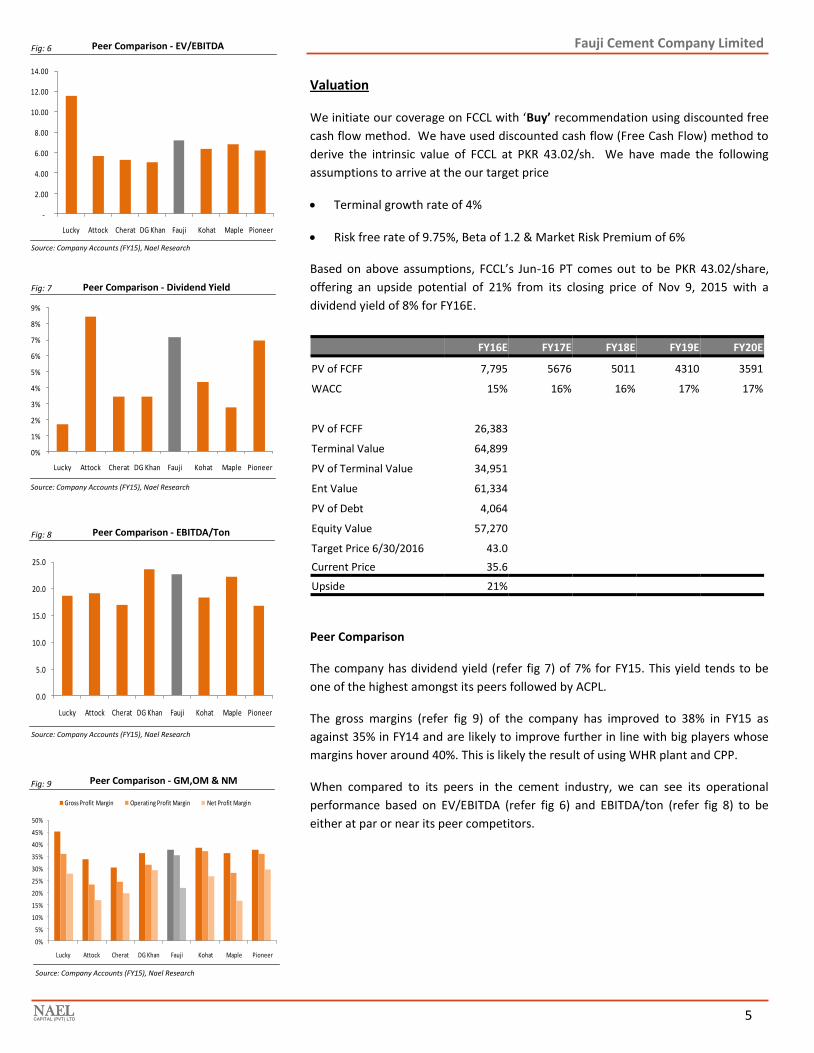
Peer Comparison
The company has dividend yield (refer fig 7) of 7% for FY15. This yield tends to be
one of the highest amongst its peers followed by ACPL.
The gross margins (refer fig 9) of the company has improved to 38% in FY15 as
against 35% in FY14 and are likely to improve further in line with big players whose
margins hover around 40%. This is likely the result of using WHR plant and CPP.
When compared to its peers in the cement industry, we can see its operational
performance based on EV/EBITDA (refer fig 6) and EBITDA/ton (refer fig 8) to be
either at par or near its peer competitors.
Source: Company Accounts (FY15), Nael Research
Source: Company Accounts (FY15), Nael Research
Peer Comparison - EV/EBITDA
Source: Company Accounts (FY15), Nael Research
CAPITAL (PVT) LTD NAEL
Fig: 6
Peer Comparison - Dividend Yield
Peer Comparison - EBITDA/Ton Fig: 8
Fig: 7
FY16E FY17E FY18E FY19E FY20E
PV of FCFF 7,795 5676 5011 4310 3591
WACC 15% 16% 16% 17% 17%
PV of FCFF 26,383
Terminal Value 64,899
PV of Terminal Value 34,951
Ent Value 61,334
PV of Debt 4,064
Equity Value 57,270
Target Price 6/30/2016 43.0
Current Price 35.6
Upside 21%
Peer Comparison - GM,OM & NM Fig: 9
Source: Company Accounts (FY15), Nael Research
Fauji Cement Company Limited
-
2.00
4.00
6.00
8.00
10.00
12.00
14.00
Lucky Attock Cherat DG Khan Fauji Kohat Maple Pioneer
0.0
5.0
10.0
15.0
20.0
25.0
Lucky Attock Cherat DG Khan Fauji Kohat Maple Pioneer
0%
5%
10%
15%
20%
25%
30%
35%
40%
45%
50%
Lucky Attock Cherat DG Khan Fauji Kohat Maple Pioneer
Gross Profit Margin Operating Profit Margin Net Profit Margin
0%
1%
2%
3%
4%
5%
6%
7%
8%
9%
Lucky Attock Cherat DG Khan Fauji Kohat Maple Pioneer
6
FCCL Cement Dispatches
Investment Argument
Our investment view on FCCL is based on strong earnings growth for FY16E-FY18E
based on following fundamentals:
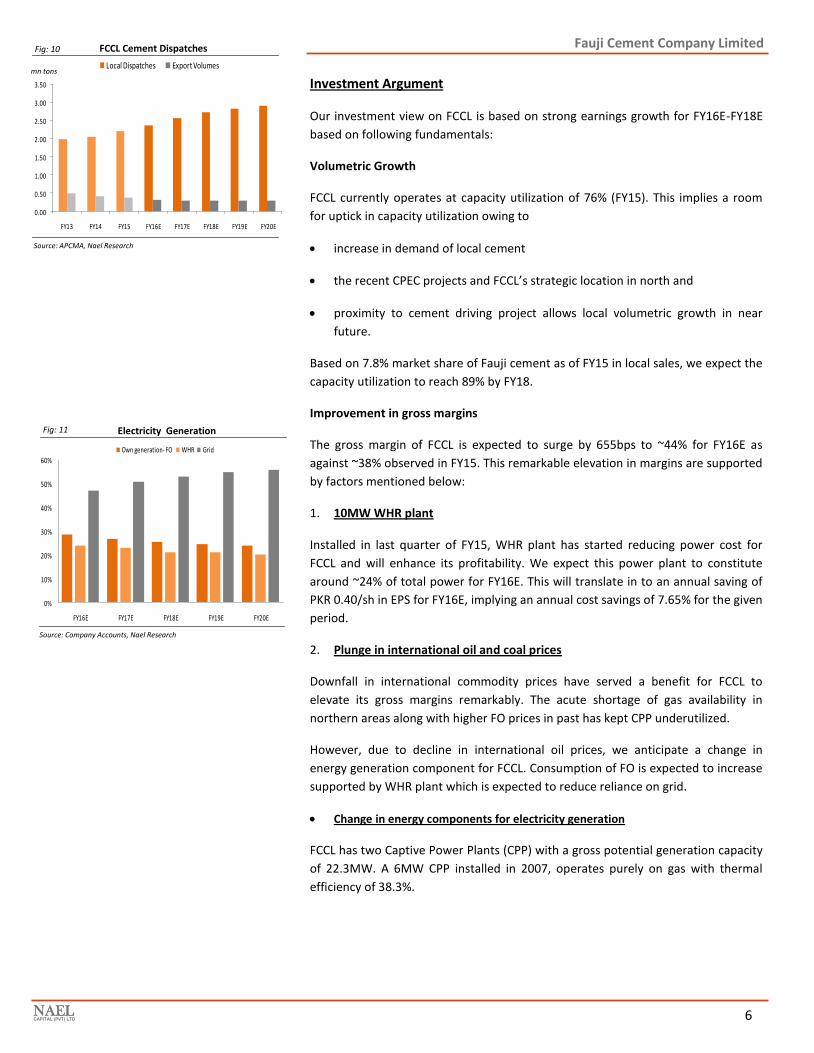
Volumetric Growth
FCCL currently operates at capacity utilization of 76% (FY15). This implies a room
for uptick in capacity utilization owing to
increase in demand of local cement
the recent CPEC projects and FCCL’s strategic location in north and
proximity to cement driving project allows local volumetric growth in near
future.
Based on 7.8% market share of Fauji cement as of FY15 in local sales, we expect the
capacity utilization to reach 89% by FY18.
Improvement in gross margins
The gross margin of FCCL is expected to surge by 655bps to ~44% for FY16E as
against ~38% observed in FY15. This remarkable elevation in margins are supported
by factors mentioned below:
1. 10MW WHR plant
Installed in last quarter of FY15, WHR plant has started reducing power cost for
FCCL and will enhance its profitability. We expect this power plant to constitute
around ~24% of total power for FY16E. This will translate in to an annual saving of
PKR 0.40/sh in EPS for FY16E, implying an annual cost savings of 7.65% for the given
period.
2. Plunge in international oil and coal prices
Downfall in international commodity prices have served a benefit for FCCL to
elevate its gross margins remarkably. The acute shortage of gas availability in
northern areas along with higher FO prices in past has kept CPP underutilized.
However, due to decline in international oil prices, we anticipate a change in
energy generation component for FCCL. Consumption of FO is expected to increase
supported by WHR plant which is expected to reduce reliance on grid.
Change in energy components for electricity generation
FCCL has two Captive Power Plants (CPP) with a gross potential generation capacity
of 22.3MW. A 6MW CPP installed in 2007, operates purely on gas with thermal
efficiency of 38.3%.
CAPITAL (PVT) LTD NAEL
Fig: 10
Source: APCMA, Nael Research
Fauji Cement Company Limited
Electricity Generation Fig: 11
Source: Company Accounts, Nael Research
0%
10%
20%
30%
40%
50%
60%
FY16E FY17E FY18E FY19E FY20E
Own generation- FO WHR Grid
0.00
0.50
1.00
1.50
2.00
2.50
3.00
3.50
FY13 FY14 FY15 FY16E FY17E FY18E FY19E FY20E
Local Dispatches Export Volumesmn tons
7
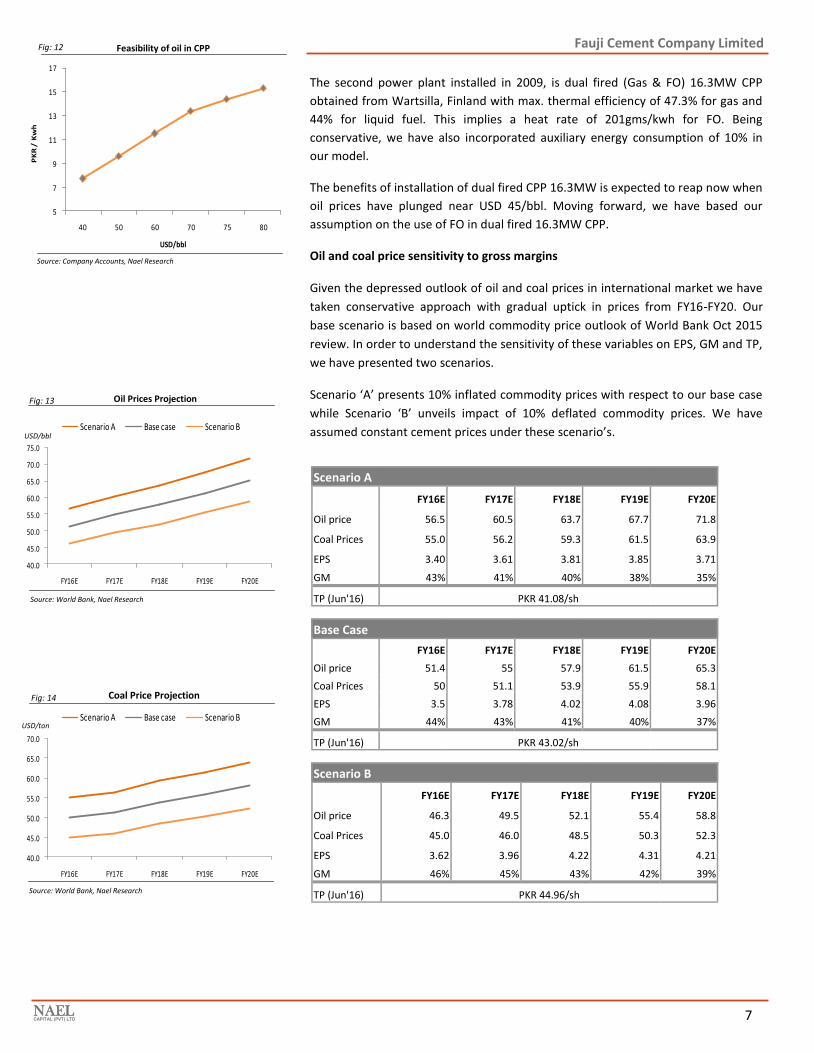
Feasibility of oil in CPP
The second power plant installed in 2009, is dual fired (Gas & FO) 16.3MW CPP
obtained from Wartsilla, Finland with max. thermal efficiency of 47.3% for gas and
44% for liquid fuel. This implies a heat rate of 201gms/kwh for FO. Being
conservative, we have also incorporated auxiliary energy consumption of 10% in
our model.
The benefits of installation of dual fired CPP 16.3MW is expected to reap now when
oil prices have plunged near USD 45/bbl. Moving forward, we have based our
assumption on the use of FO in dual fired 16.3MW CPP.
Oil and coal price sensitivity to gross margins
Given the depressed outlook of oil and coal prices in international market we have
taken conservative approach with gradual uptick in prices from FY16-FY20. Our
base scenario is based on world commodity price outlook of World Bank Oct 2015
review. In order to understand the sensitivity of these variables on EPS, GM and TP,
we have presented two scenarios.
Scenario ‘A’ presents 10% inflated commodity prices with respect to our base case
while Scenario ‘B’ unveils impact of 10% deflated commodity prices. We have
assumed constant cement prices under these scenario’s.
CAPITAL (PVT) LTD NAEL
Fig: 12
Source: Company Accounts, Nael Research
Fauji Cement Company Limited
Scenario A
FY16E FY17E FY18E FY19E FY20E
Oil price 56.5 60.5 63.7 67.7 71.8
Coal Prices 55.0 56.2 59.3 61.5 63.9
EPS 3.40 3.61 3.81 3.85 3.71
GM 43% 41% 40% 38% 35%
TP (Jun'16) PKR 41.08/sh
Oil Prices Projection
Source: World Bank, Nael Research
Fig: 13
Base Case
FY16E FY17E FY18E FY19E FY20E
Oil price 51.4 55 57.9 61.5 65.3
Coal Prices 50 51.1 53.9 55.9 58.1
EPS 3.5 3.78 4.02 4.08 3.96
GM 44% 43% 41% 40% 37%
TP (Jun'16) PKR 43.02/sh
Scenario B
FY16E FY17E FY18E FY19E FY20E
Oil price 46.3 49.5 52.1 55.4 58.8
Coal Prices 45.0 46.0 48.5 50.3 52.3
EPS 3.62 3.96 4.22 4.31 4.21
GM 46% 45% 43% 42% 39%
TP (Jun'16) PKR 44.96/sh Source: World Bank, Nael Research
Coal Price Projection Fig: 14
5
7
9
11
13
15
17
40 50 60 70 75 80
PK
R /
Kw
h
USD/bbl
40.0
45.0
50.0
55.0
60.0
65.0
70.0
75.0
FY16E FY17E FY18E FY19E FY20E
Scenario A Base case Scenario B
40.0
45.0
50.0
55.0
60.0
65.0
70.0
FY16E FY17E FY18E FY19E FY20E
Scenario A Base case Scenario BUSD/ton
USD/bbl
8
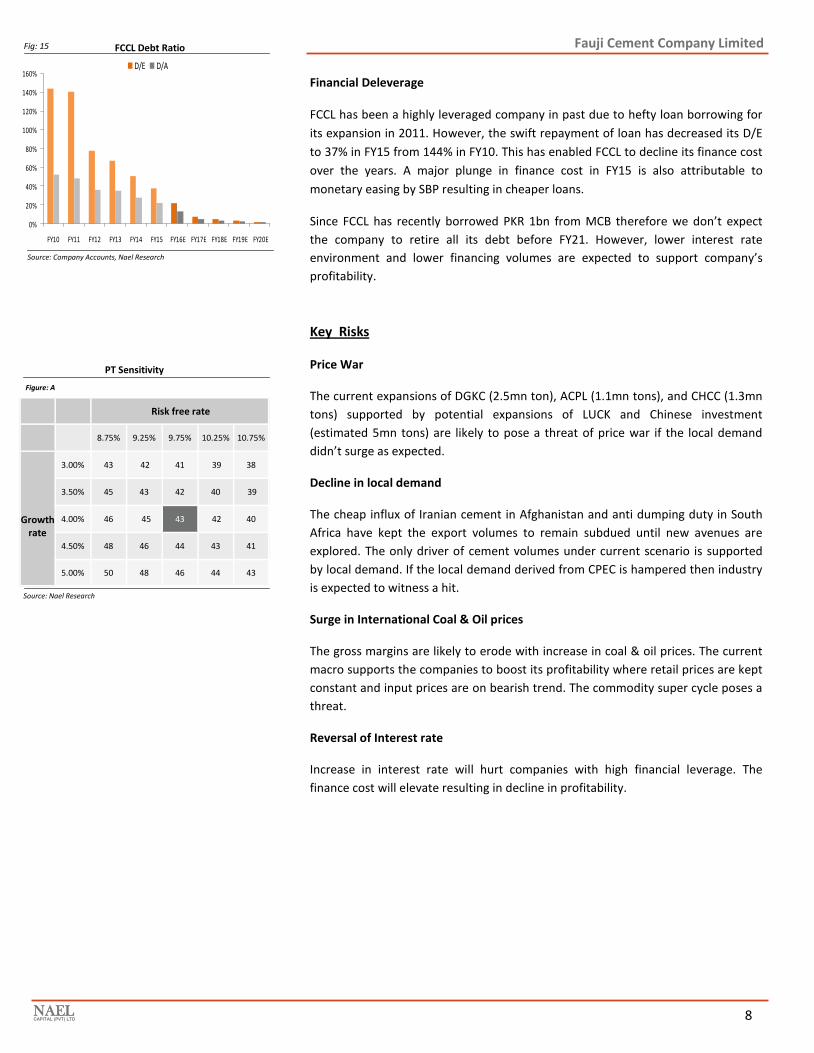
Financial Deleverage
FCCL has been a highly leveraged company in past due to hefty loan borrowing for
its expansion in 2011. However, the swift repayment of loan has decreased its D/E
to 37% in FY15 from 144% in FY10. This has enabled FCCL to decline its finance cost
over the years. A major plunge in finance cost in FY15 is also attributable to
monetary easing by SBP resulting in cheaper loans.
Since FCCL has recently borrowed PKR 1bn from MCB therefore we don’t expect
the company to retire all its debt before FY21. However, lower interest rate
environment and lower financing volumes are expected to support company’s
profitability.
Key Risks
Price War
The current expansions of DGKC (2.5mn ton), ACPL (1.1mn tons), and CHCC (1.3mn
tons) supported by potential expansions of LUCK and Chinese investment
(estimated 5mn tons) are likely to pose a threat of price war if the local demand
didn’t surge as expected.
Decline in local demand
The cheap influx of Iranian cement in Afghanistan and anti dumping duty in South
Africa have kept the export volumes to remain subdued until new avenues are
explored. The only driver of cement volumes under current scenario is supported
by local demand. If the local demand derived from CPEC is hampered then industry
is expected to witness a hit.
Surge in International Coal & Oil prices
The gross margins are likely to erode with increase in coal & oil prices. The current
macro supports the companies to boost its profitability where retail prices are kept
constant and input prices are on bearish trend. The commodity super cycle poses a
threat.
Reversal of Interest rate
Increase in interest rate will hurt companies with high financial leverage. The
finance cost will elevate resulting in decline in profitability.
CAPITAL (PVT) LTD NAEL
Fauji Cement Company Limited
Source: Company Accounts, Nael Research
FCCL Debt Ratio Fig: 15
PT Sensitivity
Source: Nael Research
Figure: A
Risk free rate
8.75% 9.25% 9.75% 10.25% 10.75%
Growth
rate
3.00% 43 42 41 39 38
3.50% 45 43 42 40 39
4.00% 46 45 43 42 40
4.50% 48 46 44 43 41
5.00% 50 48 46 44 43
0%
20%
40%
60%
80%
100%
120%
140%
160%
FY10 FY11 FY12 FY13 FY14 FY15 FY16E FY17E FY18E FY19E FY20E
D/E D/A
9 NAEL CAPITAL (PVT) LTD
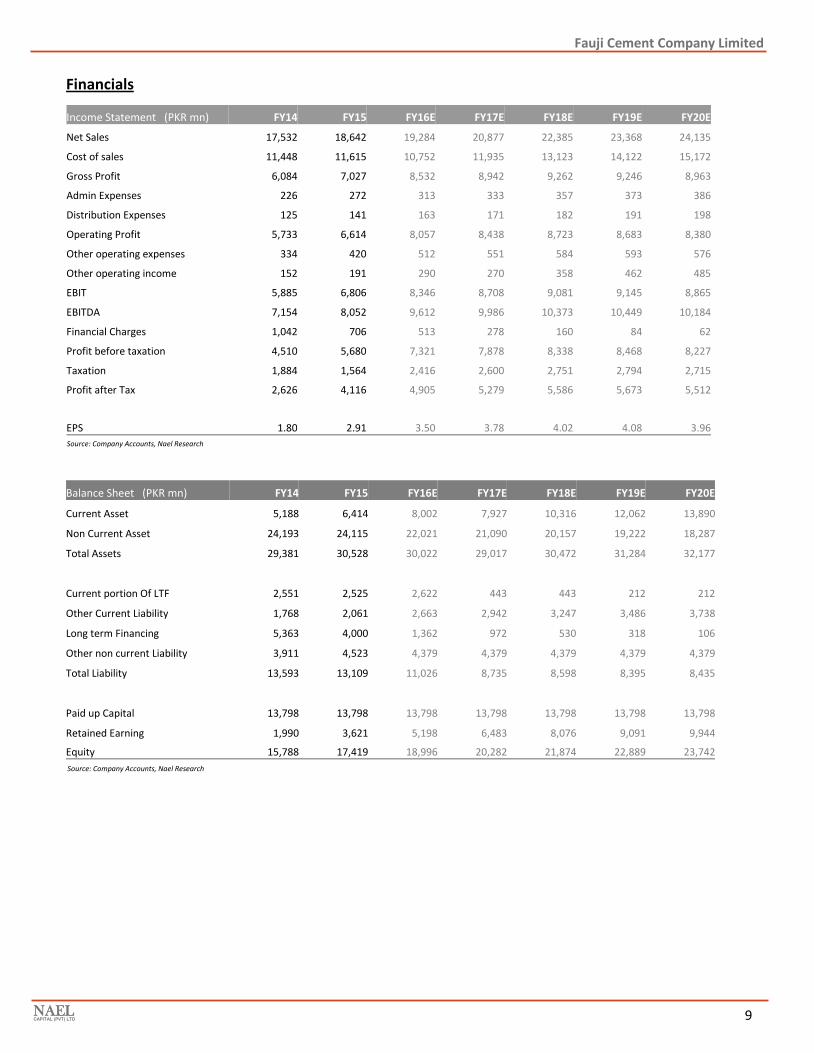
Financials
Source: Company Accounts, Nael Research
Source: Company Accounts, Nael Research
Fauji Cement Company Limited
Income Statement (PKR mn) FY14 FY15 FY16E FY17E FY18E FY19E FY20E
Net Sales 17,532 18,642 19,284 20,877 22,385 23,368 24,135
Cost of sales 11,448 11,615 10,752 11,935 13,123 14,122 15,172
Gross Profit 6,084 7,027 8,532 8,942 9,262 9,246 8,963
Admin Expenses 226 272 313 333 357 373 386
Distribution Expenses 125 141 163 171 182 191 198
Operating Profit 5,733 6,614 8,057 8,438 8,723 8,683 8,380
Other operating expenses 334 420 512 551 584 593 576
Other operating income 152 191 290 270 358 462 485
EBIT 5,885 6,806 8,346 8,708 9,081 9,145 8,865
EBITDA 7,154 8,052 9,612 9,986 10,373 10,449 10,184
Financial Charges 1,042 706 513 278 160 84 62
Profit before taxation 4,510 5,680 7,321 7,878 8,338 8,468 8,227
Taxation 1,884 1,564 2,416 2,600 2,751 2,794 2,715
Profit after Tax 2,626 4,116 4,905 5,279 5,586 5,673 5,512
EPS 1.80 2.91 3.50 3.78 4.02 4.08 3.96
Balance Sheet (PKR mn) FY14 FY15 FY16E FY17E FY18E FY19E FY20E
Current Asset 5,188 6,414 8,002 7,927 10,316 12,062 13,890
Non Current Asset 24,193 24,115 22,021 21,090 20,157 19,222 18,287
Total Assets 29,381 30,528 30,022 29,017 30,472 31,284 32,177
Current portion Of LTF 2,551 2,525 2,622 443 443 212 212
Other Current Liability 1,768 2,061 2,663 2,942 3,247 3,486 3,738
Long term Financing 5,363 4,000 1,362 972 530 318 106
Other non current Liability 3,911 4,523 4,379 4,379 4,379 4,379 4,379
Total Liability 13,593 13,109 11,026 8,735 8,598 8,395 8,435
Paid up Capital 13,798 13,798 13,798 13,798 13,798 13,798 13,798
Retained Earning 1,990 3,621 5,198 6,483 8,076 9,091 9,944
Equity 15,788 17,419 18,996 20,282 21,874 22,889 23,742

10 NAEL CAPITAL (PVT) LTD
Disclosure Related to Author The analyst mentioned on the cover of this report, primarily involved in the preparation of this report, certifies that (1) the views expressed in this report accurately reflect his/her personal views about all of the subject companies/securities and (2) no part of his/her compensation was, is or will be directly or indirectly related to the specific recommendations or views expressed in this report. Disclaimer The report has been prepared by Nael Capital (Pvt.) Ltd and is for information purpose only. The information and opinions contained herein have been compiled or arrived at, based upon information obtained from sources, believed to be reliable and in good faith. Such information has not been independently verified and no guaranty, representation or warranty, expressed or implied is made as to its accuracy, completeness or correctness. All such information and opinions are subject to change without notice. Descriptions of any company or companies or their securities mentioned herein are not intended to be complete and this document is not, and should not be consulted as, an offer, or solicitation of an offer, to buy or sell any securities or other financial instruments. Research Dissemination Policy Nael Capital (Pvt.) Ltd. endeavors to make all reasonable efforts to disseminate research to all eligible clients in a timely manner through either physical or electronic distribution such as mail, fax and/or email. Nevertheless, not all clients may receive the material at the same time. Company Specific Disclosures Nael Capital (Pvt.) Ltd. as per the applicable law or regulation, prohibits its respective directors, officers, representatives, employees and/or related persons to make a purchase and/or sale, or offer to make a purchase and/or sale of any such securities or other financial instruments during the restricted period specified in the company policy. Other Important Disclosures Foreign currency denominated securities is subject to exchange rate fluctuations which could have an adverse effect on their value or price, or the income
derived from them. In addition, investors in securities such as ADRs, the values of which are influenced by foreign currencies effectively assume currency risk.
Stock Recommendation Return
BUY > 15%
HOLD > -15% to < 15%
SELL < -15%
© Copyright 2015, Nael Capital (Pvt.) Ltd. All rights reserved
Chief Executive Officer
Ashraf Bava, CFA
Equity Sales
Muhammad Shakeel, Director Equity Sales
Nasir Muqeet, Institutional Sales
Irshad Ul Haq Khan, Institutional Sales
Research
Sarah Aslam, Research Analyst
Jawad Ameer Ali, Research Analyst
Nimerta Veerban, Research Associate
(92-21) 32461812-13 [email protected]
(92-21) 32461819-22
(92-21) 32461819-22
(92-21) 32461819-22
(92-21) 32461812-13
(92-21) 32461812-13
(92-21) 32461812-13
Fauji Cement Company Limited