Fatigue Testing and Analysis of Aluminum Welds under In...
11
Fatigue Testing and Analysis of Aluminum Welds under In-Service Highway Bridge Loading Conditions Reid Coughlin 1 and Scott Walbridge, Ph.D., P.Eng., M.ASCE 2 Abstract: For the fatigue design of aluminum structures, most applicable international codes specify fatigue-resistance (S-N) curves with slopes that vary, depending on the detail category. This complicates the selection of appropriate damage equivalence factors for use in high- way bridge applications. The existing codes also differ in their treatment of high cycle fatigue, with single-slope S-N curves specified in some cases and multislope curves specified in others. In this paper, a recent investigation conducted to examine the fatigue behavior of aluminum welds under in-service highway bridge loading conditions is summarized. Specifically, calculations performed to establish damage equiv- alence factors for aluminum for use with the AASHTO and Canadian Standards Association (CSA) CAN/CSA-S6 codes are first reviewed. Following this, small-scale fatigue tests of aluminum welds under simulated highway bridge loading conditions are described. A fracture mechanics model is then validated by comparison with the test results and used to perform simulations encompassing a wider range of loading conditions. On the basis of this work, the adequacy of the current design provisions is discussed and possibilities for further extending the employed methodology are identified. DOI: 10.1061/(ASCE)BE.1943-5592.0000223. © 2012 American Society of Civil Engineers. CE Database subject headings: Aluminum; Fatigue; Highway and road structures; Highway bridges; Welding; Load factors. Author keywords: Aluminum; Fatigue; Highway and road structures; Bridges; Welds; Overloads. Introduction The use of aluminum in highway bridges can provide efficient so- lutions in certain cases. Life-cycle cost analyses have shown the economic benefits of using corrosion-resistant aluminum for the replacement of existing bridge decks (Arrien et al. 2001; Siwowski 2006). The rehabilitation of existing bridges by replacing aging concrete decks with new extruded aluminum ones, can significantly increase the live load capacity attributable to the resulting reduction in the dead load. The relative ease of transportation and erection of aluminum bridge components also facilitates accelerated construc- tion applications, as all or part of the structure can be shipped and installed on-site (Das and Kaufman 2007). The long-term performance of aluminum structures can be highly dependent on the fatigue behavior of the welds. In welded aluminum structures, the heat generated during the welding process can reduce the material strength in the heat-affected zone by remov- ing the effects of cold-working. In aluminum and steel structures, initial defects, tensile residual stresses, and the stress concentration attributable to the local change in geometry are known to lead to a reduced fatigue performance in the vicinity of the welds (Menzemer 2000). Large databases of test results have been used to establish the current fatigue design provisions for aluminum welds. Fatigue test results on specific weld details have been reported in several studies (Maddox and Webber 1977; Maddox 1995; Mazzolani and Grillo 1995). Others have compiled test results and discussed the develop- ment of the current fatigue design provisions (Menzemer and Fisher 1995; Jaccard et al. 1995; Soetens et al. 1995; Maddox 2003), which commonly employ fatigue-resistance (S-N) curves and the detail category approach. For the current study, Fig. 1 provides a comparison of design S-N curves from several standards for one fatigue detail—a non-load- carrying fillet welded transverse stiffener. Differences between the curves are apparent in this figure. Multislope curves are used in most cases, in which the high cycle portion of the S-N curve has a shallower slope, indicating that damage under variable ampli- tude (VA) loading beyond the constant amplitude fatigue limit (CAFL) occurs at a reduced rate. The Aluminum Association (AA) design manual (ADM) (AA 2010) employs the simpler ap- proach of extending the S-N curve beyond the CAFL at the same slope. AASHTO (2007) also uses this approach, with a similar set of single-slope S-N curves on the basis of ADM 1986 (Menzemer and Fisher 1995). Although the AASHTO (2007) and ADM (AA 2010) curves have no slope change at the CAFL, they both have an upper limit equal to the stress range at N ¼ 10 5 cycles. This is shown in Fig. 1 as a horizontal line for the ADM (AA 2010) curve. One reason for differences in the current design provisions be- yond the CAFL is that most of the available fatigue data for alu- minum welds has come from tests conducted under constant amplitude (CA) loading conditions. Several references have iden- tified aluminum weld fatigue behavior under VA loading as an area that needs further study (Voutaz et al. 1995; Menzemer 2000; Maddox 2003). In comparison with the data for welded steel struc- tures under such loading conditions, the available data for welded aluminum structures remains limited. Regardless of whether-single slope or multislope S-N curves are used, most standards [with the exception of the International Insti- tute of Welding recommendations (Hobbacher 2005)] use S-N curves for aluminum with slopes in the low cycle domain that vary with the detail category. This can complicate the establishment of 1 Dept. of Civil and Environmental Engineering, Univ. of Waterloo, 200 University Ave. West, Waterloo, Ontario, Canada N2L 3G1. 2 Dept. of Civil and Environmental Engineering, Univ. of Waterloo, 200 University Ave. West, Waterloo, Ontario, Canada N2L 3G1 (corre- sponding author). E-mail: [email protected] Note. This manuscript was submitted on October 1, 2010; approved on January 11, 2011; published online on January 13, 2011. Discussion period open until October 1, 2012; separate discussions must be submitted for in- dividual papers. This paper is part of the Journal of Bridge Engineering, Vol. 17, No. 3, May 1, 2012. ©ASCE, ISSN 1084-0702/2012/3-409–419/ $25.00. JOURNAL OF BRIDGE ENGINEERING © ASCE / MAY/JUNE 2012 / 409 J. Bridge Eng. 2012.17:409-419. Downloaded from ascelibrary.org by University of Waterloo on 10/30/13. Copyright ASCE. For personal use only; all rights reserved.
Transcript of Fatigue Testing and Analysis of Aluminum Welds under In...

Fatigue Testing and Analysis of Aluminum Welds underIn-Service Highway Bridge Loading Conditions
Reid Coughlin1 and Scott Walbridge, Ph.D., P.Eng., M.ASCE2
Abstract: For the fatigue design of aluminum structures, most applicable international codes specify fatigue-resistance (S-N) curves withslopes that vary, depending on the detail category. This complicates the selection of appropriate damage equivalence factors for use in high-way bridge applications. The existing codes also differ in their treatment of high cycle fatigue, with single-slope S-N curves specified in somecases and multislope curves specified in others. In this paper, a recent investigation conducted to examine the fatigue behavior of aluminumwelds under in-service highway bridge loading conditions is summarized. Specifically, calculations performed to establish damage equiv-alence factors for aluminum for use with the AASHTO and Canadian Standards Association (CSA) CAN/CSA-S6 codes are first reviewed.Following this, small-scale fatigue tests of aluminum welds under simulated highway bridge loading conditions are described. A fracturemechanics model is then validated by comparison with the test results and used to perform simulations encompassing a wider range of loadingconditions. On the basis of this work, the adequacy of the current design provisions is discussed and possibilities for further extending theemployed methodology are identified. DOI: 10.1061/(ASCE)BE.1943-5592.0000223. © 2012 American Society of Civil Engineers.
CE Database subject headings: Aluminum; Fatigue; Highway and road structures; Highway bridges; Welding; Load factors.
Author keywords: Aluminum; Fatigue; Highway and road structures; Bridges; Welds; Overloads.
Introduction
The use of aluminum in highway bridges can provide efficient so-lutions in certain cases. Life-cycle cost analyses have shown theeconomic benefits of using corrosion-resistant aluminum for thereplacement of existing bridge decks (Arrien et al. 2001; Siwowski2006). The rehabilitation of existing bridges by replacing agingconcrete decks with new extruded aluminum ones, can significantlyincrease the live load capacity attributable to the resulting reductionin the dead load. The relative ease of transportation and erection ofaluminum bridge components also facilitates accelerated construc-tion applications, as all or part of the structure can be shipped andinstalled on-site (Das and Kaufman 2007).
The long-term performance of aluminum structures can behighly dependent on the fatigue behavior of the welds. In weldedaluminum structures, the heat generated during the welding processcan reduce the material strength in the heat-affected zone by remov-ing the effects of cold-working. In aluminum and steel structures,initial defects, tensile residual stresses, and the stress concentrationattributable to the local change in geometry are known to lead toa reduced fatigue performance in the vicinity of the welds(Menzemer 2000).
Large databases of test results have been used to establish thecurrent fatigue design provisions for aluminum welds. Fatigue testresults on specific weld details have been reported in several studies
(Maddox and Webber 1977; Maddox 1995; Mazzolani and Grillo1995). Others have compiled test results and discussed the develop-ment of the current fatigue design provisions (Menzemer andFisher 1995; Jaccard et al. 1995; Soetens et al. 1995; Maddox2003), which commonly employ fatigue-resistance (S-N) curvesand the detail category approach.
For the current study, Fig. 1 provides a comparison of design S-Ncurves from several standards for one fatigue detail—a non-load-carrying fillet welded transverse stiffener. Differences betweenthe curves are apparent in this figure. Multislope curves are usedin most cases, in which the high cycle portion of the S-N curvehas a shallower slope, indicating that damage under variable ampli-tude (VA) loading beyond the constant amplitude fatigue limit(CAFL) occurs at a reduced rate. The Aluminum Association(AA) design manual (ADM) (AA 2010) employs the simpler ap-proach of extending the S-N curve beyond the CAFL at the sameslope. AASHTO (2007) also uses this approach, with a similar set ofsingle-slope S-N curves on the basis of ADM 1986 (Menzemer andFisher 1995). Although the AASHTO (2007) and ADM (AA 2010)curves have no slope change at the CAFL, they both have an upperlimit equal to the stress range at N ¼ 105 cycles. This is shown inFig. 1 as a horizontal line for the ADM (AA 2010) curve.
One reason for differences in the current design provisions be-yond the CAFL is that most of the available fatigue data for alu-minum welds has come from tests conducted under constantamplitude (CA) loading conditions. Several references have iden-tified aluminum weld fatigue behavior under VA loading as an areathat needs further study (Voutaz et al. 1995; Menzemer 2000;Maddox 2003). In comparison with the data for welded steel struc-tures under such loading conditions, the available data for weldedaluminum structures remains limited.
Regardless of whether-single slope or multislope S-N curves areused, most standards [with the exception of the International Insti-tute of Welding recommendations (Hobbacher 2005)] use S-Ncurves for aluminum with slopes in the low cycle domain that varywith the detail category. This can complicate the establishment of
1Dept. of Civil and Environmental Engineering, Univ. of Waterloo,200 University Ave. West, Waterloo, Ontario, Canada N2L 3G1.
2Dept. of Civil and Environmental Engineering, Univ. of Waterloo,200 University Ave. West, Waterloo, Ontario, Canada N2L 3G1 (corre-sponding author). E-mail: [email protected]
Note. This manuscript was submitted on October 1, 2010; approved onJanuary 11, 2011; published online on January 13, 2011. Discussion periodopen until October 1, 2012; separate discussions must be submitted for in-dividual papers. This paper is part of the Journal of Bridge Engineering,Vol. 17, No. 3, May 1, 2012. ©ASCE, ISSN 1084-0702/2012/3-409–419/$25.00.
JOURNAL OF BRIDGE ENGINEERING © ASCE / MAY/JUNE 2012 / 409
J. Bridge Eng. 2012.17:409-419.
Dow
nloa
ded
from
asc
elib
rary
.org
by
Uni
vers
ity o
f W
ater
loo
on 1
0/30
/13.
Cop
yrig
ht A
SCE
. For
per
sona
l use
onl
y; a
ll ri
ghts
res
erve
d.
design factors for applications such as highway bridge design, inparticular when these factors are dependent on the assumed S-Ncurve-slope.
In many highway bridge design codes, the calculated designstress ranges are multiplied by a damage equivalence factor, forexample, to account for differences in the fatigue damage attribut-able to the code truck and the expected real traffic. In the AASHTO(2007) and Canadian Standards Association (CSA 2006) CAN/CSA-S6 codes, damage equivalence factors have been establishedfor use with S-N curves that have a single-slope of m ¼ 3:0.Although suitable for steel, the appropriateness of these factorsfor use with aluminum S-N curves with slopes m > 3:0 isquestionable.
A new chapter of the CAN/CSA-S6 code for the design of alu-minum highway bridge structures is currently under development.To further study the issues raised in the preceding paragraphswithin the context of the development of this new code chapter,an investigation was recently undertaken (Coughlin 2010), theresults of which are summarized in this paper. First, this paper re-views calculations performed to establish damage equivalence fac-tors for aluminum for use with the AASHTO and CAN/CSA-S6codes. Following this, small-scale fatigue tests of aluminum weldsunder simulated highway bridge loading conditions are described.A fracture mechanics model is then validated by comparison withthe test results and used to perform simulations encompassing awider range of influence lines and bridge spans. On the basisof this work, the adequacy of the current design provisions isdiscussed.
The scope of the fatigue testing and fracture mechanics analysispresented in this paper is limited to a single detail category andanalyzed by using a deterministic analytical model. However, thismethodology can be extended to other detail categories, large-scalespecimens, and a probabilistic analytical format, as discussed in theConclusions.
Fatigue Damage Equivalence Factors
Correction factors are employed in a number of highway bridgecodes for relating the fatigue damage attributable to the real trafficto that predicted by a simplified design model. In AASHTO (2007)and CAN/CSA-S6 (CSA 2006), this objective is achieved with twofactors—a damage equivalence factor, γ ¼ 0:75 in AASHTO or
λ ¼ 0:52 in CAN/CSA-S6, and a second factor, n in AASHTOor Nd in CAN/CSA-S6, to consider the expected number of stresscycles per truck passage.
The basis for γ ¼ 0:75 in AASHTO (2007) is provided in(Moses et al. 1987), wherein a fatigue design truck is proposed witha gross vehicle weight (GVW) that is 0.75 times that of the codetruck for static design. This factor was determined by taking theGVW histogram from a survey of 27,513 trucks (Snyder et al.1985) and calculating the equivalent weight of the fatigue designtruck using the following expression:
Weq ¼�X
f i ·W3i
�1∕3 ð1Þ
where f i = frequency associated with the GVW, which is repre-sented by Wi. This formula is a rearrangement of the well-knownMiner’s sum with m ¼ 3:0 assumed as the slope of the S-N curve.
In CAN/CSA-S6, the derivation of this factor for steel involvedconsideration of the differences in the Canadian and American realtraffic, code trucks, and dynamic load allowances (DLAs). Thederivation was verified by performing analyses of histograms forvarious load effects provided in the CAN/CSA-S6 calibrationreport (Agarwal et al. 2007).
For the fatigue design of aluminum structures, ADM (AA 2010)uses single-slope S-N curves, with slopes ranging from 3:42 ≤m ≤ 6:85. The corresponding AASHTO (2007) slopes range from3:42 ≤ m ≤ 6:45. To evaluate the appropriateness of the currentdamage equivalence factors in AASHTO (2007) and CAN/CSA-S6 (CSA 2006) for use with S-N curves in which m > 3:0, a meth-odology was employed that has the advantage over the use ofEq. (1)—or variations thereof—and can account for the effectsof varying axle group weights and truck configurations for differentbridge structure (or component) spans and influence lines. Theemployed methodology is the same one used to calibrate thedamage equivalence factor, λ1, in the Swiss steel structures code[Swiss Society of Engineers and Architects (SIA) 2003]. An over-view can be found in Hirt et al. (2006).
Calculation Inputs and Methodology
The following information is required to calculate the damageequivalence factor by using the employed methodology: (1) a codetruck model, (2) real traffic data for the region of interest, (3) influ-ence lines for various critical locations in bridges, and (4) a designservice life and expected traffic volume. In fact, if the calculationis for a single-slope S-N curve, the fourth item is not required,because the result is independent of the fatigue life (N).
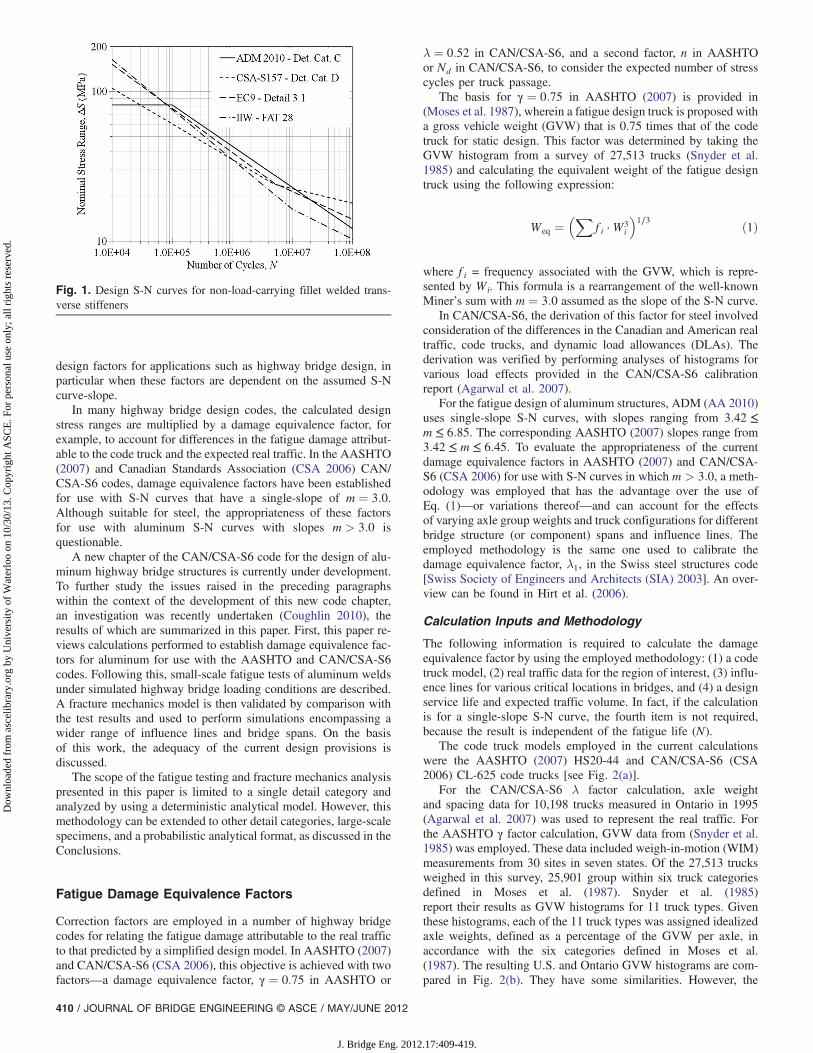
The code truck models employed in the current calculationswere the AASHTO (2007) HS20-44 and CAN/CSA-S6 (CSA2006) CL-625 code trucks [see Fig. 2(a)].
For the CAN/CSA-S6 λ factor calculation, axle weightand spacing data for 10,198 trucks measured in Ontario in 1995(Agarwal et al. 2007) was used to represent the real traffic. Forthe AASHTO γ factor calculation, GVW data from (Snyder et al.1985) was employed. These data included weigh-in-motion (WIM)measurements from 30 sites in seven states. Of the 27,513 trucksweighed in this survey, 25,901 group within six truck categoriesdefined in Moses et al. (1987). Snyder et al. (1985)report their results as GVW histograms for 11 truck types. Giventhese histograms, each of the 11 truck types was assigned idealizedaxle weights, defined as a percentage of the GVW per axle, inaccordance with the six categories defined in Moses et al.(1987). The resulting U.S. and Ontario GVW histograms are com-pared in Fig. 2(b). They have some similarities. However, the
Fig. 1. Design S-N curves for non-load-carrying fillet welded trans-verse stiffeners
410 / JOURNAL OF BRIDGE ENGINEERING © ASCE / MAY/JUNE 2012
J. Bridge Eng. 2012.17:409-419.
Dow
nloa
ded
from
asc
elib
rary
.org
by
Uni
vers
ity o
f W
ater
loo
on 1
0/30
/13.
Cop
yrig
ht A
SCE
. For
per
sona
l use
onl
y; a
ll ri
ghts
res
erve
d.
histogram from Agarwal et al. (2007) is clearly skewed to the right,indicating larger percentages of eavier trucks.
The following influence lines were used in the damage equiv-alence factor calculation: positive moment at the midspan for 1-, 2-,and 5-span girders (ps-m, p2tr-m, and p5tr-m, respectively); neg-ative moment at the intermediate support for 2- and 5-span girders(p2tr-a and p5tr-a, respectively); and support reaction for 1- and2-span girders (ps-r and p2tr-r, respectively). Equal spans were as-sumed in all cases, except that for the 5-span girders, 20% shorterend spans were assumed.
Calculations were performed by using the seven examined in-fluence lines and considering spans from L ¼ 2 to 60 m. Thesespans were chosen to cover a wide range of bridge components,from deck elements up to medium span bridge girders. A programwas written in FORTRAN 95 to perform the analysis. In brief, thecalculation procedure involves generating load effect range histo-grams for each span and influence line attributable to the real trafficdatabase (by moving each truck in the database across the influenceline in succession and calculating stress ranges by using the rain-flow method), and then comparing them to corresponding designload effect ranges attributable to a single passage of the code truck.To do this, the vertical positions of the S-N curve required to pro-duce a damage index, D ¼ 1:0 (on the basis of Miner’s sum) underthe real traffic histogram and under CA loading at the design loadeffect range are characterized by M as follows:
logðNÞ ¼ logðMÞ � m · logðΔSÞ ð2Þ
where ΔS = nominal stress range (assumed to be proportional tothe load effect range). Once the two values of M are calculated(Mreal for the real traffic histogram andMcode for the CA code truckrange), the damage equivalence factor is calculated as
γðor λÞ ¼�Mreal
Mcode
�1∕m
ð3Þ
By using this approach, results can be obtained without know-ing the actual nominal stress ranges, because the factor relatingthe load effects to the nominal stresses cancels out in Eq. (3). Fur-ther details regarding this calculation procedure are provided byCoughlin (2010).
Typical Calculation Results
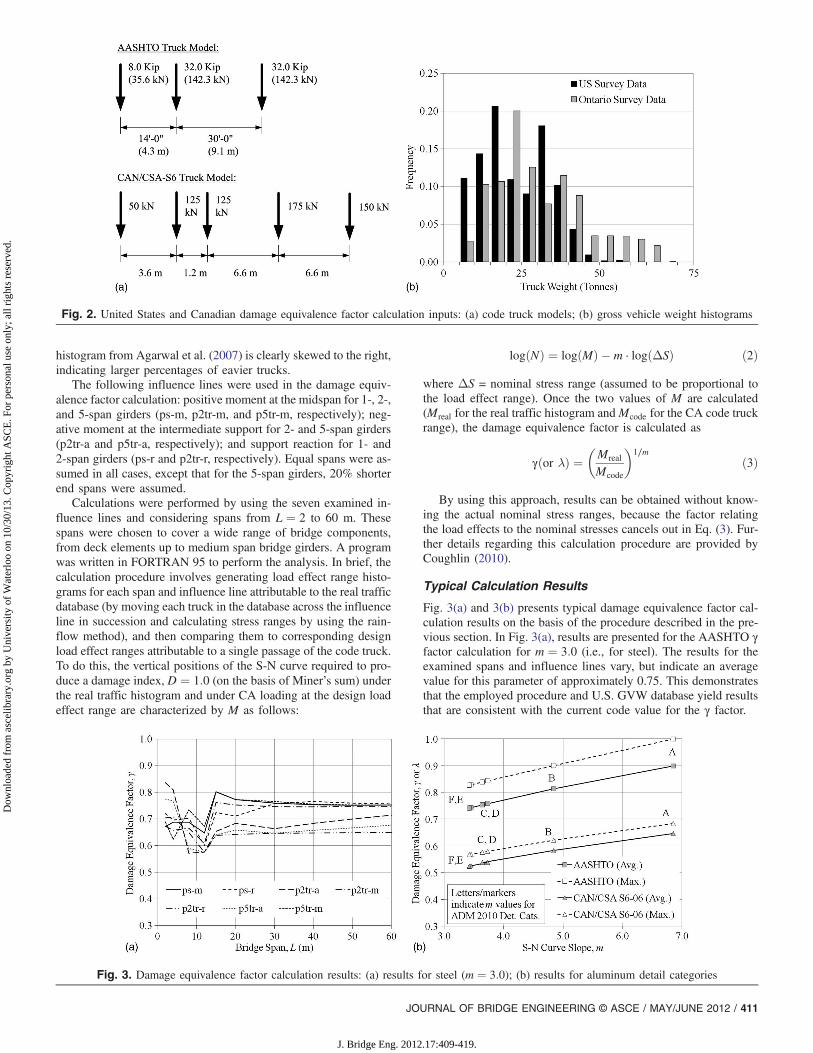
Fig. 3(a) and 3(b) presents typical damage equivalence factor cal-culation results on the basis of the procedure described in the pre-vious section. In Fig. 3(a), results are presented for the AASHTO γfactor calculation for m ¼ 3:0 (i.e., for steel). The results for theexamined spans and influence lines vary, but indicate an averagevalue for this parameter of approximately 0.75. This demonstratesthat the employed procedure and U.S. GVW database yield resultsthat are consistent with the current code value for the γ factor.
Fig. 2. United States and Canadian damage equivalence factor calculation inputs: (a) code truck models; (b) gross vehicle weight histograms
Fig. 3. Damage equivalence factor calculation results: (a) results for steel (m ¼ 3:0); (b) results for aluminum detail categories
JOURNAL OF BRIDGE ENGINEERING © ASCE / MAY/JUNE 2012 / 411
J. Bridge Eng. 2012.17:409-419.
Dow
nloa
ded
from
asc
elib
rary
.org
by
Uni
vers
ity o
f W
ater
loo
on 1
0/30
/13.
Cop
yrig
ht A
SCE
. For
per
sona
l use
onl
y; a
ll ri
ghts
res
erve
d.

In Fig. 3(b), the results of similar calculations for m ¼ 3:45 to6.85 are summarized in plots of γ versus m. To generate the plottedcurves, the average and maximum values of γ for all of theinfluence lines between spans of 15 and 60 m were calculatedfor each value of m.
As shown in Fig. 3(b), the plotted data points correspond withthe m values for detail categories A to F in ADM (AA 2010). TheAASHTO (2007) m values differ somewhat from these. However,the ADM (AA 2010) S-N curves were calibrated with more recentdata (Menzemer and Fisher 1995), and are thus assumed to be moreup-to-date. In any case, the curves in Fig. 3(b) can be used to de-termine suitable γ values for any value of m within the investi-gated range.
In Fig. 3(b), similar curves are plotted of the λ factor for use inCAN/CSA-S6. In both cases, the average curves appear to convergeon the current values for steel at m ¼ 3:0. For ADM (AA 2010)detail categories C to F, average damage equivalence factors onlyslightly larger than the steel factors are calculated. For detail cat-egories A and B, or m greater than ∼4:5, the calculated factors aresubstantially larger. On this basis, it can be concluded that a higherdamage equivalence factor may be appropriate for these cases.
Additional calculations employing variations of this methodol-ogy are described by Coughlin (2010) for the multislope S-Ncurves from CSA-S157 (CSA 2005) and to investigate the effectsof periodic overload trucks and simultaneous vehicle crossings. Inthe paper by Coughlin (2010), further studies are recommended,employing larger, more recent traffic databases and a more sophis-ticated simultaneous vehicle crossing model. However, the γ and
λ curves in Fig. 3(b) are immediately useful, as they are expectedto provide a level of safety for the fatigue design of aluminumbridge structures consistent with that provided by the current valuesfor steel.
Laboratory Testing of Aluminum Welds
Fatigue Test Program
The testing program conducted for this investigation included thefatigue tests of 31 small-scale, non-load-carrying fillet weldedtransverse stiffener details under CA and VA loading conditions(see Table 1). All specimens were loaded axially (see Fig. 4).Testing under CA loading was conducted at R-ratios of �1:0,0.4, and 0.1, and at various stress ranges, ΔS.
Testing under VA loading was conducted by using two stresshistories derived from the 1995 Ontario traffic data (Agarwal et al.2007) to simulate in-service loading conditions. Given this data,two 200 peak sample histories were randomly extracted fromthe larger histories generated for the CAN/CSA-S6 damage equiv-alence factor calculation. Specifically, the following cases wereconsidered: the midspan moment of a 40 m girder (ps-m-40)and the support reaction of a 15 m girder (ps-r-15). The two stresshistories are compared in Fig. 5. For the ps-m-40 history, thepassage of each truck generally results in only a single load cycle,because the bridge span is much longer than the truck length. Forthe ps-r-15 history, each axle load tends to cause a small cycle as itcomes on or off the girder. The result is that for the first history, thestress ratio, R, is approximately constant, whereas for thesecond, this parameter varies considerably.
The test specimens were fabricated from 3∕8 in. (9.5 mm) thick6061-T651 aluminum plates with transverse attachments filletwelded at the midheight. All welded joints were fabricated bygas metal arc welding (GMAW) with 5356 aluminum weld metalfiller. Eight 300-mm wide stiffened panels were fabricated andthen saw-cut into five 50-mm wide specimens per panel.
Fatigue testing of all specimens was undertaken under load con-trol by using an MTS 810 materials testing system (load capacity�100 kN), equipped with hydraulic control, hydraulic power, andhydraulic actuated grips. The duration of each test was governedby the specimen’s fatigue life at a cycling frequency of 8 Hz;
Table 1. Fatigue Test Program
ΔS or ΔSeq R Loading Specimens
MPa — — #
70, 80, 90, 100, 120, 150, 170, 200 �1:0 CA 8
60, 70, 80, 90 0.1 CA 4
50, 60, 70, 80 0.4 CA 4
20, 30, 40, 60, 75 — ps-m-40 9
30, 75 — ps-r-15 6
Note: Reported stress ranges are target values. Actual, tested stress rangesare plotted in Fig. 6.
Fig. 4. Fatigue specimen geometry and test setup
412 / JOURNAL OF BRIDGE ENGINEERING © ASCE / MAY/JUNE 2012
J. Bridge Eng. 2012.17:409-419.
Dow
nloa
ded
from
asc
elib
rary
.org
by
Uni
vers
ity o
f W
ater
loo
on 1
0/30
/13.
Cop
yrig
ht A
SCE
. For
per
sona
l use
onl
y; a
ll ri
ghts
res
erve
d.

the only exceptions to this test speed were the VA loading tests at16.5 MPa and 30 MPa, which were conducted at 28 Hz. The testingfrequencies at these lower stress ranges were increased to facilitatethe extended duration of testing.
Fatigue Test Results
Fig. 6 presents a log-log S-N plot of the fatigue test results under CAand VA loading, along with the ADM (AA 2010) detail category Cdesign curve, for comparison purposes. The CA test results forR ¼ 0:1 and 0.4 show limited scatter and generally fall along straightlines on the S-N plot. In contrast, noticeable scatter is apparent, in theCA test results for R ¼ �1:0. The test results for R ¼ �1:0 and 0.1all lie above the ADM (AA 2010) detail category C design curve.However, some of the test results for R ¼ 0:4 fall below the curve.
The VA loading results are plotted by using an equivalent stressrange on the basis of Miner’s sum with m ¼ 3:64, which is theslope of the ADM (AA 2010) detail category C design curve
ΔSeq ¼�P
ni ·ΔSmiPNi
�1∕m
ð4Þ
The results at the higher stress levels (ΔS≈ 75 MPa) show lim-ited scatter and little difference between the two load histories. Theresults at the lower stress levels (ΔS≈ 30 MPa) show more scatterand a noticeable difference in fatigue performance for the twohistories.
Materials Tests
Static tension tests were performed in accordance with ASTM(2004) on three as-received (T651) and two annealed (O) coupons.The annealed coupons were heat treated, in accordance with ASTM(2009). The resulting average elastic modulus (E), yield (σy), andultimate strength ðσuÞ values are summarized in Table 2. The differ-ence in σy and σu for the two tempering cases (T651 and O) is clearin this table—both values are much higher for the as-receivedcoupons. The yield point was clearly defined for the as-receivedcoupons. For the annealed coupons, the yield point was not clearlydefined; thus, the 0.2% rule was used to determine the yield stress.
Cyclic materials tests were conducted to determine the cyclicRamberg-Osgood material constants (K 0 and n0) for the T651and O tempers. These tests were performed on polished smoothcylindrical, variable width specimens that have a 5.0 mm diameterwithin the 7.6 mm (0.3 in.) gauge length. The testing was con-ducted by imposing strain cycles (10 per strain level) at R ¼�1:0 in increments of 0.1% up to�1:0% strain and then back downto �0:1% strain, and repeating until the load stabilized for eachstrain level. The constants K 0 and n0 were then determined by fittingthe cyclic Ramberg-Osgood model to the stabilized stress-straindata. The average results of the cyclic materials tests are summa-rized in Table 2.
Microhardness measurements of the T651 and O temper basemetal, and the HAZ and the weld metal (WM) itself, wereperformed in accordance with ASTM (2003). Average Vickershardness (HV) numbers of 109.8 and 51.0 were obtained for theT651 and O temper base metal, respectively. The lower hardnessfor the O temper is consistent with the expected softening effectattributable to the annealing. Microhardness measurementsalso were taken at multiple locations along a fatigue specimen
Fig. 5. Simulated in-service load histories: (a) ps-m-40 loading; (b) ps-r-15 loading
Fig. 6. Fatigue test S-N results
Table 2. Tested and Estimated Material Properties
Material
T651 O HAZ Units
Vickers hardness 109.8 51.0 74.8 HV
E 70,451 60,937 64,807a MPa
σy 287.5 60.9 153.0a MPa
σu 308.8 119.1 196.3a MPa
K 0 459.7 230.4 316.0a MPa
n0 0.07 0.16 0.11a —
aEstimated on the basis of Vickers hardness.
JOURNAL OF BRIDGE ENGINEERING © ASCE / MAY/JUNE 2012 / 413
J. Bridge Eng. 2012.17:409-419.
Dow
nloa
ded
from
asc
elib
rary
.org
by
Uni
vers
ity o
f W
ater
loo
on 1
0/30
/13.
Cop
yrig
ht A
SCE
. For
per
sona
l use
onl
y; a
ll ri
ghts
res
erve
d.
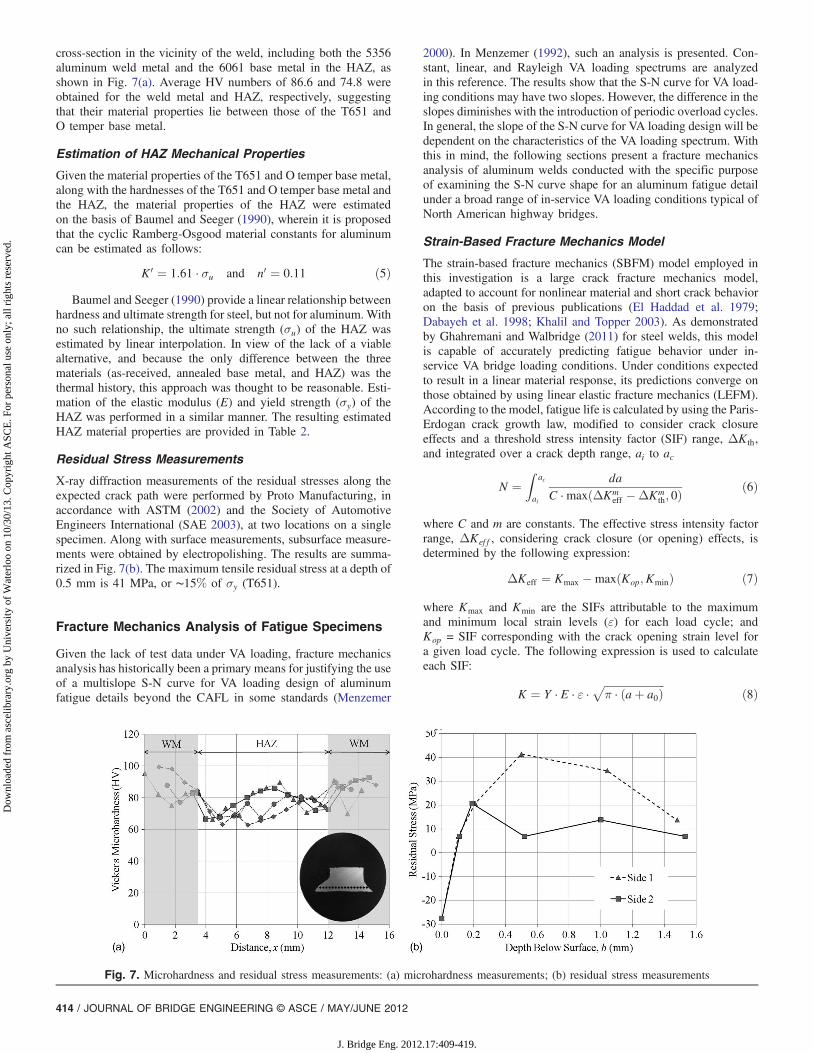
cross-section in the vicinity of the weld, including both the 5356aluminum weld metal and the 6061 base metal in the HAZ, asshown in Fig. 7(a). Average HV numbers of 86.6 and 74.8 wereobtained for the weld metal and HAZ, respectively, suggestingthat their material properties lie between those of the T651 andO temper base metal.
Estimation of HAZ Mechanical Properties
Given the material properties of the T651 and O temper base metal,along with the hardnesses of the T651 and O temper base metal andthe HAZ, the material properties of the HAZ were estimatedon the basis of Baumel and Seeger (1990), wherein it is proposedthat the cyclic Ramberg-Osgood material constants for aluminumcan be estimated as follows:
K 0 ¼ 1:61 · σu and n0 ¼ 0:11 ð5ÞBaumel and Seeger (1990) provide a linear relationship between
hardness and ultimate strength for steel, but not for aluminum.Withno such relationship, the ultimate strength (σu) of the HAZ wasestimated by linear interpolation. In view of the lack of a viablealternative, and because the only difference between the threematerials (as-received, annealed base metal, and HAZ) was thethermal history, this approach was thought to be reasonable. Esti-mation of the elastic modulus (E) and yield strength (σy) of theHAZ was performed in a similar manner. The resulting estimatedHAZ material properties are provided in Table 2.
Residual Stress Measurements
X-ray diffraction measurements of the residual stresses along theexpected crack path were performed by Proto Manufacturing, inaccordance with ASTM (2002) and the Society of AutomotiveEngineers International (SAE 2003), at two locations on a singlespecimen. Along with surface measurements, subsurface measure-ments were obtained by electropolishing. The results are summa-rized in Fig. 7(b). The maximum tensile residual stress at a depth of0.5 mm is 41 MPa, or ∼15% of σy (T651).
Fracture Mechanics Analysis of Fatigue Specimens
Given the lack of test data under VA loading, fracture mechanicsanalysis has historically been a primary means for justifying the useof a multislope S-N curve for VA loading design of aluminumfatigue details beyond the CAFL in some standards (Menzemer
2000). In Menzemer (1992), such an analysis is presented. Con-stant, linear, and Rayleigh VA loading spectrums are analyzedin this reference. The results show that the S-N curve for VA load-ing conditions may have two slopes. However, the difference in theslopes diminishes with the introduction of periodic overload cycles.In general, the slope of the S-N curve for VA loading design will bedependent on the characteristics of the VA loading spectrum. Withthis in mind, the following sections present a fracture mechanicsanalysis of aluminum welds conducted with the specific purposeof examining the S-N curve shape for an aluminum fatigue detailunder a broad range of in-service VA loading conditions typical ofNorth American highway bridges.
Strain-Based Fracture Mechanics Model
The strain-based fracture mechanics (SBFM) model employed inthis investigation is a large crack fracture mechanics model,adapted to account for nonlinear material and short crack behavioron the basis of previous publications (El Haddad et al. 1979;Dabayeh et al. 1998; Khalil and Topper 2003). As demonstratedby Ghahremani and Walbridge (2011) for steel welds, this modelis capable of accurately predicting fatigue behavior under in-service VA bridge loading conditions. Under conditions expectedto result in a linear material response, its predictions converge onthose obtained by using linear elastic fracture mechanics (LEFM).According to the model, fatigue life is calculated by using the Paris-Erdogan crack growth law, modified to consider crack closureeffects and a threshold stress intensity factor (SIF) range, ΔK th,and integrated over a crack depth range, ai to ac
N ¼Z
ac
ai
daC · maxðΔKm
eff �ΔKmth; 0Þ
ð6Þ
where C and m are constants. The effective stress intensity factorrange, ΔKef f , considering crack closure (or opening) effects, isdetermined by the following expression:
ΔKeff ¼ Kmax �maxðKop;KminÞ ð7Þ
where Kmax and Kmin are the SIFs attributable to the maximumand minimum local strain levels (ε) for each load cycle; andKop = SIF corresponding with the crack opening strain level fora given load cycle. The following expression is used to calculateeach SIF:
K ¼ Y · E · ε ·ffiffiffiffiffiffiffiffiffiffiffiffiffiffiffiffiffiffiffiffiffiffiffiπ · ðaþ a0Þ
pð8Þ
Fig. 7. Microhardness and residual stress measurements: (a) microhardness measurements; (b) residual stress measurements
414 / JOURNAL OF BRIDGE ENGINEERING © ASCE / MAY/JUNE 2012
J. Bridge Eng. 2012.17:409-419.
Dow
nloa
ded
from
asc
elib
rary
.org
by
Uni
vers
ity o
f W
ater
loo
on 1
0/30
/13.
Cop
yrig
ht A
SCE
. For
per
sona
l use
onl
y; a
ll ri
ghts
res
erve
d.

where a0 = material constant to account for small crack behavior; andY = correction factor to account for the crack shape, the free surfaceon one side of the crack, and the finite thickness of the cracked plate.The constant a0 can be taken as (El Haddad et al. 1979)
a0 ¼�ΔK th
Δσe
�2·1π
ð9Þ
where Δσe = fatigue limit for R ¼ �1ð≈0:5 · σuÞ. A Ramberg-Osgood material model is used to calculate the stresses and strainsfor each load cycle. Local stress-strain histories at various depths be-low the surface of the weld notch are determined by usingNeuber’s rule. The local elastic stresses (σel) are calculated by usinga stress concentration factor (SCF), kpð¼ σel∕SÞ, which accounts forthe presence of the crack (Dabayeh et al. 1998)
kp ¼Kel
Y ·ffiffiffiffiffiffiffiffiffiπ · a
p ð10Þ
where Kel = elastic SIF, accounting for the nonuniform stress distri-bution along the crack path, and is calculated by using weight func-tions, m (b, a, c), from Shen and Glinka (1991). For the calculation ofΔKeff , the crack opening stress is calculated on the basis of Newman(1984). For VA loading analysis, the following expression from Khaliland Topper (2003) is used to model the evolution of the crack openingstress (σop) following overload events:
σop ¼ σcu þ μ · ðσss � σcuÞ ð11Þ
where σcu = crack opening stress before the current cycle; σss = crackopening stress at steady state (i.e., under CA loading at the currentstress range); and μ = material constant, found to equal 0.003for 2024-T351 aluminum (Khalil and Topper 2003). Further detailsregarding the employed SBFM model are provided by Ghahremaniand Walbridge (2010).
Assumed Model Input Parameters
To implement the SBFM model described in the previous section,the estimated HAZ material parameters in Table 2 were assumedfor the elastic modulus, E, static yield and ultimate strength, σy andσu, and the Ramberg-Osgood material constants, K 0 and n0.
To determine the local (applied) elastic stresses, σel, a 2D (planestrain) analysis of the uncracked weld specimen was performed byusing the finite-element (FE) program ABAQUS 6.7.4 (ABAQUS
2007). Nominal specimen dimensions were assumed, along with aweld toe angle and radius of θw ¼ 45° and ρ ¼ 0:5 mm, respec-tively. In Fig. 8, the FE mesh and boundary conditions are illus-trated and the resulting uncracked SCF (kel) and kp distributionsare plotted. A critical crack depth of T∕2 was assumed, whereT is the nominal plate thickness.
To model the evolution of the crack shape with depth, anempirical model from Menzemer (1992) was employed, whereinthe crack half-width, c, is calculated as
c ¼ 3:274 · a1:241 ð12ÞCrack shape measurements were obtained from the fatigue test
specimens by dye penetrant staining following crack detection(Coughlin 2010). These measurements showed considerable scatter(a∕c ¼ 0:133 to 0.366 for a > 3:0 mm) with no clear correlationbetween the crack shape and either the crack depth or loadingcase. A reasonable estimate is given by Eq. (12) of the mean crackshape at the higher crack depths where a/c measurements wereobtained.
For the fracture mechanics analysis of aluminum, a multislopecrack growth rate (da∕dN) curve is commonly used. Because thecrack opening SIF is considered explicitly in the SBFM model, aneffective SIF versus da∕dN curve is needed. Menzemer (1992)recommends that da∕dN data obtained under constant Kmax or highR-ratio conditions are used in this case. The European Committee forStandardization (CEN 2007) provides a set of curves for variouswrought aluminum alloys on the basis of a combination of constantKmax conditions at lowSIFs andR ¼ 0:8 at highSIFs. In Fig. 9, alongwith an envelope of these curves, curves forAl-Mg-Si alloys from thefollowing references are compared: R84 (Ruschau 1984), K08 (Kimet al. 2008), D99 (Donald and Paris 1999), B01 (Borrego et al. 2001),and EC9 (CEN 2007). With no batch-specific data available, it wasdecided to employ an SIF versus da∕dN curve on the basis of theupper bound of the curves in Fig. 9(a).
Taylor (1985) reported values ΔK th ranging from 22.1 to94:9 MPa∕mm for R > 0:4 for various aluminum alloys. In thispaper, a value for this parameter of 1:0 MPa∕m (or 31:6 MPa∕mm)is used, which is a common assumption for aluminum. This value isat the lower end of the range reported by Taylor (1985) and resultsin a good fit of the test data at longer lives.
Initial defect measurements for aluminum welds performed witha scanning electron microscope are reported by Menzemer (1992).In this reference, a mean defect depth, ai, of 0.025 mm is reported,
Fig. 8. Determination of stress concentration factors: (a) finite-element model of weld detail; (b) resulting stress concentration factor distributions
JOURNAL OF BRIDGE ENGINEERING © ASCE / MAY/JUNE 2012 / 415
J. Bridge Eng. 2012.17:409-419.
Dow
nloa
ded
from
asc
elib
rary
.org
by
Uni
vers
ity o
f W
ater
loo
on 1
0/30
/13.
Cop
yrig
ht A
SCE
. For
per
sona
l use
onl
y; a
ll ri
ghts
res
erve
d.

with depths ranging from 0.013 to 0.051 mm. These depths aresmaller than the values reported elsewhere for structural steelwelds. In Maddox and Webber (1977), fracture mechanics is usedto back calculate an effective initial defect depth for aluminumwelds. On the basis of this approach, an ai value ∼1∕10 as largeas the value for steel is estimated.
For the current study, the high uncertainty regarding the ex-pected initial defect depth and residual stress distribution werehandled as follows: these parameters were initially set to ai ¼0:025 mm [the mean measured value reported by Menzemer(1992)] and σres ¼ 20 MPa [roundedmean measured value in Fig. 7(b)]. A uniform residual stress distribution was simplistically as-sumed; then, ai was varied to determine the best value for predict-ing the CA loading results for R ¼ 0:1 and 0.4, on the basis of aleast squares comparison with the test data. This yielded a cali-brated value of ai ¼ 0:04 mm. Simulations of the other testedloading conditions were then performed with ai ¼ 0:04 mm andσres varied from 0 to 40 MPa, so that the sensitivity of the resultsto the assumed uniform residual stress level could be observed.
Validation of Strain-Based Fracture Mechanics Model
In Fig. 10, the test results and SBFM model predictions are com-pared for the CA and VA loading tests. The CA results show thatgood predictions are achieved for the various tested stress ranges
and ratios. The variations in σres between 0 and 40 MPa provide anexplanation for the increased scatter in the CA loading results forR ¼ �1:0, assuming that σres ¼ 20 MPa gives a good prediction ofthe expected life for all three stress ratios.
Under simulated in-service VA loading conditions, the testedand predicted fatigue lives also compare reasonably well for bothinvestigated load histories. Specifically, several important trendsare predicted by the analytical model, including the higher fatiguestrength at 105 cycles observed for the ps-m-40 history, and thehigher fatigue life predicted for this load history in the high-cycledomain. The model predictions are on the safe side for the ps-m-40load history. For the ps-r-15 history, a reasonably good fit of the testdata is observed.
Analytical Studies Performed with ValidatedFracture Mechanics Model
Simulations for Other Spans and Influence Lines
Following the SBFM model validation, simulations were con-ducted to generate analytical S-N curves for loading historiesapplicable to other influence lines and bridge spans. Specifically,influence lines for the following five locations were considered:
Fig. 10. Strain-based fracture mechanics model predictions compared with fatigue test data: (a) CA loading; (b) VA loading
Fig. 9. Crack growth data for aluminum alloys: (a) Al-Mg-Si alloys; (b) other wrought aluminum alloys
416 / JOURNAL OF BRIDGE ENGINEERING © ASCE / MAY/JUNE 2012
J. Bridge Eng. 2012.17:409-419.
Dow
nloa
ded
from
asc
elib
rary
.org
by
Uni
vers
ity o
f W
ater
loo
on 1
0/30
/13.
Cop
yrig
ht A
SCE
. For
per
sona
l use
onl
y; a
ll ri
ghts
res
erve
d.

midspan moment for 1- and 2-span girders (ps-m, p2tr-m);intermediate support moment for 2-span girders (p2tr-a); and sup-port reactions for 1- and 2-span girders (ps-r and p2tr-r). The fol-lowing four bridge spans were considered: 15, 25, 40, and 60 m.The selected influence lines and spans were not intended to reflectthe most likely cases for fatigue cracking in highway bridges, butrather to cover a broad range of load history characteristics that canbe expected in these structures. To generate each in-service loadinghistory, random samples of 1,000 trucks taken from the twopreviously-described larger U.S. and Ontario databases were used.
In Fig. 11, the analysis results are presented for both the U.S.and Ontario loading simulations. In this figure, the results are plot-ted as envelopes in terms of both the equivalent stress range, ΔSeq,on the basis of Eq. (4) and the design stress range, γΔf or λf sr. Forboth stress range types, the ADM (AA 2010) detail category C S-Ncurve slope (m ¼ 3:64) is assumed. In the second case, the assumedvalues for γ or λ are the mean values plotted in Fig. 3(b).
In Fig. 11, the ADM (AA 2010) detail category C design S-Ncurve and the analytical S-N curve for CA loading at R ¼ 0:1 areplotted for comparison purposes. The results show that the ADM(AA 2010) design curve lies below the VA loading envelopes for
the most part. When the equivalent stress range (ΔSeq) is used, themodel predicts fatigue strengths for N < 105 cycles below thedesign curve for a significant number of the analyzed cases. How-ever, when the design stress ranges are used, the envelopes shiftupwards for N < 105 cycles, and the ADM (AA 2010) designcurve is generally safe in this domain.
Considering the widths of the VA loading envelopes in Fig. 11and comparing the differences in the envelopes for the two inves-tigated GVW databases, it is clear that the in-service VA loadingcharacteristics have a significant influence on the shape of the ana-lytical VA loading S-N curve. In general, the VA loading envelopessuggest that a flatter design S-N curve slope may be warranted inthe high cycle domain. A number of factors influencing this resultmust be further studied, because of the following: (1) large uncer-tainties remain regarding certain key model parameters, and (2) themodel has so far been validated on small-scale test data only.
Scale Effect and Overload Studies
In Fig. 12, results are presented to illustrate the following effects onthe VA loading envelopes: (1) varying several model parameters
Fig. 11. Results of analysis of other spans and influence lines: (a) U.S. gross vehicle weight data; (b) Ontario gross vehicle weight data
Fig. 12. Scale effect and overload study results: (a) scale effect study results (U.S. gross vehicle weight data); (b) overload study results (Ontario grossvehicle weight data)
JOURNAL OF BRIDGE ENGINEERING © ASCE / MAY/JUNE 2012 / 417
J. Bridge Eng. 2012.17:409-419.
Dow
nloa
ded
from
asc
elib
rary
.org
by
Uni
vers
ity o
f W
ater
loo
on 1
0/30
/13.
Cop
yrig
ht A
SCE
. For
per
sona
l use
onl
y; a
ll ri
ghts
res
erve
d.

often used to explain “scale effects,” and (2) introducing a particu-larly heavy truck at a regular frequency in the traffic history.
Fig. 12(a) shows that a new VA loading envelope is generatedfor a weld detail identical to the one described previously, but withthe thickness of the loaded plate increased to T ¼ 25:0 mm. Thisresults in an increase in the SCF along the crack path. In addition,the residual stress is increased to a level more typical of full-scalestructures. Kosteas (1988) and (Menzemer (1992) reported thatthey have measured residual stresses in large-scale specimens ofup to ∼50% or 80% of the parent material yield strength, respec-tively. For this study, the higher value of 80% of σy is assumed. Theresult of this analysis is a downward shift in the VA loadingenvelope.
In Fig. 12(b), a new VA loading envelope is produced for theOntario GVW database, with an overload truck introduced every1000th truck, which has an axle configuration identical to theCAN/CSA-S6 CL-625 truck and the corresponding axle loadsmultiplied by 1.5, resulting in a GVW of 93.75 kN. The additionof this overload truck results in a downward shift in the VA loadingenvelope in the high and low cycle domains. In between thesedomains, an upward shift in the envelope can be seen, whichcan be explained by the well-known beneficial “crack growthretardation” effects of tensile overload cycles under certainconditions.
Conclusions
On the basis of the work presented in this paper, the followingconclusions are drawn:• The damage equivalence factors currently specified in AASHTO
(2007) and CAN/CSA-S6 (CSA 2006) for steel do notnecessarily provide the same level of safety when used withaluminum S-N curves. The difference is most significant forADM (AA 2010) detail categories A and B, or m greater than∼4:5. On this basis, it is concluded that higher factors may beappropriate in these cases to ensure a level of safety consistentwith the current provisions for steel.
• A validated deterministic fracture mechanics model indicatesthat the ADM (AA 2010) detail category C S-N curve for alu-minum provides safe fatigue performance predictions for theinvestigated fatigue detail in both the low and high-cycledomains.
• This model predicts a slope change in the calculated S-N curveenvelopes for various bridge spans and influence lines underin-service VA loading in the high-cycle domain, which couldpotentially be exploited to reduce the fatigue design stressfor aluminum highway bridges. This slope change shifts down-wards, however, when several parameters associated with scaleeffects and the in-service VA loading history are varied.In addition, the following recommended areas of further study
are highlighted:• A more extensive analysis of the damage equivalence factors
for aluminum is recommended, employing larger, more recenttraffic databases and considering the effects of periodic overloadtrucks and simultaneous vehicle crossings in the analysis.
• Further study is still needed to fully understand all of the issuesconcerning the fatigue behavior of aluminum welds underin-service highway bridge loading conditions. Although addi-tional VA loading tests of large-scale components and other fa-tigue details will be essential, the methodology employed in thispaper can be used to identify critical loading histories for testingand to predict fatigue behavior for untested details and loadinghistories, to reduce the cost of a comprehensive test program.
• For the development of future design S-N curves or furtherverification of the existing ones, conversion of the describedanalysis methodology into a probabilistic format would providea means for establishing curves corresponding with a consistentreliability level, given the limited available test data under in-service VA loading conditions.
Acknowledgments
Funding for this project was provided by the Ontario GraduateScholarship (OGS) program and the Natural Sciences andEngineering Research Council of Canada (NSERC). Assistancewith laboratory testing was provided by M. El Zeghayar andK. Ghahremani. Technical input provided by A. Agarwal,D. Beaulieu and the other members of CAN/CSA-S6 TechnicalSub-Committee on Section 17—Aluminum Structures, is gratefullyacknowledged.
References
ABAQUS. (2007). Version 6.7.4 user documentation, Dassault Systems.Agarwal, A. C. et al. (2007). Calibration report for CAN/CSA-S6-06,
Canadian Standards Association, Mississauga, ON.Aluminum Association (AA). (2010). “Aluminum design manual—
specifications and guidelines for aluminum structures.” ADM-10,Aluminum Association, Arlington, VA.
AASHTO. (2007). AASHTO LRFD bridge design specification, 4th Ed.AASHTO, Washington, DC.
ASTM. (2002). “Standard test method for verifying the alignment of x-raydiffraction instrumentation for residual stress measurement.” ASTME915, West Conshohoken, PA.
ASTM. (2003). “Standard test method for vickers hardness of metallicmaterials.” ASTM E92-82, West Conshohoken, PA.
ASTM. (2004). “Standard test methods for tension testing of metallicmaterials.” ASTME8M-04, West Conshohoken, PA.
ASTM. (2009). “Standard practice for heat treatment of wrought aluminumalloys.” ASTM B 918M-09, West Conshohoken, PA.
Arrien, P., Bastien, J., and Beaulieu, D. (2001). “Rehabilitation of bridgesusing aluminum decks.” Can. J. Civ. Eng., 28, 992–1002.
Baumel, A., and Seeger, T. (1990). Materials data for cyclic loading—Supplement 1, Elsevier Science Publishing, New York.
Borrego, L. P., Ferreira, J. M., and Costa, J. M. (2001). “Fatigue crackgrowth and crack closure in an AlMgSi alloy.” Fatigue Fract. Eng.Mater. Struct., 24(4), 255–265.
Canadian Standards Association(CSA). (2005). “Strength design inaluminum.” CSA-S157-05, Mississauga, ON, Canada.
Canadian Standards Association (CSA). (2006). “Canadian highway bridgedesign code.” CAN/CSA-S6-06, Mississauga, ON, Canada.
Coughlin, R. (2010). “Fatigue of aluminum welds in canadian highwaybridges.” M.A.Sc. thesis, Univ. of Waterloo, Waterloo, ON.
Dabayeh, A. A., Berube, A. J., and Topper, T. H. (1998). “An experimentalstudy of the effect of a flaw at a notch root on the fatigue life of cast Al319.” Int. J. Fatigue, 20(7), 517–530.
Das, S. K., and Kaufman, J. G. (2007). Aluminum alloys for bridges andbridge decks, The Minerals, Metals & Materials Society, Warrendale,PA, 61–72.
Donald, K., and Paris, P. C. (1999). “An evaluation of ΔKeff estimationprocedures on 6061-T6 and 2024-T3 aluminum alloys.” Int. J. Fatigue,21(1), 47–57.
El Haddad, M. H., Topper, T. H., and Smith, K. N. (1979). “Prediction ofnon propagating cracks.” Eng. Fract. Mech., 11, 573–584.
European Committee for Standardization (CEN). (2007). “Eurocode9—design of aluminium structures—part 1-3: Structures susceptibleto fatigue.” EN 1999-1-3, Brussels, Belgium.
Ghahremani, K., and Walbridge, S. (2011). “Fatigue testing and analysis ofpeened highway bridge welds under in-service variable amplitude load-ing conditions.” Int. J. Fatigue, 33(3), 300–312.
418 / JOURNAL OF BRIDGE ENGINEERING © ASCE / MAY/JUNE 2012
J. Bridge Eng. 2012.17:409-419.
Dow
nloa
ded
from
asc
elib
rary
.org
by
Uni
vers
ity o
f W
ater
loo
on 1
0/30
/13.
Cop
yrig
ht A
SCE
. For
per
sona
l use
onl
y; a
ll ri
ghts
res
erve
d.

Hirt, M. A., Bez, R., and Nussbaumer, A. (2006). Traite de génie civil Vol.10: Construction métallique—Notions fondamentales et méthodes dedimensionnement, Presses Polytechniques et Universitaires Romandes,Lausanne Switzerland (in French).
Hobbacher, A. (2005). “Recommendations for fatigue design of weldedjoints and components.” Doc. XIII-1965-03, International Institute ofWelding (IIW), Villepinte, France.
Jaccard, R., Kosteas, D., and Ondra, R. (1995). “Background documentto fatigue design curves for welded aluminium components.” Doc.XIII-1588-95, International Institute of Welding (IIW), Villepinte,France.
Khalil, M., and Topper, T. H. (2003). “Prediction and correlation of theaverage crack-opening stress with service load cycles.” Int. J. Fatigue,25, 661–670.
Kim, S., Lee, C. G., and Kim, S.-J. (2008). “Fatigue crack propagationbehavior of friction stir welded 5083-H32 and 6061-T651 aluminumalloys.” Mater. Sci. Eng. A, 478(1–2), 56–64.
Kosteas, D. (1988). “Estimating residual stresses and their effect in weldedaluminum components in fatigue.” ASTM Special Technical Publica-tion STP 1004, West Conshohocken, PA, 122–130.
Maddox, S. J., and Webber, D. (1977). Fatigue Crack Propagation inAluminum-Zinc-Magnesium Alloy Fillet-Welded Joints, ASTM SpecialTechnical Publication STP 648, West Conshohocken, PA, 159–184.
Maddox, S. J. (1995). “Scale effect in fatigue of fillet welded aluminiumalloys.” Proc. 6th Int. Conf. on Aluminium Weldments, AmericanWelding Society, Miami, FL, 77–94.
Maddox, S. J. (2003). “Review of fatigue assessment procedures for weldedaluminium structures.” Int. J. Fatigue, 25(12), 1359–1378.
Mazzolani, F., and Grillo, M. (1995). “Fatigue strength of longitudinallywelded aluminium alloy structures.” Proc. 6th Int. Conf. on AluminiumWeldments, American Welding Society, Miami, FL, 95–106.
Menzemer, C. C. (1992). “Fatigue behavior of welded aluminum struc-tures.” Ph.D. thesis, Lehigh Univ., Bethlehem, PA.
Menzemer, C. C., and Fisher, J. W. (1995). “Revisions to the aluminum
association fatigue design specifications.” Proc. 6th Int. Conf. onAluminium Weldments, American Welding Society, Miami, FL, 11–23.
Menzemer, C. C. (2000). “Fatigue behaviour and design of aluminumstructures.” Prog. Struct. Eng. Mater., 2, 120–127.
Moses, F., Schilling, C. G., and Raju, K. S. (1987). “Fatigue evaluationprocedures for steel bridges.” National Cooperative Highway ResearchProgram Rep. 299, Washington, DC.
Newman, J. C. (1984). “A crack opening stress equation for fatigue crackgrowth.” Int. J. Fract., 24, R131–R135.
Ruschau, J. J. (1984). Fatigue crack growth rate data for aluminum alloy6061-T651 plate, Dayton Univ. Research Institute Interm TechnicalRep., Dayton, OH.
Shen, G., and Glinka, G. (1991). “Weight functions for a surface semi-elliptical crack in a finite thickness plate.” Theor. Appl. Fract. Mech.,15(3), 247–255.
Siwowski, T. (2006). “Aluminum bridges—past, present and future.”Struct. Eng. Int., 16(4), 286–293.
Snyder, R. E., Likins, G. E., and Moses, F. (1985). “Loading spectrumexperience by bridge structures in the united states.” Federal HighwayAdministration Rep., FHWA/RD-85/012, Cleveland, OH.
Society of Automotive Engineers International (SAE). (2003). “Residualstress measurement by x-ray diffraction.” SAE HS784, Warrendale, PA.
Soetens, F., van Straalen, I. J., and Dijkstra, O. (1995). “European researchon fatigue of aluminium structures.” Proc. 6th Int. Conf. on AluminiumWeldments, American Welding Society, Miami, FL, 53–64.
Swiss Society of Engineers and Architects (SIA). (2003). “Steel structures.”SIA 263.
Taylor, D. (1985). “A compendium of fatigue thresholds and crack growthrates.” EMAS, Warley, U.K.
Voutaz, B., Smith, I. F., and Hirt, M. A. (1995). “Fatigue behaviour ofaluminium beams with welded attachments.” 3rd Int. Conf. on Steeland Aluminium Structures, Dept. of Civil Engineering, Bogazici Univ.,Istanbul, Turkey, 213–220.
JOURNAL OF BRIDGE ENGINEERING © ASCE / MAY/JUNE 2012 / 419
J. Bridge Eng. 2012.17:409-419.
Dow
nloa
ded
from
asc
elib
rary
.org
by
Uni
vers
ity o
f W
ater
loo
on 1
0/30
/13.
Cop
yrig
ht A
SCE
. For
per
sona
l use
onl
y; a
ll ri
ghts
res
erve
d.