FATIGUE STRENGTH OF STEEL BEAMS WITH WELDED …
98
147 NATIONAL COOPERATIVE HIGHWAY RESEARCH PROGRAM 1 47 REPORT FATIGUE STRENGTH OF STEEL BEAMS WITH WELDED STIFFENERS AND ATTACHMENTS atso s ee NC1P / 1* ZO€,, cirtJ 61 TRANSPORTATION RESEARCH BOARD NATIONAL RESEARCH COUNCIL
Transcript of FATIGUE STRENGTH OF STEEL BEAMS WITH WELDED …

147
NATIONAL COOPERATIVE HIGHWAY RESEARCH PROGRAM 1 47 REPORT
FATIGUE STRENGTH OF STEEL BEAMS WITH WELDED STIFFENERS AND ATTACHMENTS
atso s ee NC1P / 1* ZO€,, cirtJ 61
TRANSPORTATION RESEARCH BOARD NATIONAL RESEARCH COUNCIL

TRANSPORTATION RESEARCH BOARD 1974
Officers
JAY W. BROWN, Chairman MILTON PIKARSKY, First Vice Chairman W. N. CAREY, JR., Executive Director
Executive Committee
HENRIK E. STAFSETH, Executive Director, American Assn. of State Highway and Transportation Officials (ex officio) NORBERT T. TIEMANN, Federal Highway Administrator, U.S. Department of Transportation (ex officio) FRANK C. HERRINGER, Urban Mass Transportation Administrator, U.S. Department of Transportation (ex officio) ERNST WEBER, Chairman, Division of Engineering, National Research Council (ex officio) ALAN M. VOORHEES, President, Alan M. Voorhees and Associates (ex officio, Past Chairman 1972) WILLIAM L. GARRISON, Director, Inst. of Transp. and Traffic Eng., University of California (ex officio, Past Chairman 1973) JAY W. BROWN, Director of Road Operations, Florida Department of Transportation DOUGLAS B. FUGATE, Commissioner, Virginia Department of Highways ROGER H. GILMAN, Director of Planning and Development, The Port Authority of New York and New Jersey NEIL V. HAKALA, President, Esso Research and Engineering Company ALFRED HEDEFINE, Senior Vice President, Parsons, Brinckerhojj, Quade and Douglas ROBERT N. HUNTER, Chief Engineer, Missouri State Highway Commission GEORGE KRAMBLES, General Operations Manager, Chicago Transit Authority A. SCHEFFER LANG, Assistant to the President, Association of American Railroads BENJAMIN LAX, Director, Francis Bitter National Magnet Laboratory, Massachusetts Institute of Technology HAROLD L. MICHAEL, School of Civil Engineering, Purdue University D. GRANT MICKLE, President, Highway Users Federation for Safety and Mobility JAMES A. MOE, Executive Engineer, Hydro and Community Facilities Division, Bechtel, inc. ELLIOTT W. MONTROLL, Professor of Physics, University of Rochester MILTON PIKARSKY, Chairman, Chicago Transit Authority J. PHILLIP RICHLEY, Director of Transportation, Ohio Department of Transportation RAYMOND T. SCHULER, Commissioner, New York State Department of Transportation B. R. STOKES, General Manager, San Franc icco Bay Area Rapid Transit District ROBERT N. YOUNG, Executive Director, Regional Planning Council, Baltimore, Maryland
NATIONAL COOPERATIVE HIGHWAY RESEARCH PROGRAM
Advisory Committee
JAY W. BROWN, Florida Department of Transportation (Chairman) MILTON PIKARSKY, Chicago Transit Authority HENRIK E. STAFSETH, American Association of State Highway and Transportation Officials NORBERT T. TIEMANN, U.S. Department of Transportation ERNST WEBER, National Research Council ALAN M. VOORHEES, Alan M. Voorhees and Associates WILLIAM L. GARRISON, University of California W. N. CAREY, JR., Transportation Research Board
General Field of Design Area of Bridges Advisory Panel C 12-7
H. T. DAVIDSON, Connecticut Department of Transportation W. H. MUNSE, University of Illinois (Chairman) F. A. REICKERT, Hazelet and Erdal
J. N. CLARY, Virginia Department of Highways I. M. VIEST, Bethlehem Steel Corporation A. L. ELLIOTT, California Division of Highways C. F. GALAMBOS, Federal Highway Administration T. R. HIGGINS, American Institute of Steel Construction L. F. SPAINE, Transportation Research Board C. L. HULSBOS, University of New Mexico
Program Staff
K. W. HENDERSON, JR., Program Director LOUIS M. MAcGREGOR, Administrative Engineer HARRY A. SMITH, Projects Engineer JOHN E. BURKE, Projects Engineer DAVID K. WITHEFORD, Projects Engineer R. IAN KINGHAM, Projects Engineer HERBERT P. ORLAND, Editor ROBERT J. REILLY, Projects Engineer PATRICIA A. PETERS, Associate Editor

NATIONAL COOPERATIVE HIGHWAY RESEARCH PROGRAM 147 REPORT
FATIGUE STRENGTH OF STEEL BEAMS WITH WELDED STIFFENERS AND ATTACHMENTS
JOHN W. FISHER, PEDRO A. ALBRECHT, BEN T. YEN,
DAVID J. KLINGERMAN, AND BERNARD M. McNAMEE
LEHIGH UNIVERSITY
BETHLEHEM, PENNSYLVANIA
RESEARCH SPONSORED BY THE AMERICAN ASSOCIATION OF STATE HIGHWAY AND TRANSPORTATION OFFICIALS IN COOPERATION WITH THE FEDERAL HIGHWAY ADMINISTRATION
AREA OF INTEREST:
BRIDGE DESIGN
TRANSPORTATION RESEARCH BOARD NATIONAL RESEARCH COUNCIL
WASHINGTON, D.C. 1974

NATIONAL COOPERATIVE HIGHWAY RESEARCH PROGRAM NCHRP Report 147
Systematic, well-designed research provides the most ef-fective approach to the solution of many problems facing highway administrators and engineers. Often, highway problems are of local interest and can best be studied by highway departments individually or in cooperation with their state universities and others. However, the accelerat-ing growth of highway transportation develops increasingly complex problems of wide interest to highway authorities. These problems are best studied through a coordinated program of cooperative research.
In recognition of these needs, the highway administrators of the American Association of State Highway and Trans-portation Officials initiated in 1962 an objective national highway research program employing modern scientific techniques. This program is supported on a continuing basis by funds from participating member states of the Association and it receives the full cooperation and support of the Federal Highway Administration, United States Department of Transportation.
The Transportation Research Board of the National Re-search Council was requested by the Association to admin-ister the research program because of the Board's recog-nized objectivity and understanding of modern research practices. The Board is uniquely suited for this purpose as: it maintains an extensive committee structure from which authorities on any highway transportation subject may be drawn; it possesses avenues of communications and cooperation with federal, state, and local governmental agencies, universities, and industry; its relationship to its parent organization, the National Academy of Sciences, a private, nonprofit institution, is an insurance of objectivity; it maintains a full-time research correlation staff of special-ists in highway transportation matters to bring the findings of research directly to those who are in a position to use them. The program is developed on the basis of research needs identified by chief administrators of the highway and trans-portation departments and by committees of AASHTO. Each year, specific areas of research needs to be included in the program are proposed to the Academy and the Board by the American Association of State Highway and Trans-portation Officials. Research projects to fulfill these needs are defined by the Board, and qualified research agencies are selected from those that have submitted proposals. Ad-ministration and surveillance of research contracts are responsibilities of the Academy and its Transportation Re-search Board. The needs for highway research are many, and the National Cooperative Highway Research Program can make significant contributions to the solution of highway transportation problems of mutual concern to many re-sponsible groups. The program, however, is intended to complement rather than to substitute for or duplicate other highway research programs.
Project 12-7 FY '69 ISBN 0-309-02207-X L. C. Catalog Card No. 74-6935
Price: $480
Notice
The project that is the subject of this report was a part of the National Cooperative Highway Research Program conducted by the Transportation Research Board with the approval of the Governing Board of the National Research Council, acting in behalf of the National Academy of Sciences. Such approval reflects the Governing Board's judgment that the program concerned is of national impor-tance and appropriate with respect to both the purposes and re-sources of the National Research Council. The members of the advisory committee selected to monitor this project and to review this report were chosen for recognized scholarly competence and with due consideration for the balance of disciplines appropriate to the project. The opinions and con-clusions expressed or implied are those of the research agency that performed the research, and, while they have been accepted as appropriate by the advisory committee, they are not necessarily those of the Transportation Research Board, the National Research Coun-cil, the National Academy of Sciences, or the program sponsors. Each report is reviewed and processed according to procedures established and monitored by the Report Review Committee of the National Academy of Sciences. Distribution of the report is ap-proved by the President of the Academy upon satisfactory comple-tion of the review process. The National Research Council is the principal operating agency of the National Academy of Sciences and the National Academy of Engineering, serving government and other organizations. The Transportation Research Board evolved from the 54-year-old High-way Research Board. The TRB incorporates all former HRB activities but also performs additional functions under a broader scope involving all modes of transportation and the interactions of transportation with society.
Published reports of the
NATIONAL COOPERATIVE HIGHWAY RESEARCH PROGRAM
are available from:
Transportation Research Board National Academy of Sciences 2101 Constitution Avenue, N.W. Washington, D.C. 20418
(See last pages for list of published titles and prices)
Printed in the United States of America.

FOREWORD This report contains suggested revisions to the fatigue provisions of the AASHO Standard Specifications for Highway Bridges.* The recommendations are also ap-
By Staff plicable to other specifications, such as those of the American Welding Society and
Transportation the American Railway Engineering Association. Findings are based on an exten-
Research Board sive laboratory investigation of fatigue effects in welded steel beams. The report is recommended to engineers, researchers, and members of specification-writing bodies concerned with the use of welded steel beams.
The fatigue fractures observed in cover-plated steel-beam bridges during the AASHO Road Test, and more recently in similar structures in the field, emphasize the influence of welding and welded details on the life expectancy of highway bridges. Also of great significance in these bridges are such factors as the loading history of the structure, the types of materials used, the design details, and the quality of fabrication. Among the more important design details are cover plates, stiffeners, attachments, and splices. NCHRP Project 12-7 investigated the effects of these details on the fatigue strength of welded steel beams.
In the past, only approximate general design relationships have been possible on the basis of the limited existing experimental data. Lehigh University and its subcontractor, Drexel University, started work on NCHRP Project 12-7 in October 1966. The over-all objective of this study was development of mathematical design relationships that could define with statistical confidence the fatigue strength of steel beams. This objective was accomplished by a review of existing fatigue data, and development and performance of statistically valid experiments that permitted for-mulation of mathematical relationships between the fatigue behavior of beams and design details, applied stresses, and types of steels.
Project 12-7, "Effects of Weldments on Fatigue Strength of Steel Beams," was carried out in two phases. Phase I lasted 40 months and had as its specific objective the development of design relationships for rolled and welded beams, both with and without cover plates, and for welded beams with flange splices. Altogether, 374 beam specimens were tested. The results of Phase I work have been reported in NCHRP Report 102, "Effects of Weldments on the Fatigue Strength of Steel Beams." Recommendations contained in that report were adopted in the 1971 "AASHO Interim Specifications for Highway Bridges."
This report is based on Phase II, which was started in July 1970 and lasted 30 months. Its purpose was to extend the study to details not covered in Phase I, thereby making possible the development of comprehensive design and specifica-tions provisions. Some 157 steel beams and girders were fabricated and tested in Phase II. Most of these tests were used to define the fatigue strength of transverse stiffeners and attachments under constant-amplitude fatigue loading.
Other NCHRP research in progress in the area of fatigue includes: Project 12-12, "Welded Steel Bridge Members Under Variable-Cycle Fatigue Loadings," and Project 12-14, "Subcritical Crack Growth in Steel Bridge Members," both at United States Steel Corporation; and Project 12-15, "Detection and Repair of Fatigue Cracking in Highway Bridges," at Lehigh University.
* These recommendations were adopted in late 1973 and the revisions are included in AASHTO's 1974 Interim Specifications.

CONTENTS
1 SUMMARY
PART I
2 CHAPTER ONE Introduction and Research Approach Objectives and Scope Design Variables and Specimens Experiment Design Fabrication Experimental Procedures
7 CHAPTER TWO Findings Literature Survey General Results of Study Effect of Stiffener Details Effect of Flange Attachment Details Design
9 CHAPTER THREE Results and Evaluation of Fatigue Strength
Fatigue Strength of A514 Steel Rolled Beams Fatigue Strength of Beams and Girders with Transverse
Stiffeners Fatigue Strength of Plain Welded Beams and Girders Fatigue Strength of Beams with Welded Flange
Attachments Stress Analysis of Crack Propagation
40 CHAPTER FOUR Recommendations and Application
43 CHAPTER FIVE Conclusions General Transverse Stiffener Details Welded Beam Attachments A514 Steel Rolled Beams
44 CHAPTER SIX Recommendations for Further Work
46 REFERENCES
PART II
47 APPENDIX A Literature Survey
56 APPENDIX B Experiment Design
59 APPENDIX C Material Properties and Beam Characteristics
62 APPENDIX D A514 Steel Rolled Beams
64 APPENDIX E Fatigue Strength of Beams and Girders with Stiffeners
78 APPENDIX F Fatigue Strength of Welded Attachments
84 APPENDIX G Nomenclature

ACKNOWLEDGMENTS
The research reported herein was performed under NCHRP Project 12-7 by the Fritz Engineering Laboratory, Department of Civil Engineering, Lehigh University, and the Department of Mechanics and Civil Engineering, Drexel University. Lehigh University was the contractor for this study. The work under-taken at Drexel University was under a subcontract with Lehigh University.
John W. Fisher, Professor of Civil Engineering, Lehigh Uni-versity, was the principal investigator. The other authors of this report are: Pedro A. Albrecht, former Research Assistant at Fritz Engineering Laboratory, now Assistant Professor of Civil Engineering, University of Maryland; Ben T. Yen, Asso-ciate Professor of Civil Engineering, Lehigh University; David J. Klingerman, Research Assistant, Fritz Engineering Labora-tory; and Bernard M. McNamee, Professor of Civil Engineer-ing, Drexel University.
The work was done under the general supervision of Pro-fessor Fisher. The work at Drexel was done under the super-vision of Professor McNamee with the assistance of Richard Gray and Robert Baldasanno, Research Assistants, and Allen Yerger, technician. The work at Lehigh was under the super-vision of Professors Fisher and Yen, with the assistance of Messrs. Albrecht and Klingerman.
Both Lehigh University and Drexel University financially supported a portion of this work as a public service by per-mitting the project to be undertaken at a less-than-audited rate.
Sincere thanks are due Fritz Laboratory staff members Char-lotte Yost, Mary Ann Yost, and Phyllis Raudenbush who typed the manuscript; Richard Sopko for outstanding photographic work; John M. Gera and Sharon Balogh for the line drawings, and Dorothy Fielding for assistance with reproduction of the manuscript. Kenneth L. Harpel, Laboratory Superintendent, Robert Dales and Charles Hittinger, Laboratory Foremen, and their staff were invaluable in their assistance during fabrication and testing.
Appreciation is also due Joseph Krulikowski, graduate stu-dent at Drexel University, for the computer work on flange at-tachment. This work was done on the UNIVAC 1108 com-puter in the Structural Branch Division of the Philadelphia Naval Shipyard. Invaluable assistance was also provided by Suresh Desai, Post-Doctoral Research Associate, and John H. Struik, Research Assistant at Fritz Engineering Laboratory, for providing the computer program and finite element analysis of the stress concentration factors for fillet weld toes.

FATIGUE STRENGTH OF
STEEL BEAMS WITH WELDED
STIFFENERS AND ATTACHMENTS
SUMMARY The research described herein is the second phase of a study intended to provide reliable information on the fatigue behavior of steel bridge members. Some 157 steel beams and girders were fabricated and tested to define the fatigue strength of various structural details, including stiffeners and attachments.
Stress range was observed to account for nearly all the variation in cycle life for all stiffener and attachment details examined in this study. Use of this finding should be made in appropriate provisions of the AASHTO Standard Specifications for Highway Bridges.
For purposes of design the fatigue strength of ASTM A5 14 steel rolled beams was found to be about the same as A36 and A441 steel rolled beams. The same stress range-cycle life relationship described the fatigue strength for all three grades of steel.
The beam bending stress range at the weld toe termination was found to dominate the fatigue strength of full-depth stiffener details welded to the web alone. The bending stress range at the stiffener-to-flange weld defined the strength for stiffeners welded to the web and the flanges.
For design purposes the same fatigue strength values are applicable to trans-verse stiffeners welded to the web alone or welded to the web and the tension flange. The allowable bending stress range at the termination of the flange weld toe is the same as for stiffeners welded to the web alone. The magnitude of shear need not be considered when determining the allowable bending stress range for fatigue of full-depth stiffeners welded to the web alone.
Welding transverse stiffeners to the tension flange should be pennitted when desired. The fatigue strength provided by such details is much greater than that provided by attachments with lengths equal to or greater than their width. The AASHTO specifications should be modified to permit the transverse welded stiffener.
New design categories should be added to the AASHTO specifications to provide for the effect of attachment length on allowable fatigue stresses. The same fatigue strength values are applicable to transverse stiffeners and very short attach-ments (less than 11/2 in.). A category should be provided for attachments welded to the flange or the web with lengths between 11/2 in. and 12 times the attachment thickness, but not more than 4 in. When the attachment length exceeds 12 times the attachment thickness or is greater than 4 in., the fatigue strength decreases to that of the cover-plated beams.
All welded details were observed to experience fatigue crack growth from an initial micro-flaw at the toe of fillet welds. The fatigue crack grew as a semielliptical part-through crack during most of the fatigue life. From 80 to 95 percent of the life was consumed in propagating the crack through the plate thickness, depending on the detail.
Attaching diagonal bracing to the transverse stiffeners had no effect on their

2
fatigue strength. Within the range of estimated lateral forces and displacements at the stiffeners on highway bridges, the out-of-plane deflection had no influence on
fatigue strength. The empirical exponential model relating stress range to cycle life provided
the best fit to the test data. A theoretical stress analysis based on the fracture mechanics of crack growth
confirmed the suitability of the empirical regression models. The theoretical analysis also provided a means of rationally explaining the observed behavior and permitted the effect of other variables such as plate thickness and initial crack size to be
examined in a rational way.
CHAPTER ONE
INTRODUCTION AND RESEARCH APPROACH
Fatigue studies on rolled, welded, cover-plated, and groove welded beams fabricated from A36, A441, and A514 steels reported in NCHRP Report 102 (1) revealed that the pri-mary variables influencing the fatigue strength were the type of detail and the stress range to which it was sub-jected. These conclusions were based on a comprehensive experimental program that included 374 beam specimens, each with one or more details.
However, large gaps exist in the state of knowledge of welded details because studies of many details are incom-plete and not sufficiently extensive for evaluation of the significant variables that affect the fatigue strength. Addi-tional research was desirable to extend the applicability of the findings into regions not adequately covered. This would permit development of comprehensive design and specification provisions.
Fatigue has been observed to be a process of initiation of microscopic cracks (flaws or discontinuities) and their propagation into macroscopic cracks during repeated ap-plication of load. The rate of growth of the cracks in-creases exponentially as the crack size increases. Eventu-ally, the applied stresses on the uncracked area are large enough to cause yielding of the net section and static fail-ure. In some cases rapid crack growth or complete fracture is observed at failure.
The fatigue fractures observed in the cover-plated steel-beam bridges included in the AASHO Road Test, as well as those obtained in other similar structures, emphasize the importance of the detail on the life expectancy of highway beam or girder bridges. Over-all, the history of welded highway bridges has been satisfactory. Most field failures have been due to negligence in either design or fabrication. These failures also have pointed out the importance of properly considering in design and fabrication the factors
that influence the fatigue strength of steel highway bridge structures.
OBJECTIVES AND SCOPE
The principal objective of this project was to develop mathematical design relationships that would define in gen-eral terms the fatigue strength of stiffeners and of lateral and transverse connections under constant-amplitude fa-tigue loading. This would permit extending the basic knowledge obtained during the first phase of the study (see NCHRP Report 102 (1)). In addition, rolled steel beams of ASTM A514 material were examined, so that direct correlation with the previous work on A36 and A441 steel rolled beams could be made and the full range of structural steels examined for base metal conditions.
Existing fatigue data for beams and girders with trans-verse stiffeners were reviewed and used to assist with the development of statistically controlled experiments that would permit formulation of suitable mathematical design relationships for the welded beam with stiffeners or with lateral and transverse connections.
During this phase of the research 157 steel beams and girders were fabricated and tested. Of these, 29 were plain rolled A514 steel beams tested to determine the fatigue strength of these high-strength basic members and to pro-vide correlation with the earlier studies.
A total of 106 plain welded beams, identical in size to the beams of Phase I, were fabricated and used as the basic structural member for transverse stiffeners attached to the web alone or to the web and flanges and for flange attach-ments. Of this group, 47 were fabricated with transverse one-sided stiffeners and 59 were fabricated with the flange attachments.

The remaining 22 members were larger welded built-up girders with transverse stiffeners on one side. They pro-vided the basis for assessing the influence of size and stress gradient on fatigue crack growth from the transverse stiff-ener details.
Testing of beams and girders was limited to constant-magnitude cyclic loading. This was identical to the earlier studies of the project. Research now under way on NCHRP Project 12-12 is examining variable-cycle loading, and un-published preliminary results indicate that it can be related to constant-cycle conditions.
DESIGN VARIABLES AND SPECIMENS
The principal design variables for this study were type of detail and stress conditions. Because the study reported in NCHRP Report 102 (1) indicated that type of steel was not a significant variable for either the upper-bound (plain welded beam) or lower-bound (cover-plated beam) welded details, it was assumed that this condition existed for the welded details of this study. Nevertheless, four A514 girders were fabricated to provide additional data on this variable. All of the remaining welded built-up members were fabricated from A441 steel. It was anticipated that the results would fall between the upper- and lower-bound welded details.
Basic tests on A514 plain rolled beams without any details were made to complete an evaluation of the base metal condition and to correlate with the previous studies on A36 and A441 rolled steel beams. Two sizes of beams were studied. They included nine W14 X 30 beams 10 ft 6 in. long, tested on a 10-ft span. These were identical in size to the previous tests on A36 and A441 rolled beams and were tested under identical loading conditions. The remaining 20 rolled beams were W10 X 25, 8 ft long and tested on a 7-ft-6-in. span.
The welded built-up beams and girders with transverse stiffeners had two basic types of one-sided stiffeners, as shown in Figures la and lb. Stiffeners attached to the web alone were classified as Type 1 or Type 2, depending on whether they were in the moment gradient or constant moment regions. These stiffeners were not fitted between flanges and the weld terminated on the beam web ½ in. to 4 in. above the tension flange surface. The second basic type of stiffener, classified as Type 3, was welded to the beam flanges as well as the web.
The stiffeners welded to the web alone provided basic data on fatigue crack growth originating in the web under the combined effects of bending and shear. Earlier studies had indicated that the combined effect of bending and shear was significant (7, 33).
Stiffeners welded to the web and flanges provided data on fatigue crack growth from either the flange or the web, or both. These stiffeners stiffened the web and provided restraint to out-of-plane lateral forces.
All three stiffener types were placed on both beam and girder specimens. The stiffeners were placed in such a position as to ensure failure at the stiffener detail prior to failure as a plain welded beam. The 1 4-in.-deep beams for the basic experiment were classified as SC series. The cx-
K::. 0 Web ill 311'1~'
5u fl
L.
'-" 3-6' 3'-3" _j
9/32
x24
1/32
1
1~9
x2% '32 x24
6 6
STIFFENER STIFFENER © STIFFENER © Figure 1(a). Details of SC beams.
1/4 ,/2X7
Webll I
111110 1380
1-8' 2-4'' 2-4'' 8' 1-0" i'-d' 1-6' 2-0' 2'-d' '-6"
6. b : t5'-°'L. -e;
L
;:2 1.0 :i2 IflF:z1f2 STIFFENER CD STIFFENER© STIFFENER ©
_Y f-o" -_
DIAGONAL BRACING DESIGNATED ABOVE BY ®
Figure 1(b). Details of SG and SB girders.
periment design was directly related to the plain welded beams (PW) reported in NCHRP Report 102 (1).
The SA series beams had only Type 1 stiffeners and were subjected to an alternating shear condition as shown in Figure 2. This changed the direction and the magnitude of

4
the principal stress during each stress cycle. These beams were designed to evaluate the effect of oscillating the prin-cipal stress between two limits, as opposed to the constant direction of principal stress range experienced by the other test series and earlier studies. This loading provided a simulation of the actual service condition of bridge struc-tures where comparable oscillations occur.
The SG and SB series specimens were 38-in.-deep welded girders 20 ft long and tested on a 19-ft span. Each girder had all three types of stiffeners. The SG series was com-posed of ten A441 steel girders and four A514 steel girders. The SB series had eight A441 steel girders that were iden-tical to the SG girders but had Type 1 and Type 3 stiffen-ers adjacent to the load points as shown in Figure lb. The lateral bracing introduced an out-of-plane displacement that was proportional to the vertical displacement of the girder.
The remaining 1 4-in.-deep welded beams had attach-ments of different lengths welded to both flanges, as shown in Figure 3. These beams were grouped in four series corresponding to the attachment length. The A8, A4, and A2 series had, respectively, 8-in., 4-in., and 2-in, plates 3 in. wide and %2 in. thick welded flat on the outside of the flanges. The AQ series had %2 X 2 X 3-in, plates welded outstanding on the flanges. All attachment plates extended beyond the flange edge by 1 in. All beams with attachments were 10 ft 6 in. long and were tested on a 10-ft span, as shown in Figure 3. The attachments were all po-sitioned in the moment gradient region 6 to 10 in. from the
,/ Shear Force Range
2'4 x 6'4
141 Stiffener I
load points. The distance was selected to ensure fatigue failure at the attachment prior to failure as a plain welded beam.
Minimum stress and stress range were selected as the controlled stress variables in all tests except for the SA series. This permitted variation in one variable while the other was maintained at a constant level. The nominal flexural stresses in the base metal of the tension flange or web at the welded detail were used as design variables. The flexural stresses for the plain welded beam were also related to those of the earlier studies. Because the stiffen-ers were all full depth to simulate those used on bridge members, it was not possible to generate extreme values of shear-to-bending stress ratios and their corresponding high principal stress conditions that would lead to crack growth. Earlier studies had accomplished this by terminating the stiffeners several inches above the tension flange.
EXPERIMENT DESIGN
Each beam series was arranged in factorial experiments defined by the stress variables. The factorial used for the stiffened beam series is given in Appendix B, with the mini-mum stress and stress range being the variables. Similar factorials were used for the other test series, but most were incomplete with some empty cells because of yielding, equipment capacity, and extremely long life.
Each cell of Ilie faeloiial that had test specimens COil-
tamed at least two details for a given beam series. Most contained three or four details. Because the study re-ported in NCHRP Report 102 indicated that minimum stress was not a significant factor, the totals of specimens
,r%x6%
V.
( Web
tdv - 6" AQ Series
L-1 -.-'.- 8' A2 Series 10 A4 t A8 Series
3-3 3-6' __- 3'-3"
1—j--%x 2 x3 x 3 x L
-
LJLJ /4
2 4,&8 ATTACHMENTS ATTACHMENTS
For A4 Series
I6
Figure 2. Details of SA beams with alternating shear. Figure 3. Details of beams with flange attachments.

for each level of stress range were made as nearly equal as possible so that the distribution was not biased. This was necessary because few of the factorials were complete.
FABRICATION
All welded beams and girders were fabricated by a typical bridge fabrication shop. The fabricator was instructed to use normal fabrication techniques, workmanship, and in-spection procedures. Each beam and girder was fabricated using the same technique and procedure. All attachments or stiffeners were added after the beam fabrication.
For each thickness of material, most beam and girder component plates were produced from the same heat. The rolled W14 X 30 beams meeting the physical and chemical requirements of A514 steel were furnished from one heat and the WlO X 25 beams from two heats.
Components of the welded beams and girders were flame-cut to size and the weld areas were blast-cleaned. All longitudinal fillet welds joining the flanges and web of the steel beams and girders were made by the automatic submerged-arc process. Tack welds required to hold the plates in alignment were manually placed. The Yin-in, web-to-flange fillets for the 14-in.-deep A441 steel beams were made with AWS F72-ELI2 electrodes of %4-in. diameter. The 38-in.-deep A441 steel girders had 1'-in weh-tn-flange
fillets made with Ye-in. F71-EL12 electrodes and the cor-responding A514 steel girders had ¼-in, fillet welds made with %24n. F72-EM12K electrodes. No preheating was used prior to the welding of any of the steels.
The longitudinal fillet welds were kept continuous, al-though several stop-start positions were unavoidable. Any
defects that were visually apparent were gouged out and nwl'Jcd, and the repair was identified.
The stiffeners for the SG and SB girders were welded manually in the fabricating shop. All other stiffeners and attachments were placed at Fritz Engineering Laboratory using manual welding.
EXPERIMENTAL PROCEDURES
All 14-in.-deep specimens were tested initially on a 10-ft span with two-point loading, as shown in Figures Ia, 2, and 3. The distance between the loading points was 2 ft for the W14 X 30 rolled beams, 5 ft 6 in. for SA series beams, and 3 ft 6 in. for all other beams with stiffeners and attachments. The WlO X 25 beams were tested on a 7-ft-6-in, span with two load points 1 ft 6 in. apart. The 38-in.-deep girders were tested on a 19-ft span with two-point loading 5 ft apart, as shown in Figures lb and 4.
Because the stiffeners and attachments were located in the moment gradient region, testing could be continued on a shorter span when failure occurred at only one end of the 10-ft-long specimens. A single concentrated load was ap-plied at the load point of the other end such that the same stress condition existed at the weld detail (Fig. 5).
In a number of 14-in, beams and all of the 38-in, girders testing was continued after a failure at a detail by splicing the cracked region. Splicing was accomplished by placing lap plates on both sides of the tension flange and fastening in place with C-clamps, as shown in Figure 6. When sub-stantial portions of the web had cracked in the shear span of girders with stiffeners, it was also necessary to add a doubler plate to the beam web. This plate was attached by fillet welds.
Figure 4. Test set-up for SG girders.

I I
II
- 3'-30 — 3_91.
Moment
Shear --------1
Figure 5. Moment and s/i ear diagrams for continuation of beam testing.
The order of testing the specimens for each test series was randomized so that uncontrolled variables would be randomly distributed. This prevented any systematic bias from being introduced into the experimental data.
The testing equipment used at both Lehigh and Drexel Universities was manufactured by Amsier. The pulsators activating the jacks operated at between 200 and 800 cycles of load application per minute. When reversal of loading was required and the tests on alternating direction of prin-cipal stress (SA) were conducted, a constant upward load was applied by a hydraulic accumulator load system.
All reversal loading of rolled and welded beams was done at Lehigh. All 38-in, girders were also tested at Lehigh.
The deflection criterion used to define failure was the same as used for the studies reported in NCHRP Report 102. An increase of deflection by 0.020 in. terminated the loading automatically by activating a microswitch. This usually occurred when the crack had propagated through enough of the flange for net section yielding to occur. The cracks at flange attachments and at Type 3 stiffeners were larger than the cracks in the flange at Type 1 stiffeners when failure occurred. However, much more of the web was cracked in the latter cases, which caused yielding of the flange.
Figure 6. Tension flange splice to arrest crack growth.
CHAPTER TWO
FINDINGS
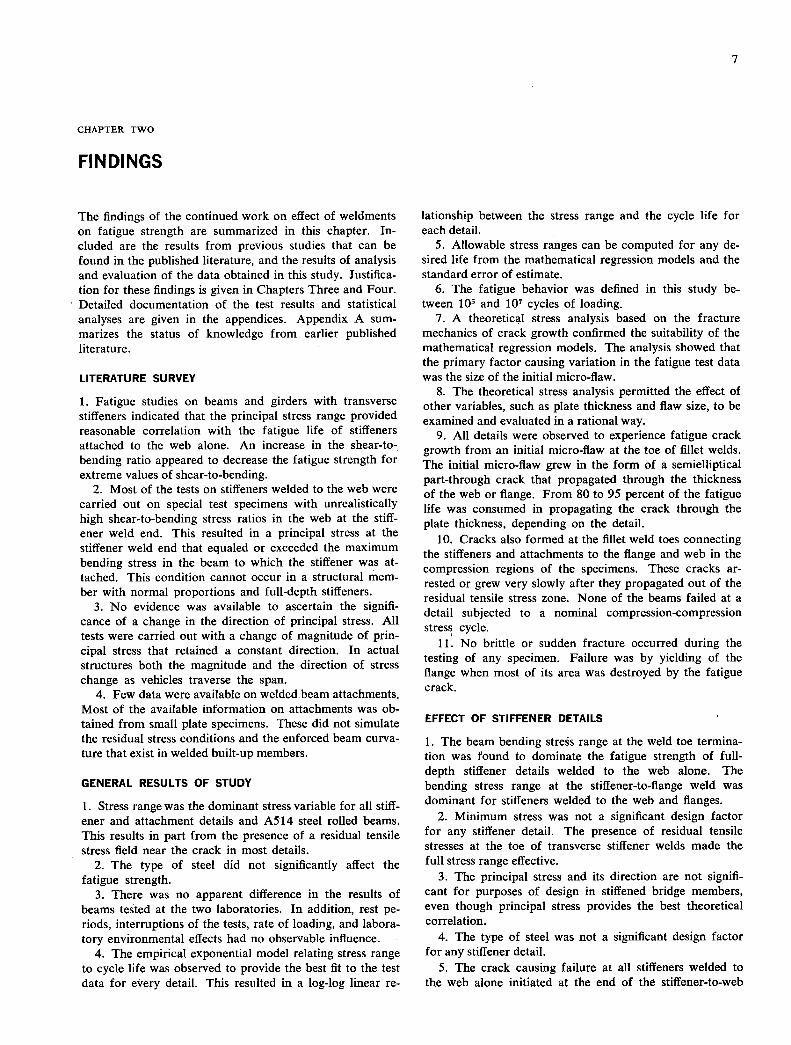
The findings of the continued work on effect of weidments on fatigue strength are summarized in this chapter. In-cluded are the results from previous studies that can be found in the published literature, and the results of analysis and evaluation of the data obtained in this study. Justifica-tion for these findings is given in Chapters Three and Four. Detailed documentation of the test results and statistical analyses are given in the appendices. Appendix A sum-marizes the status of knowledge from earlier published literature.
LITERATURE SURVEY
1. Fatigue studies on beams and girders with transverse stiffeners indicated that the principal stress range provided reasonable correlation with the fatigue life of stiffeners attached to the web alone. An increase in the shear-to-bending ratio appeared to decrease the fatigue strength for extreme values of shear-to-bending.
Most of the tests on stiffeners welded to the web were carried out on special test specimens with unrealistically high shear-to-bending stress ratios in the web at the stiff-ener weld end. This resulted in a principal stress at the stiffener weld end that equaled or exceeded the maximum bending stress in the beam to which the stiffener was at-tached. This condition cannot occur in a structural mem-ber with normal proportions and full-depth stiffeners.
No evidence was available to ascertain the signifi-cance of a change in the direction of principal stress. All tests were carried out with a change of magnitude of prin-cipal stress that retained a constant direction. In actual structures both the magnitude and the direction of stress change as vehicles traverse the span.
Few data were available on wcldcdbeam attachments. Most of the available jnformation on attachments was ob-tained from small plate specimens. These did not simulate the residual stress conditions and the enforced beam curva-ture that exist in welded built-up members.
GENERAL RESULTS OF STUDY
1. Stress range was the dominant stress variable for all stiff-ener and attachment details and A514 steel rolled beams. This results in part from the presence of a residual tensile stress field near the crack in most details.
The type of steel did not significantly affect the fatigue strength.
There was no apparent difference in the results of beams tested at the two laboratories. In addition, rest pe-riods, interruptions of the tests, rate of loading, and labora-tory environmental effects had no observable influence.
The empirical exponential model relating stress range to cycle life was observed to provide the best fit to the test data for every detail. This resulted in a log-log linear re-
lationship between the stress range and the cycle life for each detail.
Allowable stress ranges can be computed for any de-sired life from the mathematical regression models and the standard error of estimate.
The fatigue behavior was defined in this study be-tween 105 and 107 cycles of loading.
A theoretical stress analysis based on the fracture mechanics of crack growth confirmed the suitability of the mathematical regression models. The analysis showed that the primary factor causing variation in the fatigue test data was the size of the initial micro-flaw.
The theoretical stress analysis permitted the effect of other variables, such as plate thickness and flaw size, to be examined and evaluated in a rational way.
All details were observed to experience fatigue crack growth from an initial micro-flaw at the toe of fillet welds. The initial micro-flaw grew in the form of a semielliptical part-through crack that propagated through the thickness of the web or flange. From 80 to 95 percent of the fatigue life was consumed in propagating the crack through the plate thickness, depending on the detail.
Cracks also formed at the fillet weld toes connecting the stiffeners and attachments to the flange and web in the compression regions of the specimens. These cracks ar-rested or grew very slowly after they propagated out of the residual tensile stress zone. None of the beams failed at a detail subjected to a nominal compression-compression stress cycle.
No brittle or sudden fracture occurred during the testing of any specimen. Failure was by yielding of the flange when most of its area was destroyed by the fatigue crack.
EFFECT OF STIFFENER DETAILS
1. The beam bending stress range at the weld toe termina-tion was found to dominate the fatigue strength of full-depth stiffener details welded to the web alone. The bending stress range at the stiffener-to-flange weld was dominant for stiffeners welded to the web and flanges.
Minimum stress was not a significant design factor for any stiffener detail. The presence of residual tensile stresses at the toe of transverse stiffener welds made the full stress range effective.
The principal stress and its direction are not signifi-cant for purposes of design in stiffened bridge members, even though principal stress provides the best theoretical correlation.
The type of steel was not a significant design factor for any stiffener detail.
The crack causing failure at all stiffeners welded to the web alone initiated at the end of the stiffener-to-web

8
weld. When stiffeners were welded to the web and flange the crack initiated at the toe of the stiffeñerto-flange weld.
Failure of beams occurred after the crack had de-stroyed most of the tension flange of all beams. Cracks originating in the web propagated into the flange and eventually terminated the test.
The same stress range-life relationship is equally ap-plicable to stiffeners welded to the web alone or stiffeners welded to the web and flange when the stress is determined in terms of the beam bending stress range at the weld toe termination where cracks first occur.
Attaching diagonal bracing to the stiffeners of beams and girders had no effect on their fatigue strength. Within the range of estimated lateral forces and displacements on highway bridges, the out-of-plane deflection at the stiffeners had no influence on crack growth.
No fatigue (endurance) limit was observed for the bending stress ranges that were examined for the stiffener details (13.7 to 28.7 ksi). The %2-in. attachments, which were analogous to stiffeners welded to the flange, sustained 10.8 to 15.5 million cycles without failure or visible crack growth at a stress range of 12 ksi.
A fracture mechanics analysis of crack growth in-dicated that the behavior of stiffener details was not sig-nificantly affected by the thickness of the flange or web plate.
EFFECT OF FLANGE ATTACHMENT DETAILS
1. The failure lives of the different attachment details dif-fered, with the life decreasing as the attachment length increased.
The crack causing failure of all attachment details originated at the most highly stressed weld toes of the welds connecting the attachment to the beam flange. At ends of transversely welded attachments the crack originated at several sites along the weld toe, but was more severe near the center of the weld. At attachments without transverse welds the cracks initiated at the weld toe at the termination of the longitudinal fillet weld.
End-welded short attachments gave shorter lives than those with unwelded ends. The difference was apparent but not statistically significant.
Failure occurred in the tension flange of all beams with flange attachments. Many cracks were also observed in the compression flange at the weld toe terminations. When the flange was subjected to nominal compression stress these cracks were arrested after they grew out of the local residual tensile stress zone. When subjected to stress reversal some additional crack growth was apparent.
Minimum stress was not a significant variable for any of the attachments examined. The presence of residual tensile stresses at weld toes made the full stress range effective.
Although slight differences in the slopes of the mean regression lines existed, these differences were not signifi-cant. The difference reflected the small number of test specimens evaluated for each attachment length. Over-all, the slopes of all attachments were about the same as the plain welded and cover-plated beams.
A fracture mechanics analysis of crack growth ac-counted for the fatigue behavior of the flange attachments. The primary cause of the differences in fatigue life among various attachment lengths was found to be the differences in the stress concentrations at the terminating weld toes.
No fatigue limit was observed for the 4-in, and 8-in. attachments for the stress ranges that were examined (8 to 24 ksi). The %2-in. and 2-in, attachments were tested with the stress ranges of 12 and 28 ksi. No fatigue limit was observed for the 2-in, attachment. The %2-in. attachments exhibited no failures at the 12-ksi stress range level.
DESIGN
1. Stress range should be used for the fatigue design of the details evaluated in this study. The results of this study, coupled with the work reported in NCHRP Report 102, suggest that a comprehensive fatigue specification based on stress range is appropriate.
For purposes of design, the type of steel does not significantly influence the fatigue strength. Although most of the specimens were fabricated from A441 steel, the few tests undertaken on A514 steel girders and rolled beams during this study continued to confirm the earlier findings.
The same stress range values are applicable to trans-verse stiffeners and very short attachments (less than 2 in.) when defined in terms of the beam bending stress range at the weld toe termination. The stress range values are 10 ksi for more than 2 million cycles, 13 ksi for 2 million cy-cles, 19 ksi for 500,000 cycles, and 32 ksi for 100,000 cycles.
The magnitude of shear need not be considered when determining the allowable bending stress range for fatigue of full-depth stiffener details welded to the web alone.
Welding transverse stiffeners to the tension flange should be permitted where desired. The allowable bending stress range at the termination of the flange weld toe is the same as for stiffeners welded to the web alone. The fatigue strength is directly comparable to the behavior observed for %2-in. attachments and much greater than for attachments with length equal to or greater than their width.
Diagonal bracing for beam and girder bridges can be attached to stiffeners without influencing their fatigue re-sistance.
New design categories should be added to the AASHTO specifications to provide for the effect of attach-ment length on the fatigue strength.
When the attachment length, L, is greater than 2 in. but less than twice the attachment width (the width is defined by the part overlapping the flange surface), and is connected by welds parallel to the line of stress, the stress range values are 7.0 ksi for more than 2 million cycles, 10 ksi for 2 million cycles, 16 ksi for 500,000 cycles, and 27 ksi for 100,000 cycles.
When the attachment length, L, is greater than twice the attachment width, the stress range values should be the same as those used for cover-plated beams.

9
The provisions for A36 and A441 rolled beams (base metal) are applicable to A514 steel rolled beams.
Design criteria are recommended on the basis of fatigue life and stress rangc. During most of the fatigue
life the cracks were very small and not visible. When the cracks that grew at the stiffener or attachment weld toe penetrated the web or flange plate thickness, most of the fatigue life was exhausted.
CHAPTER THREE
RESULTS AND EVALUATION OF FATIGUE STRENGTH
The results of the experimental and theoretical work un-dertaken on this project are summarized in this chapter for the rolled beams, welded beams and girders with stiff-eners, and welded beams with attachments that were studied. Each detail is examined in terms of crack initi-ation and growth, an evaluation of the stress variables and special test conditions, and, finally, a comparison with the results available from previous studies. Complete docu-mentation of the test data and details of the analysis are given in the appendices.
FATIGUE STRENGTH OF A514 STEEL ROLLED BEAMS
Twenty-two rolled W14x30 beams of the ASTM A36 and A441 grade steels were tested in the original test pro-gram (1). The experiment was not as extensive as that for the welded beam study and reflected the limitations in stresses because of yield strength or excessive cycle life. A514 steel rolled beams were tested during the continu-ation of the test program. Nine W14x30 and 20 W10x25 beams were tested.
Crack Initiation and Growth
From the original program, many cracks in the A36 and A441 steel rolled beams originated at locations of high local stresses at the load points (1). Fretting contributed to the initiation of these cracks (2). It was difficult to judge the influence of fretting and local stresses. This was also true for cracks that originated underneath the wooden stiffeners that were inserted at the load points.
The test on the A514 steel rolled beams used improved setup arrangements, which made it possible to eliminate most of the local influences. Lateral braces in the shear span were used in place of the wooden stiffeners. Cracks usually developed from the flange tip or from the flange surface.
The cracks in the plain rolled A514 steel beams origi-nated from the rolled surface of the tension flange. Cracks generally initiated from small discontinuities in the flange surface that were apparently introduced by the normal rolling operation or by locally adhered mill scale. These discontinuities were much smaller than the porosity ob-
served in the plain welded beams. A typical crack starting from a surface discontinuity is shown in Figure 7. The region where slow growth had prevailed over a large por-tion of the life is apparent from the smooth fracture ap-pearance.
Cracks that initiated from the flange tip developed from both the inside and outside corners of the flange tip. This location probably was an exposed part in the rolling proc-ess. A few laminations in the flange edge were observed to cause crack initiation and growth, as shown in Figure 8.
Cracks also started on the inside flange surface, as well as from the extreme fiber. Five run-outs (1 07 cycles) were observed for the A514 steel rolled beams at stress ranges between 34 and 36 ksi.
Effect of Stress Variables and Type of Steel
Some of the test data from A36, A441, and A514 steel beams are compared with data from previous investiga-tors (3, 4, 5, 6) in Figure 9. Only cracks that originated from the rolled flange surface away from possible load influence are represented. The solid points identify the beams tested at Lehigh. Previous studies are also cate-gorized according to the yield strengths reported. Most of these data from previous studies are for the high-strength T-1 steel rolled beams. No failure occurred for a number of beams at 4 to 7 X 10⁶ cycles of loading, even with stress ranges as high as 55 ksi (4). Run-out of the beams was then assumed in these studies. Run-outs are indicated by arrows on the data points in this report. The number of beams surviving a large number of cycles increased with decreasing stress range. All data fall above the mean of the plain welded beams and a small increase in life is found at the lower stress ranges.
Gurney (7) reported that four plain welded beams failed from the extreme fiber and approached the life of rolled beams. A small reduction in life is apparent in Figure 9 when these data are compared to the rolled beam data. This might be due to higher residual tensile stresses at the flange-web junction in the welded beams and difference in beam geometry.
Rolled beams with cracks originating from the flange tip were distinguished from beams with surface flaws in the

10
Figure 7. Crack initiation from a flaw in the rolled surface of a plain rolled bea,n.
study. Their results are plotted with solid symbols in Figure 10. The scatter is relatively large at each level of stress range. The data for plain welded beams with flange-tip cracks from Ref. I are also replotted in Figure 10 (open symbols). The comparison reveals a reduction in fatigue life for cracks that started at the flame-cut flange tip of welded beams as compared to those that started at the flange tip of rolled beams. This was expected because:
Only the most severe flange-tip notches in welded beams became critical inasmuch as the discontinuitjes in the longitudinal fillet weld generally provided the critical flaw condition and terminated the test before failure was possible from the flange tip.
The notches introduced by good.quality flame-cutting (equivalent ASA smoothness of 1,000 or less) that caused
failure were more severe and sharper than the notches introduced by the rolling operation.
The notches in the flame-cut edge were in zones of high residual tensile stresses. The residual stresses at the tips of rolled beams are usually compressive.
All rolled beam data, including the beams failing from the possible influence of load, are summarized in Figure 11. The test data are classified according to the failure mode regardless of grade of steel. All data from other investigators (3, 4, 5, 6) are from beams that tailed from the rolled surface (Fig. 9). Also shown in Figure 11 are test data from machined tension specimens of T-1 steel (8).
The following conclusions can be drawn from Figures 9, 10 and 11:
Figure 8. Erain pie of crack initiation froni the flange tip.

,Ij 11 -
The longest lives observed for rolled beams approach the life of plain plate specimens.
+1 - A run-out level (assumed to be 10 cycles or more) a
may exist in the vicinity of 30-ksi stress range. This run- out level appeared to be higher for A514 steel beams.
• Three achieved 107 cycles at a 34-ksi stress range without .
visible cracking. a 3. At higher stress ranges, the number of beams that
• -n sustained a large number of cycles without failure
• decreased. 0 w a 4. Severe notches in a flange surface or at a flange tip
EE 0 O)
w can initiate cracks in a rolled beam and cause failure at 4 - . much lower levels of stress range, as illustrated by the • a) 0 failure of an A514 steel beam at the 20.5-ksi stress range
0 Cr level.
0 c c
(ii — - It) ..i Rolled beams provide the least severe flaw condition for 65 OL > a structural element and can yield extremely long lives at
• high stress range levels. However, a large discontinuity in the surface or at the flange tip can reduce the fatigue life of the beam substantially. This was observed in a few
• 0 . beams in the high stress range region, and in one beam
o a failing in the shear span from a large notch in the flange
o I') I < tip. These beams yielded fatigue lives equivalent to the
.. mean life for welded beams.
I 0 o Flaw size estimates for rolled beams were derived from I I
0 00 0 0 0 the fatigue test data using fracture mechanics concepts. A 2 Ifl N) c'J -
(!SI) '9NVèJ SS3IS LZ
-u
-2 . I.-
—2
a J .0
-U, a
—U)
I -n a I /o —
(D -a U In
- /4. It)
E 0 1, /• St
0 a, CO a S/ 540/ (0
• 0 a, '- 0)0) a
o x
8w a) 2 I-
Wa. -a
•
- 40 ! oh —2a In
.
I
0
9LL a 0
X W a) o-u 0 4 0/ (J)O 0
W I u_s o 4* C C]) 0 0
Xo -U,_JE a >- •
0 x Ef
0 1o_ o-u 04/ ICr 0 S
j
U wo, .E • a L
sit — a-u a 00 a
4/ uoO 0 I(D—
IN)IT t() La 0 4.0sf E E
/ a a : 0
I I I 2 • 0 I 0 00 0 0
2 U) N) C'-J 0 If)
L. aU
0 00 0 0 0 tt) 0 — a
('S)9NVeI SSIS U —
(!S) '30NVe SS3è1S

12
depth of discontinuity between 0.004 and 0.006 in. was estimated for cracks that originated from the rolled sur-face. This crack size is an order of magnitude smaller than the equivalent penny-shaped crack (ae = 0.04 in.) in welded beams (9). The discontinuities in the rolled beams are believed to be introduced during the rolling operation or result from mill scale adhered locally to the flange surface.
The analysis also indicated that flange-tip flaws in the rolled beams were somewhat larger than the surface flaws. The radius of a quarter-circular crack with origin at the flange corner was estimated to be 0.010 to 0.014 in. This larger defect was reflected by the fatigue data, which indi-cated shorter lives for rolled beams failing from flange-tip flaws. Large or sharp notches at the flange tip should be repaired by grinding to avoid a reduction in the fatigue life of the beam.
Run-out data (N> 101 cycles) were observed in Fig-ures 9 to 11 at the 30-ksi stress range level for A36 steel rolled beams and at 34 to 36 ksi for A514 steel rolled beams. These run-out levels were confirmed by compari-son with other rolled beam data. The run-out levels appear related to the fracture mechanics stress intensity range threshold values of 3.3 ksi VE and 4.6 ksi VIi for mild steel and low-alloy steel, respectively, suggested in Ref. 10.
FATIGUE STRENGTH OF BEAMS AND GIRDERS WITH
TRANSVERSE STIFFENERS
Sixty-nine welded beams and girders with transverse stiff-eners tested during this study provided data on 118 stiff-ener details. The stiffeners were either welded to the web alone or welded to both the web and the flanges. Depend-ing on their location on the test specimens, they were defined as:
Type 1: Welded to web alone, in a region of bending and shear.
Type 2: Welded to web alone, in a region of pure bending.
Type 3: Welded to web and flanges, in a region of bending and shear.
With the exception of the beams subjected to alternating direction of principal stress (SA series), all specimens had these three types of stiffeners, as shown in Figure 1.
The 14-in, beams (SC series) were designed to fail first at the Type 3 stiffener at the tension flange. The test was then continued on a shorter span by applying a single con-centrated load, as shown in Figure 5. During this retest the shear and bending moment in the moment gradient region were identical to those previously applied to the Type 1 stiffener. The stress condition for the Type 2 stiff-eners changed and prevented data from being acquired at this detail. Data on the Type 1 stiffeners were acquired when the beams were further tested after completion of all initial tests at the Type 3 stiffener. The rest period between tests had no detectable effect on the fatigue life.
The first failure of the girder specimens could occur at any of the three stiffener details or along the web-to-flange fillet welds. The details had been designed for comparable behavior. Splicing the tension flange with lap plates and
high-strength C-clamps after failure at a detail permitted acquisition of data from other details.
Beams with stiffeners subjected to alternating direction of principal stress (SA beams) had only one type of test stiffener. They were not retested and cracks were only detected at the most severely stressed stiffener.
Crack Initiation and Growth
Fatigue crack propagation at all three types of stiffeners had one major feature in common: the cracks initiated and grew from the toe of nonload-carrying stiffener fillet welds. The extent of crack propagation during testing was determined by visual inspection with a magnifying glass and by magnetic particle inspection with the Parker con-tour probe.
In general, initiation and growth of fatigue cracks are most likely to occur in areas subjected to a high tensile stress range and where initial flaws exist. The higher the stress range and the larger the initial flaw, the faster fa-tigue cracks propagate. Stress concentrations and initial flaws exist along the toe of the fillet welds connecting the stiffeners to the web or flanges and provide a condition favorable for crack growth.
The initial micro-flaw condition is provided by discon-tinuities at the weld toe, such as weld cracking, slag inclu-sions, and undercut. Imperfections of this nature are com-mon to all welding procedures (11, 12). These flaws can-not be avoided, although their sizes and frequency of occurrence may be controlled by good welding techniques.
The high tensile stress range is brought about by a com-bination of two effects. One is the geometrical stress con-centration produced by the weld and the stiffener, which magnify the nominal stresses due to loading. Further, a residual tensile stress field exists as the result of the weld-ing process. The net effect of having residual tensile stresses and the stresses due to applied repeated loads is a tension-tension stress range at the weld toe, even in cases of nominal stress reversal. In fact, fatigue cracks were observed at stiffener weld toes subjected to a nominal compression-compression stress cycle. These cracks, how-ever, were arrested as they outgrew the residual tension field and did not impair the load-carrying capability of the beam. Only when reversal of load occurred was there continued growth of these cracks.
Type 1 Stifleners
The cracks causing failure at Type 1 stiffeners, welded to the web alone, initiated at one or more points along the toe of the stiffener-to-web weld. They propagated in a direc-tion perpendicular to the principal tensile stress. Similar behavior was observed in the past (33, 34).
The over-all appearance of the crack seemed to indicate two growth patterns, one diagonally off the end of the stiffener, the other following the weld toe before branching off diagonally into the web as shown in Figure 12. The fatigue crack surfaces at Type 1 stiffeners were exposed by saw cutting most of the remaining net section of the beams and prying the remaining ligaments open. This fracto-graphic examination revealed the reasons for the two ob-served patterns. Cracks initiating at the weld toe at the end

13
of the stiffener grew in a direction perpendicular to the direction of the principal stress diagonally upward into the web and downward toward the web-to-flange junction, as shown in Figure 13. Cracks following the weld toe had multiple initiation points from which individual cracks grew in separate planes, each one perpendicular to the di-rection of the principal stress at that point. As the indi-vidual cracks overlapped, they broke through and joined each other, forming a longer crack with an irregular con-tour along the weld toe, as shown in Figure 14. This phe-nomenon gave the appearance of a crack growing along the toe of the weld. Once this pattern had developed, it was sustained by the stress concentration effect of the weld, which created a more severe path for propagation along the toe than for growing diagonally into the web away from the weld toe. Eventually the crack branched off when the principal stress became comparatively more severe.
Typically, the crack advanced through three stages of growth, as shown in Figure 15. In the first stage, one or more semielliptical cracks were driven through the thick-ness of the web plate, as shown in Figure 14. Each crack retained the approximate shape of a semiellipse, as long as it did not join and interact with adjacent cracks.
Once the crack front had penetrated the web plate, the crack changed into a two-ended through crack. This tran-sition from stage 1 to stage 2 after web plate penetration occurred within a small number of cycles. Figure 14c shows one part-through crack at the beginning of the transition and one at the end.
In the third stage, after the lower front of the two-ended crack had broken through the extreme fiber of the tension flange, it grew as a three-ended crack (see Fig. 13) across the flange and extended farther up into the web.
Figure 12. 1...pical failure at Type I .ctifle,,er.
Eventually, the ever-decreasing net cross section of the flange yielded, and the test was terminated before the flange fractured. No 'brittle" fracture was observed in these specimens.
Of the total number of cycles to failure at Type I stiff-eners. about 80 percent were consumed in growing the crack through the thickness of the web plate during stage 1. The second and third stages amounted to approximately 16 percent and 4 percent, respectively, as shown schemati-cally in Fig. 15. A more detailed discussion is given in Appendix E.
Figures 13 and 14 show small ellipses inside the fatigue crack surface. They correspond to the crack size at the time the beam had failed at Type 3 stiffeners and reflect the oxidation of the crack area.
The 14-in. SC beams had a shear-to-bending stress ratio of 0.31 at the end of the Type I stiffener. Six of the 22 detected cracks were observed to have grown for some length along the weld toe of the stiffener under these stress conditions. In previous fatigue tests where the shear-to-bending stress ratios varied between 0.72 and 5.16 (see Appendix A), all cracks at Type 1 stiffeners grew diago-nally off the stiffener-to-web weld.
Good agreement was found between the plane of the cracks (71 to 740) and the plane of the principal stress (740) at the tension (bottom) end of the Type 1 stiffener. At the compression (upper) end of Type 1 stiffeners, the
Figure 13. Tv pica! fatigue crack stir/ace at Type I stiflener at failure.

'••
:• :i. -
••i,l' ;
4..
14
Figure 14. Fatigue crack at toe of Type / sti/jener-to-web weld, s/lowing: (left) 0.035-in-deep crack (SCB243), (center) multiple fatigue cracks, and (right) multiple fatigue cracks throng/i iteb.
direction in which the crack grew varied from —51° to —63°. There the direction of the principal stress cannot be defined precisely because it varies with the magnitude of the residual tensile stresses. It was also affected by the nearby loading point.
The 38-in, girders had a less steep bending stress gra-dient over the depth. This condition, combined with the lower shear-to-bending stress ratio of 0.22 at the end of the Type I stiffener, enhanced the likelihood for multiple crack initiation and growth along the toe of the stiffener-to-web weld. Indeed, of all 22 girders tested only one specimen (SGB 211) exhibited crack propagation diagonally off the end of the stiffener, at an angle of 81°. The plane direc-tion of the principal tensile stress had an inclination of 78° and 81° according to beam theory and a finite element analysis, respectively.
Two SG girders developed cracks at the toe of the stiffener-to-web weld facing the support. In three speci-mens, cracks developed simultaneously along weld toes at both sides of the stiffener. These cracks were at different elevations on the girder web and grew on separate vertical planes at each side of the stiffener. When the approaching fronts of two small cracks overlapped each other, their growth was arrested. Growth then continued at other loca-tions along the weld toe. In contrast to the beams, no
cracks were observed at the stiffener end in the compres-sion region of the girder web.
The four SG girders fabricated from A514 high-strength steel appeared to be more susceptible to multiple crack initiation along the weld toe of the stiffeners. This indi-cated that there was greater likelihood of comparable defects all along the weld toe.
Crack initiation and propagation at the transversely braced Type 1 stiffeners of the SB girders followed the same characteristic pattern. Three of the eight specimens had cracks at the weld toes on both sides of Type 1 stiff-eners. In the remaining five, the cracks leading to failure propagated along the toe nearer to the support.
Type 2 Stifieners
Crack initiation and propagation at Type 2 stiffeners, welded to the girder web in a constant bending moment region, was identical to cracks at Type 1 stiffeners except that, in the absence of shear stresses, the plane of crack propagation remained perpendicular to the longitudinal axis of the girder. A Type 2 stiffener at failure is shown in Figure 16 and an exposed fracture surface in Figure 17.
Approximately 80, 16, and 4 percent of the total number of cycles to failure were spent in propagating a crack at a Type 2 stiffener through the three stages of growth

15
shown in Figure 18. This is comparable to the behavior of I ype I stitleners.
The initial flaw condition along the web weld toes of Type 2 stiffeners in girders fabricated from A14 steel was observed to be more severe than that in the A441 steel girders. The crack front spread over several inches along the weld toe early in stage I of growth, forming a tunnel-like shallow crack with one free surface, rather than the single or multiple semielliptical cracks characteristic of the A441 steel specimens. No visual difference in the A441 and A514 steel girder welds was apparent. As the front of the half-tunnel crack approached the far side of the web plate, the plane of the crack changed direction, a phe-nonienon indicative of the transition from a plane strain to a plane stress condition of crack growth. The exposed fracture surfaces of the cracks along Type 2 stiffeners in A514 steel specimens revealed the existence of a shear lip on the far side of the web plate.
From fracture mechanics, the larger the ratio of major to minor half-axis of a part-through crack, the higher the stress intensity factor and the faster the fatigue crack will grow in the direction of the minor axis. This is believed to explain why crack propagation during stage 1 was more rapid, hence the fatigue lives were shorter for A514 steel than for A441 steel specimens of this study.
Several things could have caused the severe iiiiiial ciack
171.
L ,)
I - .--
-
Figure 16. Tspical failure at lype 2 stiffener.
Stage I: Port - Through Crock in Web
Stage 2: Two - Ended Through Crock in Web
Stage 3 Three - Ended Crock
Specimen SGB 211
100% (4,433,000 Cycles)
0,
a 96 U)
94 0
76 Stage I F4
94
100 96 100
of
(stage 3)
Figure 15. Stages of crack growth at Type I stif-fener.
Figure 17. Typical fatigue crack surface at Type 2 stiflener at failure.

16
Specimen S(R 312
00% (2,204,000 Cycles)
98
96
93
74184 Cn h'I
0 Stagel
69
I 0
78
Stage I: Part - Through Crack 84
in Web
Stage 2: Two- Ended Through 93
Crack in Web
Stage 3 Three-Ended Crack 96 W
afl
(Stage 3)
Figure 18. Stages of crack growth at Type 2 sli/Jener.
Figure 19. Typical failure at Type 3 stiJJener.
rnnditirrn in A514 steel beams. The fabrication proccss may have produced more severe microdefects along the weld toe, such as slag inclusions and weld cracking. The A514 steel specimens had not been preheated before the A36 steel stiffeners were welded on with E70 electrodes. This may have resulted in a more severe initial flaw condi-tion. The combined effect of the residual tensile stresses and applied loads may also have influenced crack growth.
Type 3 Sti/Jeners
Type 3 stiffeners were welded to the web and the flanges. A typical fatigue crack causing failure at a Type 3 stiffener is shown in Figure 19. The crack initiated at several points along the toe of the fillet weld connecting the stiffener to the tension flange. Crack growth was characterized by the two stages shown in Figure 20. During the first stage, each individual crack propagated in a semielliptical shape, as shown in Figure 21. As the small cracks grew larger they became joined and eventually assumed the shape of a larger semielliptical crack, as shown in Figure 22. Before the crack front reached the extreme fiber of the tension flange, the crack width had spread over most of the weld length. After breaking through the extreme fiber, it grew in the second stage as a through crack across the tension flange and up into the web. Approximately 96 percent of the number of cycles to faihirc were ronciimed in growing the crack through the thickness of the flange, as shown in Figure 20. This was confirmed by visual observations of a number of beams. The remaining 4 percent of the life
Specimen SGB 312
11 100% (2,012,000 Cycles)
92 80 80
F \ - - -- ' I 98 100
Ofl
Figure 20. Stages of crack growth at Type 3 stiffener.

17
was spent in propagating the crack across the flange width and into the web. A more detailed discussion of this behavior is given in Appendix E.
Figure 23 shows a fatigue crack surface at a Type 3 stiffener after failure. The crack is seen to have initiated at the stiffener-to-flange weld. As it eventually advanced up into the web, it joined with a series of semielliptical cracks growing from the toe of the stiffener-to-web weld.
Three of four SG girders tested at a stress range of 18 ksi had no detectable cracks at Type 3 stiffeners after 4 to 6 million cycles of load application. Eight SG and SB girder specimens had part-through cracks in the flange. Testing was discontinued because of extensive cracking elsewhere.
The behavior of crack initiation and propagation at Type 3 stiffeners with transverse bracing (Series SB) was identical to the behavior observed in SC beams and SG girders.
Analysis of Data for Stiffeners Welded to the Web Alone
The effects of the primary variables were analyzed using statistical techniques. Explanations of these analyses are given in Ref. I, and the results are given in detail in Ap-pendix E.
Prior to examining the stress variables and their effects, the influence of locating the stiffeners near the load points was evaluated. As noted earlier, the stiffeners were located in a position that would ensure fatigue crack growth at the weld toe termination prior to developing a failure crack from the web-to-flange fillet welds. Pilot studies had shown that the location finally adopted was necessary to achieve this condition.
To gain insight into the local effects of load point on the stress distribution at the stiffener, a plane stress finite ele-ment analysis of the test specimens was carried out and the results were conipared with stress distribution by the conventional beam theory. Details are given in Appendix E.
Stress analysis indicated that at the stiffeners the load
Figure 21. 0.028-in-deep crack at toe of Type 3 stiffener-to-tension flange weld (SGC333).
had a negligible effect on the stress distribution in the beam and girder specimens. Hence, the stresses predicted by beam theory could he applied to the evaluation without biasing the results.
Stiffeners subjected to bending and shear (Type 1) and stiffeners subjected to bending alone (Type 2) were ex-amined individually to determine whether or not combined stresses needed to be considered in design. When stiffeners were located in a region of moment gradient, crack growth at stiffeners was observed at the weld toe termination. The crack grew approximately perpendicular to the principal stress.
Figure 22. Multiple fatigue crack growth at the toe of Type 3 stiffener-to-tension flange weld.

18
Figure 23. Typical fatigue crack surface at Type 3 stiffener at failure.
In evaluating the test data it was desirable to ascertain the significance of all the controlled variables. However, particular eniphasis was given to the relative effects of the principle stress as compared with the bending stress.
Type 2 stiffeners were located in a region of pure bend-ing moment and, therefore, were subjected to a stress con-dition not often encountered in structures. These stiffeners were provided to prevent buckling of the web between the loading points. They were cut 4 in. short of the tension flange, so that the weld detail at the end of the stiffener would provide about the same degree of severity as the other types of stiffener details.
Plain welded girder failures limited the acquisition of complete fatigue test data for the Type 2 stiffeners. When-ever a girder failed due to a crack growing from a defect in the web-to-tension flange weld and was 12 in. or less away from a Type 2 stiffener, it was not possible to acquire data at Type 2 stiffeners. The repair (see Fig. 6) influ-enced the stress distribution and subsequent crack growth at the nearby stiffener.
There were two Type 2 stiffener details, thus two ob-servations for each of the 22 SG and SB girders. Six of these 44 stiffeners developed three-ended cracks and con-stituted complete failure at 21 details a two-ended through crack in the web was found; and 17 Type 2 stiffeners exhibited only the first-stage crack growth without pene-trating the web.
Eflect of Type of Steel
To determine the effect of steel quality, the fatigue test data for the 6 SG girder specimens at the 2-ksi minimum stress level were evaluated. Three of these girders were made of A441 steel; the other three, of A514 steel. The results indicated that the stress range is the dominant variable and
that the effect of steel on the fatigue strength of Type 1 and Type 2 stiffeners was not significant.
From this small sample no general conclusion can be drawn, although the data points corresponding to the A514 high-strength specimens tend to fall along the lower half of the confidence band for all SG specimens with Type I stiffeners, as shown in Figure 24.
The data points corresponding to the four A514 girders with Type 2 stiffeners are plotted in Figure 25 with solid symbols. At each stress range level they are seen to give slightly shorter lives than were obtained from the A441 specimens. However, the difference is not significant when measured against the variance of the test data at a given stress range level. Because varying amounts of crack growth were experienced at the Type 2 stiffener, the three categories shown in Figure 18 are indicated in Figure 25 for each of the 44 details.
Effect of Stress Variables
In the analysis of the stress factorials for Series SC and SG specimens the stress range was found to be the domi-nant variable, whereas the effect of the minimum stress on the fatigue life was insignificant for both Type 1 and Type 2 stiffeners. As a result of this finding, the minimum stress was deleted from further consideration and a re-gression of the number of cycles to failUre was performed on the principal stress range at the end of the stiffener. The fatigue test data for the Type 1 stiffeners of the SC and SG series are plotted in Figure 24, together with the mean regression line and the limits of dispersion provided by two standard errors of estimate from the mean. As a visual check on the effect of the minimum stress, different symbols were used to plot the data at each level. That the effect of minimum stress was insignificant is also visually

I Crack Growth Stage I I at End of Test I °min I
23 I Braced
I} 2 Unbraced {2. 0
a 14
log NUIO.3I423.3298 log °r
$ = 0.0874 r = 0.95
- ?Q
- 'I
11
50 -
30 -
log NlO.8l39-3.4903 log 0 r
Ui - 40 -
((fl r 0.89 S 0.1492
(1) Z .• -- •
- hf 20 - 1 I—I— (flu)
U- -J o go — zio-z SG SC 0 m1n
A5l4 A441 a-
-10 . 0 2
5. $ . 0 14
105 06 107
CYCLES TO FAILURE
Figure 24. S-N plot for Type 1 stifieners, SG girders and SC beams.
19
apparent for the Type 2 stiffeners from the test data sum-marized in Figure 25. The existence of residual tensile stresses in the regions adjacent to the stiffener weld toes is believed to be the major factor making the full stress range effective at all minimum stress levels.
Only two of the five SC beams tested at the lowest stress range level exhibited visible cracking at the Type 1 stiff-ener. All five points were excluded from the analysis of variance and the regression analysis to avoid any bias. At this stress range level (principal stress range = 14.8 ksi), the threshold of fatigue crack growth is being approached. However, the fatigue limit was not defined by this study because failures were observed at this lower level.
Effect of Out-of-Plane Deformation from Transverse Bracing
The analysis of variance for SB girders with transverse bracing revealed that the variation of the ratio between horizontal and vertical deflections at Type 1 stiffener had no significant effect on the number of cycles to failure. Stress range accounted for the variation of fatigue life and was not affected by the out-of-plane deformation. These results were compared to those from the SG girders with no out-of-plane deformation. A significant difference be-tween the two girder series was observed when all girders were considered. The A514 steel specimens were then deleted from the SG series because none were included in
Solid Symbols: A514 Open Symbols: A441
3L 10
106 CYCLES TO FAILURE
Figure 25. S-N plot for Type 2 stifieners, SG girders.

log NI0.8I39-3.4903 log 0 r s = 0.1492
0.89
__ 'i•+ .- OD_. + '" I
°'min
0 '6 '3 + 0 • 2
50 w -
40
c it 30
U) u UJU-
20 U,':') j IJ
go zw
- IC QcX
the SB series, and the factorial was reanalyzed. The results confirmed that the transverse bracing did not affect the fatigue life at the 5 percent significance level. The results are summarized in Figure 26 for the Type 1 stiffeners. It is apparent that the bracing provided a lower bound to the test data, because the SB data points fall near or above the mean line for the 28 SG and SC specimens.
The results regarding the effect of steel type on bracing appear to contradict those at other details. This simply suggests that the A5 14 steel girder sample was too small to permit a conclusive analysis. The effect of type of steel appears to be marginal for the welding procedure used. Even if the observed trend were to be confirmed by testing a larger sample of A514 steel girders, the slight difference in fatigue life is probably not sufficient to treat type of steel as a variable in design.
Transverse bracing members were only attached to Type 1 and Type 3 stiffeners. Hence, the bracing was not expected to influence the fatigue life of Type 2 stiffeners. The results of the analysis of variance confirmed this.
The mean line given in Figure 25 represents a low esti-mate of the fatigue life, because data points from all three stages of growth were included in the regression analysis. It is apparent that most of the specimens had only exhibited fatigue cracking in the web and that additional increments of life would have been possible had the test not been terminated.
EfJect of Specimen Size
The effect of specimen size was checked with a t-test in which the significance of the difference between the cor-responding coefficients of the mean regression lines for Type 1 stiffener of the SC beams and SG girders was de-termined. The results indicated that welding a Type 1 stiffener to a 14-in, or 38-in, specimen did not significantly affect the fatigue life of the detail at the 5 percent signifi-cance level.
Although statistically insignificant, the fatigue strength of stiffeners welded to the web alone appears to be slightly higher for the 14-in.-deep beams (Fig. 24). It is believed that this results from the stress gradient across the speci-men depth. The stresses along the toe of the stiffener-to-web weld decrease more rapidly in the 14-in, beams than in the 38-in, girders and this logically will increase the fatigue life. The 38-in.-deep specimens are more repre-sentative of the large-size welded plate girders used in highway bridge construction.
Effect of Alternating Shear
The SA beams were subjected to alternating loads that caused the direction of the principal stress at the end of Type 1 stiffeners to change about the horizontal axis from —9.5° to 6.7°. The corresponding shear-to-bending stress ratio varied from 0.17 to 0.12. Because the difference be-tween the principal and the bending stress at the maximum load amounted to less than 2 percent, the fatigue lives were plotted in Figure 27 against the bending stress range at the stiffener end. Good agreement was observed between the fatigue strength of Type 1 stiffeners in Series SA and SC. The data points fall just below the mean regression line for plain welded (PW) beams. The results suggest that details subjected to variable principal stress conditions are more dependent on bending stress than principal stress.
Bending Versus Principal Stresses
The AASHO specifications (13) set limits of 0.55FV and 0.33FY on the allowable bending and shear stresses for structural steels. If both were to occur at the same point, the shear-to-bending stress ratio would be 0.6, and the principal stress would be 28 percent higher than the bend-ing stress.
Stress ranges are induced by live loads. Single truck loads contribute most to the fatigue damage of short- and
106
io CYCLES TO FAILURE
Figure 26. S-N plot for Type I stiffeners, SB girders with transverse bracing.

21
CYCLES TO FAILURE
Figure 27. S-N plot for Type 1 stifleners, SA beams with alternating shear.
intermediate-span highway bridges because they produce the largest stress ranges. Typically, the load position that generates maximum bending moment at midspan Or over an intermediate support of continuous bridges is not the same as the load position that would cause maximum shear force at those points. The highest principal stress range is obtained by maximizing the bending stress range. This will lead to shear-to-bending stress ratios substantially lower than 0.6, and hence to only a slight difference between principal and bending stresses.
Conversely, a loading position that maximizes the shear forces leads to high shear-to-bending stress ratios. How-
ever, the principal stress will be smaller than the bending stress obtained from the loads positioned for maximum bending moment. No crack growth was observed at stiff-ener details where this situation occurred.
The beams and the girders of this study had a shear-to-bending stress ratio of 0.31 and 0.22 at the stiffener. At those ratios the bending stress is only 8 percent and 4 per-cent smaller than the principal stress. This difference is not significant, as shown in Figure 28, where the fatigue lives of Type 1 stiffeners welded to the web alone are plotted against the principal and the bending stress range at the stiffener end. It should also be noted that stiffeners placed
60 - 50 -
40- PW
30 -
20- Ui
e 00 0 0
(I)
LLI 10 -
CP U) 4 Principal Stress Range
0 Bending Stress Range
5-
I I I iii I I I III
I0 5 06 5 Io CYCLES TO FAILURE
Figure 28. Effect of bending and principal stress range on fatigue strength of Type I stiffeners.

60 0,
50
40 -J
WLIJ
Z 30 LU
(n z 20
LL I—I U)O
Z I
ZLLJ 10 LiZ
LL LL
Co W - U)
3 iO
22
farther from the maximum bending moment resulted in high shear-to-bending stress ratio but a decreased principal stress. No fatigue crack growth was observed at those stiffener details.
Actual bridge girders have longer spans than the speci-mens in this study; consequently, an even smaller differ-ence between bending and principal stresses at the critical stiffener details can be anticipated. This results from a number of factors, as follows:
In actual bridges the principal stress is not acting in a constant direction and the experimental indication is that bending alone is more dominant under those conditions.
The shear stress in the web at the end of transverse stiffeners is between 70 and 80 percent of the value esti-mated on the basis of the gross web area.
Specifications do not permit the distance between the stiffener-to-web connection and the face of the tension flange to exceed four times the web thickness.
As the span length increases, the live load shear stress decreases because large members are required.
Hence, principal stresses that occur in regions where the shear-to-bending stress ratios are high will not be large enough to result in crack propagation. Only those stiff-eners located in regions of high bending stress range can have principal stresses large enough to result in crack propagation.
Several pilot specimens were tested at higher shear-to-bending ratios (0.5). None of these specimens exhibited crack growth at the stiffener detail prior to failure at some other location (i.e., a plain welded beam or under a load-ing stiffener). It does not appear possible to generate data on stiffeners at higher shear-to-bending ratios unless special test specimens are used that are not comparable to stiffened bridge members. This was also apparent in earlier tests when full-depth stiffeners were used.
Analysis of Data for Stiffeners Welded to the Web and Flanges (Type 3)
Effect of Type of Steel
In contrast to results from both Type 1 and Type 2 stiffen-ers, the data for A514 steel girders with Type 3 stiffeners fall along the mean regression line, as shown in Figure 29. The F-ratio for steel type was much lower than the critical F-ratio at the 5 percent significance level (see Appendix E). Hence, the effect of the type of steel was not significant for stiffeners welded to the tensirn flange.
Effect of Stress Variables
Since three of the four SG girders tested at the lowest stress range level did not exhibit any visible cracking at the Type 3 stiffener, all four were excluded from the analysis of variance and the regression analysis.
The results of the analysis of variance showed that the effect of the minimum stress was insignificant. The stress range continued to account for most of the variation in fatigue life. This conclusion is visually reflected in the plots of the test data (Fig. 29) for both the welded beams and girders. The existence of tensile residual stress in the beam flange makes the full stress range effective at all levels of minimum stress.
Effect of Out-of-Plane Deformation from Transverse Bracing
Neither the variation of the bracing angle nor the absence or presence of transverse bracing had any effect on the fatigue strength of Type 3 stiffeners. The data for trans-versely braced girders, plotted in Fig. 29, confirm the results of the statistical analysis.
Effect of Specimen Size
Czr 1SB
I SB I SG 1SCI° rn jn l
I /6 '/3 14441 A514 I
a
10
I I-Jo I
12 0 . . *IoII4
Once the stress range was singled out to be the only sig-nificant variable, comparisons were made of the mean re-gression lines of the two samples corresponding to the
i-log NI0.5949-3.5053 log °r s = 0.1024 = 095
T o c*
106
CYCLES TO FAILURE
-
Figure 29. S-N plot for Type 3 stiffeners.

23
22 beams and the 18 girders. The four SG girders tested at the lowest stress range level were again excluded. The results of the t-test showed that welding a Type 3 stiffener to a 14-in, or 38-in, specimen did not significantly affect the fatigue life of the detail. The results from both sizes of specimens are summarized in Figure 29, together with the mean regression line and the limits of dispersion. It is apparent that no significant difference exists.
Comparison of Stiffeners Welded to Web Alone with Stiffeners Welded to the Web and Flange
The test results yielded comparable findings on the vari-ables examined. Stress range was the dominant variable that defined the fatigue strength for each stiffener detail. The variation attributed to other variables (such as mini-mum stress, specimen size, transverse bracing, and type of steel) were not significant.
Because all three stiffener details provided data that were distributed just below the mean regression line for plain welded beams, the results for the three types were ex-amined to determine whether or not they differed signifi-cantly. The comparison was made on the basis of princi-pal stress for the Type 1 stiffeners and on the basis of bending stress for the Type 2 and Type 3 stiffeners. No significant difference was observed between the Type 1, Type 2, and Type 3 stiffeners. The differences were even less when bending stress alone was used for the Type 1 stiffener detail.
The test data are compared in Figure 30. Only the bending stress range was used for the Type 1 stiffener. For purposes of design the difference between the bending and principal stress range in the critical crack growth region was not significant. The difference is even less in bridge structures where the direction of principal stress changes and shear stresses are likely to be much less than the allowable shear values. Other factors are discussed in the earlier section on "Analysis of Data for Stiffeners Welded to the Web Alone."
The mean regression line for 131 data points and defin. ing the fatigue strength of all three stiffener details is given by
logN= 10.0852-3.10 logS, (1)
The standard error of estimate was 0.1581. The 95 percent confidence limit for 95 percent survival shown in Figure 30 can be used to define the allowable bending stress range at the weld toe of a transverse stiffener. This relationship is applicable to stiffeners welded to the web alone or to the web and flanges.
Comparison with Previous Results
The results of earlier tests are summarized in Appendix A. The data were acquired from a variety of specimens: some were subjected to a stress condition that cannot occur in actual structures. Other specimens exhibited web slender-ness ratios and stiffener cutoffs in excess of the values im-posed by current specifications. This resulted in severe out-of-plane deformations of the web and fatigue crack growth from secondary deformations that are not permitted.
To permit a meaningful comparison with previous work, the data acquired from specimens that fall into one of the following categories were excluded:
Girders with a web slenderness ratio exceeding 192. Beams and girders with a gap that exceeds 4 times
the web thickness between the stiffener end and the face of the tension flange.
Specimens subjected to shear-to-bending stress ratios at the stiffener end which exceeded 0.6.
All tests discontinued prior to visible cracking, or because of failure elsewhere.
Specimens subjected to shear stresses at the stiffener end which exceeded 0.33
Ignoring test data generated under shear-to-bending stress ratios greater than 0.6 appears reasonable, as noted earlier when discussing the difference between bending and
log NrlO.O8523.O97 log 0'r 130—
w '--L 7 s= 0.1581
r 0.86 z2Q1 -
:z-•-. U) I c000 0•Q_ I • Ui Of
oF—(I z A Type I Stiffener a i 0 Type 2 Stiffener Ui I Co 0 Type 3 Stiffener
105 06 io CYCLES TO FAILURE
Figure 30. Summary S-N plot for Type 1, 2, and 3 stifleners.

24
principal stress conditions. In actual bridge members, crack growth does not occur at locations where the ratio is high because the principal stress generated is not large enough to cause crack growth. The tests on beams subjected to alternating shear further confirmed this observation. When the direction of principal stress changes during cyclic load, the bending stress becomes even more dominant and the principal stress less critical. Actual bridges are subjected to loads that result in a changing principal stress as ve-hicles cross the structure. Hence, bending stress is the appropriate stress condition to consider.
The earlier work on stiffened beams could only provide the high shear-to-bending stress conditions by fabricating special beams with large flange thickness and thin webs. These beams do not represent actual structural members. Crrks were formed under high shear-low bending stress conditions only when the stiffeners were not full depth. When stiffeners were terminated ½ in. short of the flange no cracks were observed to form at locations where nearly comparable stress conditions existed. Further discussions of these conditions are given in Appendices A and E.
The data pOints retained for the comparison were plotted in Figure 31, together with the two confidence limits given in Figure 30.
In general, the agreement was found to be good for all stiffener details. The points below the 95 percent confi-dence limit for 95 percent survival correspond to the three early failures attributed by Gurney (14) to undercut at the weld toe of Type 3 stiffeners, and to two failures at load-bearing stiffeners of 37-in, girders with a web slenderness ratio of 192 (15).
The poor-quality welds that resulted in the lower fa-tigue strength had a more serrated toe and a slight amount of undercutting. The beams failing at load-bearing stiffen-ers had secondary stresses at the terminating weld toe caused by directly loading the stiffener with an extreme load range (required to generate the stress condition). In
addition, lateral deflection of the web aggravated the situation.
There appears to be no rational reason to consider the magnitude of shear when determining the allowable bend-ing stress range at stiffener details welded to the web alone. When full-depth stiffeners are used it is not possible to generate a principal stress range significantly larger than the bending stress range that will cause fatigue crack growth. This condition can only occur in regions of small bending stress where no crack growth will occur. Hence, the detail is not "fatigue critical" when this condition exists.
FATIGUE STRENGTH OF PLAIN WELDED BEAMS AND GIRDERS
Because the stiffener detail was observed to have high fatigue strength, a number of beams and girders developed failures from the flange-to-web fillet welds. This was ex-pected, because the stress range at the stiffener detail could not be increased withoit a corresponding increase in the stress at the flange-to-web connection. The pilot studies had shown that in order to cause failure at the stiffener details it was necessary to move the stiffeners as close to the load point as possible without introducing the local load influence.
The results of the failures as plain welded specimens provided additional data on the plain welded beam for different beam sizes and increased the available data.
Crack Initiation and Growth
The studies reported in NCHRP Report 102 showed that plain welded beam failures are caused by cracks initiating at a porosity, weld repair, tack weld, or stop-start position in the longitudinal flange-to-web fillet weld. Growth from flange tip defects was also reported.
Hirt and Fisher (9) found that these cracks grow ap-
50 o
40 - 0 ,,-log N10.0852-3.097log 0.
s = 0. 1581
r = 0.86 Ui
0 . 20 - .--.
o -S
(I) Ui 0
10 -
z a z 0 Welded to Web Alone Ui 03
5 Welded to Web and Flanges
3 .1 ,1 105 106 107
CYCLES TO FAILURE Figure 31. Comparison of present study with previous work, all stiffeners.

Figure 32. Typical plain welded beam failure.
proximately in a circular or penny shape, with the initial defect at its center, until the crack front reaches the ex-treme fiber of the tension flange. After penetrating the tension flange, the crack changes into a three-ended crack with two fronts propagating across the flange and one front advancing upward into the web, as shown in Figure 32.
Crack growth observations recorded in detail for six girder specimens indicated that the lower front of the penny-shape crack breaks through the extreme fiber of the tension flange at approximately 96 percent of the total number of cycles to failure. This is comparable to the 94 percent reported in Ref. 9 for 14-in, deep beams.
Correlation with Previous Studies
Fatigue cracks originating at defects in the longitudinal web-to-flange fillet welds led to failure in 19 of the 22 girders, whereas only a few beams exhibited plain welded beam (PW) failures. This is mainly due to the retesting prarediires The SC heamc were retested on a 6-ft 6-in. span, in which the constant bending moment region was eliminated and the probability for PW failures was greatly reduced (1). The last five SC beams were retested on a 10-ft span by repairing the initial failure at Type 3 stiffen-ers. They also exhibited plain welded beam failures.
Because all PW cracks initiated from defects in the longitudinal weld, it v'ould be appropriate to relate the fatigue life to the bending stress range at the center of the weld. For simplicity, the bending stress range at the interface of weld and flange was selected as the indepen-dent variable for the regression analysis.
The results of the analysis of variance of the SG girders indicated that the secondary variables (that is, steel type and minimum stress) had no effect on the fatigue life of plain welded girders at the 5 percent significance level. Transverse bracing was not expected to exert any effect
either; the additional bending stress range induced at the weld by weak axis bending was negligible. Analysis of the factorial for transversely braced SB girders and compari-son of both girder series confirmed this.
The data from both girder series were combined into one sample and a regression analysis was performed. The results are shown in Figure 33. The three data points with an added arrow represent tests that were discontinued or tests for which further acquisition of data was invalidated by substantial repairs at the Type 2 stiffeners. The results are directly comparable to the results reported in Ref. 1. It is apparent from Figure 33 that the test results fall within the confidence limits for the plain welded beam detail reported in Ref. I.
FATIGUE STRENGTH OF BEAMS WITH WELDED FLANGE ATTACHMENTS
Fifty-six welded beams were tested with attachment plates welded to the tension and compression flanges. Each beam provided data on crack growth at two cross sections. The attachments were all welded to the outer surfaces of the flange, as shown in Figure 3.
The attachment length and the stress at the terminating fillet weld toes were the major variables in this study. Generally, crack growth was greater at one cross section and resulted in failure of the test beam. The test was continued on a shorter span until the second cross section also failed.
The AQ series had .-in. attachments welded trans- versely to the flange. This was analogous to the Type 3 stiffener detail. The A2 and AS series had 2-in, and 8-in. attachment plates, respectively, and ¼-in, fillet welds around the edges of the plate, as shown in Figure 3. The A4 series tests had one-half of the 4-in.-long details at-
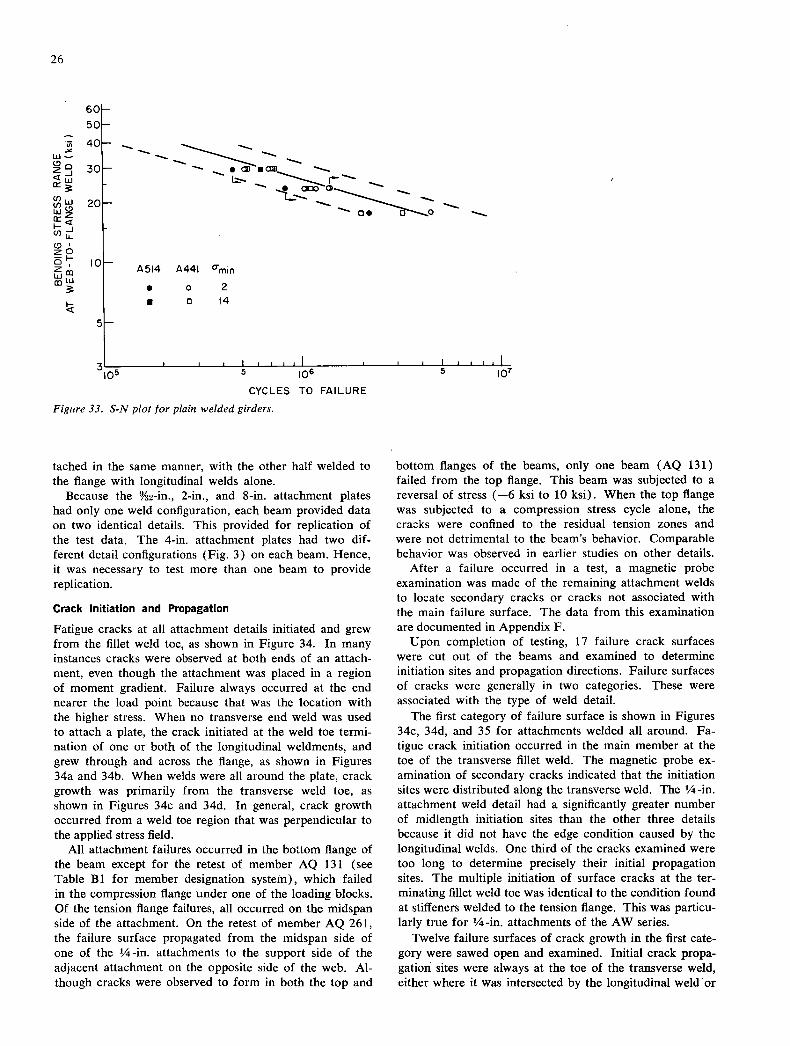
26
40I—_ Ui Z
301- - - cr I I::'- •'-- I- - • -S.-
20E-
- D•
I-
0L I A514 A44I cmin
I . o 2 . 0 14
105 5 106
CYCLES TO FAILURE
-5-
-S
Figure 33. S-N plot for plain welded girders.
tached in the same manner, with the other half welded to the flange with longitudinal welds alone.
Because the %2-in., 2-in., and 8-in, attachment plates had only one weld configuration, each beam provided data on two identical details. This provided for replication of the test data. The 4-in, attachment plates had two dif-ferent detail configurations (Fig. 3) on each beam. Hence, it was necessary to test more than one beam to provide replication.
Crack Initiation and Propagation
Fatigue cracks at all attachment details initiated and grew from the fillet weld toe, as shown in Figure 34. In many instances cracks were observed at both ends of an attach-ment, even though the attachment was placed in a region of moment gradient. Failure always occurred at the end nearer the load point because that was the location with the higher stress. When no transverse end weld was used to attach a plate, the crack initiated at the weld toe termi-nation of one or both of the longitudinal weldments, and grew through and across the flange, as shown in Figures 34a and 34b. When welds were all around the plate, crack growth was primarily from the transverse weld toe, as shown in Figures 34c and 34d. In general, crack growth occurred from a weld toe region that was perpendicular to the applied stress field.
All attachment failures occurred in the bottom flange of the beam except for the retest of member AQ 131 (see Table Bi for member designation system), which failed in the compression flange under one of the loading blocks. Of the tension flange failures, all occurred on the midspan side of the attachment. On the retest of member AQ 261, the failure surface propagated from the midspan side of one of the ¼-in, attachments to the support side of the adjacent attachment on the opposite side of the web. Al-though cracks were observed to form in both the top and
-
bottom flanges of the beams, only one beam (AQ 131) failed from the top flange. This beam was subjected to a reversal of stress (-6 ksi to 10 ksi). When the top flange was subjected to a compression stress cycle alone, the cracks were confined to the residual tension zones and were not detrimental to the beam's behavior. Comparable behavior was observed in earlier studies on other details.
After a failure occurred in a test, a magnetic probe examination was made of the remaining attachment welds to locate secondary cracks or cracks not associated with the main failure surface. The data from this examination are documented in Appendix F.
Upon completion of testing, 17 failure crack surfaces were cut out of the beams and examined to determine initiation sites and propagation directions. Failure surfaces of cracks were generally in two categories. These were associated with the type of weld detail.
The first category of failure surface is shown in Figures 34c, 34d, and 35 for attachments welded all around. Fa-tigue crack initiation occurred in the main member at the toe of the transverse fillet weld. The magnetic probe ex-amination of secondary cracks indicated that the initiation sites were distributed along the transverse weld. The ¼-in. attachment weld detail had a significantly greater number of midlength initiation sites than the other three details because it did not have the edge condition caused by the longitudinal welds. One third of the cracks examined were too long to determine precisely their initial propagation sites. The multiple initiation of surface cracks at the ter-minating fillet weld toe was identical to the condition found at stiffeners welded to the tension flange. This was particu-larly true for ¼-in, attachments of the AW series.
Twelve failure surfaces of crack growth in the first cate-gory were sawed open and examined. Initial crack propa-gation sites were always at the toe of the transverse weld, either where it was intersected by the longitudinal weld • or

(a)
'
4• 4 - w---.
- - -•---. -;- -••.
.--.•!-:•_
A.
Fi',ire $4. iypical failure at flange att(!l,,n('nt with no trui sl .erse ii eli! (a) bottom flange surface, and (1,) top of f/ane ,su - face: and with Wi 'c/s all ciround (c) /,ottom flange surface, and (d) top of flange surface.

28
Figure 35. Typical fatigue crack surface at flange attachment with transverse weld.
along the midlength of the transverse weld. The cracks propagating from the weld toe progressed through the flange and then across the flange toward the web, as shown in Figure 35. Quite often, the cracks at the transverse weld toe merged with a crack propagating from the longitudi-nal fillet weld toe. Often, these cracks were offset by as much as ¼ in. and caused a change of plane of the fatigue fracture surface as they merged into a single large crack.
In all cases, the appearance of the failure surface ad-jacent to the attachment showed that the crack progressed very slowly and presented a plain strain condition. After the crack penetrated the flange a high rate of crack propa-gation was apparent as the crack front moved toward the web.
Figure 35 shows a typical fatigue failure surface with the primary crack growth along the midlength of the at-tachment. A second initiation site at the edge of the flange occurred at a later stage of growth. Merger of the two cracks occurred about /s in. in from the edge of the flange. Rapid crack propagation is apparent after the crack pene-trated the flange.
Figure 36 shows the fracture surface at a ¼-in, flange attachment. The crack propagated through the flange thickness on the midspan side of the attachment and ran diagonally across the flange under the web. A second crack, also apparent on the left of Figure 36, had propa-gated on the support side of the attachment. The fracture surface shows that the rate of crack propagation increased after the flange thickness was penetrated.
Crack propagation at the weld toe termination of details with only longitudinal fillet welds constituted a second category of failure surface of crack growth (Figures 34b and 37). Crack growth occurred simultaneously from both weld toe terminations, as is apparent in Figure 37. This fact was confirmed by exposing the surface of several small cracks that had not penetrated the flange thickness. Figure 38 shows the small cracks at the weld toe terminations.
Because the 4-in, attachments had both weld configura-tions on a single beam, failure at the detail with welds all around resulted in an interruption of the test. Oxidation of the fatigue-cracked surface at the other detail took place before retesting. This is apparent in Figure 37a. The semielliptical surface cracks at the ends of the weidment adjacent to the web are apparent.
It is also obvious from Figure 37a that a greater amoiint of crack growth was experienced at the end of the weld-ment placed along the flange tip. This was expected be-cause the propagation of an edge crack from the flange tip is more rapid than a semielliptical surface crack when both are subjected to the same nominal stress conditions. This is compatible with the theoretical concepts of frac-ture mechanics. A somewhat analogous condition existed for cover-plated beams with the cover plate wider than the flange (1).
A ½-in-long crack at the edge of the flange (see Fig. 37b) was observed with the magnetic probe after the initial failure at the detail at the other end of this beam. Four hundred thousand cycles, or 82 percent of the fatigue life, was exhausted at that time. The magnetic probe did not detect the surface cracks that had propagated from the two inner longitudinal weld locations. The cracks had penetrated one-half the flange thickness, as evidenced by the darkened oxidized area, yet still could not be detected on the flange surface.
Figure 37b shows a similar surface for beam A4 262. There were no cracks detected on the flange surface after the initial test that resulted in failure at the end-welded detail after 143,000 cycles or 63 percent of final life.
Analysis of Data for Welded Flange Attachments
The variables in the study of fatigue life of the welded attachment details were length of attachment, stress, and type of weld detail. The material in all cases was A441 steel. Four attachment lengths—'/i, 2, 4, and 8 in.—were used. There were two weld details for the 4-in. attach-

ments: longitudinal welds only and welds all around, as shown in Figure 3. The weldment was placed all around the ¼-. 2-. and 8-in, attachments.
The effects of the primary variables were evaluated Ilsino statistical analysis and theoretical considerations. Details of the results and a summary of the test data are given in Appendix F.
Eflect of Stress Variables
The effects of the primary stress variables of minimum stress and stress range were examined in detail for each attachment. The results of the analysis indicated that the dominant stress variable was stress range for all the attach-ment configurations tested. Figure 39 illustrates this fact for the 4-in, attachment with welds all around, it is ap-parent that minimum stress was insignificant at all levels of stress range. Stress range alone accounted for the aria-tion in cycle life. The existence of residual tensile stresses in the beam flange made the full stress range effective at all levels of minimum stress, including stress reversal. Be-cause most of the fatigue life was consumed in growing the crack through the flange thickness in the region of tensile residual stress, beams subjected to some reversal of stress provided the same fatigue life.
Similar results were obtained for the other attachment leiigtli, as sliowii iii Figuies 40 to 43. Stiess iange is seeii to account for the variation in cycle life for each detail studied.
29
M.
r.

I-U
50 — 0
40 -
30-
20 -
10— 0
: I
10 5 106
CYCLES TO FAILURE
Figure 39. S-N plot for 4-in. attachments welded all around. Figure 38. Simultaneous crack growth from it eld toe ter,dnations.
5
301— fl I - I
20 z xl U) U) -U
10 U)
Type 3 Stiffeners
-S
r © -. -U -.5
'
-5
10'
5
--5 --S
-.5
10 5 106 107 105 106 10 CYCLES TO FAILURE CYCLES TO FAILURE
Figure 40. S-N plot for ¼-in. attachments. Figure 41. S-N plot for 2-in, attachments.

31
Mean regression lines and the standard error of estimate t .
for the 2-in., 4-in., and 8-in, attachments were defined by - the following equations: /
/0
2-In. Attachment: R
/ log N = 10.0384 — 3.25 logS, (2)
standard error of estimate = 0.0628 / I /0 0
4-In. Attachment (welded around):
logN=9.746l-3.23logS (3)
standard error of estimate = 0.0927 LL
4-In. Attachment (no end welds): / 2
I logN=9.3480-2.82logS (4) /0/
standard error of estimate = 0,0801 / ,' /
8-In. Attachment: III
logN=9.5610-3.l8logS, (5) J standard error of estimate = 0.1182 /
/0/ Because the 1/4 -in. attachment series were similar to the /o
stiffeners welded to the flange, a comparison was made. The mean regression line and the limits of dispersion for the Type 3 stiffener are shown in Figure 40. It is apparent that the test data for the ¼-in, attachments fall within the 0 0 o / a limits of dispersion and provide good agreement with the ONV SS3.LS mean regression. The test data were distributed between the mean regression line and the upper confidence limit. The results were not significantly different from those for - the stiffener details.
Although slight differences in the slopes of the mean / regression lines are apparent, this is primarily attributed to the small sample size for each detail. The slopes were not / significantly different when the regression coefficients were / tested.
No fatigue limit (107 or more cycles) was apparent for /0 I any detail but the 1/4 -in. attachment when subjected to ' / stresses of the experiment design. The 1/4 -in. attachments / / I did not exhibit any visible fatigue crack growth at a stress CIO range level of 12 ksi. Several stiffener details were sub- I'
/ jected to a bending stress range of 13.7 ksi. Two beams / j 0 did not fail at that level of stress range. The cycle life of - the stiffener detail varied from 3 million up to 13 million s'
/ when one test was discontinued. The threshold of fatigue / crack growth might have been reached in the region of 0 / 12 to 13.7 ksi. One beam with 4-in, attachments was
tested at a stress range of 5.9 ksi and did not experience / any visible crack growth up to 10 million cycles of loading. /
/ Effect of Attachment Length o
/ The fatigue crack growth behavior of the ¼-in., 2-in., 4-in., and 8-in, attachments was essentially the same. All
0,
experienced crack growth at the terminating weld toes of / the fillet welds connecting the plates to the beam flanges. I I 10
However, it is apparent from Figures 39 to 43 that each 2 it) N)
detail length yielded a different stress range-life relationship. (IsiI) 39NV8 ssj.s

ST*l'4 A2
U, U, LU
I- C',
'A8 P
32
The mean regression lines for the several details are compared in Figure 44, together with the mean lines for the plain welded and cover-plated beams. It is apparent that a significant difference exists. The attachment length was a significant variable. The fatigue strengths provided by the attachment series are bounded by the plain welded and cover-plated beam conditions. It was noted in Ref. 1 that these latter details provided an upper and lower bound to the fatigue behavior of welded details.
The fatigue strength is observed to decrease as the at-tachment length increases. Similar observations were made in earlier studies (53). The decrease is exponential and quickly approaches the lower bound provided by the cover-plated beam. This fact was verified by a pilot test with 16-in, attachments. The test results fell just below the mean for the cover-plated beam. At a stress range of 16 ksi, the 16-in, attachment yielded a life of 307,000 cycles.
The variation in fatigue strength appears to be directly related to the development length of the flange attachment. Studies by Ozell and Conyers (16) showed that a cover-plated section reached conformance with the theory of flexure at a distance from the end equal to approximately two times the cover-plate width for beams with end welds across the cover-plate end, and at a distance equal to ap-proximately three times the cover-plate width for beams with no weld across the end. The fatigue test results of the attachments appear compatible with the development length. As more force is transferred into the attachment, the stress concentration at the terminating fillet weld toe is increased.
Experimental studies were conducted to examine the strain distribution in the flange near the toe of the trans-verse weldment. Strain gage readings were taken under static loading at ½ in., 3/4 in., and 13/4 in. from the ter-minating fillet weld toe. The results (Fig. 45) confirm the increase in strain with attachment length. It is also ap-
parent that the development of force in the attachment dis-torts the bending strain some distance away from the weld toe. For the 8-in, attachments this effect was present up to 11/2 in. from the toe.
A finite element analysis of the stress field and stress concentration condition confirmed the experimental obser-vations. The solid lines in Fig. 45 show the predicted strain distribution. Details of the analysis are given in Appendix F. The stress concentration was observed to in-crease with attachment length. When the length was about four times the attachment width an upper bound appeared to be reached for attachments with welds all around, cor-responding to the case of a cover-plated beam. Subsequent increases in length did not affect the condition at the weld toe.
Comparison with Previous Results
A review of fatigue studies on attachments to beams and plates is given in Appendix A. Unfortunately, little infor-mation is available on beams (6, 14). Most of the avail-able data are from short gussets fillet-welded to the surface of plates. The gusset length has generally varied between 3 and 6 in. These previous test series did not in general provide much if any replication, nor was an attempt made at randomization of the tests. Hence, uncontrolled vari-ables (such as the initial flaw size) were not distributed uniformly or accounted for.
The results of these previous tests (6, 14, 18, 19, 20, 21) are compared with the appropriate attachment details in Figures 46 to 50. Unfortunately, only a few tests are avail-able for gusset lengths of 4 in. and 8 in. These are in good agreement with the beam attachments, as shown in Figures 46 and 47. It should be noted that 8-in, groove-welded gussets (42) are also shown in Figure 47. These results are also comparable to the fillet-welded details. Hence, the groove-weld termination of an attachment to a flange or
105
06
107 CYCLES TO FAILURE
Figure 44. Summary of S-N plots for flange attachments and transverse stifleners.

33
o 0 Test Data Finite Element Analysis
AQ
1IIII__vI_p__ -- Midspan
' -Strain Gage
0 1 I I I I
'2 I l/2 2
0-DISTANCE FROM TOE OF FILLET WELD (in.) Figure 45. Strain distribution in beam flange near toe of transverse weidment of attachment.
plate is directly comparable to the weld toe termination of a fillet-welded attachment.
A large number of tests have been made on 6-in, gusset attachments (18, 19, 20). These results are shown in Figure 48, together with the mean regression line and lower confidence limit for the 4-in, attachments. The re-sults fall above the mean regression line. This results from the smaller stress concentration effect of the gusset-type attachment. It should be noted that the gusset test data cover a range of steels and stress conditions (18). The yield point varied from 35 to 112 ksi. The tests included both tension-to-tension stress cycles and reversal of stress. None of these factors appeared to influence the results significantly, even with the plate specimens.
A few tests were also made on single groove-welded 10-in, gussets attached to the plate edge (42). These are compared with the 8-in, attachments and cover-plated beams in Figure 49. Again the results are in good agree-ment. Crack growth from the end of the groove weld was about the same as for the fillet-welded details. The test data are reasonably comparable to the 8-in, attachment.
The stiffeners and ¼-in, attachments were compared in Figure 40 for the tests conducted in this study. The results were directly comparable and indicated that the same basic condition existed at the termination weld toe of the stiff-eners and short attachment. Earlier tests with stiffeners welded transversely to the flange were compared in Figure 31. The results of a large number of studies on nonload-carrying fillet-welded joints (14, 21, 22) are compared with the mean regression curve for stiffeners and 2-in. attachments and limits of dispersion in Figure 50. These tests included high-strength steel specimens (22). It is readily apparent that the results are in good agreement with the mean regression curve, including the tests at high stress ranges in the 50,000- to 100,000-cycle region. Again, the
lfl 0
It N) ' ('J -
(!S) 19NV8 SS3eIJ.S 4.
(!S)t) 39NV8 SS3IS 4.

34
(!I) 39NV8 SS381S
type of steel is seen to have a negligible effect on the fatigue strength.
Also shown in Figure 50 are data from tests on plates with welded studs. The diameter of the stud and the stud weld toe do not greatly differ from the short attachment. Hence, about the same strength should result from crack growth at the weld toe. This is verified by Figure 50.
The regression lines developed from this study are seen to describe the current test results, as well as those from
. previous studies.
STRESS ANALYSIS OF CRACK PROPAGATION
The fatigue life of a detail is defined by the sum of the number of cycles required for crack initiation and the number of cycles required for crack propagation to failure. Nearly all available information indicates that the fatigue life prediction of welded details can be based on crack ° . propagation alone (1, 9, 10, 22).
Signes et al. (11) showed that fatigue cracks initiate at the toes of fillet welds from discontinuities constituting a sharp notch when the applied stress is perpendicular to the
42 weld toe. These crack-like discontinuities exist in welds made by all conventional welding processes (12). These discontinuities are equivalent to initial cracks that propa-gate under repeated loading.
14
rA —
-Io 0
-0 0
j 0
/ 0 +
/1
0I 0
D 0/ 06 I-
D00. 0 u E
c Dsp//
— 0 —
0 / Ui _J o
0/ o
I
/ ci 0. 0
00 .0
0 0
100 'c+ I- 0 0. E
0+;"
/ 0 0/ 06 I! I I 0
(!I) 39NV8 SSJ.LS 4. r) c'J —
(!) 30NV8 SS3IS
0 0 I, r2 u) It N) C\I —

35
The fracture mechanics approach to crack propagation appears to ne the most rational method currently available for predicting the fatigue life. It has been used to provide an explanation of the fatigue crack growth of a number of welded steel details (1, 9, 22, 23).
The semi-empirical differential equation of crack growth proposed by Paris (25, 29) has the form:
da/dN=CK' (6)
and relates measured rates of crack growth (daldN) to K, the range of the stress-intensity factor (K) proposed
by Irwin (26). The constants C and n are material prop-erties. Eq. 6 can be integrated to obtain the number of cycles (N) required to propagate a crack from an initial size (at) to a final size (a j):
N = da =
0 r f da a, TJ a, (K/0-,)
(7)
Solution of Eq. 7 requires a knowledge of the crack properties of the material and an adequate solution for the stress intensity factor for the detail being examined.
As was noted in Ref. 1, Eq. 7 suggests that the relation-ship between the life (N) and the applied stress range (ur) is exponential in form. The linear regression equation, log N = B1 - B2 log °r, that provided the best fit to the experimental data can also be expressed in exponential form as
NGor 2 (8)
in which G = log B1.
The exponents B2 and N are the same and reflect the exponential nature of crack growth.
Crack-Growth Rates
In order to solve Eq. 7, the crack growth rate relationship (Eq. 6) is required for the detail under examination. Crack growth rates are material properties that are determined empirically from tests of precracked "fracture mechanics" specimens for which an analytical expression for the stress intensity factor (K) is known. From measurements of crack size, the increases in size corresponding to incre-ments of cyclic loading are related to the range of the stress-intensity factor (AK).
Several investigators have reported the growth rates for structural steels. Barsom (28) found that the growth rates in four ferrite-pearlite steels fell into a band, as shown in Figure 51. He suggested that the slope of the logarithmi-cally transformed data decreased slightly as the yield strength increased. The slope varied from 3.3 to 2.8 for steels with yield strengths between 36 and 69 ksi. Data have also been reported by Crooker and Lange (47). A relatively large scatterband was indicated for carbon and low-alloy steels with yield strengths between 34 ksi and 127 ksi. Maddox (48) determined the growth rates for four different weld metals; their scatterband is also shown in Figure 51. Three of these four had yield strengths equal to about 67 ksi and the fourth to 90 ksi. It is apparent from Figure 51 that all of the test data on crack growth are for zK values above 10 ksi \11iT Only limited data are
U)
.;
\' >'
\ \\ 0
0
cr U) W I—
cr
I-
0 cr
or"- U
2 tZ I..
H - U L
c)
0 0 - 0 IC)
2 '° - U /iS) ')7 '39NV8 U010VA A.LISN31NI SS3J.S
available below that level. Paris (45) reported on very slow growth on ASTM 9310 steel and suggested a thresh-old value at zK = 5 ksi VIj
From a study of experimental results published in the literature, Harrison (10) concluded that fatigue cracks will not propagate in mild steel if LK < 3.3 ksi Viit The level of the threshold was observed to be also a function of the mean stress (45), the threshold being lower the higher the mean stress. Hence, a low threshold value can be expected for fatigue crack growth from weld toes where the applied stresses are magnified by the discontinuities of the weld geometry and where high residual tensile stresses are known to exist.
The coefficients of the crack growth equation were also established by Hirt and Fisher (9) using the equivalence between the crack growth equation and the stress range-cyclic life relationship for plain welded beams. A penny-shaped crack was assumed to describe the disc-like cracks that grew in the flange-to-web weidment of beams. This yielded the constants C and n of the crack growth relation-ship with the values n 3 and C = 2.05 X 10_1.
In this study it was assumed that C and n remained con-stant for all values of XK. The relationship found by Hirt and Fisher was rounded and used. The crack growth rate was taken as

36
da =2X10'°K3 (9)
for all details. Eq. 9 is plotted in Fig. 51 and compared with the data from crack growth specimens. The relation-ship developed from the beam tests is in good agreement with the crack growth data from fracture mechanics speci-mens. The beam tests had indicated that crack initiation took place at values of zK equal to 4 or 5 ksi \1ii This was at or below the threshold level suggested by Paris. It was also observed that most of the beam life was spent at growth rates smaller than 10 in./cycle (9).
Stress Intensity Factors for Fillet Weld Toes
An analytical expression for the stress-intensity factor (K) for crack growth from the toe of a nonload-carrying fillet weld is needed for the solution of stiffener details. A simi-lar solution is required for crack growth from attachments that must reflect the influence of geometry and the force transfer at the attachments.
With an appropriate expression for K, the propagation of a crack through the thickness of the web or flange can be predicted. As noted in the discussion of crack growth at stiffener details, 80 percent and 96 percent of the total number of cycles to failure at Type 1 and Type 3 stiffeners, respectively, were consumed by crack propagation of a flaw through the thickness of the web and flange. Crack propa-gation at the weld toe of attachment details also resulted in about 90 percent of the life being consumed during propagation through the flange thickness. Hence, an analy-sis of this stage of fatigue crack growth represents essen-tially a study of the fatigue life of beams with stiffeners and details.
Crack initiation and propagation was discussed in detail in the earlier Sections on "Fatigue Strength of Beams and
Figure 52. Part-through crack (a) in a flat plate and (b) at toe of a nonload-carrying fillet weld.
Girders with Transverse Stiffeners" and "Fatigue Strength of Plain Welded Beams and Girders." It was shown that cracks at all three types of stiffener initiated from defects at the weld toe and propagated as semielliptical cracks through the thickness of the web or the flange plate during most of the specimens' lives.
The change in shape of crack with increasing crack size was found empirically. More than 100 stiffeners were ex-amined by exposing the plane through the weld toe per-pendicular to the direction of applied stress (50). This examination of the fracture surfaces was made at stiffeners where cracking was visibly evident, as well as at other stiffeners where no crack was detected.
An exponential relationship was developed between the two semi-axes of the semiellipse, as follows:
b = 1.088a° 96 (10)
Details of the crack measurements and the data evaluation are given in Appendix E.
The stress intensity factor for a part-through crack de-veloped by Irwin (27) can be used with the secant correc-tion for a finite width plate (52) to describe the condition shown in Figure 52a. This results in
1+0.12(1 _a/b)V__V(/2) (11)
in which is an elliptical integral that depends on the minor-to-major axis ratio (a/b) of the crack.
Eq. 11 cannot be applied directly to part-through cracks at the toe of nonload-carrying fillet welds connecting stiff-eners and very short attachments to the flange and the web unless the stress concentration effect of the weld is con-sidered. If the part-through crack is removed from the uni-formly stressed flat plate shown in Figure 52a, the stress field (o-) will remain constant throughout the plate. This is not the case for the detail shown in Figure 52b, which represents a plate strip of either the web or the flange with a portion of the stiffener welded on. In the absence of a crack, the stresses at the weld toe are magnified by the theoretical stress concentration factor (Kr ). This has been shown to be true for a microcrack initiating from the sur-face of a hole in a plate (49). The effect of the stress concentration decays as the crack grows away from the hole.
The stress concentration effect at weld toes is well known (3, 16, 24). An assumption of its influence was made in Ref. 1 when evaluating the behavior of cover-plated beams. Gurney has assumed that the stress at fillet weld toes is amplified by a stress concentration factor K 3.0, but does not consider its decay. Frank (22) applied a finite element technique and a compliance analy-sis to evaluate the stress intensity factor for tunnel-shaped cracks at the weld toe of cruciform joints. On the basis of this analysis he concluded that the stress concentration effect decreased as the crack propagated into the plate.
The geometry effect can be modeled by considering the stress variation across the thickness of the plate at the weld toe. The crack initiates at the weld toe in a region of stress concentration, as shown in Figure 53a. As the crack deep-

37
ens, it quickly runs out of the area affected by the stress concentration.
The stress concentration factor for points through the thickness of a plate at fillet weld tocs of stiffener details was assumed to decrease parabolically in Ref. 50 from a maximum value with no crack, to no effect at a depth equal to the weld size. This decay with increasing crack depth was used with the stress intensity factor for a part-through crack. The decay in the stress concentration effect was similar to the decay polynomial developed for tunnel-shaped cracks at the weld toe of cruciform joints (22).
It was obvious from examination of the fracture surfaces that the cracks propagating from the weld toe of stiffener and attachment details initially grew as semielliptical cracks. Much of the fatigue life was consumed as the cracks grew from their initial microcrack size in the semi-elliptical form. This initial stage of growth requires a more accurate estimate of the stress intensity factor than do the later stages of growth.
On the basis of the studies reported in Refs. 22 and 50, the stress intensity factor was defined in terms of the semi-elliptical crack corrected for the stress concentration effect and its decay with increasing crack depth. The decay poly-nomial developed by Frank from a finite element and compliance analysis was used to reflect this decay charac-teristic. This resulted in the following expression for the stress intensity factor for cracks at weld toe terminations:
K =Kr [l - 3.215 (-)+ 7.897 (a)2 - 9.288 (-)3
+4.086 \ J
+0.12(1—a/b) t ] L
V IT a Vsec (ira/2t) (12)
in which Kr is the stress concentration factor at the fillet weld toe, a is the crack depth, and t is the thickness of the plate in which the crack is growing. The decay of the stress concentration factor in Eq. 12 as the crack grows into the plate and away from the weld toe is provided by the polynomial of a/ t.
Analysis of Crack Growth at Stiffeners
Eqs. 7, 9, and 12 were used to evaluate the crack propaga-tion through the web and flange of Type 1 and Type 3 stiffener details and the flange attachments. Before the analysis could be carried out, the theoretical stress con-centration factor (K) had to be determined at the fillet weld toe. A finite element solution was used for this pur-pose. Details are given in Appendix E. The results indi-cated that the weld and stiffener geometry had only a local concentration effect on the stress field.
The nominal stress range at stiffeners welded to the web alone (Type 1) was taken as the principal stress range at the end of the stiffener-to-web weld. At Type 3 stiffeners the nominal bending stress range at the stiffener-to-flange weld was used.
Eqs. 7, 9, and 12 were used to construct a family of curves depicting the relationship between initial crack sizes and fatigue life for the stress range levels of this study. These curves are plotted in Figures 54 and 55 for the
i--i
(c)
Kt
I
/1 }\
ii
Figure 53. Stress concentration correction for the applied stress field.
Type 1 and Type 3 stiffeners, respectively. The points on the curves correspond to the observed fatigue lives of beams with stiffeners that experienced crack propagation through the web or flange thickness at the weld toe. For Type 1 stiffeners this corresponded to about 80 percent of the total life. For Type 3 stiffeners the failure life was used.
The observed fatigue lives correspond to initial crack sizes that are within the range of weld flaws reported in the literature (11, 12). The average initial crack size is about 0.004 in.
The solution of Eq. 7 can be used to construct stress range-cycle life relationships for various initial crack sizes. This was done for the Type 3 stiffener details, because nearly all the fatigue life was consumed when the crack propagated through the flange thickness. The results are shown in Figure 56 for crack sizes of 0.001, 0.003, and 0.02 in. The predicted life is in good agreement with the experimental data for Type 3 stiffeners. The relationship derived for an initial crack size of 0.003 in. is directly comparable to the mean fatigue strength. The predicted relationship for an initial crack size of 0.02 in. provides good agreement with the lower bound of the test data; initial crack size of 0.001 in. agreed well with the upper scatterband of the test data. Only test data at the 13.8-ksi stress range level exceeded the predicted life. The cor-responding AK values were below the threshold levels sug-gested in Refs. 10 and 45 at this lower stress range level.
The results obtained from the analysis indicate that the proposed mathematical model for propagation of a part-through crack at the weld toe of stiffeners is in good agree-ment with the observed fatigue behavior.

38
0 0 I- 0
0 Cr U- U, LU -J 0 >-0
0 Cr LU
z
0.001 0.01 0.1 CRACK SIZE a (in.)
Figure 54. Propagation of a part-through crack at Type I sti/Jeners.
To determine the effect of flange thickness, the mathe-matical model was applied to 1/2 -in. stiffeners connected with ¼-in, fillet welds to 1-in., 11/2 -in., and 2-in, thick flange plates. These dimensions simulate the welded stiffener-to-flange connections used in actual highway
0 0 I- 0
0 a:
U) LU -J 0 >-0 U- - 0 a: LU
2
0.001 0.01 0.1 CRACK SIZE a i (in.)
Figure 55. Propagation of a part-through crack at Type 3 sti/Jeners.
bridges. The stress concentration effect was assumed to decay out after the crack had penetrated into the flange a distance equal to the stiffener thickness. The results of the integration over the interval 0.001 in. <a < a are shown in Figure 57. It is apparent that flange thickness has
5
40— ,- S
30 —
al
• 0.001 in. I -
- • ••% •.&_ - 20 2
<I a: Predicted: a 0.003 in. - ___ -
•- %-t' ...- 0) 1
I Oj = 0.02in. 10
U,
5
105 106 tO CYCLES TO FAILURE
Figure 56 Comparison of predicted fatigue life with Type 3 stiffener test data.

4
Kt
Flange Thickness
Attachment Thickness = 9.3'
I Weld Size
0 2 4 6 8
ATTACHMENT LENGTH, in.
Figure 58. Effect of attachment length on stress concen-tration factor, K,.
0
0.001 0.01 U.I
CRACK SIZE Oi (in.)
Figure 57. Effect of plate thickness on propagation of a part-through crack.
an insignificant effect on the fatigue strength for the initial flaw conditions that exist at fillet weld toes. The increase in the stress concentration effect was offset by the increased flange thickness.
Analysis of Crack Growth at Attachments
Eqs. 7, 9, and 12 were also used to evaluate the crack propagation at the terminating weld toe of long attach-ments. As with the stiffeners, it was necessary to provide solutions for the stress concentration factor (Ks ) at the terminating fillet weld toe. The finite element solution con-sidered the longitudinal fillets connecting the attachments to the beam flange. The attachment welds were simulated by connecting nodes along the plate edges. Details of the analysis are given in Appendix F.
06 io7
CYCLES TO FAILURE Figure 59. Predicted mean fatigue strength coin pared with in can regression lines, flange attachments.

40
The stress concentration factor (K) was observed to in-crease as the attachment length increased. The variation of Kt as a function of length is shown in Figure 58. The ¼-in, length corresponds to stiffeners and the AQ series attachments. The value of Kt for short attachments was not greatly influenced by the presence of the longitudinal fillet welds. The measurements of the strain field shown in Figure 45 confirm the predicted trend given by the stress concentration factor (K5).
As the attachment length increased, more force was transferred into the attachment and the stress concentra-tion at the weld toe increased. The analysis indicated that after the attachments were about four times as long as they were wide, further increases in length did not increase the stress concentration at the terminating weld toe.
The mean value for the initial flaw size was assumed to be 0.003 in., the mean flaw size for stiffener details. For attachments 2 in., 4 in., and 8 in. long, Eq. 7 yielded the cycles required to propagate the crack through the flange. The predicted mean fatigue strength curves are compared with the mean curves determined from the regression analysis of the test data in Figure 59. Because the pre-dicted life only considered propagation through the thick-ness of the flange, the mean fatigue strength would be
underestimated by about 5 percent. The mathematical model used to predict crack propagation at the terminating weld toe of the attachments slightly underestimated the fatigue strength of the 2-in, attachments and overestimated the fatigue strength of the 4-in, and 8-in, attachments. Two factors account for this variation. One is the estimate of the stress concentration factor (K5 ); the second, the assumption of the same initial crack size. The experiment design for the attachment series did not provide sufficient details to adequately distribute the flaw size at all stress levels.
This study has shown that life estimated from Eq. 7 results in an exponential relationship for all welded details of the form
N G (K 5 (r) (a4 - a1 4) (13)
in which a5 and aj correspond to the initial and final crack sizes, G is the crack geometry correction factor for the detail, K 5 is the stress concentration factor, and r is the stress range. Because the final crack size is usually large, it has a negligible influence on the life. The most impor-tant parameters governing the fatigue strength are a5, G, K 5, and a'.
CHAPTER FOUR
RECOMMENDATIONS AND APPLICATION
1. The current (1969) specifications of the American As-sociation of State Highway Officials (AASHO) * limit the maximum applied stress for fatigue (13). The fatigue stress is considered a function of minimum stress and maximum stress, the type of steel, and the slope (k3) of a maximum fatigue stress (Fr) equation. Interim specifications were adopted in 1971 (30) and indirectly provided a stress range design for the several details that were reported in NCHRP Report 102.
This study has continued to confirm that stress range alone is the only significant factor for designing a given detail against fatigue. Minimum stress and type of steel did not significantly affect the fatigue strength of beams with transverse stiffeners or attachments.
The 95 percent confidence limits for 95 percent survival are shown in Figure 60 for the stiffener details and attach-ments tested in this study, as well as the cover-plated and plain welded beams reported in NCHRP Report 102. It is apparent that the stress range-cycle life relationships for these details are provided by a family of lines that are approximately parallel.
* Now American Associaton of State Highway and Transportation Offi-cials (AASHTO).
It is recommended that allowable stress range values for fatigue design be selected from the lower confidence limits. This provides a rational means of selecting design stress values and takes into consideration the variability of the test data and the size of the sample tested.
For the stiffener details, the sample size was large enough to ensure that twice the standard error of estimate was about equal to the 95 percent confidence limit for 95 per-cent survivals. The attachment test series were not as ex-tensive and an increased multiplier was required (54).
For purposes of design, this study had confirmed the applicability of the design stress values developed for A36 and A441 steel rolled beams to A514 steel rolled beams.
Current (1969) AASHO specifications do not pro-vide sufficient latitude for base metal adjacent to or con-nected by fillet welds. Only one category (F) is provided, and it was derived from the cover-plated beam. A second category (K) is applicable to base metal adjacent to trans-verse stiffeners in A514/A517 steel.
Provisions should be added to reflect the higher fatigue strength of very short length attachments as compared to the fatigue strength of cover plates on beams. The cover-

41
40l2
H-.- --.- z .
-S
— --S —S
201— — -.-- --S. —S --S -S • S S5 I - z- .-- .-- _5__ -5-
__5
I -- - -5-
c '--S Stif. t
10 LU I .5--S -5-- A2
C,)
-5—
-- A4 5-A8
5 CID
06 107
CYCLES TO FAILURE
Figure 60. 95 percent confidence limits for 95 percent survival.
plated beam is a "lower bound" detail and provides the least fatigue strength. At least one category should be added intermediate to the cases of cover-plated beam and beam with transverse stiffeners. In addition, recognition of the adverse effect of a groove-weld termination at an abrupt change in geometry is needed. The same fatigue crack growth behavior and fatigue strength results when a groove weld or a fillet weld toe terminates in a region of stress concentration with the microcrack in a plane perpendicular to the applied stresses.
The AASHO specification provision for base metal adjacent to transverse stiffeners in A5 14/ A5 17 steel should be applied to all steels. Only the stress range should con-trol the design, as the strength of the detail is independent of the type of steel.
None of the details or beams examined developed a fatigue limit at 2 million cycles. Only the ¼-in, attach-ments and the A514 rolled steel beams experienced no visible crack growth up to 107 or more cycles at the lowest stress range level. It appears desirable to specify a loading condition on highway bridges for more than 2 million cycles so as to reduce the possibility of crack growth under extreme cyclic applications.
This study and the earlier work reported in Ref. 1 can provide the basis for a comprehensive change in the fatigue provisions of the AASHO specifications. The use of stress range for each design detail and loading condition will greatly simplify design computations. At the same time it will reflect the available experimental and theoretical findings on the significant design variables.
Although all design details have not been evaluated dur-ing this study, the basic framework has been developed and the critical design parameters defined. Hence, a review of published fatigue data with these findings in mind will per-mit a more rational interpretation of the results and devel-
opment of design values that are more rational than existing specification provisions.
Table 1 gives suggested allowable ranges of stress for a number of categories that are defined in detail in Table 2. The framework is directly comparable to the provisions given in the AISC specification. Similar provisions are now being prepared for the new British fatigue design rules (46). Four categories of life are included, rather than the three used in the current AASHO specifications. Because the fatigue strength at 2 million cycles does not correspond to the fatigue limit, a fourth category was added to account for extreme cyclic fatigue conditions.
The suggested values of stress range (Sr) are based on the 95 percent confidence limits for 95 percent survival. They provide a uniform estimate of survival and account for the variation in the available test observations. Only stress ranges that cause tensile or reversal stresses are in-
TABLE 1
FATIGUE STRESSES
ALLOWABLE RANGE OF STRESS, F (KsI)
FOR FOR FOR OVER
100,000 500,000 2,000,000 2,000,000 CATEGORY ' CYCLES CYCLES CYCLES CYCLES
A 60 36 24 24 B 45 27.5 18 16 C 32 19 13 10 D 27 16 10 7 E 21 12.5 8 5
See Table 2. b Except for transverse stiffener welds on girder, webs or flanges, where
12 ksi should be used.

42
TABLE 2
DESCRIPTION OF DESIGN CONDITIONS FOR VARIOUS JOINT CLASSIFICATIONS
GENERAL CONDITION SITUATION
KIND OF STRESS
STRESS CATEGORY 5
Plain Base metal with rolled or cleaned surfaces. Flame-cut edges with T or Rev. A material ASA smoothness of 1,000 or less.
Built-up Base metal and weld metal in members without attachments, T or Rev. B members built-up of plates or shapes connected by continuous full-
penetration groove welds or by continuous fillet welds parallel to the direction of applied stress.
Calculated flexural stress at toe of transverse stiffener welds on T or Rev. C girder webs or flanges.
Base metal at end of partial-length welded cover plates having T or Rev. E square or tapered ends, with or without welds across the ends.
Groove Base metal and weld metal at full-penetration groove-welded T or Rev. B welds splices of rolled and welded sections having similar profiles
when welds are ground flush and weld soundness is estab- lished by nondestructive inspection.
Base metal and weld metal in or adjacent to full-penetration T or Rev. B groove-welded splices at transitions in width or thickness, with welds ground to provide slopes no steeper than 1 to 21/2 , with grinding in the direction of applied stress, and weld soundness established by nondestructive inspection.
Base metal and weld metal in or adjacent to full-penetration T or Rev. C groove-welded splices, with or without transitions having slopes no greater than 1 to 21/2 when reinforcement is not removed and weld soundness is established by nondestructive inspection.
Base metal at details attached by groove welds subject to trans- T or Rev. D verse and/or longitudinal loading when the detail length, L, parallel to the line of stress is between 2 in. and 12 times the plate thickness, but less than 4 in.
Base metal at details attached by groove welds subject to trans- T or Rev. E verse and/or longitudinal loading when the detail length, L, is greater than 12 times the plate thickness or greater than 4 in. long.
Fillet-welded Base metal at intermittent fillet welds. T or Rev. E connections
Base metal adjacent to fillet-welded attachments with length, L, in T or Rev. C direction of stress less than 2 in. and stud-type shear connec- tors.
Base metal at details attached by fillet welds with detail length, L, T or Rev. D in direction of stress between 2 in. and 12 times the plate thick- ness, but less than 4 in.
Base metal at attachment-details with detail length, L, in direc- T or Rev. E tion of stress (length of fillet weld) greater than 12 times the plate thickness or greater than 4 in.
T = range in tensile stress only; Rev. = a range of stress involving both tension and. compression during the stress cycle b See Table 1.
cluded. This study and the study reported in Ref. 1 both showed that although cracks may form in the residual ten-sion zones of details subjected to compression stresses, these cracks arrested when they grew out of the residual tensile zone. When subjected to stress reversal the tension com-ponent of the stress cycle is enough to continue driving the crack after it grows out of the residual tensile zone. The
slight differences in life at this stage of fatigue crack growth are not significant for design purposes.
Several details described in Table 2 are not supported by data from the Project 12-7 study. The stress category assigned to these details was based on data available in the literature. Current specification provisions are based on these same sources. These details include: (1) built-up

43
plates or shapes connected by continuous full-penetration groove welds parallel to the line of stress; (2) base metal and weld metal in or adjacent to full-penetration groove-welded splices at transitions in thickness, with the welds ground to provide slopes no steeper than 1 to 21/z, with grinding in the direction of applied stress, and the weld soundness established by nondestructive inspection; (3) base
metal and weld metal in or adjacent to full-penetration groove-welded splices, with or without transitions having slopes no greater than 1 to 21/2 when the reinforcement is not removed and weld soundness is established by non-destructivc inspection; and (4) base metal at details at-tached by groove welds subject to transverse or longitudinal loading.
CHAPTER FIVE
CONCLUSIONS
This study supplements the findings reported earlier in NCHRP Report 102 (1). The conclusions in this chapter are based on the analysis and evaluation of the test data of this study and its relationship to earlier published work, and on theoretical studies based on the application of fracture mechanics to stable crack propagation.
The conclusions applicable to all beams and details are described first. Those applicable to specific beams and de-tails are described under the various categories examined.
GENERAL
1. Stress range was the dominant stress variable influencing the behavior of the welded details and beams tested during this study. The existence of residual tensile stresses in the web or flange at the weld toe makes the full stress range effective.
Other stress variables, such as minimum stress, stress ratio, and maximum stress, were not significant for pur- poses of design.
The log-transformation of cycle life and stress range resulted in a normal distribution of the test data at all levels of stress range and a log-log linear relationship between the two variables,
Failures occurred due to destruction of the primary tension flange of all beams with weld details subjected to tension-tension and partial reversal of stress. Crack growth was also observed in the compression flange. However, the growth arrested after the cracks grew out of the tensile residual stress region unless there was a reversal of stress. There were no failures when the flange was subjected to a compression-compression stress cycle.
There were no observable differences in the results of beams tested at the two laboratories. Also, rest periods, interruptions of the tests, and laboratory environmental differences had no influence on the test data.
A theoretical stress analysis based on the fracture mechanics of stable crack growth confirmed the suitability of the log-log linear regression models that related the test
data stress range and cycle life. The analysis also permitted examination of other effects not tested in this study.
No fatigue limit was observed for the stiffener details and for flange attachments 2 in. or longer in length. Their fatigue behavior was defined in this study between 10 and 107 cycles.
This study can be used as a basis for further modifica-tions to the fatigue provisions of the AASHO specifications.
TRANSVERSE STIFFENER DETAILS
1. The bending stress range at the toe of stiffener-to-web welds and at the toe of the stiffener-to-flange transverse welds can be used as the stress variable to define the fatigue strength of fulldepth stiffener details.
The principal stress and its direction are not signifi-cant for purposes of design in bridge members with stiff-eners. Hence, the magnitude of shear stress need not be considered when determining the allowable bending stress range at full-depth stiffeners welded to the web.
The type of steel was not a significant design factor for any stiffener detail. However, the test data for ASTM AS 14 steel girders with A36 steel stiffeners welded to the web alone were near the lower confidence limit.
The cracks causing failurç of stiffeners welded to the web alone initiated at the terminating weld toe of the stiffener-tQ:web...Weld. When stiffeners were welded to the web and flanges, cracks originated at the toe of the trans-verse stiffener-to-flange weld. Cracks also formed at the stiffener ends in the compression regions of the test beams. These cracks arrested after they grew out of the residual tensile stress zone.
Welding transverse stiffeners to the tension flange should be permitted when it is needed or desired. The con-dition of the detail can be considered to be the same as at the terminating weld toe of stiffeners welded to the web alone.
The same stress range-cycle life relationship is ap-plicable to stiffeners welded to the web alone and to stiff-eners welded to the web and flange.

44
Attaching diagonal lateral bracing to the transverse stiffeners had no effect on their fatigue strength. The re-sulting out-of-plane deformation did not adversely affect the rate of crack growth. This was true of stiffeners welded to the web alone, as well as of stiffeners welded transversely to the flange as well.
No fatigue limit was reached within the limits of bend-ing stress range (13.7 to 28.7 ksi) that was examined.
WELDED BEAM ATTACHMENTS
1. The crack causing failure at all welded flange attach-ments originated at the weld toe termination. At trans-versely welded attachments, the crack originating near the midlength of the weld was most severe, although other initiation sites were also observed and eventually connected. At attachments without transverse welds the cracks origi-nated at the termination of both longitudinal fillet weld toes.
The fatigue strength decreased as the attachment length increased. The observed behavior was directly re-lated to the force development in the attachment plate.
Failure occurred in the tension flange of all beams with flange attachments. Cracks were also observed in the compression flange at the weld toe termination, but they seldom penetrated the flange thickness and mainly grew up in a region of local residual tensile stress. These compres-sion flange cracks did not adversely affect the beam behav-ior.
The stress range-cycle life relationships of the flange attachment series were essentially a family of parallel lines when the stress range and cycle life were logarithmically transformed. They were bounded by the parallel lines from the cover-plated beam and the plain welded beam data.
No fatigue limit was observed for the 4-in, and 8-in.
attachments with the magnitudes of stress range (8 to 24 ksi) that were examined. The 1/4 -in. and 2-in, attach-ments were tested at stress ranges between 12 and 28 ksi and no fatigue limit was observed for the 2-in, attachment. The 1/4 -in. attachments did not fail at the 1 2-ksi stress range level at 1.0 to 1.5 X 101 cycles of load application. A fatigue limit and threshold of crack growth may have been reached.
The differences in fatigue strength of the attachment details as a result of their length were accounted for by a fracture mechanics analysis of stable crack growth. The primary cause of the reduced strength with increasing at-tachment length was found to be the change in the stress concentration at the terminating weld toe.
A514 STEEL ROLLED BEAMS
1. A fatigue limit appeared to be reached at a stress range level of 34 to 36 ksi for the A514 steel beams. A number of beams were subjected to 101 cycles without visible crack growth.
The test data were in good agreement with the tests on A36 and A441 steel beams. Type of steel does not appear to have a significant effect on the fatigue strength, except for a slight difference in the fatigue limit. The fa-tigue limit and crack growth threshold were not clearly defined in this study.
Severe notches in a flange surface can initiate cracks and cause failure at much reduced levels of stress range. Obvious notches on flanges should be removed by grinding.
The 1971 interim AASHO specifications for the fa-tigue strength of base metal can be used to define the fatigue strength of rolled beams for 100,000 and 500,000 cycles. A higher threshold of stress range appears appro-priate for 2 million or more cycles of loads.
CHAPTER SIX
RECOMMENDATIONS FOR FURTHER WORK
The initial work on welded beams indicated that the plain welded beams possess the best fatigue behavior that can be expected of a welded built-up beam. The test results yielded information on a minimum notch condition and, hence, provided an upper bound for the fatigue strength of welded built-up beams. A maximum notch condition was provided by the beams with partial-length cover plates. The cover-plated beam represents one of the severest conditions that can be expected and yields a lower-bound condition. Un-fortunately, many details exhibit comparable behavior al-though they are not cover plates.
The experimental work reported herein and in NCHRP
Report 102 (1) has indicated that of all the controlled variables thought to have some influence on the fatigue strength, the primary ones are the range of stress and the type of detail. This was illustrated in Ref. 1 for the upper-bound plain welded beam tests, and the lower-bound beams with partial-length cover plates. In the current study, pro-visions were made to isolate the design factors that were thought to have some influence on the fatigue behavior of rolled A514 steel beams, welded beams with stiffeners, and welded beams with welded attachments. These studies have continued to confirm that the range of stress and the type

45
of detail are the dominant variables controlling the fatigue strength.
The continuing studies have also confirmed that the initial flaw condition is a major contributing factor to the fatigue strength. In welded details it is not possible to con-trol this variable. Hence, it must be considered as random and uncontrolled. Because of this factor, reasonable-sized experiment designs must be provided to ensure a satisfac-tory distribution of the uncontrolled flaw size. Only in this manner can rational fatigue data be generated.
SUGGESTED STUDIES
It is recommended that consideration be given to the fol-lowing further studies. so that appropriate design criteria can be developed for these conditions. A number of these studies were listed in NCHRP Report 102 (1). They are repeated here for completeness.
Butt splices with and without reinforcement in place. The study on beam splices with the reinforcement removed needs supplementing. That study indicated that the beam splice at width transitions with reinforcement removed will approach the upper bound provided by the plain welded beam. Previous studies on simple butt-welded plates have indicated substantially different strengths for welds with reinforcement in place compared to those with the reinforce-ment removed. Because the plain welded beam provides an upper bound to the fatigue strength, it is desirable to as-certain whether or not butt welds with part or all of the reinforcement in place cause a substantial reduction in fatigue strength from the upper bound. This will assist in determining whether or not excessive effort is being made to condition the splice even though it cannot exceed the upper-bound behavior. Some removal of the reinforcement may be necessary to provide satisfactory nondestructive inspection. Also needed are studies on groove-welded splices of flange plates with different thicknesses and with cope
holes. An evaluation of hybrid groove-welded splices should
also be undertaken. This would involve evaluation of welded details connecting two different grades of steel to-gether. The influence of dilution of the weldment, and whether or not it influenced the fatigue behavior, should be determined. In addition, other miscellaneous details should be studied, including the basic behavior of the weld-ment. The studies on A514 steel girders with A36 steel stiffeners indicated a possible increase in initial micro-flaw condition. Additional work is needed to characterize this.
Studies are needed on groove-welded attachments and cross beams. These are commonly used details today. The groove-welded plate attached to a tension flange tip or web is commonly used in nearly all bridge construction to at-tach lateral bracing and diaphragms. Often, nothing is done with the weld termination on the flange tip or web. Crack growth can be expected at these weld toes comparable to that observed at toes of fillet welds. Substantial reductions in fatigue strength can be expected from these groove-
welded plates. Further experimental studies are needed on this detail. It is suggested that studies be undertaken to determine the variation in fatigue strength with plate length and the condition of the weld termination, its transition and reinforcement condition.
Further studies are needed with stiffeners welded to the flange and web. The current study has shown clearly that significant improvements in fatigue strength are possi- ble with stiffeners welded directly to the flange as compared to the fatigue strength provided by welded attachments with some length. It is apparent that there is a need to examine factors not covered extensively in the current program. Among factors needing consideration are the relationship of the stiffener thickness to flange thickness, the effect of increase in flange thickness, the geometrical configuration of the stiffener welds and the sizes of copes, and whether or not the welds can be passed continuously over the longi- tudinal welds. Variations in the size of the stiffener-flange weld should be considered, as larger welds are needed to resist higher out-of-plane forces when used to connect intermediate diaphragms on curved girder bridges. The behavior of groove-welded stiffeners should be examined. Further studies on hybrid steels and their influence on the initial flaw size are needed.
Other special stiffener details are in use. For example, a thicker plate is inserted into the web at the stiffener. These and other conditions should be examined to deter-mine their merit and their relationship to simpler details. These studies should all be undertaken on girders at least as large as the SG series tests.
Further studies are needed on the behavior of attach-ments to beams and girders. Again, it should be noted that the project review panel suggested that attachments should also be placed on deeper girders. It is proposed that the 14-in, beam studies with welded attachments be extended to deeper girders. Actual bridge details in common use should also be used and their behavior correlated to the small at- tachments that were placed on beams during the initial test program."the attachments should be located on both the flange and the web, depending on the detail configuration.
It is common practice to use longitudinal groove welds with the back-up strip in place in box girder sections. Stud- ies are needed on this weld configuration to determine whether or not the flaw condition and its resulting fatigue strengths under these welding conditions are more severe than the plain welded beam condition. These studies should be made on plate-girder-type specimens that have a single-beveled groove weld with back-up strip in place.
Studies are also needed on bolted beam splices. Exist-ing studies have only involved tests on simple butt splices. As with welded details, the experiment designs have not permitted a rational evaluation of the design factors. Re- cent studies have indicated that type of steel may only have a minor influence, as is the case for welded beams. Because this class of joints forms an important segment of practical fastening methods, it is desirable to extend the studies into
this region.

46
REFERENCES
FISHER, J. W., FRANK, K. H., HIRT, M. A., and MCNAMEE, B. M., "Effect of Weidments on the Fa-tigue Strength of Steel Beams." NCHRP Report 102 (1970) 114 pp. JOHNSON, K. L., and O'CONNOR, J. J., "Mechanics of Fretting." Proc. Inst. Mech. Eng., Vol. 178, Part 35 (1963-1964) pp. 7-21. LEA, F. C., and WHITMAN, J. G., "The Failure of Girders Under Repeated Stresses." Welding Res. Supp., Vol. 18, No. 1 (Jan. 1939). NEE, J. D., "Fatigue Strength of USS 'T-1' Construc-tional Alloy Steel Beams with and Without Stiffeners." Applied Research Lab., U.S. Steel Corp. (Feb. 1966). SHERMAN, D. R., and STALLMEYER, J. E., "Fatigue of 7-1' Beams." Status Report of Fatigue Committee-Welding Research Council, Univ. of Illinois (May 1963). WILsoN, W. M., "Flexural Fatigue Strength of Steel Beams." Eng. Exper. Sta. Bull. No. 377, Univ. of Illinois, Vol. 45, No. 33 (Jan. 1948). GURNEY, T. R., "Investigation into the Fatigue Strength of Welded Beams, Part II: High Tensile Beams With-out Stiffeners." British Welding Jour., Vol. 9, No. 7 (July 1962) pp. 446-454. JACCARD, R., and FISHER, J. W., "Fatigue Strength of A514 Steel Machined Plain Tension Specimens." Fritz Lab. Rep. 358, Lehigh Univ. (1972). Hiwr, M. A., and FISHER, J. W.; "Fatigue Crack Growth in Welded Beams." Jour. Eng. Fracture Mech., Vol. 5 (1973) pp. 415-429. HARRISON, J. D., "An Analysis of Data on Non-Propagating Fatigue Cracks on a Fracture Mechanics Basis." Metal Constr. and Brit. Welding Jour., Vol. 2, No. 3 (Mar. 1970) pp. 93-98. SIGNES, E. G., BAKER, R. G., HARRISON, J. D., and BURDEKIN, F. M., "Factors Affecting the Fatigue Strength of Welded High Strength Steels." Brit. Weld-ing Jour. (Feb. 1967) pp. 108-1 16. WATKINSON, F., BODGER, P. H., and HARRISON, J. D., "The Fatigue Strength of Welded Joints in High Strength Steels and Methods for its Improvement." Proc., Fatigue of Welded Structures Conf., The Weld-ing Institute, Brighton, England (July 1970). "Standard Specifications for Highway Bridges." Ameri-can Association of State Highway Officials (1969). GURNEY, T. R., "Fatigue Strength of Beams with Stiff-eners Welded to the Tension Flange." Brit. Welding Jour. (Sept. 1960) p. 569. FIELDING, D. J., "Fatigue Tests of Slender-Web Hy-brid Plate Girders Under Combined Bending and Shear." M.S. Thesis, Univ. of Texas, Austin (June 1968). OZELL, A. M., and CONYERS, A. L., "Transfer of Stresses in Welded Coverplates." Bull. No. 63, Weld-ing Res. Council (1960).
STRUIK, J. H., "Documentation Program GEN-FEMPS'." Fritz Eng. Lab. Report, Lehigh Univ. (in preparation). GURNEY, T. R., "Fatigue Tests on Butt and Fillet Welded Joints in Mild and High Tensile Structural Steels." Brit. Welding Jour., Vol. 9, No. 11 (1962) pp. 6 14-620. GURNEY, T. R., "Further Fatigue Tests on Mild Steel Specimens with Artificially Induced Residual Stresses." Brit. Welding Jour., Vol. 9, No. 11 (1962) pp. 609-613. GURNEY, T. R., "The Effect of Peening and Grinding on the Fatigue Strength of Fillet Welded Joints in Two Steels." BWRA Rep. E/12A/67. WECK, R., "Results of Fatigue Tests on Mild Steel Specimens with Welded Attachments." 11W Doc. XIII-154-58. FRANK, K. H., "The Fatigue Strength of Fillet Welded Connections." Ph.D. dissertation, Lehigh Univ. (Oct. 1971).
MADDOX, S. J., "Calculating the Fatigue Strength of a Welded Joint Using Fracture Mechanics." Brit. Weld-ing Jour. (Aug. 1970). GURNEY, T. R., Fatigue of Welded Structures. Cam-bridge Press (1968).
PARIS, P. C., GOMEZ, M. P., and ANDERSON, W. E., "A Rational Analytical Theory of Fatigue." The Trend in Engineering, Univ. of Washington, Vol. 13, No. 1, (Jan. 1961).
IRwIN, G. R., "Analysis of Stresses and Strains Near the End of a Crack Traversing a Plate." Trans. ASME, Series E, Vol. 24, No. 3 (Sept. 1957). IRwIN, G. R., "Crack Extension Force for a Part-Through Crack in a Plate." Trans. ASME, Series E, Vol. 29 (Dec. 1962). BARSOM, J. M., "Fatigue-Crack Propagation in Steel of Various Yield Strengths." Appl. Research Lab., U.S. Steel Corp. (1971). PARIS, P. C., "The Fracture Mechanics Approach to Fatigue." Proc. 10th Sagamore Conf., Syracuse Univ. Press (1965).
"Interim Specifications, 1971." Developed by AASHO Committee on Bridges and Structures, AASHO (1971). HALL, L. R., "Fatigue Tests of Thin Web Girders." Status Report to Fatigue Committee-Welding Re-search Council, Univ. of Illinois (May 1960). HALL, L. R., and STALLMEYER, J. E., "Thin Web Girder Fatigue Behavior as Influenced by Boundary Rigidity." Struct. Res. Series No. 278, Univ. of Illi-nois (Jan. 1964).
KOUBA, N. G., and STALLMEYER, J. E., "The Be-havior of Stiffened Beams Under Repeated Loads." Struct. Res. Series No. 173, Univ. of Illinois (Apr. 1959).

47
GURNEY, T. R., and WOODLEY, C. C., "Investigation into the Fatigue Strength of Welded Beams. Part III: High Tensile Steel Beams with Stiffeners Welded to the Web." Brit. Welding Jour. (Sept. 1962). BRAITHWAJTE, A. B. M., "Fatigue Tests on Large Welded Plate Girders." Rep. D7/36A165, Brit. Weld-ing Res. Assn. (May 1965). GOODPASTURE, D. W., and STALLMEYER, J. E., "Fa-tigue Behavior of Welded Thin Web Girders as Influ- enced by Web Distortion and Boundary Rigidity." Struct. Res. Series No. 328, Univ. of Illinois (Aug. 1967). YEN, B. T., and MUELLER, J. A., "Fatigue Tests of Large-Sized Welded Plate Girders." Fritz Eng. Lab. Rep. No. 303.10, Lehigh Univ. (June 1966). TOPRAC, A. A., and NATARAJAN, M., "Fatigue Strength of Hybrid Plate Girders." Jour. of Struct. Div., ASCE (Apr. 1971). TOPRAC, A. A., and FIELDING, D. J., "Fatigue Tests of A441-A36 Hybrid Plate Girders." The Struct. Eng., Vol. 48, No. 12 (Dec. 1970). YINH, J., and TOPRAC, A. A., "Study on Fatigue of Hybrid Plate Girders Under Constant Moment." Res. Rep. 96-3, Univ. of Texas, Austin (Jan. 1969). YEN, B. T., "Design Recommendations for Bridge Plate Girders." Fritz Eng. Lab. Rep. No. 327.6, Le-high Univ. (June 1969). GURNEY, T. R., and TREPKA, L. N., "Exploratory Tests to Determine the Influence of Local Heating on the Fatigue Behavior of Welded Mild Steel Speci- mens." Brit. Welding Jour., Vol. 7, No. 8 (1960). GURNEY, T. R., "Influence of Residual Stresses on Fatigue Strength of Plates with Fillet Welded Attach-ments." Brit. Welding Jour. (June 1960) p. 415. GURNEY, T. R., and MADDOX, S. J., "A Re-Analysis of
Fatigue Data for Welded Joints in Steel." BWRA Re-port E/44/72 (Jan. 1972). PARIS, P. C., "Testing for Very Slow Growth of Fa-tigue Cracks." Closed Loop, MTS System Corp., Vol. 2, No. 5 (1970). FISHER, J. W., and GURNEY, T. R., "High Cycle Fa-tigue of Connections and Details." State-of-Art Re-port 4, Tech. Committee 18, ASCE-IABSE Internat. Conf. on Tall Buildings (Aug. 1972) Preprints: Re-ports Vol. 11-18. CROOKER, T. W., and LANGE, E. A., "How Yield Strength and Fracture Toughness Considerations Can Influence Fatigue Design Procedures for Structural Steels." Welding Res. Supplement, Vol. 49, No. 10, (Oct. 1970) pp. 488-496. MADDOX, S. J., "Fatigue Crack Propagation in Weld Metal and Heat Affected Zone Material." Members' Report No. E/29/69, The Welding Inst., England (Dec. 1969). PARIS, P. C., and SIH, G. C., "Stress Analysis of Cracks." STP No. 381, ASTM (1965). ALBRECHT, P. A., "Fatigue Strength of Welded Beams with Stiffeners." Ph.D. dissertation, Lehigh Univ. (July 1972). PEARCE, S. C., Biological Statistics. McGraw-Hill (1965) pp. 110-112. BUTLER, L. J., and KULAK, G. L., "Strength of Fillet Welds as a Function of Direction of Load." Welding Jour., Vol. 36, No. 5 (May 1971). MUNSE, W. H., and STALLMEYER, J. E., "Influence of Welded Details on Fatigue of Welded Beams and Girders." Symp. on Fatigue of Welded Structures, Cambridge Univ. (Mar.-Apr. 1960). NATRELLA, M. G., "Experimental Statistics." Hand-book 91, U.S. Dept. of Commerce (1963).
APPENDIX A
LITERATURE SURVEY
A history and summary of previous work in rolled beams, welded beams without attachments, cover-plated beams, and beams with groove-welded splices-was given in NCHRP Report 102 (1). This appendix extends the evaluation of further work to stiffened beams and girders and beams with flange attachments.
BEAMS AND GIRDERS WITH STIFFENERS
A review of the literature indicated that most of the studies on stiffened beams and girders were undertaken on ii - to 37-in.-deep welded beams fabricated from steels with yield
strengths between 32 and 100 ksi. The stiffeners of varying length were fabricated from mild steel and welded to the web alone or to the web and flanges.
The dimensions of stiffened beams tested in previous investigations are given chronologically in Table A-i. In-formation on the stiffeners and welds is given in Table A-2. The applicable test results from these studies are listed individually in Tables A-3, A-4, and A-5, and the data are summarized in Figures A-i, A-2, and A-3. Also shown are the mean regression lines for the plain welded and cover-plated beams (1), which define the upper and lower bound,

TABLE A-i
DIMENSIONS OF STIFFENED BEAMS TESTED IN PREVIOUS STUDIES
CONSTANT MOMENT
REFER- DEPTH WEIGHT SPAN a REGION ENCE SERIES (IN.) (LB/FT) (FT-IN.) (FT-IN.)
FLANGE WEB
THICK- SLENDER- NESS WIDTH THICKNESS NESS WELDING (IN.) (IN.) (IN.) RATIO STEEL PROCEDURE
6 H 157/g 36 8-6 1-0 7/16 7 48 - (rolled) 33 All 12 41 8-6 1-0 1 5 53 A373 Manual
A 16 43 8-6 1-0 1 5 /16 75 A373 Manual 14 BT 7 34 6-8 1-8 0.55 7 0.35 17 B.S. 15 (rolled) 31 - 16 16 8-6 1-0 % 5 IA6 244 A373 Manual 34 BM 11 24 5-2 1-10 Y2 4 /16 32 B.S. 968 Aut. subm.
BS 11 24-3 1 5-2 Varies Y2 4-6 46 32 B.S. 968 Aut. subm. 32 FT ~21 14-39 10-01 - 1%_i 5 0.075 267 A373/A366
FTSB —18 10-11 10-3° - %—1 43/87-1 A6 267 A373/A245' VSTB 21 11-20 11-0 1 - 241/1 1/16 320 A373/A2451
35 2 251h 92 12-9 2-9 3% 12 /8 64 B.S. 15 Aut. subm. 3 25% 61 12-10 2-9 /8 91/1 1/4 96 B.S. 15 Aut. subm.
4 W 8 18 6-6 2-0 T46 4 23 A514 (rolled) 37 F —52 Varies Varies Varies Varies 12 3/16-3/8 133-267 A373, A36 Varies 36 FT—A ~21 14,39 10-01 - 14,1 5 0.075 267 A441/A415
FFSB—A —21 15 10-3° - %, 1 4, 11/1 0.075 267 A7/A415t Semi-aut. VST—A ~20 17 11-11 - 4% 0.06 312 A441 Metallic- HSB —21 15, 18 10-3 e - %, % 4,2% 0.075 267 A441/A415 inert gas HVSB ~20 17 11-11 - 4% 0.06 312 A441
38 A 37 43-73 36-0° 16-0 Ih 8 %-% 96-288 A514/A36 Man, arc B 37 43-73 23-0 16-0 % 8 1/9-% 96-288 A514/A36 Man, arc
15 C 37 43,58 22-8, 19-2 4-8 1/, 8 i6, % 144,192 A514/A36 Aut. subm. 40 D 37 44,51 24-0 8-0 % 8 0.135, %6 192,268 A514/A36 Aut. subm. 38 F 37 43 22-8 1-8 1/1 8 %6 192 A514/A36' Aut. subm. 39 H 37 43,58 24-0 9-0 Y2 8 %6, Y4 144,192 A441/A36 Aut. subm.
Full-length specimens unless specifically marked otherwise. b Simple beams with two equal concentrated loads symmetrically placed ° Depth-to-thickness ratio of web plate. d Homogeneous specimens unless specifically marked otherwise. ° Panel specimens.
Hybrid girders.
00

49
TABLE A-2
STIFFENER AND WELD DETAILS FOR BEAMS LISTED IN TABLE A-i
REFER- ENCE SERIES
STIFFENER
THICKNESS (IN.)
WIDTH (IN.)
ARRANGE- MENT STEEL
STIFFENER-TO-WEB WELD
WELD WELDED CUTOFF b
ELECTRODE TO (IN.)
WELD SIZE (IN.)
6 Ha 3 Pair TWC Hb 3 Pair WC Hc 3 Pair WC 3
33 A 1/4 2 Single A7 £7016 WC B 2 Single A7 £7016 TWC C 1/4 2 Single A7 £7016 W c 1112 D % 2 Pair A7 E7016 WC £ 21/4 Single A7 E7016 WC 2 F % 2% Single A7 E7016 WC 2,5 CX 14 2 Single A7 E7016 TWC 1%
14 BT 3 Pair B.S. 15 E217 TWC 31 Pair E6013 WC 1/8
34 BM 1,4 11/2 Pair B.S. 15 £217 W %, 1 5A6 BS Y2 Varies Pair B.S. 15 E217 W Varies /16
32 FT 2 Pair E6013 W FTSB £6013 W VSTB 1,4-2 Pair E6013 W
35 2 5/ 51/2 Pair B.S. 15 TWC 3%
3 %r, 5% Pair B.S. 15 WC Varies 14 4 W 1/4 l/8 Pair Carbon £7018 W —'%
37 F 1,4 3 Pair A373, A36 E60 W 1 %, 36 FT 1/ 2 Pair W
FTSB-A Pair W VST 1,4 1,4,2 Pair w HSB 1/4 11,4 Single W HVSB 1%, 1% 114,2% Single W
38 A 8/ 3 Pair A36 E7010 W 2 B 3 Pair A36 E7010 W 2
15 C 3 Pair A514, A36 E7018 WC 2,8 1/4 40 D 3 Pair A36 E6018 W 2 38 F 1,4 3% A514,A36 W 2 39 H Pair E7018 WC 2
Welded continuously except as specifically marked otherwise. T - tension flange; W = web; C = compression flange. b Distance between the end of the stiffener-to-web weld and the inside flange face.
Stiffeners welded intermittently (1-3) to web.
respectively, of the fatigue strength of welded beams. Ratios of shear-to-bending stresses at crack initiation points in the web are shown in Figure A-4. It is apparent that high shear-to-bending stress conditions were usually examined. Figure A-5 shows the different types of fatigue cracks and Table A-6 gives the number of fatigue failures in each series by type of crack.
STIFFENERS WELDED TO THE WEB
Two distinct conditions in the web may induce fatigue crack growth at the toe of the stiffener-to-web fillet welds. When subjected to moment and shear the weld toe termina-tion is subjected to a principal stress condition that is more severe than the bending stress alone. Generally, fatigue cracks have always formed perpendicular to this principal stress or in plane stress condition.
A second condition can develop in girders with very thin webs. The thin webs are prone to instability before the maximum applied load is reached and deform out-of-plane and allow a redistribution of stresses. Such bulging of the
web produces membrane stresses and secondary bending stresses.
Thin-web flexural members with severe out-of-plane de-formations have substantially reduced fatigue lives. For example, Hall (31) reported fatigue lives of 20,000 and 250,000 cycles at 20-ksi stress range for two stiffened beams with a web slenderness ratio of 244 and large initial out-of-flatness. In a later investigation on a similar type of speci-men, Hall (32) actually recorded initial web deflections due to distortion during fabrication of up to three times the web thickness, and web deflections at maximum test load of up to six times the web thickness. Such test specimens are not compatible with bridge and building fabrication practice.
The first major investigation of the fatigue strength of stiffened steel beams dates back to 1948. Wilson (6) tested nine beams with stiffeners located under the load points. Unfortunately, the lack of information on crack initiation and growth does not permit reliable plotting of the fatigue test data.
In 1959, Kouba and Stallmeyer (33) reported the results

50
0 z enen'l
en \C O ' — O en en N 00 N 0— N O\ IrC r- '.0 — I, O\ N Q\ 000 NT 00 0 N en N 00 kn en kn '.0t Xn 0 en 000 N — en N 000 0 0\ '.0 en en N C\ 00 lr 'r 0 N — N a — N 0\ "0 00 0\ 0 N O\ 00 '.0 In '.0 'r 0 — 0000 "00 N N © N 00— N en en 'r 0'. 0'. 0, N 0 N 0 — — — N — — — N — — — — — — en 1fl — — N N '
0) 000Noor,N,,,0oo,,- NN'.0N',0'. Otfen.'.00q'... Oen ©©o0'.Ifl'.0000Q
ONen0en00eno_ enenen'.enoo.0'. ©FN©© 0000 00 -'000 OOO 00 ©'r'-c N- 00N'N enN_0©©,.NNC,,,,I'..., C".©©©©-,-,-
en.-N.'.0,iN00oo N C 0N r-t'- oen0000enenNNN00en© 00 00'.enN ,, NN '-'.-'
C'. 0, 000'. 0'. 0'. 0\ en en N 0'. 000'. 0000 4 4 en 0', 000 ' 00000 en en N 0'. 0'. 0000
a a a a a a a a a a a a a a a a a a a a a a a a a a a a a aa a a a a a O.O 0 ONNN0NN000NNN000NNN© ,
000000 Cl)C#)Cl) Z Cl)C#Cl) ++++++++++++++++++++++++++++++++++++Nen_N_N0
N 00 N N —0000000'. en 'r en '0 '1 N 00 It en N 0'. N 00 "0 N '. N N N en - - - - en IT en V' r) — — — C". 'r en en en — — en 'r, '1 C". '.0 C". en '.0
In 'C'.
of 45 fatigue tests on manually welded, 12-in-deep, stiff-ened beams. The major variables considered were stress, one- and two-sided stiffeners, continuous and intermittent stiffener-to-web welds, and the stiffener cutoff point. Fa-tigue failure of the beams with stiffeners welded to the web alone was caused by cracks that initiated at the lower end of the stiffener-to-web weld toe and grew diagonally up-ward into the web and downward toward the web-to-flange weld. Upon reaching the web-to-flange weld, the crack pro-ceeded horizontally along the weld toe. Only one of 31 such beam failures exhibited crack penetration into the ten-sion flange. This crack propagation behavior is believed due to the high shear-to-bending stress ratio in the web. This ratio varied from 0.83 to 5.16 at the crack initiation points, as shown in Figure A-4. The tests were generally stopped after 2-in.-long cracks formed. The results are plotted as open squares in Figure A-i. It should also be noted that cracks only formed at high shear-to-bending stress ratios when the stiffener welds terminated 2 in. or more above the flange.
Gurney (34) tested il-in.-deep welded beams of high-strength steel. The stiffeners were cut off at varying dis-tances from the tension flange, resulting in shear-to-bending stress ratios at the lower end of the stiffener-to-web welds between 0.72 and 1.60 (see Fig. A-4). In ten out of eleven
beams, cracks initiated at the stiffener weld toe and propa-gated in a direction approximately perpendicular to the direction of the principal tensile stress. One crack origi-nated at the upper end of the stiffener-to-web weld in the compression side of the web. The test points are plotted as open circles in Fig. A-i and fall below the scatter band observed by Kouba and Stallmeyer (33). Crack growth was also confined to the web.
In an attempt to verify the size effect, Braithwaite (35) carried out four tests on 25-in, welded girders. Only two failed from cracks growing in a way that resembled the crack growth reported by previous investigators. The shear-to-bending stress ratio at the lower end of stiffener-to-web welds was 1.18, and the tests were stopped when the web cracks were 4 in. long. The results are plotted as solid dots in Figure A-i.
Hall, Goodpasture, and Stallmeyer (36, 32) studied the effect of flange rigidity, vertical stiffener rigidity, and initial web deflection on the fatigue behavior of individual panels of 30 thin-web girders with web slenderness ratios between 267 and 312. All 30 specimens failed from cracks growing at varying heights along the toe of the stiffener-to-web welds. The cracks were due to severe bulging of the web under applied loads. No correlation was found between the rigidity parameters of the members on the panel boundaries

51
EU
l- z
00 N 00 — — '.0 en 0 . ell
0 0 0 0 ... ' *r 0\ O\ O\ ON a, Q' 0 U .0
— a)
11111 I I I I I I 11111 I I --
- - - N - - N N - - N N - - 0 U 0 FU5 0
0 U 0 0000000.00,0,0 eE
en '.0 000 a)' in 'r ara 'ra CN 0\ ar in in ara an an an an an N N N ,- N N N - - N N ..
kn in
, 0 0000000000000000000000000 E • .0
N N N en en
Thih
anan'raan C
00000000u0000I 00000000000000000 an ar an Ira Ira Ira Ira Ira Ira Ira Ira Ira Is-a '- '1' Ira Ira C..) an ira in an Ira — - an an 'ra an 'n 'n an an an In
N N N en en N N N N en N N N N N N N 0 U en en en en en en en en en en en en en en "t l' en en en en .. 0
. . .
Z ;uo
en en a)000
and the fatigue life. The specimens with smaller initial web deflections, however, appeared to have longer fatigue lives. These results were not considered in view of the unrealistic cross-sectional dimensions and initial web deflections of the test specimens.
The same type of behavior, although less severe, was observed by Yen and Mueller (37), who tested nine 50-in.-deep plate girders. The girders developed fatigue cracks along weld toes at any one of the four panel boundaries.
Fielding and Toprac (15, 38) investigated the fatigue strength of hybrid girders with A36 webs and A514 flanges. Test parameters included stress range, web slenderness ratio, web aspect ratio, and transverse stiffener length. Cracks grew at the end of the load-bearing stiffeners where the shear and bending moment diagrams are discontinuous, thus leaving some uncertainty about the magnitude of the principal stress at the crack initiation point. The results of a finite element stress analysis of the girders tested in the present investigation indicated that the principal stresses in the web at the lower end of the bearing stiffener are ap-proximately equal to the bending stresses at midspan at the same distance from the neutral axis. Hence, this value was used to plot Fielding and Toprac's fatigue test data as open triangles in Figure A-I. Cracks were not observed in a number of specimens and the data points are indicated by
arrows. The lower points correspond to stiffeners with an 8-in, cutoff, the higher points to stiffeners with 2-in, cutoff. It is probable that out-of-plane deformations occurred at the end of the load-bearing stiffeners with an 8-in, gap be-tween the flange and the stiffener end. This would intro-duce secondary stresses and decrease the fatigue strength.
The available tests on stiffeners welded to the web alone indicate that the principal stress at the terminating fillet weld toe provides good correlation of the test data. Whether stiffeners were provided on one or both sides of the web, and whether the stiffener-web welds were continuous or intermittent, did not seem to affect the fatigue resistance significantly, provided it is plotted against the principal stress range at the crack initiation point. Increasing the shear-to-bending stress ratio appeared to decrease the fa-tigue life. This was especially true when extreme values of shear to bending stress were tested.
The fatigue tests carried out in the past on beams with Type 1 stiffeners have several drawbacks, among which are unrealistically high shear-to-bending stress ratios in the web, resulting from partial-depth stiffeners. This resulted in prin-cipal stress values approaching, and even exceeding, the maximum bending stress at midspan, as indicated by the numbers in Figure A-4, which gives the principal stress of the stiffener as a percentage of the maximum bending stress. Crack growth was only experienced under these high shear-to-bending ratios when the stiffeners were cut short of the tension flange. Furthermore, variation of too many pa-rameters in a series makes a rational evaluation of the significance of the individual parameters on the fatigue strength almost impossible. In most cases crack growth was limited to the web.
The fatigue behavior of the web to which stiffeners have been welded in a constant bending moment region is similar to the behavior in a moment gradient region. Crack initia-tion at these stiffeners occurs at the toe along the lower portion of the stiffener-to-web weld. After growing through the web plate, the crack propagates in the absence of shear stresses vertically upward along the weld toe and down-ward to the web-to-flange junction and eventually into the flange.
Gurney (34) reported five tests on 11-in, welded beams of high-strength steel. They are plotted as circles in Figure A-2. Nee (4) investigated the fatigue strength of 8-in. stiffened rolled I-beams of A514 steel. Applied hending stress ranges at midspan varied from approximately 18 to 65 ksi. The test data are plotted with open squares. Two failures were also observed by Yen and Mueller (37) on 50-in-deep girders, shown with solid dots in Figure A-2.
Of the 39 tests of hybrid girders with stiffeners in the constant moment region that were reported by Toprac, Natarajan, Fielding, and Yinh (38, 39, 40), only 11 failed from cracks initiating at the lower end of the stiffener-to-web weld. They are plotted as open triangles in Figure A-2. Six girders failed as plain welded beams, five had typical thin web cracks along the weld joining the web and the compression flange, and 15 tests were stopped after 2 to 5 million load cycles and prior to visible cracking. They are shown with arrows. Only girders with primary cracks leading to failure are included in Figure A-2. Yinh (40)

52
TABLE A-4
RESULTS OF PREVIOUS FATIGUE TESTS ON TYPE 2 STIFFEN ERS
REFER- ENCE SPECIMEN
EXTREME FIBER BENDING STRESS AT MIDSPAN (KsI)
MIN. RANGE
BENDING STRESS AT STIFFENER, RANGE (scsi)
CYCLES TO FAILURE
(x 10) NOTES
34 BM 1 1.1 32.7 25.5 563 BM 2 30.0 22.2 685 BM 5 26.2 19.5 1,440 BM 3 24.4 18.1 2,028 BM 4 21.5 15.7 3,909
4 W 19 4.9 65.1 48.8 101 W 18 4.9 65.1 48.8 125 W 29 3.5 46.5 34.9 331 W 27 2.8 37.2 27.9 290 W 28 2.8 37.2 27.9 579 W 33 2.1 27.9 20.9 1,716 W 30 2.1 27.9 20.9 1,828 W 26 1.8 23.2 17.4 3,418 W 38 1.6 21.4 16.0 4,856 W 37 1.4 18.6 13.9 7,503 W 32 1.0 14.0 10.5 10,000 2
38 21020A 10.0 10.0 8.6 2,927 2 21530A 15.0 15.0 13.0 2,000 2 21540A 15.0 25.0 21.6 294 6 22540A 25.0 15.0 13.0 1,722 6 22550A 25.0 25.0 21.6 618 4 41020A 10.0 10.0 8.6 2,311 2 41530A 15.0 15.0 13.0 2,000 2 41540A 15.0 25.0 21.6 630 1 42540A 25.0 15.0 13.0 947 1 42550A 25.0 25.0 21.6 640 1 61530A 15.0 15.0 13.0 2,000 2 61540A 15.0 25.0 21.6 1,395 4 62540A 25.0 15.0 13.0 2,530 2 62550A 25.0 25.0 21.6 479 1 21020B 10.0 10.0 8.6 2,233 2 21530B 15.0 15.0 13.0 2,137 2 21540B 15.0 25.0 21.6 277 2,3 22540B 25.0 15.0 13.0 1,588 6 22550B 25.0 25.0 21.6 672 6 31020B 10.0 10.0 8.6 4,771 2 31530B 15.0 15.0 13.0 2,104 2 31540B 15.0 25.0 21.6 890 4 32540B 25.0 15.0 13.0 2,440 2 32550B 25.0 25.0 21.6 815 6 41530B 15.0 15.0 13.0 2,053 2 41540B 15.0 25.0 21.6 974 4 42540B 25.0 15.0 13.0 3,643 2 42550B 25.0 25.0 21.6 421 4
40 22050D 20.0 30.0 26.0 544 1 22050DR 20.0 30.0 26.0 615 5 32050D 20.0 30.0 26.0 571 1 32050DR 20.0 30.0 26.0 657 4
39 31030H 10.0 20.0 17.3 2,015 5 3153011 15.0 15.0 13.0 2,941 2 31530HR 15.0 15.0 13.0 2,360 2 41030H 10.0 20.0 17.3 2,041 5 40530H 5.0 25.0 21.6 888 5 40530HR 5.0 25.0 21.6 934 5
Notes: 1. Plain welded beam failure, initiating either at web-to-flange fillet weld or at the flange tip. 2. Test discontinued. 3. Test result not comparable. 4. Two-ended through crack in web plate at stiffener end, no crack extension into flange. 5. Part-through crack in web plate at stiffener end. 6. Web crack along toe of fillet weld connecting the web to the compression flange (thin-web failure).

53
TABLE A-S
RESULTS OF PREVIOUS FATIGUE TESTS ON TYPE 3 STIFFENERS
REFER- ENCE SPECIMEN
EXTREME FIBER BENDING STRESS AT MIDSPAN (KS!)
MIN. RANGE
BENDING STRESS AT STIFFENER-TO CYCLES FLANGE WELD TO
RANGE FAILURE (KSI) (x 10) NOTES
33 29 B+SB 1.0' 30.4 22.5 628 5 30 B+SB 1.0" 30.1 25.1 447 4 31 B+SB 1.0' 30.0 25.0 524 4 43 B+SB 0.7" 25.1 18.6 1,272 6 41 B+SB 0.7" 24.6 18.2 1,110 5 42 B+SB 0.7" 24.3 - 4,031 3 56 B+SB 0.4" 20.7 15.3 5,078 1 55 B-j-SB 0.4" 19.8 14.7 4,115 1 44 B+SCX 0.7" 24.4 20.3 1,187 4
14 BT 1 -1.1 37.3 31.4 264 4 BT 2 32.7 27.6 352 4 BT 3 27.9 23.5 254 4,7 BT 4 27.1 22.8 293 4,7 BT 5 26.8 22.6 687 4 BT 6 22.6 19.1 1,105 4 BT 7 21.8 18.4 509 4 BT 8 19.7 16.6 1,600 4,7 BT 9 18.9 15.9 3,370 2 BT 10 17.3 14.6 2,121 2
35 2 B -1.8 23.1 21.7 984 4 2 C 20.9 19.7 1,410 4 2 D 19.3 18.2 1,530 4 2 A 16.7 15.7 4,290 4
Notes: I. Plain welded beam failure. 2. Test discontinued. 3. Test result not comparable. 4. Failure at stiffener in constant bending moment region. 5. Crack growth at toes of stiffener-to-web weld and stiffener-to-tension flange weld simultaneously. 6. Crack growth at toe of stiffener-to-web weld alone. 7. Rough weld, slight amount of undercut.
b Estimated.
computed secondary bending stresses at the compression flange boundary of the web panel that exceeded the yield strength for one girder with a 10-gauge web and a slender-ness ratio of 268. This girder had a 1 0-in.-long crack at that boundary, but it failed as a plain welded beam from a crack originating in the web-to-flange fillet weld. The ratio of initial web deflection to web thickness was 1.9 for this specimen. Yinh and Toprac (40) observed that thin web cracks along the toe of the web-to-compression flange weld of hybrid girders did not occur when the web slender-ness ratio was less than 192 and the ratio between initial web deflection and web thickness was less than one. This is in agreement with the web slenderness ratio limit pro-posed by Yen (41) for plate girders.
Figure A-2 includes tests on 8-, 11-, and 37-in-deep homogeneous and hybrid specimens, with welded or rolled sections, of mild and high-strength steels. Stress range is seen to account for most of the variation in fatigue life. Only in Nee's (4) tests were the cracks allowed to propa-gate into the tension flange.
STIFFENERS WELDED TO THE WEB AND FLANGES
In most previous investigations (14, 33, 35) stiffeners welded to the web and flange were situated in a constant bending moment region.
Kouba and Stallmeyer (33) tested beams with several stiffeners. The test data are plotted as open squares in Figure A-3. Three specimens exhibited crack growth from the toe of the stiffener-to-flange weld in the constant mo-ment region. The remaining two failures occurred in the moment gradient region, with cracks developing simultane-ously at the toes of the stiffener-to-web and the stiffener-to-flange welds. This is mainly due to the cross-sectional dimensions of the 1 24n. welded test beam. The critical stiffener in the moment gradient region had nominal prin-cipal stresses at the end of the stiffener-to-web weld which exceeded the bending stresses at the toe of the stiffener-to-flange weld by 32 percent. This does not correspond to conditions normally experienced in beams.
Gurney's tests were carried out on 7-in.-deep rolled steel beams and are plotted as circles in Figure A-3. The three early failures reported by Gurney (14) were attributed to undercut at the weld toe. Braithwaite's (35) tests on 25-in. welded steel girders are shown as open triangles. The stiff-eners were located in a constant bending moment region.
Except for the three early failures reported by Gurney, there is good agreement among the test data, which lie just below the strength of the welded beams. The bending stress range is seen to define the fatigue strength.

60 - 60 -
50— 50 3- a
40- Pw - 40 - PW
.c5 30 - Z 30 -
LLL QcqODW 8
(')u 20 -
(flq) - U) ci
0 0
c 10— 10 -
ui ZZ WW
a- a Ref. 33 CP T I-. oRef.4
0 Ref. 34 A Ref. 38, 39,40
. Ref. 35 Ref. 37 - A Ref. 15,38 5 -
0
iJ
iO 06 5 107
CYCLES TO FAILURE
Figure A-i. S-N plot for Type 1 stifleners welded to the web alone, summary of previous fatigue test data.
106 10
CYCLES TO FAILURE
Figure A-2. S-N plot for Type 2 stifieners welded to the web alone, summary of previous fatigue lest data.
60 - 2.0 -
50- 52
0 40 - Ref. ~5.I6
PW /
884
0
uJw 30 - 1.8-
84
.uj Ref. 3 4 -- <I6 65 °b 85
86 20 - 86
55
106 I .6
- . a 62 0 Ref. 33
Z 66
0 2 +
97 b 44 A Ref. 31
6w 10 - 98
102,64 o Ref. 34
CP 0 Ref. 33 .4 - 104
96 • Ref. 35
LL Ref. 14 v Ref. 4
U) A Ref. 35 r0 i
\00
X Ref. 38,39,40,15 1- 5 -
.2- 1V75 • Present Study
TI X 87
I I I
° b,max. I I I ________________________________________________________________________________________________ 82
106 5 1.0'
90 I 1 I I I CYCLES TO FAILURE 0 0.2 0.4 0.6 0.8 1.0 1.2 1.4
Figure A-3. S-N plot for Type 3 sti/Jeners welded to the web and flange, summary of pre- vious fatigue lest data. Figure A-4. Ratio of shear to bending stresses at the end of Type 1 stiffener-to-web weld.

BEAMS WITH FILLET WELDED FLANGE ATTACHMENTS
As far as is known, only two investigations have been car-ried out on beams with short attachments welded to the flange with longitudinal fillet welds (6, 14). Wilson tcstcd six rolled beams with 4-in.4ong plates attached to the ten-sion flange. Gurney tested beams with stiffeners that were welded to short 3-in, plates, which were in turn welded to the flange by longitudinal fillet welds as shown in Figure A-6. No other tests are available on beams with fillet-welded short flange attachments. Cover-plated beams have had cover plates of varying lengths. However, in all these tests the length was always sufficient to develop the cover plate and provide the same stress condition at the terminat-ing fillet weld toe of the cover-plate end.
There are numerous tests available on flat-plate speci-mens with short gussets attached to the surface of a plate, and a few with the gussets attached to the edge of the plate, as shown in Figure A-6 (14, 18, 19, 20, 21). These joints are classified as longitudinal nonload-carrying filet-welded joints (24). In general, the gusset plates have been at-tached to ½-in, plate specimens with longitudinal fillet welds with no weld deposited at the end of the gusset.
These studies have, in general, also confirmed that stress
55
I
I Mo Moment Gradient Constant Moment ment Gradient
Crack At stiff. type type Cosusent
1 1 Initiated at the toe of the stiffener-to-web weld. Moment gradient region.
2 2 Initiated at the toe of the stiffener-to-web weld. Constant moment region.
3 3 Initiated at the toe of the stiffener-to- flange weld. Moment gradient region.
PW - Initiated at tack weld, porosity or repair of web-to-flange fillet weld.
Note Some beams developed Type 1 cracks at the upper (compression) end of the stiffener-to-web weld. Previous investigators reported cracks along the weld toe on the four web panel boundaries in thin-web girders subjected to severe fluctuating out of plane deformations of the web.
Figure A-5. Types of fatigue cracks.
TABLE A-6
MODES OF FAILURE IN PREVIOUS STIFFENED BEAM TESTS
REFER- ENCE SERIES
SPEd- MENS TESTED (NO.)
TYPICAL MODE OF FAILURE _________________ 1 2 3 PW
THIN- WEB FAIL.
TEST DISCON- TINUED
NOT COMPA-!ABLE NOTES
6 Ha 3 - - 2 - - 1 - 1 Hb 3 3 - - - - He 3 2 - - - -
33 A 12 9 - - - - 1 2 B 8 - - 4 2 - 1 1 C 8 8——— - - - D 6 6——— - - - E 8 7——— CX I - - 1— - - - 2 Fl 1 - - - - F2 1 1 - - - - - -
14 BT 10 - - 8 - - 2 - 2 31 - 2 - - - - 2 - - 34 BM 5 - 5 - - - - -
BS 11 11 - - - - - - 32 All 20 - - - - 20 - - 35 2 4 - - 4— - - - 2
3 4 2—— 4 W 11 - 10 -
37 F 9 - 2—— 7 - - 36 All 10 - - - - 10 - - 15 C 13 6 - - 5 - 2 - 1 40 D 4 - 2 - 2 - - - 39 H 6 - 4—— - 2 - 38 A 14 - 2 - 4 2 6 -
B 14 - 3 - - 3 7 1 F 4 1—— 1 - 2 - 1
Total 195 56 28 19 15 44 27 6
See Figure A-5 for types of cracks. b Notes: I. Load-bearing stiffeners. 2. Stiffener located in a constant bending moment region

56
Figure A-6. Flange attachment details.
range is the only significant stress variable and that the type of steel is not a significant design factor (18). Most of the specimens with 3/8j, gussets welded on the plate surface had a gusset length of 6 in. in the direction of stress.
A few tests were conducted on specimens with increased thickness (19). These fell near the upper limit of disper-sion of the test data and appeared to reflect the additional time needed to propagate the crack through the plate thickness.
A few tests with the gusset welded all around produced conflicting results (10, 21). It is probable that this reflects the sample size and variability in the initial flaw condition more than any other factor.
Only a few tests were made with gussets attached to the plate edge (19). The length of the gusset was varied. These tests indicated that a decrease in the size of the attachment improved the fatigue strength.
A number of tests have also been carried out on plates with welded pads attached, as shown in Figure A-6. These specimens are similar to the fillet-welded flange attachments reported in this study.
A large number of transverse nonload-carrying welded joints have been tested in the past. Generally, gusset plates were welded transversely to the surfaces of the plate, as shown in Figure A-6. These short attachments appear to be comparable in many respects to transverse stiffener details. A detailed discussion of these studies is given in Ref. 24.
EXPERIMENT DESIGN
The objective of the beam and girder test series reported in this study was to determine their stress life relationships and to ascertain whether or not the controlled variables were significant. Inasmuch as NCHRP Report 102 showed type of detail and the stress range to be the major factors that influence the fatigue strength, these factors were accorded primary attention in this study.
The experimental variables selected for the rolled beam series (designated PRC) were nominal stress. in the outer beam fiber and size of beam. The W14 X 30 was identical to the basic unit used in the previous studies on A36 and A441 rolled steel beams. The W10 X 25 permitted higher levels of minimum stress and stress range. Coupled with the earlier work (1), the proposed experiment design permitted an evaluation of the stress variables, type of steel, and beam size. The Wi 4 X 30 A5 14 beams were furnished from one heat. The W10)( 25 beams were furnished from two heats.
The controlled variables selected for the welded beams
TABLE B-1
SPECIMEN DESIGNATION
Example: PRC 342 PR C 3 4 2
Beam Steel SrnIn S Specimen type No. Plain rolled beam of A514 steel. Third minimum stress (5mm = 14 ksi). Fourth stress range (Sr=36 ksi). Specimen No. 2
Beam type: PR = Plain rolled beam Welded beam with stiffeners:
SC= constant direction of principal stress SA= alternating direction of principal stress SG= girders SB = girders with lateral bracing
Welded beam with attachments: A8=8 in. long; A4=4 in. long; A2=2 in. long; AQ=9/32 in. long
Steel: A=A36; B=A441; C=A514
0, 1, 2, etc., indicate magnitude of Smi,..
Sr: 1, 2, 3, etc., indicate magnitude of S.

57
TABLE B-2 TABLE B-3
EXPERIMENT DESIGN FOR EXPERIMENT DESIGN FOR SC BEAMS PLAIN ROLLED BEAMS (PRC)
(a) NOMINAL STRESS AT MIDSPAN, EXTRF.MF. FIRER Sr OF
Srni, Or OF SECTION (KSI) 36 KSI 45 KSI 54 KSI
(KSI) 18 KSI 24 KSI 30 KSI 36 KSI W14x30 -22 PRC 041 PRC 061
2 PRC 241 PRC 261 -10 SCB 131 SCB 141 PRC 242 PRC 262 SCB 132 SCB 142
14 PRC 341 2 SCB 211 SCB 221 SCB 231 SCB 241 PRC 342 SCB 212 SCB 222 SCB 232 SCB 242
26 PRC 441 SCB 213 SCB 223 SCB 233 SCB 243 W10x25 -22 PRC 042 PRC 062 PRC 081 14 SCB 311 SCB 321 SCB 331
PRC 082 SCB 312 SCB 322 SCB 332 PRC 083 (b) STRESS RANGE AT CRITICAL WELD TOE TERMINATION (KSI)
2 PRC 243 PRC 263 PRC 244 PRC 264 PRC 282 Type 1 stifiener:
PRC 283 14 PRC 343 PRC 381 Bending 13.7 18.2 22.8 27.4
PRC 344 PRC 382 Shear 4.2 5.6 7.0 8.4 PRC 383 Principal 14.8 19.8 24.7 29.7
26 PRC 442 PRC 461 T 2 stiffener: Type PRC 462
Bending 16.2 21.6 26.9 32.3
Type 3 stiffener:
Bending 14.4 19.2 23.9 28.7
and girders with stiffeners were nominal stress, type of stiff- ener, type of steel, and lateral bracing support for the stiffener. Each plate thickness for each type of steel was taken from the same heat. The same fabrication pro- cedureS were used for each welded beam and girder.
The controlled variables selected for the welded attach-
TABLE B-4
EXPERIMENT DESIGN FOR SA BEAMS
(a) NOMINAL STRESS AT LOAD P1, EXTREME FIBER
o OF OmL,. (KSI) 22.2 KSI 30.1 KSI
5.5 SAB 111 SAB 112 SAB 113 SAB 114
8.7 SAB 221 SAB 222 SAB 223 SAB 224
(b) STRESS AT END OF TYPE 1 STIFFENER
NET LOAD STATE OF STRESS
P1 P2 CELL (KIP) (iup)
Ob T Op 95 (KSI) (KSI) (KSI) (DEG)
1 Mm. 5 20.2 5.2 -0.8 5.3 8.3 Range 50 -20.2 17.6 3.6 - 15.2 Max. 55 0 22.8 2.8 23.2 6.9
2 Mm. 7 35 8.2 -1.4 8.5 -9.5 Range 70 -35 23.8 5.2 - 16.2 Max. 77 0 32.0 3.8 32.5 6.7
See Figure 2.

2
14
58
TABLE B-5
EXPERIMENT DESIGN FOR SG GIRDERS
30 KS! 1/6 SBB 221 SBB 231 SBB 222 SBB 232
SGB 231 1/3 SBB 321 SBB 331 SGC 232 SBB 322 SBB332 SGB 331 SGB 332
'crmin=2kSi.
(b) STRESS RANGE AT CRITICAL WELD TOE TERMINATION (KSI)
Type 1 stiffener: ment beam serIes were nominal stress at the welded attach-
Bending 15.4 Shear 3.4
20.5 25.7
4.5 5.6 ment terminus, attachment length, and attachment weld
Principal 16:1 2 1:5 26.9 detail. All attachments were welded to the outside flange surfaces of A441 steel welded built-up beams.
Type 2 stiffener: All 14-in, welded built-up beams for this study were Bending 13.7 18.3 22.9 fabricated from A441 steel. They had a yield point of
Type 3 stiffener: 50 ksi. A441 steel was selected to permit higher maximum stress levels to be reached without difficulty. The study re-
Bending 13.8 18.4 22.9 ported in Ref. 1 had indicated that type of steel was not a significant design variable. The 38-in, welded girders were fabricated from A441 and A514 steel. Only four of the 22 girders were fabricated from A514 steel.
To evaluate the systematic effect of the stress range, minimum stress, maximum stress, and type of detail, fac- torial experiments were constructed. This permitted the effects of the controlled variables to be determined sta- tistically using analysis of variance and regression analysis techniques.
TABLE B-7
EXPERIMENT DESIGN FOR WELDED BEAMS WITH ATFACHMENTS 9/32 IN. LONG (AQB)
Smin S,. OF
(Ks!) 8 KS! 12 KS! 16 ii 20 KS! 24 KS! 28 KS!
—6 AQB 131 AQB 141 AQB 161
2 AQB 221 AQB 231 AQB 241 AQB 261
10 AQB 321 AQB 331 AQB 341
a Each beam has two identical details.
TABLE B-8
EXPERIMENT DESIGN FOR WELDED BEAMS WITH ATFACHMENTS 2 IN. LONG (A2B)
S OF V
(KsI) 8 KS! 12 KS! 16 KS! 20 KS! 24 Ks' 28 KS!
—6 A2B 131 A211 141 A2B 161
2 A2B 221 A211 231 A2B 241 A211 261
10 A2B 321 A2B 331 A2B 341
Each beam has two identical details. Stresses are at nominal edge of attachment.
TABLE B-6
EXPERIMENT DESIGN FOR SB GIRDERS
(a) NOMINAL STRESS AT MIDSPAN, EXTREME FIBER a, OF
0r OF 24 KS! 30 KS! 0rn In
(KS!) 18 KS!
SGB 211 SGC 212 SGB 311 SGB 312
SGB 221 SGC 222 SGB 321 SGB 322 SGB 323
24 KS!

59
TABLE B-9
EXPERIMENT DESIGN FOR WELDED BEAMS WITH ATTACHMENTS 4 IN. LONG (A4B)
Smi,, S OF
(Ks!) 8 KS! 12 KS! 16 KS! 20 KS! 24 KS! 28 KS!
—6 A4B 131 A4B 141 A4B 161 A411 132 A4B 142 A4B 162
2 A4B 211 A4B 221 A4B 231 A4B 241 A4B 261 A411 212 A4B 222 A4B 232 A4B 242 A4B 262
10 A4B 311 A4B 321 A4B 331 A4B 341 A413 312 A4B 322 A4B 332 A4B 342
Each beam has two different details. The attachments in the left, shear span of the beam are welded longitudinally, the attachments in the right shear span are welded all around.
TABLE B-b
EXPERIMENT DESIGN FOR WELDED BEAMS WITH ATTACHMENTS 8 IN. LONG (A8B)'
Smj, S'oF
(KS!) 8 KS! 12 KS! 16 KS! 20 KS! 24 KS! 28 KS!
—6 A8B 131 A8B 141 A8B 151
2 A8B 211 A8B 221 A8B 231 A8B 241 A8B 251
10 A811 311 A8B 321 A811 331 A8B 341
Each beam has two identical details. b At attachment.
APPENDIX C
MATERIAL PROPERTIES AND BEAM CHARACTERISTICS
Details of the beams and girders are given in Figures 1, 2, and 3, with nominal dimensions and weld details. The nominal dimensions of the welded 14-in, beams were iden-tical to the plain welded (PW) series reported in Ref. 1. Plates with nominal thicknesses of % in. were used for the flanges; the nominal web thickness was %2 in. The girder flange was ½ in. thick and the web was ¼ in. thick.
All stiffeners and flange attachments on welded beams were fabricated from %2-in. A36 steel plate. Stiffeners at-tached to the 38-in, girders were fabricated from 1/4 -in. and ½-in. A36 steel plate.
The thicknesses of flanges and webs were measured with a micrometer. Widths of flanges and depths of beams were measured using a dial gauge mounted on a fixed caliper. Average measurements were used to determine the cross-sectional properties.
Table C-i summarizes typical measured dimensions and
cross-sectional properties of typical rolled and welded beams. The cross-sectional properties were directly com-parable to the rolled and welded beams used in Phase I of the project. Table C-2 gives details of the stiffeners and welds used on the specimens described in Table C-i.
MECHANICAL PROPERTIES OF MATERIAL
Tension specimens were fabricated from sections of the beam flanges and webs. The test sections were randomly selected from two typical beams for each heat and plate thickness. All test specimens conformed to ASTM A370. The width of the specimens was 1.50 in. All tests were conducted in a I 20-kip-capacity, screw-type, mechanical testing machine. Specimen dimensions, yield load, static yield load, ultimate load, fracture load, failure dimensions,

60
TABLE C-i
TYPICAL CROSS-SECTIONAL PROPERTIES OF TEST SPECIMENS
FLANGE WEB MO- SEe- MENT TION
WIDTH THICK- THICK- OF IN- MODU- (IN.) NESS NESS DEPTH ERTIA LUS
BEAM TYPE STEEL SECTION (IN.) (IN.) (IN.) (IN.') (IN.')
Plainrolled A514 W10x25 5.74 0.429 0.255 10.08 132 26.2 (PRC) A514 W14x30 6.79 0.408 0.281 13.86 304 43.9
Welded beams: Withstiffeners A441 W14x30 6.73 0.384 0.290 13.81 287 41.6
(SA) With attach- A441 W14x30 6.76 0.381 0.289 13.81 286 41.3
ments (AQ, A2, A4, A8)
Weldedgirders A441 W38x50 7.73 0.486 0.259 38.0 3737 196.7 withstiffeners A514 W38x50 7.72 0.524 0.262 38.0 3958 208.3 (SG, SB)
TABLE C-2
STIFFENER AND WELD DETAILS FOR SPECIMENS IN TABLE C-i
STIFFENER STIFFENER-WEB WELD
THICK- NESS WIDTH ARRANGE- ELEC- WELDED CUT-OFF 0 SIZE
SERIES (IN.) (IN.) MENT STEEL TRODE TO b (IN.) (IN.)
SC %2 2% Single A36 E7028 TWC, W ½. % %6 SS %2 2% Single A36 E7028 TWC, W ½ SA %2 2% Single A36 E7028 W ½ SG 1/4 3Y2 Single A36 E7028 TWC, W ½, 2 A6 SB 1/4 3½ Single A36 E7028 TWC, W ½ 2 3116
Automatic submerged arc. b T = tension flange; W = web; C = compression flange.
Distance between end of stiffener-to-web weld and inside flange face
and location of break were recorded. Several complete Stress-strain curves were also determined.
Testing speed was 0.025 in./min until the yield point was established. The speed was increased to 0.100 in./min and maintained at that rate up to rupture after strain hardening was observed. The initial gauge length of 8 in. was used to determine elongation characteristics.
Tables C-3 and C-4 summarize the averages and standard deviations for the static yield stress and tensile strength of the various steel plates and shapes. Average values of elongation and reduction in area are also given.
MILL REPORTS OF CHEMICAL AND PHYSICAL PROPERTIES
The results of mill tests on specimens from plates and rolled beams are given in Table C-5. For a given beam flange and web the heat number, mechanical properties, and chemical analysis are given. The mechanical properties include dy-namic yield point (usually provided at 0.100 in./min), tensile strength, and elongation.

61
TABLE C-3
TENSILE PROPERTIES OF PLAIN ROLLED BEAMS (PRC)
MEAN
THICK- STEEL STATIC YIELD TENSILE STRENGTH REDUC.
NO. OF STRESS (KSI) (KSI) MEAN IN NESS TYPE HEAT TENSION _______________ ELONG. AREA
COMPONENT (IN.) NO. SPEC. MEAN ST. DEV. MEAN ST. DEV. (%) (%) W10x25 web A514 66E448 4 110.8 2.6 119.0 3.1 8 48 W10x25 flange 7A6 A514 66E448 4 117.8 1.3 127.2 1.4 11 44 W10x25 web A514 69E253 4 105.0 3.8 113.7 3.6 9 51 W10x25 flange 46 A514 69E253 4 110.6 2.1 120.3 2.0 12 48 Wl4x3Oweb A514 67D685 4 117.1 2.3 127.4 2.4 10 46 Wl4x30flange % A514 67D685 4 119.8 0.9 129.5 1.3 11 43
TABLE C-4
TENSILE PROPERTIES OF BEAM AND GIRDER PLATES
MEAN STEEL NO. OF UPPER YIELD STATIC YIELD TENSILE STRENGTH REDUC.
THICK- TEN- POINT (KSI) STRESS (KSI) (KSI) MEAN IN NESS HEAT SION _ ELONG. AREA
COMPONENT (IN.) TYPE NO. SPEC. MEAN ST. DEV. MEAN ST. DEV. MEAN ST. DEV. (%) (%) Beam web %2 A441 477B0421 3 55.8 1.3 52.3 1.1 72.8 1.3 24 51 Beam flange % A441 655B155 3 55.4 1.4 52.0 0.6 74.4 0.7 24 55 Girder web 4 A441 485B1022 3 59.5 5.0 56.5 2.5 78.2 0.8 24 53 Girder flange Y2 A441 65413163 3 44.2 2.0 40.7 2.0 64.9 1.2 28 57 Girder web 1/4 A514 485B1022 3 121.4 0.7 115.3 1.6 121.3 0.8 10 55 Girder flange Y2 A514 802132530 3 120.0 0.8 113.9 0.6 121.7 0.8 13 49
TABLE C-S
MILL TEST REPORT OF BEAM AND GIRDER PLATES
PLATE STEEL THICK- YIELD TENSILE CHEMICAL ANALYSIS (%) NESS HEAT POINT STRENGTH ELONG.
COMPONENT NO. (IN.) TYPE NO. (KSI) (KSI) (%) C MN P S SI CU VA MO B
Beam web 92 %2 A441 485B1022 62.8 81.4 26 .18 1.06 .008 .022 .21 .24 .056 - - 12 %2 A441 477B0421 56.6 78.9 24 ' .19 1.05 .008 .023 .04 .24 .052 - -
6 %2 A441 479A1501 57.4 78.8 26 .19 1.08 .008 .029 .02 .24 .062 - - 3 %2 A441 432A0891 54.7 76.4 26 .20 1.05 .017 .023 .04 .21 .055 - -
Beam flange 226 % A441 655B155 56.2 77.6 28 a .17 1.05 .017 .023 .17 .29 .040 - - Gitdci web 15 4 A441 48Bf(J22 62.9 81.6 23 ' .18 1.06 .008 .022 .21 .24 .056 -
3 1% A441 485B1272 64.3 77.2 18 .15 1.07 .012 .022 .21 .25 .034 - Girder flange 36 1/ A441 654B163 50.1 71.0 26 a .18 .98 .021 .026 .01 .33 .030 - - Girder web 2 1/4 A514 802B02530 118.5 122.0 24b .13 .70 .009 .017 .25 - - .55 .0034
1 Y4 A514 802A10090 126.8 130.8 20 b .19 .64 .015 .020 .30 - - .56 .0040 1 Y4 A514 518B1097 121.3 126.3 23 b .19 .56 .016 .020 .27 - - .61 .0050
Girder flange 8 Jh A514 802112530 121.8 125.4 24b .13 .70 .009 .017 .25 - - .55 .0034 Stiffener %2 A36 411B2252 45.0 71.3 25 a .19 .92 .020 .023 .05 - - - -
Y4 A36 411B2252 47.2 73.0 23 a .19 .92 .020 .023 .05 - - - A36 411B2252 44.4 68.6 26' .19 .92 .020 .023 .05 - - - -
a 84n, gauge length. b 2-in, gauge length.

62
APPENDIX D
A514 STEEL ROLLED BEAMS
Details of the tests on A36 and A441 steel rolled beams and a summary of earlier work on rolled beams are given in NCHRP Report 102 (1).
The controlled variables selected for the supplementary work on A514 steel beams were influenced by the arlier work. To provide direct correlation with the A36 and A441 steel beam tests 9 W14 >< 30 beams were tested. Minimum stress and stress range provided the controlled test variables. The factorial design is given in Table B-2. The four speci-mens at Smiii = 2 and 14 ksi and Sr = 36 ksi permitted direct correlation with the earlier work.
Because it was desirable to extend the stress range cov-erage to higher stresses that were compatible with the static working load stresses, it was necessary to use a second pro-file in order to achieve the higher stress levels. A W10 X 25 section was used for this purpose. The minimum stress level was extended to —22 ksi and 26 to better simulate possible working load conditions. The stress range level was extended to 45 ksi and 54 ksi.
Al W14 X 30 rolled beams were furnished from the same heat. The beams were cut to 10-ft 6-in, lengths in Fritz Laboratory from 40-ft-long members. The W10 X 24 beams were furnished from two heats and were cut to 8-ft lengths in Fritz Laboratory. The properties of these mem-bers are summarized in Tables C-i through C-5.
TEST RESULTS
Table D-i summarizes the test data from the beam tests. A schematic of the crack size is given in Figure D-i. The crack location in Col. 4 defines the point along the beam length at which the failure crack occurred.
Col. 7 of Table D-1 describes the initial flaw condition that precipitated crack growth and failure. When defined
p p
12 j, ,_ToP Load Plate
L '2Tenon Flange
ELEVATION Bottom Load Plate
Crack Size
I V/Ø'//A ...Iin Web
Crack Size in Flange4 CROSS 'SECTION
Figure D-1. Loading set-up and crack measurement nomenclature.
as arbitrary, the crack generally initiated from the flange surface, as shown in Figure 7. The fracture surface pro-vided this indication. A second major cause was an arbi-trary flange-tip flaw. These arbitrary flaws were all in the micro-flaw range.
Sometimes the loading arrangement caused a stress-raising and fretting effect, and resulted in crack growth. In most of these cases crack growth originated under the loading jacks, at bracing or a stiffener. In general these conditions were directly comparable to the data generated from the other crack growth conditions.
Many of the specimens were tested without using stiffen-ers in order to minimize these uncontrolled secondary fac-tors. No doubt this contributed to the wide variation in the test data, which reflected the sensitivity of the beams to variation in the initial micro-flaw condition.
ANALYSIS
An analysis of variance of the data for A36, A441, and A514 steel beams at the common minimum stress level of 2 ksi and 3 5-ksi stress range indicated a significant differ-ence in the life. This was expected, because three A514 steel beams did not fail after 101 cycles.
aj_ = 54 45 36ks1
0 W14x30
W10x29
106 5
CYCLES TO FAILURE
Figure D-2. Cumulative frequency distribution for plain rolled A514 beams.
95
90
80
an 70 -J
60 U.
50 z UJ 40
30

63
The test data summarized in Figure 11 were evaluated by visual inspection and regression analysis. The A36 and A514 steel beams that did not exhibit any cracking were excluded from the analysis. The earlier studies had indi-cated no significant improvement in the correlation of the
test data when minimum stress was included in the analysis. Inspection of the data in Figures 9, 10, and 11 shows that
the type of steel did not significantly affect the results ex-cept near the run-out level. The A514 steel beams appeared to have a higher threshold of crack growth than the A3 6
TABLE D-1
SUMMARY OF DATA FOR ROLLED A514 STEEL BEAMS, INITIAL TEST'
CRACK SIZE DESCRIPTION OF CRACK CYCLES TO (IN) CRACK LOCATION
BEAM Sr Smia LOCA FAILURE d _____________ AND CRACK
NO. (KsI) (KsI) TION (x 10) FLANGE WEB INITIATION
W14X30
PRC-041 36.0 -22.0 57.0 C 3,113 6.75 (2) 8.50 Arbitrary PRC-061 45.0 -22.0 53.0 T 759 4.87 (1) 2.00 Arbitrary, from flange
tip PRC-241 34.3 1.9 No crack 10,000 No crack Runout PRC-242 34.3 1.9 No crack 10,000 No crack Runout PRC-261 45.7 1.9 53.0 T 702 3.91 (1) 0.57 Arbitrary, from flange
tip PRC-262 45.0 2.0 60.0 T 338 3.82 (1) 0.30 At flaw in flange tip PRC-342 34.3 13.3 No crack 10,000 No crack Runout PRC-441 34.3 24.8 71.5 T 5,194 3.25 0.20 Under stiffener
W10x25
PRC-042 36.0 -22.0 40.25 C 1,983 2.63 (1) 0.75 Near top load, from extreme fiber
PRC-062 45.0 -22.0 41.0 C 1,789 5.75 (2) 6.50 At bracing PRC-081 54.0 -22.0 36.5 C 247 3.85 (1) 1.00 Under top jack, from
extreme fiber PRC-082 54.0 -22.0 36.0 T 1,164 3.85 (1) 1.25 Under top jack, from
flange tip PRC-083 54.0 -22.0 35.75 C 1,067 3.95 (1) 0.38 Under top jack, from
notch in flange tip PRC-.243 36.0 2.0 No crack 10,000 No crack Runout PRC-.244 36.0 2.0 27.0 T 3,090 3.37 (1) 0.79 At bracing PRC-263 45.0 2.0 37.75 T 2,284 3.75 (1) 1.00 At edge of stiffener,
from extreme fiber PRC-264 45.0 2.0 54.0 T 1,242 3.54 (1) 0.93 Under stiffener, from
flange tip PRC-281 54.0 2.0 35.0 T 440 2.25 (1) 0.0 Under stiffener, from
extreme fiber PRC-282 54.0 2.0 26.5 T 238 5.75 (2) 3.80 At bracing, from
flange tip PRC-283 54.0 2.0 64.0 T 645 3.20 (1) 0.34 At bracing PRC-343 36.0 14.0 39.0 T 2,396 2.93 0.30 Near load, from ex-
treme fiber PRU-344 36.0 14.0 No crack 10,000 No crack Runout PRC-381 54.0 14.0 38.63 T 211 2.87 (1) 0.0 Arbitrary, from notch
in flange tip PRC-382 51.4 13.3 52.5 T 615 2.69 0.38 Near load, from ex-
treme fiber PRC-383 54.0 14.0 54.5 T 1,196 2.70 0.95 At load, flange-to-web
transition PRC-442 20.5 26.0 20.5 T 2,846 4.25 (1) 1.50 In shear span PRC-.461 45.0 26.0 51.0 T 558 2.20 (1) 0.0 Arbitrary, from flange
tip PRC-462 42.8 24.8 49.0 T 2,717 2.47 (1) 0.0 Arbitrary, from flange
tip
For explanatory sketches see Figure 0-1. "See Tables B-i and B-2.
- In inches from support. Loads applied at x = 39 in. and 81 in. T = tension flange; C = compression flange.
1 Usually for a deflection increase of 0.020 in. (see "Experimental Procedures," Chapter One). See Figure 0-1. For crack in flange, (1) = crack out to one edge, (2) = crack across width of flange. With respect to load plates or wooden stiffeners. From observation of fracture surface of crack.

64
and A441 steel beams. This finding is consistent with the fracture mechanics of crack growth (10).
The results of the regression analysis are summarized in Figure 11. The coefficient of correlation was 0.76. The smallest standard error of estimate was obtained when the logarithmic transformations of both cycle life and stress range were used.
Figure D-2 shows the cumulative frequency distribution of the test data on probability paper for the A514 steel
beams. The results are compatible with the A36 and A441 steel beams reported in Ref. 1.
The fatigue limit of rolled beams is sensitive to variation in the micro-flaw condition on the flange surface or tip. Assuming that the same conditions existed in all three grades of steel confirms that the A5 14 steel beams should have a higher threshold or run-out level. However, a severe mechanical notch can adversely affect this threshold level, as was shown by specimen PRC-442, where a severe edge notch in the shear span resulted in early failure.
APPENDIX E
FATIGUE STRENGTH OF BEAMS AND GIRDERS WITH STIFFENERS
A detailed review of previous work on stiffener details is given in Appendix A. These earlier studies indicated that fatigue crack growth initiated at the terminating weld toe of the stiffener-to-web fillet welds of stiffeners welded to the web alone. In general, the fatigue crack formed perpen-dicular to the principal stress when the detail was situated in a region of moment gradient.
In order to achieve a high shear-to-bending stress ratio in the web and a high principal stress at the terminating fillet weld toe, special test beams were devised with thick flanges in previous studies. This limited the bending stress and prevented failure from the flange-to-web connection. In addition, many of the stiffener details were terminated some inches above the tension flange. With the profiles used, the shear stress distribution in the web was much more severe than is normally encountered. The average shear stress (V/Au) was nearly equal to the maximum shear stress given by VQ/It. These conditions do not represent the situation that exists in fabricated bridges.
In this study the stiffener details were attached to beams and girders with cross-sections more comparable to fabri-cated structural applications. The placement of the stiff-eners was developed from pilot tests. Details of the ex-periment design are given in Tables B-3 to B-7. The SC beams were used to establish the critical location of the stiffener to ensure failure at the stiffener detail prior to experiencing a failure from the flange-to-web fillet welds.
The basic stresses in the welded beam were directly com-parable to the experiment design used for plain welded beams and reported in NCHRP Report 102 (1). These are shown in Table B-3. Also given are the stress range conditions at the terminating weld toe of each stiffener detail.
The stress variables for the SA series beams with alter-nating direction of principal stress are given in Table B-4. It was not possible to correlate the experiment design with
the other beam series, because the loading system would not permit the minimum stress to be controlled independently.
The girder series SG and SB had the same nominal bend-ing stresses as the sc series beams. However, the stresses at the critical weld toe terminations of all three details on girders differed slightly from those of the SC series beams. The Type 1 stiffeners were deliberately made more critical to ensure failure and valid test data. The stress conditions at the Type 2 and Type 3 stiffeners were about the same, so that either detail could develop fatigue cracks. When the test series were planned it was questionable that the girders could be repaired and testing continued. Hence, if only one failure was possible the Type 1 stiffeners would provide the major source of test data. This problem was overcome with the C-clamp splices. Generally, all three details, as well as the plain welded girder, experienced fatigue crack growth.
Locating the SC beam stiffeners 9 in. from the loading points, as shown in Figure E-1, produced a stress condition for crack growth at the stiffeners that was less severe than the crack growth condition from mechanical defects in the web-to-flange fillet weld. The desired type of failure was only achieved by moving the stiffeners closer to the loading points, as shown in Figure 1 a, raising the nominal stresses at the stiffener end.
To ascertain whether or not the local load effect would alter the stress distribution predicted by beam theory, a plane stress finite element analysis (17) of the test speci-mens was carried out and the results were compared with conventional beam theory.
Figure E-2 shows the finite element mesh selected for the stress analysis of the girder specimens. Each flange was modeled by 32 bar elements placed along the center of gravity of the trapezoidal stress distribution through the flange thickness. The web of the girder was subdivided into 576 rectangular elements. Bar elements were also provided

65
from the load point down to the center line of the girder to simulate the load-bearing stiffeners shown in Figure lb. The load was applied at three adjacent nodal points, pro-portional to the bearing area of the jack ram on the web and the bearing stiffeners. The total magnitude (P) was equal to the load required to produce a maximum bending stress of 100 units at midspan according to beam theory.
The beam specimen was modeled with a similar mesh, except that it did not have the bar elements simulating the bearing stiffeners (because none were used).
Figure E-3 shows the principal stress (a-n) and shear (r)
stress distribution along two lines parallel to the beam center line at distances of ¼ in. and 3/4 in. from the inside face of either flange. The web stiffener terminated ½ in. from the flange. The position of the Type 1 stiffener is shown by the vertical dashed line that lies just outside the local zone affected by the load introduction. Conventional beam theory and the finite element method yielded identical principal stresses at the lower end of the Type 1 stiffener. At the upper end of the stiffener, where crack growth was also observed, the principal stresses computed by the finite element method were 3 percent greater. The directions of principal stresses at the stiffener end differed by less than 1' between the beam theory and the finite element analysis.
A similar comparison was carried out for the girder specimen. The principal and shear stress distribution along two lines parallel to the girder center line ½ and /s in. from the inside face of the tension flange are shown in Fig. E-4. The difference in the results can be attributed mainly to the low span-to-depth ratio of 6:1. Beam theory does not give an accurate stress distribution for this geo-metric condition. The actual test was conducted with loads that produced the desired extreme fiber strain readings at midspan. This procedure corresponds to matching the mid-span stress levels of the two sets of curves in Figure E-4. After this adjustment was made, the principal stress in the girder web at the lower end of the Type 1 stiffener as corn-
Preliminary Design (3 Specimens)
Spec. No. Crack
0 0 h JB A I 0/9
-" 3-3" - 3-6"
Additional Pilot Tests (2 Specimens)
!0. 1 "IMP
2 3/4 x%21E.
/I6 3/1
'2" for Stiff. IT qL .j1[
Varies for Stiff. 2
Stiffener 1,2 Stiffener 3
Figure E-1. Details of pilot test beams.
puted by the finite element method was less than 3 percent smaller than the value predicted by beam theory.
The stress analysis indicated that the load had a negligi-ble effect on the stress distribution in the beam and girder specimens at the stiffeners, which were 5 to 8 in. from the
0.85 P
Flanges and Load—Bearing Stiffener: Bar Elements
Web: Rectangular Elements
Figure E-2. Finite element mesh for stress analysis of 38-in, girders.

20
- Beam Theory
jFinite Element tAnalysis
3/4 •
/4"
66
0 I 2 3 4 5
X(ft)
Figure E-3. Stress in beam web by beam theory .and a finite element analysis.
loading points. The testing procedure automatically com-pensated for any error due to the low span-to-depth ratio of the girders. For these reasons, the stresses predicted by beam theory were retained for the regression analysis of the fatigue test data.
RESULTS AND ANALYSIS
Results of the tests for each type of stiffener detail are summarized in Tables E-1, E-2, and E-3. The stress con-ditions in the extreme beam fiber in the constant moment region and at the stiffener weld toe termination are given, together with the cycles to failure for each detail. For the Type 1 stiffeners the observed direction of crack propaga-tion is also given. Also given are the crack sizes at test termination in the flange and web of the member at the test detail.
Results of the pilot tests shown in Figure E-1 are sum-marized in Table E-4. Only beams D and E exhibited crack growth at the stiffener details. The principal stress range at the Type 1 and Type 3 stiffeners was 80 percent of the bending stress range at midspan. Because the Type 1 stiff-ener was on the borderline, it was moved to 5 in. from the load point to increase the failure probability.
Several girders and beams failed at defects in the flange-to-web fillet welds. These plain welded beam failures are summarized in Table E-5. The test data are documented in the same manner as reported in NCHRP Report 102 (1).
Analysis of Data Results
The statistical analysis of the effects of the controlled variables was carried out using analysis of variance and regression analysis techniques.
The analysis of variance of two-way classified experi-ments permits the determination of whether certain chosen values of each of the two variables affect the fatigue life of the detail. The replication within a cell makes it possible to estimate the interaction between the variables. For rea-sons of economy, time, and equipment limitations some of the cells were not tested and the number of replicates was not equal for all cells. In addition, complete data could not
00—
'::
Analysis LL /0'
60- Uj Cr
40
7v 20
0 2 4 6 8 10
X (ft
Figure E-4. Stress in girder web by beam theory and a finite element analysis.

67
TABLE E-1
SUMMARY OF FATIGUE TEST DATA FOR TYPE 1 STIFFEN ERS
EXTREME FIBER STRESS RANGE AT BENDING STRESS END OF STIFFENER DIRECTION CRACK SIZE AT MIDSPAN (K51) (i) CYCLES TO OF (IN.)
FAILURE, N CRACK, SPECIMEN MIN. RANGE BEND. SNEAR PRINC. (x 10) (DEG) an a,., NOTES
(a) SC Beams
SCB 211 2 18 13.7 4.2 14.8 2893 74 3.7 4.1 SCB 212 2 18 13.7 4.2 14.8 9743 - - - SCB 213 2 18 13.7 4.2 14.8 7037 - - - 3 SCB 311 14 18 13.7 4.2 14.8 13080 - - - 2 SCB 312 14 18 13.7 4.2 14.8 3197 73 3.5 3.2 SCB 221 2 24 18.2 5.6 19.8 2907 Toe 3.0 3.6 SCB 222 2 24 18.2 5.6 19.8 3165 -51 3.4 3.5 1,4 SCB 223 2 24 18.2 5.6 19.8 2320 - - - 1 SCB 321 14 24 18.2 5.6 19.8 1828 - - - 1 SCB 322 14 24 18.2 5.6 19.8 1481 Toe 0.0 3.0 SCB 131 -10 30 22.8 7.0 24.7 1119 -62 6.4 4.0 4 SCB 132 -10 30 22.8 7.0 24.7 1210 -50 4.4 3.5 4 SCB 231 2 30 22.8 7.0 24.7 774 71 4.0 3.4 SCB 232 2 30 22.8 7.0 24.7 860 73 5.9 2.6 SCB 233 2 30 22.8 7.0 24.7 1030 - - - 2 SCB 331 14 30 22.8 7.0 24.7 1150 Toe 0.0 2.8 1 SCB 332 14 30 22.8 7.0 24.7 819 Toe 2.0 3.5 SCB 141 -10 36 27.4 8.4 29.7 867 -55 3.3 2.3 4 SCB 142 -10 36 27.4 8.4 29.7 574 Toe 3.8 4.7 SCB 241 2 36 27.4 8.4 29.7 521 Toe 4.0 4.0 6 SCB 242 2 36 27.4 8.4 29.7 676 Toe 4.3 4.0 SCB 243 2 36 27.4 8.4 29.7 669 -63 0.0 1.2 3,4
(b) SA Beams with Alternating Shear
SAB 111 5.5 22.2 17.6 3.6 4770 Toe 6.6 5.1 SAB 112 5.5 22.2 17.6 3.6 3190 Toe 4.6 3.4 SAB 113 5.5 22.2 17.6 3.6 3425 Toe 0.0 0.9 1 SAB 114 5.5 22.2 17.6 3.6 6227 Toe 1.2 4.1 6 SAB 221 8.7 30.1 23.8 5.2 883 Toe 1.3 4.4 5 SAB 222 8.7 30.1 23.8 5.2 1017 Toe 0.9 3.6 1 SAB 223 8.7 30.1 23.8 5.2 1161 Toe 1.8 4.0 SAB 224 8.7 30.1 23.8 5.2 1064 Toe 2.4 2.8
(c) SG girders
SGB 211 2 18 15.4 3.4 16.1 4433 81 4.0 7.8 SGC 212 2 18 15.4 3.4 16.1 3016 Toe 6.1 2.8 SGB 311 14 18 15.4 3.4 16.1 4869 - 0.0 0.7 SGB 312 14 18 15.4 3.4 16.1 2293 Toe 4.9 7.0 SOB 221 2 24 20.5 4.5 21.5 1939 Toe 5.5 8.0 SGC 222 2 24 20.5 4.5 21.5 838 Toe 0.0 9.7 5 SGB 321 14 24 20.5 4.5 21.5 769 Toe 2.2 7.4 6 SGB 322 14 24 20.5 4.5 21.5 1210 Toe 2.3 7.9 SGB 323 14 24 20.5 4.5 21.5 774 Toe 2.8 9.7 6 SGB 231 2 30 25.7 5 6 26.9 643 Toe 2.7 9.2 SGC 232 2 30 25.7 5.6 26.9 452 Toe 2.6 10.7 5 SGB 331 14 30 25.7 5.6 26.9 413 Toe 2.1 6.0 SGB 332 14 30 25.7 5.6 26.9 500 Toe 3.0 4.8 SGC 333 14 30 25.7 5.6 26.9 401 Toe 5.4 11.4 5
(d) SB Girders with Transverse Bracing
SBB 221 2 24 20.5 4.5 21.5 1264 Toe 5.2 7.9 6 SBB 222 2 24 20.5 4.5 21.5 1409 Toe 1.8 9.0 5 SBB 321 2 24 20.5 4.5 21.5 1388 Toe 6.8 9.0 6 SBB 322 2 24 20.5 4.5 21.5 1401 Toe 3.4 8.5 6 SBB 231 2 30 25.7 5.6 26.9 1037 Toe 0.0 8.9 5 SBB 232 2 30 25.7 5.6 26.9 561 .. Toe 6.0 8.5 6 SBB 331 2 30 25.7 5.6 26.9 577 Toe 4.2 7.7 6 SBB 332 2 30 25.7 5.6 26.9 555 Toe 4.2 7.7 5
Plane perpendicular to direction of principal stress: 74° for Series SC, 78° for Series SG and SB. 1, For crack sizes see Figure 15.
Notes: 1. Plain welded beam failure. 2. Test discontinued 3. Failure at Type 2 stiffener. 4. Crack at Type 1 stiffener in compression (top) region of web. 5. Crack at weld toes on both sides of Type 1 stiffener. 6. Crack at Type I stiffener-to-web weld toe closer to the support.
Crack growth along weld toe before branching off diagonally into web.

68
be gathered whenever tests had to be discontinued because carried out. There are several ways of dealing with such of failure elsewhere or by extreme cycle life, data. The iterative method used is described by Pearce (51).
Despite the unequal number of observations, an analysis It consists of filling the gaps with estimated values so that of variance over the entire experiment design can still be the number of observations in each cell is equal. From
TABLE E-2
SUMMARY OF FATIGUE TEST DATA FOR TYPE 2 STIFFENERS
SPECIMEN
BENDING STRESS (KsI)
EXTREME FIBER AT AT END OF MIDSPAN STIFFENER
MIN. RANGE RANGE
CYCLES TO FAILURE,
(x 10)
CRACK SIZE b
asi as.,
(IN.)
e NOTES
(a) SG Girders
SGB 211 2 18 13.7 4433 - - - 1 4433 - - - 1
SGC 212 2 18 13.7 1790 - 7.0 3.2 2 1790 - 10.7 2.8 2
SGB 311 14 18 13.7 3230 - - - 1 5229 - - - 1
SGB 312 14 18 13.7 2204 2.2 13.0 - 3 2012 - 3.5 3.1 2
SGB 221 2 24 18.3 1408 - - - 1 1165 - 5.2 3.0 2
SGC 222 2 24 18.3 838 - 7.5 3.2 2 838 - 11.2 2.4 2
SGB 321 14 24 18.3 1316 - - - 1 1063 - 4.5 2.7 2
SGB 322 14 24 18.3 1452 - - - 1 1553 - - - 1
SGB 323 14 24 18.3 1261 - - - 1 1131 - - - 1
SGB 231 2 30 22.9 520 - - - 1 552 - - - 1
SGC 232 2 30 22.9 452 - 12.5 1.6 2 452 - 6.7 3.0 2
SGB 331 14 30 22.9 786 - 3.4 3.1 2 746 - - 1
SGB 332 14 30 22.9 539 - - - 1 481 - 7.1 0.3 2
SGC 333 14 30 22.9 537 - 14.0 - 2 537 4.4 16.0 - 3
(b) SB Girders with Transverse Bracing
SBB 221 2 24 18.3 1264 - 7.8 2.2 2 1197 - - - 1
SBB 222 2 24 18.3 1061 - - - 1 1234 - 3.2 3.6 2
SBB 321 2 24 18.3 1388 - 4.0 3.7 2 1388 - 2.6 4.7 2
SBB 322 2 24 18.3 1329 2.0 14.8 - 3 1401 - 9.6 1.8 2
SBB 231 2 30 22.9 718 2.3 14.4 - 3 718 - - - 1
SBB 232 2 30 22.9 533 2.1 14.1 - 3 533 - 12.2 0.4 2
SBB 331 2 30 22.9 684 - 4.5 2.8 2 684 - 9.2 1.5 2
SBB 332 2 30 22.9 499 2.0 14.2 - 3 725 - 3.9 2.9 2
Either failure at Type 2 stiffener or number of cycles applied until repair of a plain welded girder failure at less than 12 in. from Type 2 stiffener.
b For size of two-ended and three-ended cracks see Figure 18. Notes: 1. Part-through crack. 2. Two-ended crack. 3. Three-ended crack.

69
these initial guesses new estimates are obtained, and the iterative process is continued until the residuals of the miss-ing values are reduced to zero. Thus, they do not con-
tribute to the residual error. The analysis of variance of the two-way classified data, with equal numbers of observations per cell, can then proceed normally apart from subtracting
TABLE E-3
SUMMARY OF FATIGUE TEST DATA FOR TYPE 3 STIFFENERS
BENDING STRESS (KsI)
AT STIF- EXTREME FENER-TO- FIBER AT FLANGE CYCLES TO
MIDSPAN WELD FAILURE, L&K SIZE a (IN.)
SPECIMEN MIN. RANGE RANGE (x 10) a a, i a NOTES
(a) SC Beams
SCB 211 2 18 14.4 2616 - 5.0 3.3 SCB 212 2 18 14.4 3787 - 2.0 0.0 SCB 213 2 18 14.4 4512 - 5.5 5.0 SCB 311 14 18 14.4 4741 - 4.5 1.2 5 SCB 312 14 18 14.4 3197 - 3.4 0.0 SCB 221 2 24 19.2 1691 - 5.2 2.2 SCB 222 2 24 19.2 1329 - 5.0 2.2 SCB 223 2 24 19.2 807 - 3.5 0.2 SCB 321 14 24 19.2 1438 - 4.0 0.5 SCB 322 14 24 19.2 1092 - 3.8 0.9 SCB 131 -10 30 23.9 584 - 5.5 3.4 SCB 132 -10 30 23.9 579 - 5.6 3.0 SCB 231 2 30 23.9 492 - 4.2 1.0 SCB 232 2 30 23.9 527 - 53 2.5 SCB 233 2 30 23.9 421 - 4.8 1.5 SCB 331 14 30 23.9 322 - 3.6 0.3 SCB 332 14 30 23.9 428 - 3.8 0.3 SCB 141 -10 36 28.7 355 - 4.8 1.5 SCB 142 -10 36 28.7 302 - 5.2 2.8 SCB 241 2 36 28.7 214 - 3.7 1.0 SCB 242 2 36 28.7 361 - 3.8 0.2 SCB 243 2 36 28.7 495 - 4.5 1.3
(b) SG Girders
SGB 211 2 18 13.8 6617 - - - 4 SGC 212 2 18 13.8 3854 - - - 4 SGB 311 14 18 13.8 6060 - - - 4 SGB 312 14 18 13.8 2012 - 4.6 0.7 SGB 221 2 24 18.4 1742 - 7.1 7.0 3,5 SGC 222 2 24 18.4 1366 - 6.1 11.7 3,5 SGB 321 14 24 18.4 1316 0.29 2.1 - 1 SGB 322 14 24 18.4 1553 0.25 1.8 - 1,2 SGB 323 14 24 18.4 1261 5.8 3.3 SGB 231 2 30 22.9 676 0.16 1.8 - 1 SGC 232 2 30 22.9 737 - 5.1 4.9 2 SGB 331 14 30 22.9 786 0.38 2.3 - 1 SGB 332 14 30 22.9 700 - 3.2 0.0 SGC 333 14 30 22.9 627 0.30 2.4 - 1
(c) SB Girders with Transverse Bracing
SBB 221 2 24 18.4 1264 - 2.7 0.0 SBB 222 2 24 18.4 1641 0.14 0.38 - 1 SBB 321 2 24 18.4 1206 - 3.5 0.0 SBB 322 2 24 18.4 1329 - 2.2 0.0 SBB 231 2 30 22.9 1037 0.14 0.39 1.6 1 SBB 232 2 30 22.9 561 - 5.8 10.6 3,5 SBB 331 2 30 22.9 804 - 3.9 0.3 SBB 332 2 30 22.9 950 0.13 0.56 - 1
See Figure 20. b Notes: 1. Part-through cracks in flange. 2. Crack growth at weld toes in flange and web. 3. Crack lead-
ing to failure at Type 3 stiffener initiated at weld toe in web. 4. No visible cracking. 5. Crack at stiffener. to-flange weld toe closer to the support.
S.

70
the number of missing values from the degrees of freedom in the total and residual error lines. Iteration on all esti-mated values was terminated after the logarithms of the fictitious fatigue lives differed by less than 0.000005 be-tween two consecutive iteration steps.
The mean sum of squares of the residual error was used
TABLE E-4
SUMMARY OF DATA FOR PILOT TESTS
EXTREME FIBER BENDING STRESS FIRST SECOND AT MIDSPAN FAILURE FAILURE
SPEC- (KSI) LIFE LIFE IMEN MIN. RANGE TYPE (x108) TYPE (x103)
A 2 24 PW 1702 - - B 14 24 PW 1597 - - C 2 30 PW 1114 - - D 2 36 3 181 2 445 E 14 18 PW 2532 1 5724
to form the F-ratios for the variables and their interaction, which were then compared with the tabulated F-ratios for a level of significance of e = 0.05.
The regression analysis model used to relate the number of cycles to failure to the stress range at the crack initiation point had the form:
logN=B1 +B2 logo- (E-1)
The coefficients B1 and B2 were obtained through a least-squares fit. As a measure of the goodness of the fit, the squares of the regression coefficient and of the standard deviation were computed. The first measure indicates the fraction of the fatigue life variance accounted for by the regression; the second is an estimate of that part of the variance left unexplained by the regression of the fatigue life on the stress range.
In all stress range versus life (S-N) plots the data points are shown, together with the mean regression line and the confidence limits at two standard deviations from the mean. The results of the analysis of variance are summarized in Tables E-6, E-7, and E-8 for the three stiffener details.
TABLE E-5
SUMMARY OF FATIGUE TEST DATA FOR PLAIN WELDED GIRDERS
BENDING STRESS (KSI)
INNER EXTREME FIBER OF FIBER AT FLANGE AT CYCLES TO CRACK SIZE b
MIDSPAN CRACK FAILURE, CRACK (IN.) SPEC- ___________ N LOCATION
IMEN MIN. RANGE RANGE (x 10) (FT-IN.) an as., NOTES
(a) SO Girders
SGB 211 2 18 17.5 4433 11-10 7.0 3.7 SGC 212 2 18 17.5 2194 7-0 - - 4 SGB 311 14 18 17.5 3230 8-4 4.7 2.4 SGB 312 14 18 17.5 2012 11-2 1.7 1.3 SGB 221 2 24 23.4 1046 10-0 6.7 3.5 SGC 222 2 24 23.4 838 - - - 2 SGB 321 14 24 23.4 1063 10-7 1.6 0.9 SGB 322 14 24 23.4 1052 12-0 2.8 1.8 SGB 323 14 24 23.4 1131 11-2 4.0 2.0 SGB 231 2 30 29.2 520 8-2 5.7 2.2 SGC 232 2 30 29.2 452 - - - 2 SGB 331 14 30 29.2 746 11-0 - - 4 SGB 332 14 30 29.2 539 12-0 1.6 0.9 SGC 333 14 30 29.2 627 9-0 5.5 -
(b) Girders with Transverse Bracing
SBB 221 2 24 23.4 1197 10-11 7.0 4.5 SBB 222 2 24 23.4 1061 8-5 1.8 1.2 SBB 321 2 24 23.4 1388 10-1 - - 3 SBB 322 2 24 23.4 1401 - - - 1 SBB 231 2 30 29.2 718 11-1 - - 3 SBB 232 2 30 29.2 533 11-6 - - 3 SBB 331 2 30 29.2 684 11-2 3.8 1.9 SBB 332 2 30 29.2 725 10-8 3.0 1.4
Distance between left support and crack. b See Figure D-2.
Notes: 1. Test discontInued. 2. Number of cycles applied when failures at both Type 2 stiffeners re-quired extensive repairs. 3. Crack in web-to-tension fiafle Weld did not reach extreme fiber of tenSion flange. 4. Crack size dot recorded.

71
TABLE E..6
ANALYSIS OF VARIANCE FOR TYPE 1 STIFFENERS
F-RATIO SPECIMENS
SOURCE OF CALC. AT VAR.
SERIES INCL. EXCL. VARIATION F-RATIO =0.05 SIGN.
SC 17 5 spec. at Stress range 101.4 4.5 Yes 0r=l8ksi Mm. stress 6.7 4.5 Yes
Interaction 1.1 3.8 No SA 8 None Stress range / 96.2 7.7 Yes
Mm. stress 0.0 7.7 No SG 6 8 spec. at Stress range 49.7 19.0 Yes
0mi=14 ksi A441 vs A514 11.2 18.5 No 14 None Stress range 50.2 4.5 Yes
Mm. stress 1.9 5.3 No Interaction 0.1 4.5 No
SB 8 None Stress range 21.9 7.7 Yes Bracing angIe 0.7 7.7 No Interaction 1.2 7.7 No
SG, SB 22 None Stress range 112.2 3.6 Yes SG vs SB 7.7 4.5 Yes Interaction 0.0 3.6 No
SG, SB 18 4-A514 Stress range 72.6 3.9 Yes SG vs SB 3.2 4.7 No Interaction 0.0 3.9 No
TABLE E-7
ANALYSIS OF VARIANCE FOR TYPE 2 STIFFENERS
F-RATIO SPECIMENS
SOURCE OF CALC. AT VAR.
SERIES INCL.' EXCL. VARIATION F-RATIO a=0.05 SIGN.
SG 6 8 spec. at Stress range 19.7 19.0 Yes OmI,= 14 ksi A441 VS A514 4.0 18.5 No
14 None Stress range 95.1 3.4 Yes Mm. stress 2.5 4.3 No Interaction 0.2 3.4 No
SB 8 None Stress range 123.2 4.8 Yes Bracing angIe 2.1 4.8 No Interaction 0.8 4.8 No
SG, SB 22 None Stress range 216.9 3.3 Yes SGvsSB 2.8 4.1 No Interaction 0.1 3.3 No
One data point per specimen in test for effect of steel quality; two data points per specimen in all other tests.
TABLE E-8
ANALYSIS OF VARIANCE FOR TYPE 3 STIFFENER
F-RATIO SPECIMENS
SOURCE OF CALC. AT VAR.
SERIES INCL. EXCL. VARIATION F-RATIO x=0.05 SIGN.
SC 22 None Stress range 108.4 3.7 Yes Mm. stress 1.2 4.1 No Interaction 0.2 3.2 No
SG 6 8 spec. at Stress range 39.9 19.0 Yes 14 ksi A441 vs A514 1.7 18.5 No
10 4 spec. at Stress range 108.8 6.0 Yes 0=18 ksi Mm. stress 0.8 6.0 No
Interaction 0.4 6.0 No SB 8 None Stress range 9.9 7.7 Yes
Bracing angle 0.0 7.7 No Interaction 0.5 7.7 No
SG, SB 18 4 spec. at Stress range 82.6 4.6 Yes = 18 ksi SG vs SB 0.7 4.6 No
Interaction 2.5 4.6 No

72
TABLE E-9
STRESS RANGE VERSUS STEEL QUALITY FACTORIAL FOR SG GIRDERS
OF STEEL QUALITY
18sI 24KsI 30xsi
A441 SGB 211 SGB 221 SGB 231 A514 SGC 212 SGC 222 SGC 232
min=2 ksi.
°p,r 26.9
21.5 16.1 ksi
0
SG (4441 Spec.) D SB
2 5 06
5 1 07
CYCLES TO FAILURE
Figure E-5. Cumulative frequency distribution for Type I failures.
TABLE E-1O
STRESS RANGE VERSUS TRANSVERSE BRACING FACTORIAL FOR SG AND SB GIRDERS
SERIES
SG Without Bracing
SB with Bracing
o OF
18 KS!
SGB 211 SGC 212 SGB 311 SGB 312
24 'Cs!
SGB 221 SGC 222 SGB 321 SGB 322 SGB 323 SBB 221 SBB 222 SBB 321 SBB 322
30 KS!
SGB 231 SGC 232 SGB 331 SGB 332 SGC 333 SBB 231 SBB 232 SBB 331 SBB 332
Type 1 Stiffeners
The determination of the significance of the effects of the stress variables (minimum stress and stress range), steel type, bracing, and type of beams was evaluated and the results of the analysis are summarized in Table E-6. The mean sum of squares of each variable considered and their interaction was divided by the residual error to form the calculated F-ratios.
To determine the effect of steel, the six SG girder speci-mens at the 2-ksi minimum stress level were arranged into the factorial shown in Table E-9. The results of the analy-sis show that stress range accounts for the variation.
The analysis of the stress factorials for series SA, SC, and SG confirmed that stress range was the dominant variable and minimum stress was not a significant factor. The F-ratios calculated for stress range are nearly an order of magnitude greater than the tabulated values. The calculated F-ratio for minimum stress is in every instance less than the tabulated value.
A cumulative frequency diagram was constructed for each principal stress range level (Fig. E-5). The predicted line was determined from the regression model. It can be seen that the regression model predicts the distribution reasonably well. Hence, the logarithmic transformation and its assumed normal distribution appear to be reasonable.
The effect of bracing and the resulting out-of-plane de-formation were examined with the aid of the factorial given in Table E-10. An analysis of the SB series had indicated that changing the ratio of horizontal and vertical deflection had no effect. However, when compared with the SG girders a slightly significant difference was observed at the 5 percent level. This difference was attributed to the A514 steel specimens, which fall near the lower confidence limit in Figure 24. The re-analysis confirmed this observation, as is apparent in Table E-6.
The disparity of the results suggests that the A514 steel sample is too small to provide a conclusive analysis. The difference does not appear to be sufficient to treat type of steel as a significant factor in design.
Type 2 Stiffeners
Results of the analysis of variance of Type 2 stiffeners are summarized in Table E-7. The A514 steel girders tended to provide slightly shorter lives than the A441 steel girders; however, the difference was not significant at the 5 percent level, as is apparent in Table E-7. Stress range was the dominant variable at a given stress range level. Comparable results were obtained for minimum stress and bracing. Stress range clearly accounted for the variance of the test data, even with the few observed failures.
The cumulative frequency distribution of the Type 2 stiffener is plotted in Figure E-6.
Type 3 Stiffeners
Results of the analysis of variance of the Type 3 stiffeners test data are summarized in Table E-8. As is apparent from the comparison of the calculated and tabulated F-ratios, only stress range was a significant variable. No other vari-able or interaction between variables exceeded or even ap-
95
90
80
70 w cr 60 —J
50
40 w U
IJJ 0
20

73
° b,r = 22.9 18.3 13.7 ksi 95 8 °b,r287 23.9 19.2
ft 14.4 ksi
8 ,0 95—
90
90 8 8 / 10
80 8
80 70 0 o
70 w 0 cr
60 CC
8 - 5O
50 0 U-
40 A 8 8
40 A
A Z w30 oI
UJ
cr 30 Ui A
w o20
4 /8 a-
20 I 8 10
° I ° S g 0SC
'0 0 A SG 10 A
22.9 ksi SB
j A SG (A441 Spec.) A
13 oSB
2 5 106
CYCLES TO FAILURE
Figure E-6. Cumulative frequency distribution for Type 2 failures.
2 5 106 5 107
CYCLES TO FAILURE
Figure E-7. Cumulative frequency distribution for Type 3 failures.
proached the critical F-ratio for the 5 percent significance level.
The cumulative frequency distribution shown in Figure E-7 also confirmed the normality of the logarithmic trans-formation of stress range and cycle life.
Bending versus Principal Stresses
In the tests reported by Kouba and Stallmeyer (33) and Gurney (34) the beam geometry was purposely selected to generate principal stress conditions at the stiffener details that were comparable to or in excess of the maximum flange bending stress. This resulted in extreme shear-to-bending stress ratios in the web at the weld toe termination, as shown in Fig. A-4. Figure E-8 shows the Mohr circle diagrams for these earlier studies and compares them with the girders tested during this study. It is apparent that the weld toe termination was subjected to stress conditions in the earlier studies that differed substantially from the test girders reported herein.
As discussed earlier, actual structures with full-depth stiffeners cannot be subjected to such stress conditions. The stiffened beams and girders reported in this study are more representative of the state of stress than can be expected at details that may experience fatigue crack growth. Details placed on these beams located in regions that resulted in higher shear-to-bending stress ratios did not experience fa-tigue crack growth. In fact, efforts to test beams with higher shear-to-bending stress ratios always resulted in fail-ure as a plain welded beam or at a load point.
Basic Crock Growth Specimens Present Study
Ref. 33 Ref. 34 and 35
Figure E-8. Mohr circles for stresses at end of stiffener-to-web weld.

74
Welded Beams
SCB 221 I
SCB 131 I
SCBI32 I
SCB232
SCB242 I
Welded Girders
SGB 211
SGB 312 V777///A -
SGB 321 I I
SGB322 VA I
U SGB 323
SGC232 I
SGC 333 I
SBB 221 I
SBB222
SBB 321 ' I
SBB 322
SBB 231
SBB 232
SBB 332 I
Mean Bar Diagram 80 16 4
I I 0 20 40 %Nf 60 80 100
Note: For legend see Fig. ElO
Figure E-9. Bar diagram for crack growth at Type 1 sti/Jeners.
SGB 312 DZ222231
SBB 232
Mean Bar Diagram
20 40 % Nf 60 80 100
Stage I: Part - Through Crack
Stage 2: Two - Ended Through Crack
Stage 3 Three - Ended Crack
E1 Crack Growth not Observed
V First Crack Observation
The alternating shear specimens also showed that bend-ing stress tends to become more dominant as the direction of principal stress changes. In bridge structures the cyclic load will be caused by vehicles crossing the span and will also result in a changing direction and magnitude of the principal stress at stiffener details.
The over-all behavior strongly suggests that shear should not be considered in the design of stiffener details located in regions of bending and shear. Bending stress alone pro-vides a satisfactory measure of the stresses that will cause fatigue crack growth.
Crack Growth at Stiffener Details
In all the stiffener details it was observed that most of the fatigue life was consumed in initiating and propagating the crack through the thickness of the web or flange. This was shown schematically in Figures 15, 18, and 20.
Random visual observations on a large number of beams and girders provided information on the first observation of a crack and its subsequent growth. The results of these observations are summarized in Figures E-9, E-lO, and E- 11. The bar graph represents the observed fatigue life of each detail. The triangular marker notes the interval of life at which a visible fatigue crack was noted. The cracks were detected on the surface while the test was being con-ducted with either a magnifying glass or by magnetic par-ticle inspection with the Parker contour probe. It is ap-
Welded Beams
SCB 223
SCB 321
SCB 233
SCB33I
SCB 332
SCB 142 L
5GB 243
Welded Girders
SGB 312
SGB323 -
SGB 332
SBB 221
SBB 321
SBB322
SBB 331
Mean Bar Diagram
96 4
0 20 40,Nf 60 80 100
Stage I: Part - Through Crack
Stage 2: Through Crack
Crack Growth not Observed
First Crack Observation
Figure E-10. Bar diagram for crack growth at Type 2 stifieners. Figure E-11. Bar diagram for crack growth at Type 3 sti/Jeners.

75
parent that these cracks could only be detected by either method towards the end of the first stage of crack propaga-tion as a part-through crack.
For stiffeners welded to the web alone, about 80 percent of the fatigue life was consumed in propagating the fatigue crack through the web plate. Another 16 percent of the life was consumed growing the crack into the flange and through its thickness. The short interval of life remaining was exhausted as a three-ended crack propagated in the flanges and the web.
For stiffeners welded to the flange and web, 96 percent of the fatigue life was consumed in propagating the crack through the flange thickness. Hence, both types of stiff-eners had about the same life interval remaining once the crack penetrated the bottom surface of the flange.
A detailed examination of the crack propagation through the thickness of the web and flange plate was made for all three stiffener details. More than 100 stiffener details were examined visually by exposing the region at the weld toe and searching the area with a 50-power traveling micro-scope. Table E-1 1 summarizes the locations and dimensions of all single cracks with a semielliptical shape that were detected at the weld toe termination. The smallest crack depth found was 0.009 in.
The semielliptical shapes were plotted to determine the relationship between the minor and major axis of the crack surface. Figure E-12 shows the results for a wide range of crack sizes. The mean relationship for single cracks at the stiffener weld toes was
b = 1.088a° 946 (E-2)
which is plotted in Figure E-12 and approached the circular crack with increasing crack size (a/b = 1).
o
O0Ol 0.001 5 0.01 5 0.1
CRACK DEPTH a (in.)
Figure E-12. Size of part-through cracks at fillet weld toes
TABLE E-11
SIZE OF PART-THROUGH CRACKS AT FILLET WELD TOES
CRACK CRACK DEPTH, WIDTH, STIFF-
a 2b ENER LOCA-
SPECIMEN (IN.) (IN.) TYPE TION
(a) Single Crack
PilotD 0.051 0.120 1 T 0.038 0.084 1 T 0.134 0.278 1 T 0.035 0.079 1 T 0.029 0.081 1 T
SGB 221 0.143 0.407 3 T 0.082 0.202 3 T
SGB 321 0.014 0.031 3 T SGB 322 0.029 0.078 3 T SGB 323 0.035 0.100 2 T
0.044 0.135 2 T 0.115 0.286 2 T 0.013 0.051 2 T
SGC 333 0.051 0.107 3 T 0.028 0.061 3 T 0.016 0.052 3 T 0.235 0.875 3 T
SCG 311 0.023 0.065 1 T 0.026 0.061 1 T 0.060 0.140 2 T
SCB 222 0.042 0.088 2 T 0.067 0.169 2 T 0.102 0.237 1 T 0.127 0.339 1 T
SCB 322 0.281 0.569 1 T SCB 131 0.089 0.250 1 T
0.290 0.700 1 T SCB 132 0.190 0.440 1 T
0.033 0.092 2 T 0.021 0.059 2 T 0.034 0.085 2 T
SCB 232 0.025 0.072 2 T 0.057 0.139 2 T
SCB 331 0.075 0.170 1 C SCB 332 0.025 0.070 2 T
0.009 0.028 2 T 0.022 0.051 2 T
SCB 142 0.250 0.550 1 C SCB 243 0.028 0.078 1 T
0.070 0.156 1 T 0.220 0.560 1 C 0.041 0.110 3 C
(b) Multiple Cracks
Pilot C 0.109 0.366 3 T 0.171 0.530 3 T
SCB 221 0.320 2.200 3 C SCB 222 0.136 0.455 3 C SCB 242 0.250 1.790 3 C SCB 243 0.063 0.234 3 C
0.055 0.427 3 C SGC 222 0.237 0.881 3 T SGB 321 0.176 0.528 3 T
0.261 1.130 3 T 0.069 0.401 3 T
SGB 322 0.074 0.271 3 T SGB 231 0.076 0.208 3 T
0.135 1.157 3 T SGB 331 0.367 2.370 3 T SGC 333 0.044 0.126 3 T
a T = tension flange area; C = compression flange area.
5
Eq. (10)
Circular Crack , , / / ,

76
Part-through cracks that initiated at more than one point (see Fig. 22) are also plotted in Fig. E-12 (as open tri-angles). They were not included in the regression of b on a. Their formation is a random process that depends on the distance between the weld defects and their severity. Cracks were observed to have joined at depths a> 0.050 in. in a number of details. This corresponds to at least two-thirds of the number of cycles spent in Stage 1 of growth. Thus, Eq. E-2 provides only an approximate definition of the crack shape for the remaining interval of life.
Three part-through cracks that were observed at the end of longitudinally welded cover plates (1) are plotted as circles and fall within the band of crack size data.
Stress Analysis of Crack Propagation
Inasmuch as the first stage of crack propagation dominated the fatigue life for all details (see Figs. 15, 19, and 20), the stress analysis of crack propagation concentrated on that aspect of crack growth.
Before the analysis of propagation of the part-through crack could be carried out, the theoretical stress concen-tration factor (K) had to be determined. The finite ele-ment method was used for this purpose. A typical mesh modeling a strip of the girder flange with a portion of the stiffener welded on is shown in Figure E43. The mesh size around the weld toe was kept the same for all four geome-tries corresponding to Type I and Type 3 stiffeners on
Type 3 Stiffener Symm.
" Flange, !.'' Stiffener, "4 Weld
2°r 2.0
I o (A-A)
J1.5 .5L °p (BB)
J 0 1!J—
Toe BLI t —1
y x
-i A ToeN.-
Figure E-13. Typical finite element mesh for computation of stress con-centration at weld toe.
TABLE E-12
DATA FOR ANALYSIS OF PROPAGATION OF PART-THROUGH CRACKS
STIFF- PLATE ENER WELD STRESS
STRESS RANGE AT DETAIL (KSI)
THICK- THICK- SIZE,0 CONC. CRACK GROWTH RATES NESS,t NESS W FACTOR, 18 24 30 36
SPECIMEN (IN.) (IN.) (IN.) K C n KSI KSI KSI KSI
Type 1 Stiffeners
Beam %2 %2 3/4 2.20 14.8 19.8 24.7 29.7 2.0101° 3.0
Girder 34 34 34 2.12 16.1 21.5 26.9 - Type 3 Stiffeners
Beam % %2 34 2.42 14.4 19.2 23.9 28.7 2.0x 10¹⁰ 3.0
Girder 34 34 2.64 13.8 18.4 22.9 - 5,6-in. fillet welds specified, but actual weld sizes were almost ¼ in
b For stress range in extreme fiber at midspan.

77
beams and girders (Figs. la and ib). To simulate the assumed zero weld penetration at the weld root, non-connected double nodes were provided along the interface of the stiffener end with the main plate. The analysis was restricted to one-half of the symmetrical joint, the second half being accounted for by restraining the x-displacements of the nodes along the center line of the stiffener. A uni-form stress was applied at the end of the main plate in all geometries. The maximum stress at the weld toe was ob-tained by passing a surface through the principal stress at the centroid of six elements situated in the area adjacent to the weld toe in Fig. E-13.
The weld and stiffener geometry appeared to have only a local concentration effect on the stress field. At 0.1 in. from the weld toe, the maximum element stresses were re-duced to the applied stresses, as shown by the stress dis tribution along sections A-A and B-B in Fig. E-13.
The numerical solution of the finite element analysis was carried out with the aid of a program written at Fritz Engi. neering Laboratory by S. Desai and J. Struik (17). The stress concentration factors (Kr ) for the beam and girdeT stiffener details are summarized in Table E-12.
The K-value for a crack embedded at the stiffener fillet weld toe was estimated at each stage of crack growth from Eq. 12. The equation is plotted in Figure E-14 for a girder with a ½-in, flange and a ¼-in, fillet weld. Also shown in Figure E-14 with dashed lines are the factors accounting for the shape of the crack front, the geometrical stress con-centration, and the finite thickness of the plate. The prod-uct of all three factors is equal to K nondimensionalized by the value of 0-V
Stage 2 of growth at Type 1 stiffener began after the part-through crack in the web broke through the far side of the web plate. It ended when the lower front of the two-ended through crack reached the extreme fiber of the tension flange.
The stress-intensity factor for such a crack is difficult to define, because the two crack fronts propagate under different conditions. In many cases the upper front was observed to follow the stiffener-to-web weld toe, before branching off diagonally into the web. Several specimens exhibited crack growth directly off the end of the stiffener-to-web weld. The point where the crack path deviated from the toe line depended on the number of initiation points, the relative distance hetween them, and the shear-to-bending stress ratio.
The lower crack front extended quickly past the weld toe and grew in the plain web plate and then entered the web-to-flange junction. While growing through the junction, the front appeared to assume a circular shape, as shown sche-matically in Figure 15, until it reached the extreme fiber
I I I I
\/—Ktf(°/t) / I
/ 2 /
/ \ / \ I. \ / K /
/ Eq.12 -I
- 0/2t
0 0.1 0.2 0.3 0.4 0.5 CRACK SIZE, a , in.
Figure E-14. Stress-intensity factor at weld toe of Type 3 gir-der stifieners.
of the tension flange. The stress gradient across the depth of the specimen, combined with the stress concentration effect of the stiffener-to-web weld on the upper crack front, further complicates the problem of estimating a stress-intensity factor for the over-all crack.
Stage 2 of growth only accounted for 16 percent of the total number of cycles to failure at Type 1 stiffener, as shown in Figure 15. To approximate the observed behavior during this stage of growth, the lower crack front was as-sumed to grow as a circular crack in an infinite solid under a constant stress applied away from the crack tip. The interaction between the two crack fronts was neglected.
The stress-intensity factor for a circular crack and a finite thickness correction yields
K = -- eVVsec(ira/2t) (E-3)

78
APPENDIX F
FATIGUE STRENGTH OF WELDED ATTACHMENTS
Appendix A contains a discussion of the previous work done on the fatigue strength of attachment weld details. For the most part, little has been reported in the literature. There is a significant amount of work available on attach-ment plates welded perpendicular to main plates with the longitudinal axis of the attachment plate parallel to the direction of the applied stress. The attachment plates in the present study are considered as being transverse to the di-rection of stress in the flange of the beam to which they are welded.
The amount of load carried by the attachment plates varies with their length along the beam. It has been shown previously, and is shown in this study, that the attachment plate will develop its full capacity in a length along the beam equal to three to four times its width. In the current study the width of all attachment plates on the beam flange is 2 in., with an additional 1 in. extending outside the flange tips. The shortest detail was the AQ attachment. This detail had a length of %2 in. and can be considered as nonload-carrying. The A8 attachments are nearly full-load-carrying and approach a cover-plated beam in their behavior.
The attachments were welded to the flange of the beam in a region of constant shearing stress and varying bending moment. The nominal stresses controlling the experimen-tal studies were calculated using beam theory and were ap-plicable to the face of the attachment closest to the mid-span of the beam. The controlling stresses for the tests are given in Tables B-7 to B-b.
All of the failure surfaces, except for the one noted in Chapter Three under "Fatigue Strength of Plain Welded Beams and Girders" for member AQB 261, were through
the flange material at the toe of the transverse weld on the midspan side of the attachment. For the 4-in, attachments with the longitudinal weld detail, the crack surfaces propa-gated into the flange material at the ends of the longitudinal weld on the midspan side of the attachment. Thus, the failure surface always coincided with the location of maxi-mum nominal stress on the beam at the attachment weld detail.
Seventeen failure surfaces were sawed open and ex-amined under a 30-power microscope. Observations of the cracked surfaces indicated that the fatigue cracks originated in the flange material on the surface closest to the attach-ment. In all cases, there appeared to be multiple crack surfaces being propagated.
Surfaces relatively close to each other merged early in the fatigue life of the specimen, forming a ridge between the two surfaces. These two surfaces gradually merged within a depth of %6 in. of penetration into the flange thickness, eliminating the ridge. They then propagated as one surface across the remaining thickness of the flange.
In the longitudinal weld detail failures, there were usually two or three of these surfaces joining at the end of each longitudinal weld. The joined areas at the end of one of the longitudinal welds propagated across the thickness of the flange and along the width. Usually, it met with a similar failure surface that was propagating from the end of the adjacent longitudinal weld. These two surfaces most often did not coincide. A tearing of the flange material, transverse to the two propagating surfaces, took place. This resulted in a combined crack surface with a step or ridge that extended across the flange thickness.
A similar joining of propagating failure surfaces was ob-
0.1 0.5 1.0 5 10
LENGTH OF ATTACHMENT PLATE (in.)
Figure F-i. Measured strain in beam flange at end of flange attachment.

,=0
3.0
L
125' 3.011
ee
79
Web
Figure F-2. Finite element mesh for computation of stress distribution at flange attachment.
served in the cracks with the transverse weld detail. Gen-erally, there were many initiation sites in the beam flange at the toe of the transverse weld. The resulting surfaces tended to conform to the irregularity in the life of the weld detail. The length of the tapered ridge that formed was small, usually Mo in The farther apart the merging areas were initially, the longer was the ridge line. When the merging areas were joined, they propagated as one surface across the thickness and along the width of the flanges. When two such larger propagating surfaces approached each other, they tried to merge without a ridge forming. However, ridges across the flange's thickness, as described previously for the longitudinal weld detail, were often formed.
As described in Chapter Three under "Analysis of Data for Welded Flange Attachments," the length of the attach-ment had a significant effect on the fatigue strength of the weld detail. Experimental studies using ½ -in.-long foil strain gauges were used to determine the localized stress distribution throughout the attachment length under static loading.
These studies gave a clear indication of the attachment behavior under static load. Stress distributions were obtain-able for gauges at a distance of 0.125 in.. from the toe of the weld. These studies indicated that the magnitude of the stress near the attachment increased with an increase in the attachment length. When plotted on a log-log scale (.Fig. F-i), the relationship between the maximum measured strain and the attachment length is relatively linear.
As the length of the attachment plate increased, the length of the local stress concentration zone increased to-ward the midspan of the beam, as shown in Fig. 45. Hence, the stress concentration effects were increased as the attach-ment plate increased in length.
In order to further determine the effect of the geometry of the attachment weld detail on the fatigue strength, a finite element analysis was made. Because it was deter-mined experimentally that the local stress concentration was the controlling factor in the variation of the fatigue life with the attachment length, the weld detail containing the attachment plate and flange plate was modcicd.
Figure F-2 shows the finite element mesh selected for the stress analyses. The area being studied was divided at its midlength because of symmetry. The resulting half-model was divided into 200 plate elements. The basic size of the element adjacent to the transverse weld was 0.25 by 0.25 in. in horizontal area. The thickness of the element for the attachment plate was 0.25 in. and the thickness for the flange plate was 0.375 in. Each nodal point had 5 degrees of freedom. Rotation about the z axis (vertical axis) was not considered. Together, there were more than 1,000 un-known displacements for each attachment plate study. In addition, the effect of the flexibility of the weld was mod-eled into the program. Stiffness coefficients were developed for both the longitudinal and the transverse weld from experimental studies of similarly welded tensile strap specimens.
The boundary condition assumed for the web side of the finite element model proved to be significant in correlating the data from the finite element analysis and those for the
experiments on the static loading of the test specimens. This boundary was assumed to be fixed against rotation and translation in the y and z directions, and free for transla-tion in the x direction. The surface of contact between the attachment plate and the flange plate was assumed to be frictionless.
The values of the strain distribution obtained in the computer analysis are compared with the measured strains in Figure 45; there is general agreement. The maximum error for the maximum calculated strain is within 5 percent of the maximum measured in the experimental study. The maximum capacity for the attachment was determined on the basis of the ratio of the area of the attachment to the area of the attachment and flange plate. The maximum capacity of the attachment is 31.5 percent of load applied across the detail. Table F-i indicates that an attachment plate length of 4 in. (11/3 w) develops 90 percent of its rraximum capacity.
RESULTS AND ANALYSIS
The results of the tests for each type of attachment detail are summarized in Tables F-2 through F-6. The nominal stress conditions that existed at the crack or face of the attachment are listed, together with the cycles to failure for
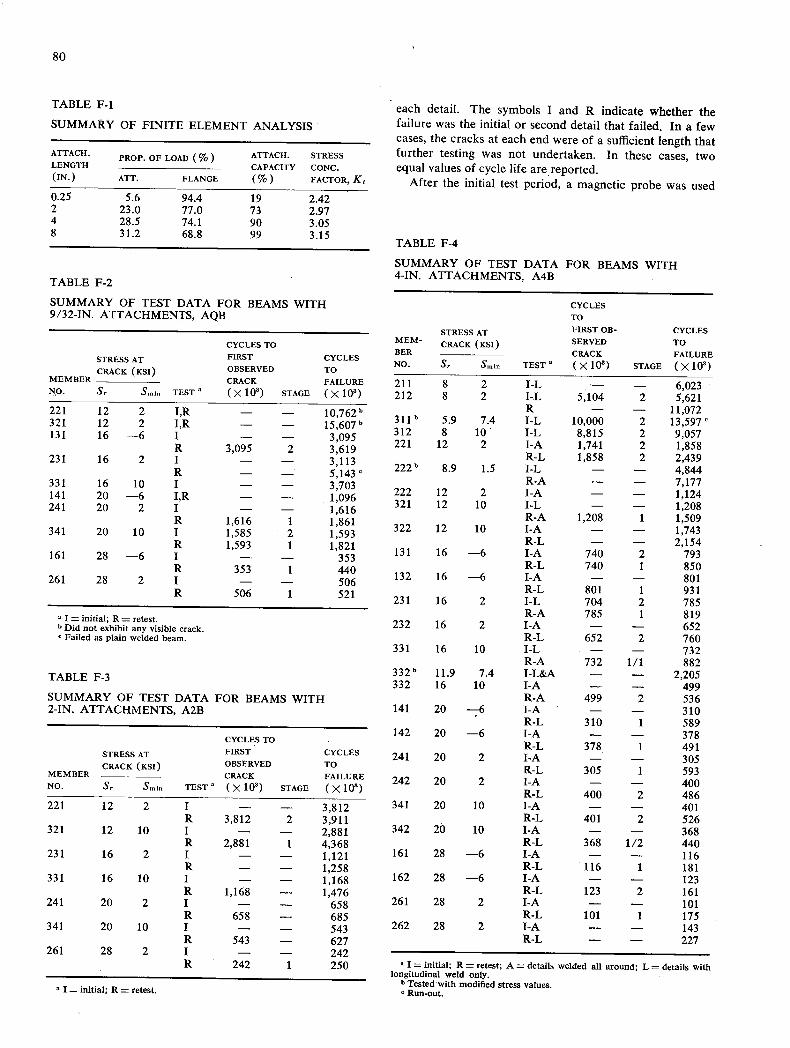
80
TABLE F-i
SUMMARY OF FINITE ELEMENT ANALYSIS
ATTACH. PROP. OF LOAD (%) ATTACH. STRESS
LENGTH CAPACITY CONC. (IN.) ATT. FLANGE (%) FACTOR,K
0.25 5.6 94.4 19 2.42 2 23.0 77.0 73 2.97 4 28.5 74.1 90 3.05 8 31.2 68.8 99 3.15
TABLE F-2
SUMMARY OF TEST DATA FOR BEAMS WITH 9/32-IN. ATTACHMENTS, AQB
CYCLES TO
STRESS AT FIRST CYCLES
CRACK (KS!) OBSERVED TO MEMBER __________ CRACK FAILURE NO. S, Smio TEST ' (X 10) STAGE (X 10)
221 12 2 I,R - - 10,762k' 321 12 2 I,R - - 15,607k 131 16 -6 I - - 3,095
R 3,095 2 3,619 231 16 2 I - - 3,113
R - 5,1430 331 16 10 I - - 3,703 141 20 -6 I,R - - 1,096 241 20 2 I - - 1,616
R 1,616 1 1,861 341 20 10 I 1,585 2 1,593
R 1,593 1 1,821 161 28 -6 I - - 353
R 353 1 440 261 28 2 I - - 506
R 506 1 521
I = initial; R = retest. b Did not exhibit any visible crack.
Failed as plain welded beam.
TABLE F-3
SUMMARY OF TEST DATA FOR BEAMS WITH 2-IN. ATTACHMENTS, A2B
CYCLES TO
STRESS AT FIRST CYCLES
CRACK (KSI) OBSERVED TO MEMBER CRACK FAILURE NO. S0 Smjn TEST (x 10) STAGE (x 10)
221 12 - 2 I - - 3,812 R 3,812 2 3,911
321 12 10 I - - 2,881 R 2,881 1 4,368
231 16 2 I - - 1,121 R - - 1,258
331 16 10 I - - 1,168 R 1,168 - 1,476
241 20 2 I - - 658 R 658 - 685
341 20 10 I - - 543 R 543 - 627
261 28 2 I - - 242 R 242 1 250
0 J = initial; R = retest.
each detail. The symbols I and R indicate whether the failure was the initial or second detail that failed. In a few cases, the cracks at each end were of a sufficient length that further testing was not undertaken. In these cases, two equal values of cycle life are reported.
After the initial test period, a magnetic probe was used
TABLE F-4
SUMMARY OF TEST DATA FOR BEAMS WITH 4-IN. ATTACHMENTS. A4B
CYCLES TO
STRESS AT FIRST OB- CYCLES MEM- CRACK (KsI) SERVED TO BER ___________ CRACK FAILURE NO. S0 Smin TEST ' (x 10) STAGE (x 10)
211 8 2 I-L - - 6,023 212 8 2 I-L 5,104 2 5,621
R - - 11,072 311' 5.9 7.4 I-L 10,000 2 13,597 0 312 8 10 I-L 8,815 2 9,057 221 12 2 I-A 1,741 2 1,858
R-L 1,858 2 2,439 222" 8.9 1.5 I-L - - 4,844
R-A - - 7,177 222 12 2 I-A - - 1,124 321 12 10 I-L - - 1,208
R-A 1,208 1 1,509 322 12 10 I-A - - 1,743
R-L - - 2,154 131 16 -6 I-A 740 2 793
R-L 740 1 850 132 16 -6 I-A - - 801
R-L 801 1 931 231 16 2 I-L 704 2 785
R-A 785 1 819 232 16 2 I-A - - 652
R-L 652 2 760 331 16 10 I-L - - 732
R-A 732 1/1 882 332b 11.9 7.4 I-L&A - - 2,205 332 16 10 I-A - - 499
R-A 499 2 536 141 20 -6 I-A - - 310
R-L 310 1 589 142 20 -6 I-A - - 378
R-L 378 1 491 241 20 2 I-A - - 305
R-L 305 1 593 242 20 2 I-A - - 400
R-L 400 2 486 341 20 10 I-A - - 401
R-L 401 2 526 342 20 10 I-A - - 368
R-L 368 1/2 440 161 28 -6 I-A - - 116
R-L 116 1 181 162 28 -6 I-A - - 123
R-L 123 2 161 261 28 2 I-A - - 101
R-L 101 1 175 262 28 2 I-A - - 143
R-L - - 227
0 = initial; R = retest; A = details welded all around; L = details with longitudinal weld only.
b Tested with modified stress values. 0 Run-out.

81
to determine small cracks, if any, that existed in the re- TABLE F-S maining attachment weld details. The number of cycles at SUMMARY OF TEST DATA FOR BEAMS WITH which the cracks were first observed in the failure surface 8-IN. ATTACHMENTS, A8B are given. A stage 1 crack is one that had not propagated through the thickness of the flange when first observed; a CYCLES TO
stage 2 crack is one that has propagated through the flange STRESS AT FIRST CYCLES
thickness. CRACK (KSI) OBSERVED TO
The cracks reported in Tables F-7 to F-10 are those that MBER
s. s. TEST CRACK (x103) STAGE
FAILURE (X103)
were not a part of the failure surface. Generally, cracks could not be observed during testing until after they had 211
i penetrated through the flange. This corresponded to ap- 311 8 10 I - - 2,866 proximately 90 percent of the fatigue life of the attachment. R - - 7,004
221 b 8.9 1.5 I - - 2,960 Analysis of Data R - - 3,681
The statistical analysis of the effects of the controlled 321 12 i S - - 1,147 variables was done using analysis of variance and regression R - - 1,225 analysis techniques. 131 16 —6 I - 595
The regression analysis model used to relate the number of cycles to failure to the stress range at the crack initiation
231 16 2 1 R
- -
- -
491 885
pointwas 331 16 10 I - - 518
log N=B1 +B2 log 5R (F-i) 141 20 —6 I - - 279
The coefficients B1 and B2 were obtained through a least- 241 20 2 1 - - 192 square fit. Figures 39 to 43 show the mean regression R 192 2 213 curves for each of the attachment weld details. In all of 341 14.9 7.4 I - - 786 the stress range versus life (S-N) plots the data points are R - - 855
shown, together with the mean regression line and the con- 341 20 10 I
2 190 fidence limits at two standard deviations from the mean. 151 24 —6 I
175 - - 165
The ¼-in, attachment weld detail's upper bound confi- - - 165 dence limit (Fig. 40) falls close to the mean regression 251 24 2 I, R - - 167
I = initial; R = retest. Tested with modified stress values.
TABLE F-6
SUMMARY OF SECONDARY CRACK DATA FOR 9/32-IN. ATTACHMENTS
DETER- CRACK CRACK SIDE OF MINED
BEAM LENGTH LOCATION CRACK FLANGE ATTACH- AFTER NO, (IN.) (IN.) TYPE b POSITION MENT d TEST ° COMMENTS
221 Y8 1 B S E 1/4 1% 1 B M E Webside 3% 1 I T M E /16 1 1 T M E /16 11/4 1 T S E
321 3% 1 B M E 131 - - 231 i Y2 1 B M I NR 331 11% 1 Y2 1 B M I NP, failed as PW
1/4 3% 1 B M I NP 1 11/4 1 B M I 21/8 in. at 11/4 in.
141 - - 241 11/ 1 B M I NR
11/4 1 B M R 3% 1% 1 T M R
341 1Y4 11/8 1 B S I NR % 1% 1 B M I NR 1/8 % 1 T M I NR
161 - - 261 1 i 1 B S I NR
3% 1 1 B M I NR
From edge of flange. b 1 = weld side; 2 = through flange. B = bottom; T = top. d S = support; M = midspan. R = retest; I = initial; E = run-out. f NP = no propagation; NR = occurred at failed end, no retest.

82
curve for the plain welded beam. This indicates that the latter is an upper bound for the fatigue strength of the attachment weld detail series.
The mean regression curve for the 4-in, longitudinal weld detail (Fig. 42) gives a slightly greater fatigue strength than that for the A4B "around" weld detail. Figures 39 and 42 show that the initial failures in the test of the beams with the 4-in, attachments tended to be in the longitudinal detail at the lower values of stress range and in the "around" detail at the higher values of stress range. These variations, although significant, have only a slight effect on the fatigue strength of the 4-in, attachment. From a design viewpoint, there would be no difference.
The regression analysis curves are relatively parallel, as shown in Figure 44. Numerical values of coefficient B2 fall in the range of 2.82 to 3.24. These values are relatively close to —3.098 and —3.372, the values reported in NCHRP Report 102 for the cover-plated beams and plain welded beams, respectively.
The lower bound confidence limit (2o-) curve for the 8-in, attachment almost coincides with the mean regression curve for the cover-plated beam (Fig. 43). The latter acts as a lower bound for the attachment weld details. It was noted in Table F-i that the 84n, attachment developed 99 percent of its capacity and was rapidly approaching the cover-plated beam condition.
Stress Analysis of Crack Propagation
Before the part-through crack at the weld toe, perpendicu-lar to the stress field in the beam flanges, could be analyzed, it was necessary to establish the stress concentration factor. The finite element method was used for this purpose. A model of the flange and attachment was used to estimate
the stress field near the weld toe. A typical mesh layout is shown in Figure F-2. To simulate the weldment connecting the attachments to the flange, double nodes were provided along the interface of the attachment and plate. Shear stiff-ness reported by Kulak (52) was used to connect the nodes. The analysis was restricted to one-half of the symmetric joint, with no displacements permitted along the center line of the attachments. Displacements were also restricted along the flange surface to simulate the web restraint. A uniform stress was applied to the end of the flange plate.
After the stress field was defined the stress concentration was determined from a second finite element solution (see Fig. E-14). The maximum stress at the weld toe was deter-mined by passing a plane through the principal stress at the centroid of each element. The results of this extrapolation are summarized in Fig. 58. The stress concentration at the weld toe is plotted as a function of attachment length. It is readily apparent that the stress concentration factor, K, approaches an asymptote with increasing length.
SUMMARY AND CONCLUSIONS
It has been shown that as the length of the attachment increases the fatigue strength decreases. The decrease is a function of the increase of bending or prying action that takes place in the flange plate immediately in front of the attachment plate on the midspan side of the beam (Fig. 45). Figure F-i shows that the strain measured 0.125 in. from the toe of the transverse weld varies linearly with attachment length when plotted on a log-log basis. Also, the finite element solution indicates that the amount of load transferred through the attachment increases as the length of the attachment increases, The A4B attachment plate has
TABLE F-7
SUMMARY OF SECONDARY CRACK DATA FOR 2-IN. ATFACHMENT
BEAM NO.
CRACK LENGTH (IN.)
CRACK LOCATION ' CRACK (IN.) TYPE b
FLANGE POSITION
SIDE OF ATTACH- MENT
DETER-MINED AFTER TEST ° COMMENTS
221 1 i B S I NR 1 P/2 2 B S I NR
321 1% 11/2 1 B M I NR 1 T M R 1 T S R
131 - - 231 1/2 1% 1 B M I NR
1% 1 1 B M I NR 1/8 13% 1 B M R 1% 1/16 1 B S R
331 1 1112 1 B M I NR 141 - - 241 11/2 l% 1 B M I NR 341 3% 1 B S I NR
1% 1112 1 B S I 14 in. at 114 in. 161 - - 261 3% 13% 1 B M I NR
1% 1112 1 B S I NR
From edge of flange. b 1 = weld side; 2 = through flange. B = bottom; T = top, d s = support; M = midspan. OR = retest; I = initial. f NR = occurred at failed end, no retest.

83
a length along the flange equal to twice its width across the flange and is carrying 90 percent of its rated development capacity.
When the length of the attachment is less than ½ in., the amount of force transmitted through the attachment plate
is relatively small. The weld detail approaches a nonloaded attachment as the attachment length gets smaller. Unfor-tunately, even at a length of ½ in. there is a significant reduction in fatigue strength at a given cycle life (Fig. 44) from the plain welded beam.
TABLE F-8
SUMMARY OF SECONDARY CRACK DATA FOR 4-IN. ATFACHMENT
DETER- CRACK CRACK SIDE OF MINED
BEAM LENGTH LOCATION CRACK FLANGE ATTACH- AFTER NO. (IN.) (IN.) TYPE POSITION ' MENT TEST COMMENTS
211 0.25 1.25 1-A B M I NR 212 0.25 0.12 1-L B S I NR
0.12 0.06 1-A T S R Runout 311 - -. 312 1.0 2.0 1-A B S I Runout
0.12 0.06 1-A B M R 221 0.25 1.5 l-L B S I NP
0.25 0.12 l-L B S I 0.5 in. at 0.25 in. 0.5 0.25 l-L T M I NP 2.0 1.0 1-L T S I NP 2.0 1.0 l-L T M I NP 0.2 1.0 1-A T M I NP 0.2 1.5 1-A T M I NP 0.2 0.8 1-A T S I NP
222 1.0 0.5 1-L T M I NR 322 0.12 1.75 1-A B M I NR
0.25 0.12 1-A B S I NR 0.12 1.25 1-A T S I NR 0.12 0.75 1-A T M I 0.25 in. at 0.75 in. 0.25 0.12 1-L T S R
231 1.0 2.0 1-L B M I NR 0.75 1.75 1-A B M I 1.8
1.5 0.12 0.06 1-A T M I 0.4 in. at 0.2 in. 0.25 0.12 1-L T M I NR
232 2.0 1.0 1-L B M I NR 0.75 0.37 l-L T M I NP 0.25 0.12 2-L 11, S R
331 1.0 1.5 1-L B M I NR 0.75 1.5 1-L B S I NR 0.12 1.5 1-A T S I NP
332 - - 242 2.0 1.5 1-A B M I NR
0.12 0.06 1-L T S R 341 1.0 1.5 1-A B M L NR
0.12 1.75 1-A B S I NR 342 0.12 1.75 1-L B M I NR
1.0 1.75 1-A B M I NR 262 0.25 0.12 1-A B S I NR
2.12 1.06 1-A B M I NR 0.12 1.75 l-L B S I NP 0.25 0.12 1-L B S R 0.37 0.18 1-L T M R
From edge of flange. b 1 = weld side; 2 = through flange; A = details welded all around; L = details with longitudinal weld only. C B = bottom; T = top. d S = support; M = midspan. R = retest; I = initial. r NP = no propagation; NR = occurred at failed end, no retest.

TABLE F-9
SUMMARY OF SECONDARY CRACK DATA FOR 8-IN. ATTACHMENT
CRACK CRACK BEAM LENGTH LOCATION ' CRACK FLANGE SIDE OF DETERMINED NO. (IN.) (IN.) TYPE b POSITION ATTACHMENT AFTER TEST ° COMMENTS
211 0.25 1.87 1 T S I NR 311 0.12 0.5 1 T M I NR
0.12 0.75 1 T M I NR 221 0.25 2.0 1 B M R 231 1.12 1.5 1 B M R
0.25 0.12 1 T M R 0.5 0.25 1 T M R
331 1.12 1.5 1 B M I NR 341 0.75 1.75 1 B M I NR 251 1.75 1.12 1 B M I NR
From edge of flange. b 1 = weld side. B = bottom; T = top. "S = support; M = midspan. R = retest; I = initial. NR = occurred at failed end, no retest.
TABLE F-b
COMPARISON OF LONGITUDINAL AND ALL-AROUND WELD DETAILS FOR 4-IN. AI1IACHMENT, INITIAL TEST FAILURES
NO. OF INITIAL TEST FAILURES FOR STRESS RANGE OF
WELD 8 12 16 20 28 DETAIL KSI KSI KSI KSI KSI
Longitudinal 4 2 3 0 0 Allaround 0 2 5 6 4
84
APPENDIX G
NOMENCLATURE
SYMBOLS
a = crack size (depth of semielliptical crack). a1 = initial crack size. a1 = crack size at failure. ct = level of significance. b = half-crack width.
B1, B2 = constants determined from regression analysis. F = ratio of the measured variation of the yield of
a treatment to that of the unassigned or error variation, a tabulated value of the F-statistic.
G = constant in regression equation (= lOB1).
= order number for cumulative frequency distri-bution.
K = elastic stress intensity factor for the leading edge of a crack.
AK = range of K.
Kt = stress concentration factor. N = number of applied cycles.
AN = number of cycles required for a crack to grow from initial size to size at failure or specified depth.
n = sample size; = exponent. Pi = plotting position on cumulative frequency dia-
gram for observation i. a = stress.
Smax = maximum stress.
Smin = minimum stress. Sr, 0r = stress range.
t = thickness. = elliptical integral of the second kind.

85
GLOSSARY
For beam specimen designation see Table B-i. AASHO—American Association of State Highway Officials
(now AASI-ITO—American Association of State High-way and Transportation Officials).
AASHO—American Association of State Highway Officials. ASA—American Standards Association. ASTM—American Society for Testing and Materials. A2—beams with 2-in, attachments welded to flanges. A4—beams with 4-in, attachments welded to flanges. A8—beams with 8-in, attachments welded to flanges. AQ—beams with %2-in.-thick plates welded to flanges. Cycle life—number of load cycles to failure. Empirical exponential model—mathematical equation in ex-
ponential form relating stress range and cycle life; values of coefficient and exponent are determined empirically.
Factorial experiment—experimental plan in which observa-tions are taken at all possible combinations that can be formed for the different levels of factors.
Failure—significant increase in midspan deflection due to fatigue cracking of the test specimen.
Fatigue—initiation and propagation of microscopic cracks into macroscopic cracks by repeated application of stress.
Fatigue life—number of load cycles to failure. Fatigue limit—stress range below which no crack occurs;
threshold of crack growth. Fatigue strength—relationship between fatigue life and ap-
plied stress. Flaw—any discontinuity in the material. Fretting—rubbing or chafing between plates. Lateral connection—connection or bracing normal to beam
or girder. Limits of dispersion—limits of the test data from the mean
regression line determined from the standard error of estimate.
Lower-bound welded detail—detail of welded beam that exhibited relatively lowest fatigue strength; cover-plated beams.
Maximum stress—highest algebraic stress per cycle. Minimum stress—lowest algebraic stress per cycle. Porosity—pores in welds. PRC—plain rolled beams; the third letter designates grade
of steel (A for A36, B for A441, C for A514). Regression analysis—the use of least-square curve fitting to
statistically evaluate the significance of the independent stress variables.
Stress intensity range—range of stress intensity factor, K. Stress range—algebraic difference between maximum and
minimum stress. Stress ratio—algebraic ratio of minimum stress to maximum
stress. SA—beams with transverse stiffeners and alternating direc-
tion of principal stress. SB—girders with transverse stiffeners with bracing attached. SC—beams with transverse stiffeners and constant direction
of principal stress. SG—girders with transverse stiffeners and constant direc-
tion of principal stress. Threshold value—lowest value of stress intensity range at
which fatigue crack growth occurs. Transverse connection—connection transverse to the longi-
tudinal direction of beam or girder web. Upper-bound welded detail—detail of welded beams that
exhibited relatively highest fatigue strength; plain welded beam.
95 percent confidence limit—statistical limits that define interval of cycle life within which fatigue test data occur 95 percent of the time.
95 percent survival—an estimate of the number of stress cycles that 95 percent of the beams would survive at a given stress range.

Published reports of the Rep.
NATIONAL COOPERATIVE HIGHWAY RESEARCH PROGRAM No. Title
20 Economic Study of Roadway Lighting (Proj. 5-4),
are available from: 77 p., $3.20 Highway Research Board 21 Detecting Variations in Load-Carrying Capacity of
National Academy of Sciences Flexible Pavements (Proj. 1-5), 30 p., $1.40 2101 Constitution Avenue 22 Factors Influencing Flexible Pavement Performance Washington, D.C. 20418 (Proj. 1-3(2)), 69 p., $2.60
23 Methods for Reducing Corrosion of Reinforcing
Rep. Steel (Proj. 6-4), 22 p., $1.40
No. Title 24 Urban Travel Patterns for Airports, Shopping Cen-
ters, and Industrial Plants (Proj. 7-1), 116 p., —* A Critical Review of Literature Treating Methods of $5.20 Identifying Aggregates Subject to Destructive Volume 25 Potential Uses of Sonic and Ultrasonic Devices in Change When Frozen in Concrete and a Proposed Highway Construction (Proj. 10-7), 48 p., $2.00 Program of Research—Intermediate Report (Proj. 26 Development of Uniform Procedures for Establishing 4-3(2)), 81 p., $1.80 Construction Equipment Rental Rates (Proj. 13-1),
1 Evaluation of Methods of Replacement of Deterio- 33 p., $1.60 rated Concrete in Structures (Proj. 6-8), 56 p., 27 Physical Factors Influencing Resistance of Concrete $2.80 to Deicing Agents (Proj. 6-5), 41 p., $2.00
2 An Introduction to Guidelines for Satellite Studies of 28 Surveillance Methods and Ways and Means of Corn- Pavement Performance (Proj. 1-1), 19 p., $1.80 municating with Drivers (Proj. 3-2), 66 p., $2.60
2A Guidelines for Satellite Studies of Pavement Per- 29 Digital-Computer-Controlled Traffic Signal System formance, 85 p.+9 figs., 26 tables, 4 app., $3.00 for a Small City (Proj. 3-2), 82 p., $4.00
3 Improved Criteria for Traffic Signals at Individual 30 Extension of AASHO Road Test Performance Con- Intersections—Interim Report (Proj. 3-5), 36 p., cepts (Proj. 1-4(2)), 33 p., $1.60 $1.60 31 A Review of Transportation Aspects of Land-Use
4 Non-Chemical Methods of Snow and Ice Control on Control (Proj. 8-5), 41 p., $2.00 Highway Structures (Proj. 6-2), 74 p., $3.20 32 Improved Criteria for Traffic Signals at Individual
5 Effects of Different Methods of Stockpiling Aggre- Intersections (Proj. 3-5), 134 p., $5.00 gates—Interim Report (Proj. 10-3), 48 p., $2.00 33 Values of Time Savings of Commercial Vehicles
6 Means of Locating and Communicating with Dis- (Proj. 2-4), 74 p., $3.60 abled Vehicles—Interim Report (Proj. 3-4), 56 p. 34 Evaluation of Construction Control Procedures— $3.20 Interim Report (Proj. 10-2), 117 p., $5.00
7 Comparison of Different Methods of Measuring 35 Prediction of Flexible Pavement Deflections from Pavement Condition—Interim Report (Proj. 1-2), Laboratory Repeated-Load Tests (Proj. 1-3(3)), 29p., $1.80 117p., $5.00
8 Synthetic Aggregates for Highway Construction 36 Highway Guardrails—A Review of Current Practice (Proj. 4-4), 13 p., $1.00 (Proj. 15-1), 33 p., $1.60
9 Traffic Surveillance and Means of Communicating 37 Tentative Skid-Resistance Requirements for Main with Drivers—Interim Report (Proj. 3-2), 28 p., Rural Highways (Proj. 1-7), 80 p., $3.60 $1.60 38 Evaluation of Pavement Joint and Crack Sealing Ma-
10 Theoretical Analysis of Structural Behavior of Road terials and Practices (Proj. 9-3), 40 p., $2.00 Test Flexible Pavements (Proj. 1-4), 31 p., $2.80 39 Factors Involved in the Design of Asphaltic Pave-
11 Effect of Control Devices on Traffic Operations— ment Surfaces (Proj. 1-8), 112 p., $5.00 Interim Report (Proj. 3-6), 107 p., $5.80 40 Means of Locating Disabled or Stopped Vehicles
12 Identification of Aggregates Causing Poor Concrete (Proj. 3-4(1)), 40 p., $2.00 Performance When Frozen—Interim Report (Proj. 41 Effect of Control Devices on Traffic Operations 4-3(1)), 47 p., $3.00 (Proj. 3-6), 83 p., $3.60
13 Running Cost of Motor Vehicles as Affected by High- 42 Interstate Highway Maintenance Requirements and way Design—Interim Report (Proj. 2-5), 43 p., Unit Maintenance Expenditure Index (Proj. 14-1), $2.80 144 p., $5.60
14 Density aud Moisture Content Measurements by 43 Density and Moisture Content Measurements by Nuclear Methods—Interim Report (Proj. 105), Nuclear Methods (Proj. 10-5), 38 p., $2.00
15 32 p., $3.00 Identification of Concrete Aggregates Exhibiting 44 Traffic Attraction of Rural Outdoor Recreational
Frost Susceptibility—Interim Report (Proj. 4-3(2)), Areas (Proj. 7-2), 28 p., $1.40
66 p., $4.00 45 Development of Improved Pavement Marking Ma- 16 Protective Coatings to Prevent Deterioration of Con- terials—Laboratory Phase (Proj. 5-5), 24 p.,
crete by Deicing Chemicals (Proj. 6-3), 21 p., $1.40
$1.60 46 Effects of Different Methods of Stockpiling and 17 Development of Guidelines for Practical and Realis- Handling Aggregates (Proj. 10-3), 102 p.,
tic Construction Specifications (Proj. 10-1), 109 p., $4.60 $6.00 47 Accident Rates as Related to Design Elements of
18 Community Consequences of Highway Improvement Rural Highways (Proj. 2-3), 173 p., $6.40 (Proj. 2-2), 37 p., $2.80 48 Factors and Trends in Trip Lengths (Proj. 7-4),
19 Economical and Effective Deicing Agents for Use on 70 p., $3.20 Highway Structures (Proj. 6-1), 19 p., $1.20 49 National Survey of Transportation Attitudes and
Behavior—Phase I Summary Report (Proj. 20-4), * Highway Research Board Special Report 80. 71 p., $3.20

Rep. Rep. No. Title No. Title 50 Factors Influencing Safety at Highway-Rail Grade 76 Detecting Seasonal Changes in Load-Carrying Ca-
Crossings (Proj. 3-8), 113 p., $5.20 pabilities of Flexible Pavements (Proj. 1-5(2)), 51 Sensing and Communication Between Vehicles (Proj. 37 p.. $2.00
3-3), 105 p., $5.00 77 Development of Design Criteria for Safer Luminaire 52 Measurement of Pavement Thickness by Rapid and Supports (Proj. 15-6), 82 p., $3.80
Nondestructive Methods (Proj. 10-6), 82 p., 78 Highway Noise—Measurement, Simulation, and $3.80 Mixed Reactions (Proj. 3-7), 78 p., $3.20 53 Multiple Use of Lands Within Highway Rights-of- 79 Development of Improved Methods for Reduction of Way (Proj. 7-6), 68 p., $3.20 Traffic Accidents (Proj. 17-1), 163 p., $6.40 54 Location, Selection, and Maintenance of Highway 80 Oversize-Overweight Permit Operation on State High- Guardrails and Median Barriers (Proj. 15-1(2)), ways (Proj. 2-10), 120 p., $5.20 63 p., $2.60 81 Moving Behavior and Residential Choice—A Na-
55 Research Needs in Highway Transportation (Proj. tional Survey (Proj. 8-6), 129 p., $5.60 20-2), 66 p., $2.80 82 National Survey of Transportation Attitudes and
56 Scenic Easements—Legal, Administrative, and Valua- Behavior—Phase II Analysis Report (Proj. 20-4), tion Problems and Procedures (Proj. 11-3), 174 p., 89 p., $4.00 $6.40 83 Distribution of Wheel Loads on Highway Bridges
57 Factors Influencing Modal Trip Assignment (Proj. (Proj. 12-2), 56 p., $2.80 8-2), 78 p., $3.20 84 Analysis and Projection of Research on Traffic
58 Comparative Analysis of Traffic Assignment Tech- Surveillance, Communication, and Control (Proj. niques with Actual Highway Use (Proj. 7-5), 85 p., 3-9), 48 p., $2.40 $3.60 85 Development of Formed-in-Place Wet Reflective
59 Standard Measurements for Satellite Road Test Pro- Markers (Proj. 5-5), 28 p., $1.80 gram (Proj. 1-6), 78 p., $3.20 86 Tentative Service Requirements for Bridge Rail Sys-
60 Effects of Illumination on Operating Characteristics tems (Proj. 12-8), 62 p., $3.20 of Freeways (Proj. 5-2) 148 p., $6.00 87 Rules of Discovery and Disclosure in Highway Con-
61 Evaluation of Studded Tires—Performance Data and demnation Proceedings (Proj. 11-1(5)), 28 p., Pavement Wear Measurement (Proj. 1-9), 66 p., $2.00 $3.00 88 Recognition of Benefits to Remainder Property in
62 Urban Travel Patterns for Hospitals, Universities, Highway Valuation Cases (Proj. 11-1(2)), 24 p., Office Buildings, and Capitols (Proj. 7-1), 144 p., $2.00 $5.60 89 Factors, Trends, and Guidelines Related to Trip
63 Economics of Design Standards for Low-Volume Length (Proj. 7-4), 59 p., $3.20 Rural Roads (Proj. 2-6), 93 p., $4.00 90 Protection of Steel in Prestressed Concrete Bridges
64 Motorists' Needs and Services on Interstate Highways (Proj. 12-5), 86 p., $4.00 (Proj.7-7), 88p1, $3.60 91 Effects of Deicing Salts on Water Quality and Biota
65 One-Cycle Slow-Freeze Test for Evaluating Aggre- —Literature Review and Recommended Research gate Performance in Frozen Concrete (Proj. 4-3(1)), (Proj. 16-1), 70 p., $3.20 21p., $1.40 92 Valuation and Condemnation of Special Purpose
66 Identification of Frost-Susceptible Particles in Con- Properties (Proj. 11-1(6)), 47 p., $2.60 crete Aggregates (Proj. 4-3(2)), 62 p., $2.80 93 Guidelines for Medial and Marginal Access Control
67 Relation of Asphalt Rheological Properties to Pave- on Major Roadways (Proj. 3-13), 147 p., ment Durability (Proj. 9-1), 45 p., $2.20 $6.20
68 Application of Vehicle Operating Characteristics to 94 Valuation and Condemnation Problems Involving Geometric Design and Traffic Operations (Proj. 3 Trade Fixtures (Proj. 11-1(9)), 22 p., $1.80 10), 38 p., $2.00 95 Highway Fog (Proj. 5-6), 48 p., $2.40
69 Evaluation of Construction Control Procedures— 96 Strategies for the Evaluation of Alternative Trans- Aggregate Gradation Variations and Effects (Proj. portation Plans (Proj. 8-4), 111 p., $5.40 10-2A), 58 p., $2.80 97 Analysis of Structural Behavior of AASHO Road
70 Social and Economic Factors Affecting Intercity Test Rigid Pavements (Proj. 1-4(1 )A), 35 p., Travel (Proj. 8-1), 68 p., $3.00 $2.60 71 Analytical Study of Weighing Methods for Highway 98 Tests for Evaluating Degradation of Base. Course
Vehicles in Motion (Proj. 7-3), 63 p., $2.80 Aggregates (Proj. 4-2), 98 p. $5.00 72 Theory and Practice in Inverse Condemnation for 99 Visual Requirements in Night Driving (Proj. 5-3),
Five Representative States (Proj. 11-2), 44 p., 38 p., $2.60 $2.20 100 Research Needs Relating to Performance of Aggre-
73 Improved Criteria for Traffic Signal Systems on gates in Highway Construction (Proj. 4-8), 68 p., Urban Arterials (Proj. 3-5/1), 55 p., $2.80 $3.40 74 Protective Coatings for Highway Structural Steel 101 Effect of Stress on Freeze-Thaw Durability of Con-
(Proj. 4-6), 64 p., $2.80 crete Bridge Decks (Proj. 6-9), 70 p., $3.60 74A Protective Coatings for Highway Structural Steel— 102 Effect of Weldments on the Fatigue Strength of Steel
Literature Survey (Proj. 4-6), 275 p., $8.00 Beams (Proj. 12-7), 114 p., $5.40 74B Protective Coatings for Highway Structural Steel— 103 Rapid Test Methods for Field Control of Highway
Current Highway Practices (Proj. 4-6), 102 p., Construction (Proj. 10-4), 89 p., $5.00 $4.00 104 Rules of Compensability and Valuation Evidence
75 Effect of Highway Landscape Development on for Highway Land Acquisition (Proj. 11-1), Nearby Property (Proj. 2-9), 82 p., $3.60 77 p., $4.40

Rep. No. Title
105 Dynamic Pavement Loads of Heavy Highway Vehi- cles (Proj. 15-5), 94 p., $5.00
106 Revibration of Retarded Concrete for Continuous Bridge Decks (Proj. 18-1), 67 p., $3.40
107 New Approaches to Compensation for Residential Takings (Proj. 11-1(10)), 27 p., $2.40
108 Tentative Design Procedure for Riprap-Lined Chan- nels (Proj. 15-2), 'iSp., $4.00
109 Elastomeric Bearing Research (Proj. 12-9), 53 p., $3.00
110 Optimizing Street Operations Through Traffic Regu- lations and Control (Proj. 3-11), 100 p., $4.40
111 Running Costs of Motor Vehicles as Affected by Road Design and Traffic (Proj. 2-5A and 2-7), 97 p., $5.20
112 Junkyard Valuation—Salvage Industry Appraisal Principles Applicable to Highway Beautification (Proj. 11-3(2)), 41 p., $2.60
113 Optimizing Flow on Existing Street Networks (Proj. 3-14), 414 p., $15.60
114 Effects of Proposed Highway Improvements on Prop- erty Values (Proj. 11-1(1)), 42 p., $2.60
115 Guardrail Performance and Design (Proj. 15-1(2)), 70 p., $3.60
116 Structural Analysis and Design of Pipe Culverts (Proj. 15-3), 155 p., $6.40
117 Highway Noise—A Design Guide for Highway En- gineers (Proj. 3-7), 79 p., $4.60
118 Location, Selection, and Maintenance of Highway Traffic Barriers (Proj. 15-1(2)), 96 p., $5.20
119 Control of Highway Advertising Signs—Some Legal Problems (Proj. 11-3(1)), 72 p., $3.60
120 Data Requirements for Metropolitan Transportation Planning (Proj. 8-7), 90 p., $4.80
121 Protection of Highway Utility (Proj. 8-5), 115 p., $5.60
122 Summary and Evaluation of Economic Consequences of Highway Improvements (Proj. 2-11), 324 p., $13.60
123 Development of Information Requirements and Transmission Techniques for Highway Users (Proj. 3-12), 239 p., $9.60
124 Improved Criteria for Traffic Signal Systems in Urban Networks (Proj. 3-5), 86 p., $4.80
125 Optimization of Density and Moisture Content Mea-surements by Nuclear Methods (Proj. 10-5A), 86 p., $4.40
126 Divergencies in Right-of-Way Valuation (Proj. 11- 4), 57 p., $3.00
127 Snow Removal and Ice Control Techniques at Inter- changes (Proj. 6-10), 90 p., $5.20
128 Evaluation of AASHO Interim Guides for Design of Pavement Structures (Proj. 1-11), 111 p., $5.60
129 Guardrail Crash Test Evaluation—New Concepts and End Designs (Proj. 15-1(2)), 89 p., $4.80
130 Roadway Delineation Systems (Proj. 5-7), 349 p., $14.00
131 Performance Budgeting System for Highway Main- tenance Management (Proj. 19-2(4)), 213 p., $8.40
132 Relationships Between Physiographic Units and Highway Design Factors (Proj. 1-3(1)), 161 p., $7.20
Rep. No. Title
133 Procedures for Estimating Highway User Costs, Air Pollution, and Noise Effects (Proj. 7-8), 127 p., $5.60
134 Damages Due to Drainage, Runoff, Blasting, and Slides (Proj. 11-1(8)), 23 p., $2.80
135 Promising Replacements for Conventional Aggregates for Highway Use (Proj. 4-10), 53 p., $3.60
136 Estimating Peak Runoff Rates from Ungaged Small Rural Watersheds (Proj. 15-4), 85 p., $4.60
137 Roadside Development—Evaluation of Research (Proj. 16-2), 78 p., $4.20
138 Instrumentation for Measurement of Moisture—Literature Review and Recommended Research (Proj. 21-1), 60 p., $4.00
139 Flexible Pavement Design and Management—Sys- tems Formulation (Proj. 1-10), 64 p., $4.40
140 Flexible Pavement Design and Management—Ma- terials Characterization (Proj. 1-10), 118 p., $5.60
141 Changes in Legal Vehicle Weights and Dimensions—Some Economic Effects on Highways (Proj. 19-3), 184.p., $8.40
142 Valuation of Air Space (Proj. 11-5), 48 p., $4.00
143 Bus Use of Highways—State of the Art (Proj. 8-10), 406 p., $16.00
144 Highway Noise—A Field Evaluation of Traffic Noise Reduction Measures (Proj. 3-7), 80 p., $4.40
145 Improving Traffic Operations and Safety at Exit Gore Areas (Proj. 3-17) 120 p., $6.00
146 Alternative Multimodal Passenger Transportation Systems—Comparative Economic Analysis (Proj. 8-9), 68 p., $4.00
147 Fatigue Strength of Steel Beams with Welded Stiff- eners and Attachments (Proj. 12-7), 85 p., $4.80

Syntiesis of Highway Practice
No. Title 1 Traffic Control for Freeway Maintenance (Proj. 20-5,
Topic 1), 47 p., $2.20 2 Bridge Approach Design and Construction Practices
(Proj. 20-5, Topic 2), 30 p., $2.00 3 Traffic-Safe and Hydraulically Efficient Drainage
Practice (Proj. 20-5, Topic 4), 38 p., $2.20 4 Concrete Bridge Deck Durability (Proj. 20-5, Topic
3), 28 p., $2.20 S Scour at Bridge Waterways (Proj. 20-5, Topic 5),
37 p., $2.40 6 Principles of Project Scheduling and Monitoring
(Proj. 20-5, Topic 6), 43 p., $2.40 7 Motorist Aid Systems (Proj. 20-5, Topic 3-01);
28 p., $2.40 8 Construction of Embankments (Proj. 20-5, Topic 9),
38 p., $2.40 9 Pavement Rehabilitation—Materials and Techniques
(Proj. 20-5, Topic 8), 41 p., $2.80 10 Recruiting, Training, and Retaining Maintenance and
Equipment Personnel (Proj. 20-5, Topic 10), 35 p., $2.80
11 Development of Management Capability (Proj. 20-5, Topic 12), Sop., $3.20
12 Telecommunications Systems for Highway Admin-istration and Operations (Proj. 20-5, Topic 3-03), 29 p., $2.80
13 Radio Spectrum Frequency Management (Proj. 20-5, Topic 3-03), 32 p., $2.80
14 Skid Resistance (Proj. 20-5, Topic 7), 66 p., $4.00
15 Statewide Trahsportation Planning—Needs and Re- quirements (Proj. 20-5, Topic 3-02), 41 p., $3.60
16 Continuously Reinforced Concrete Pavement (Proj. 20-5, Topic 3-08), 23 p., $2.80
17 Pavement Traffic Marking—Materials and Applica-tion Affecting Serviceability (Proj. 20-5, Topic 3- 05), 44 p., $3.60
18 Erosion Control on Highway Construction (Proj. 20-5, Topic 4-01), 52 p., $4.00
19 Design, Construction, and Maintenance of PCC Pavement Joints (Proj. 20-5, Topic 3-04), 40 p., $3.60
20 Rest Areas (Proj. 20-5, Topic 4-04), 38 p.. $3.60
21 Highway Location Reference Methods (Proj. 20-5, Topic 4-06), 30 p., $3.20
22 Maintenance Management of Traffic Signal Equip- ment and Systems (Proj. 20-5, Topic 4-03) 41 p., $4.00
23 Getting Research Findings into Practice (Proj. 20-5, Topic 11) 24 p., $3.20

THE TRANSPORTATION RESEARCH BOARD is an agency of the National Research Council, which serves the National Academy of Sciences and the National Academy of Engineering. The Board's purpose is to. stimulate research concerning the nature and performance of transportation systems, to disseminate information that the research produces, and to encourage the application of appropriate research findings. The Board's program is carried out by more than 150 committees and task forces composed of more than 1,800 administrators, engineers, social scientists, and educators who serve without compensation. The program is supported by state transportation and highway departments, the U.S. Department of Transportation, and other organizations interested in the development of transportation.
The Transportation Research Board operates within the Division of Engineering of the National Research Council. The Council was organized in 1916 at the request of President Woodrow Wilson as an agency of the National Academy of Sciences to enable the broad community of scientists and engineers to associate their efforts with those of the Academy membership. Members of the Council are appointed by the president of the Academy and are drawn from academic, industrial, and governmental organizations throughout the United States.
The National Academy of Sciences was established by a congressional act of incorpo-ration signed by President Abraham Lincoln on March 3, 1863, to further science and its use for the general welfare by bringing together the most qualified individuals to deal with scientific and technological problems of broad significance. It is a private, honorary organization of more than 1,000 scientists elected on the basis of outstanding contribu-tions to knowledge and is supported by private and public funds. Under the terms of its congressional charter, the Academy is called upon to act as an official—yet indepen-dent—advisor to the federal government in any matter of science and technology, although it is not a government agency and its activities are not limited to those on behalf of the government.
To share in the tasks of furthering science and engineering and of advising the federal government, the National Academy of Engineering was established on December 5, 1964, under the authority of the act of incorporation of the National Academy of Sciences. Its advisory activities are closely coordinated with those of the National Academy of Sciences, but it is independent and autonomous in its organization and election of members.

TRANSPORTATION RESEARCH BOARD National Research Council
2101 Constitution Avenue, N.W. Washington, D.C. 20418
ADDRESS CORRECTION REQUESTED
NON-PROFIT ORG.
U.S. POSTAGE
PAID
WASHINGTON, D.C.
PERMIT NO. 42970
1)
'4
I U- 00' N
ou I.-- '-4Z ow. w Z. UUJ 0
00 I 0'-'
oco .0