Fatigue properties of railway axles: new results of full...
41
Fatigue properties of railway axles: new results of full-scale specimens Steven Cervello Lucchini RS, Italy TC24 Meeting – Advances in: “Axle Durability Analysis and Maintenance” Politecnico di Milano 1-2 October 2014
Transcript of Fatigue properties of railway axles: new results of full...
Fatigue properties of railway axles:
new results of full-scale specimens
Steven Cervello
Lucchini RS, Italy
TC24 Meeting – Advances in: “Axle Durability Analysis and Maintenance”
Politecnico di Milano 1-2 October 2014
2
Summary
● A common procedure to test full scale axles in order to achieve
comparable results
● Axle body fatigue limit of standard materials (average value and standard
deviation)
● Effect of surface corrosion when axles are in service without coating
● Effect of specific surface finishing that improves coating adhesion
● Effect of typical grove geometries used in powered axles
● Stress concentration profile along axle transitions and validation of FEM
numerical models
● Press-fitted seats fretting-fatigue limit of standard materials (average
value and standard deviation)
● Identification of possible changes to the European Standards
3
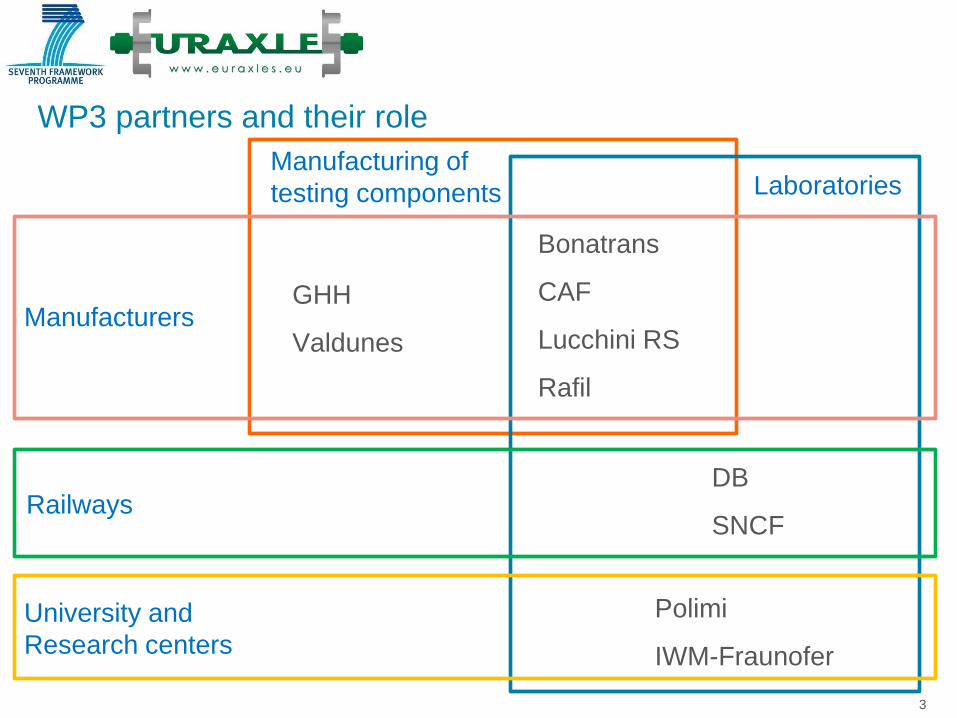
WP3 partners and their role
Bonatrans
CAF
Lucchini RS
Rafil
Manufacturers
GHH
Valdunes
Manufacturing of
testing components Laboratories
DB
SNCF Railways
University and
Research centers
Polimi
IWM-Fraunofer
4
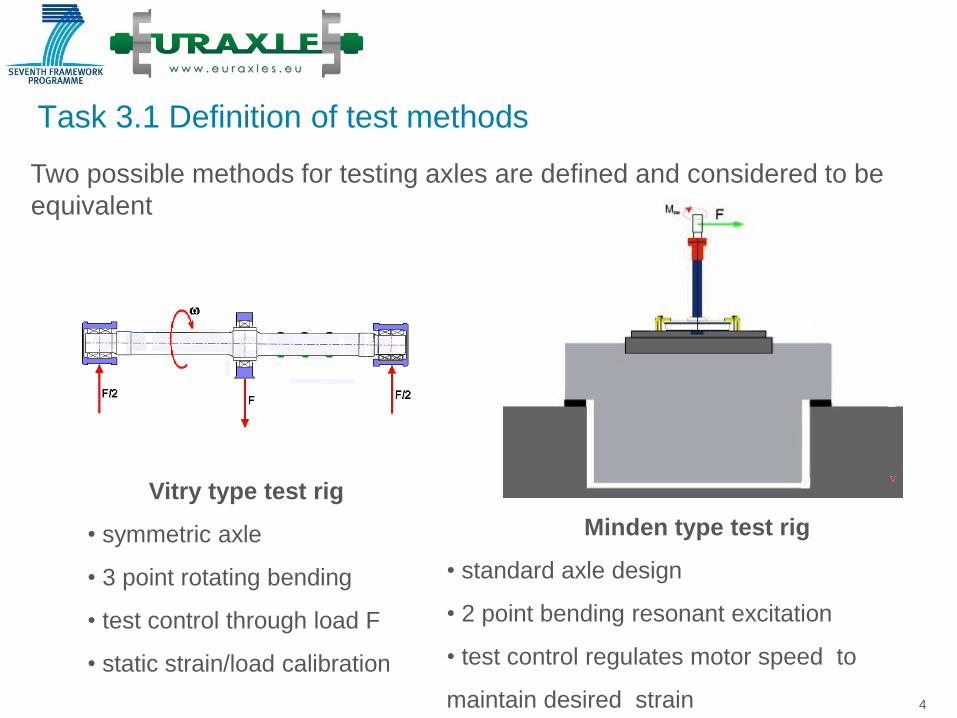
Task 3.1 Definition of test methods
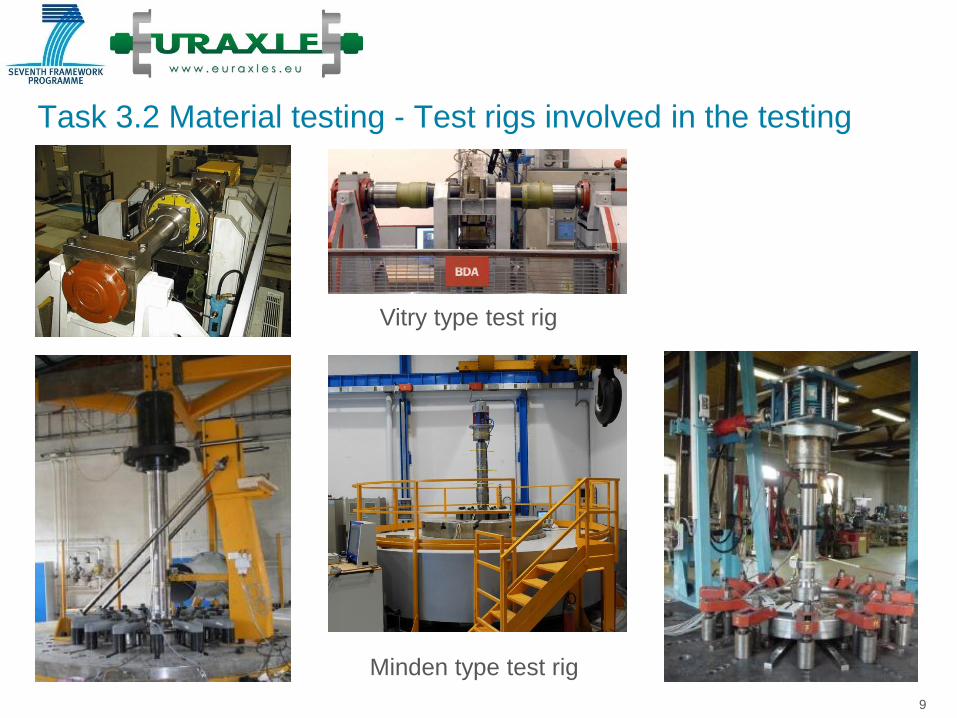
Two possible methods for testing axles are defined and considered to be
equivalent
Vitry type test rig
• symmetric axle
• 3 point rotating bending
• test control through load F
• static strain/load calibration
Minden type test rig
• standard axle design
• 2 point bending resonant excitation
• test control regulates motor speed to
maintain desired strain
5
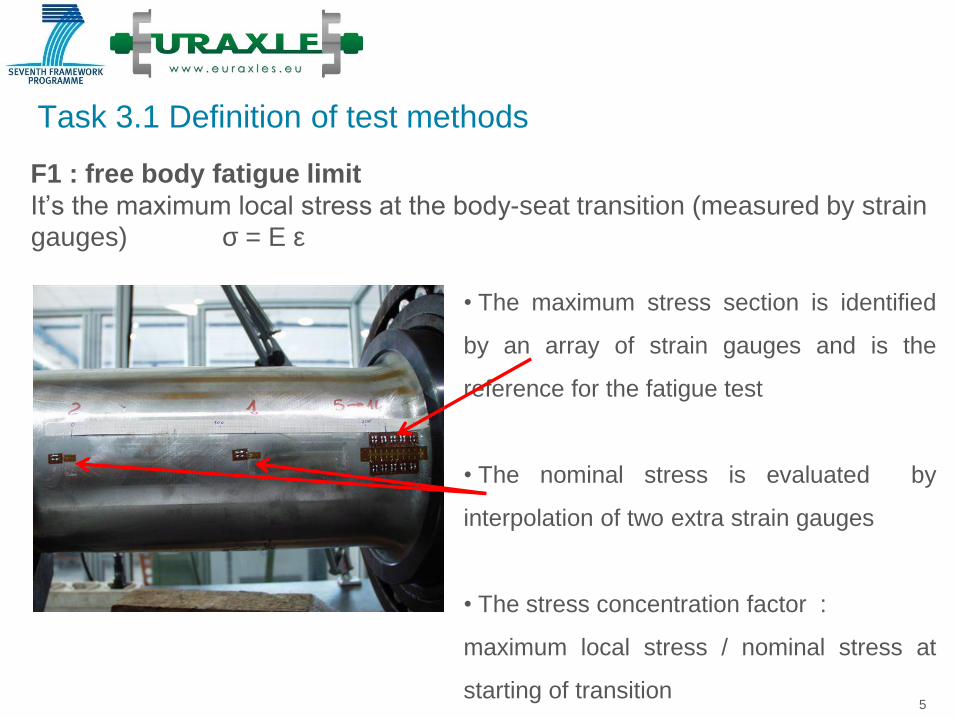
Task 3.1 Definition of test methods
F1 : free body fatigue limit
It’s the maximum local stress at the body-seat transition (measured by strain
gauges) s = E e
• The maximum stress section is identified
by an array of strain gauges and is the
reference for the fatigue test
• The nominal stress is evaluated by
interpolation of two extra strain gauges
• The stress concentration factor :
maximum local stress / nominal stress at
starting of transition
6
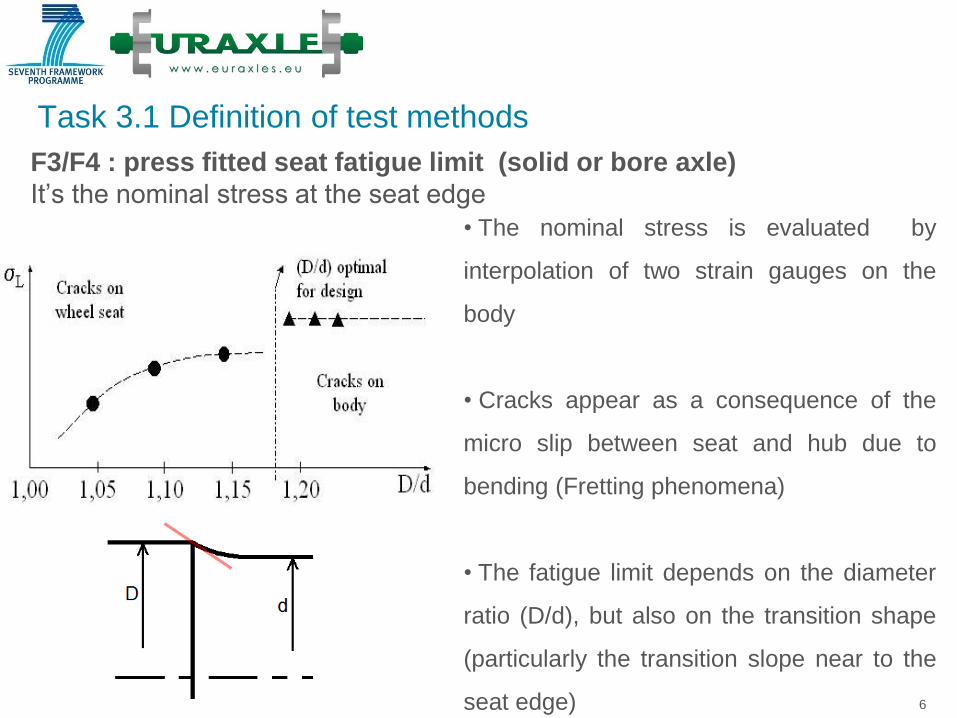
Task 3.1 Definition of test methods
F3/F4 : press fitted seat fatigue limit (solid or bore axle)
It’s the nominal stress at the seat edge
• The nominal stress is evaluated by
interpolation of two strain gauges on the
body
• Cracks appear as a consequence of the
micro slip between seat and hub due to
bending (Fretting phenomena)
• The fatigue limit depends on the diameter
ratio (D/d), but also on the transition shape
(particularly the transition slope near to the
seat edge)
7
Task 3.1 Definition of test methods
Determination of the fatigue limit:
• Stair case method is applied to determine load steps and sequences
• The statistical evaluation of the fatigue limit is done through the
“Maximum Likelihood Method” (that can be applied when the load steps
are not constant) providing the average fatigue limit and it standard
deviation.
8
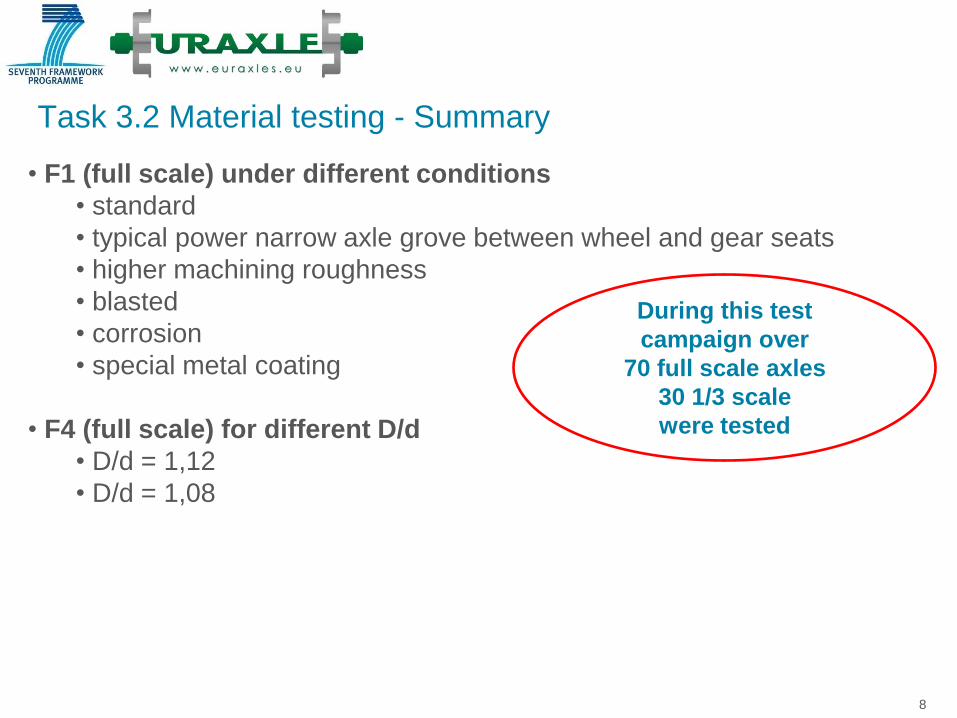
Task 3.2 Material testing - Summary
• F1 (full scale) under different conditions
• standard
• typical power narrow axle grove between wheel and gear seats
• higher machining roughness
• blasted
• corrosion
• special metal coating
• F4 (full scale) for different D/d
• D/d = 1,12
• D/d = 1,08
During this test
campaign over
70 full scale axles
30 1/3 scale
were tested
9
Task 3.2 Material testing - Test rigs involved in the testing
Minden type test rig
Vitry type test rig
10
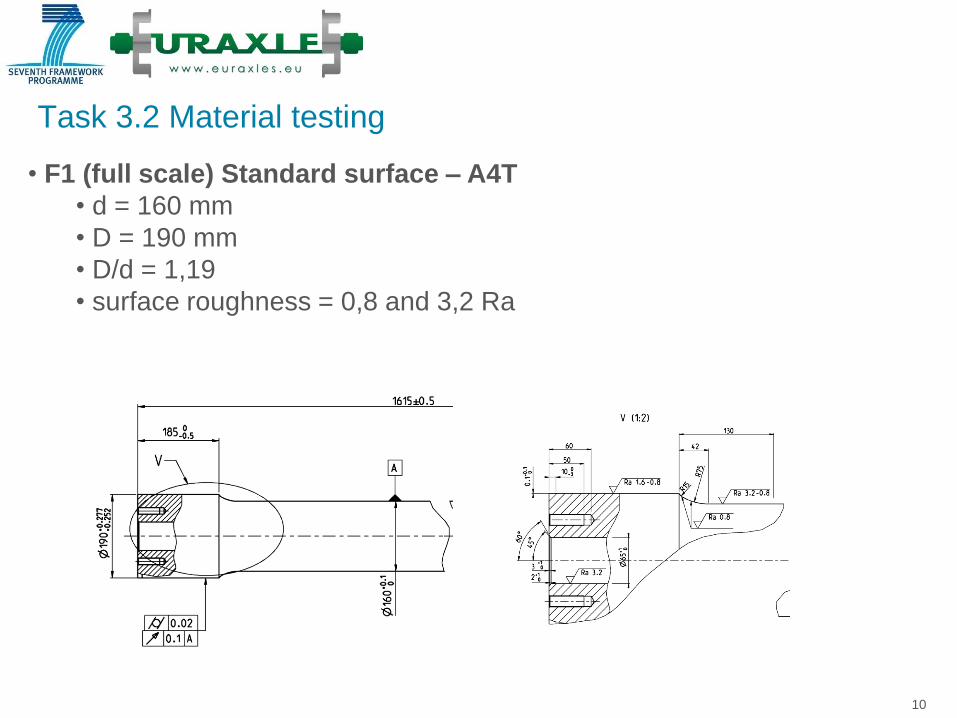
Task 3.2 Material testing
• F1 (full scale) Standard surface – A4T
• d = 160 mm
• D = 190 mm
• D/d = 1,19
• surface roughness = 0,8 and 3,2 Ra

11
Task 3.2 Material testing
• F1 (full scale) Powered axles – A4T
• Narrow grove between wheel and gear
• The grove is designed deep in order to get a crack in the grove rather
than in the seat
12
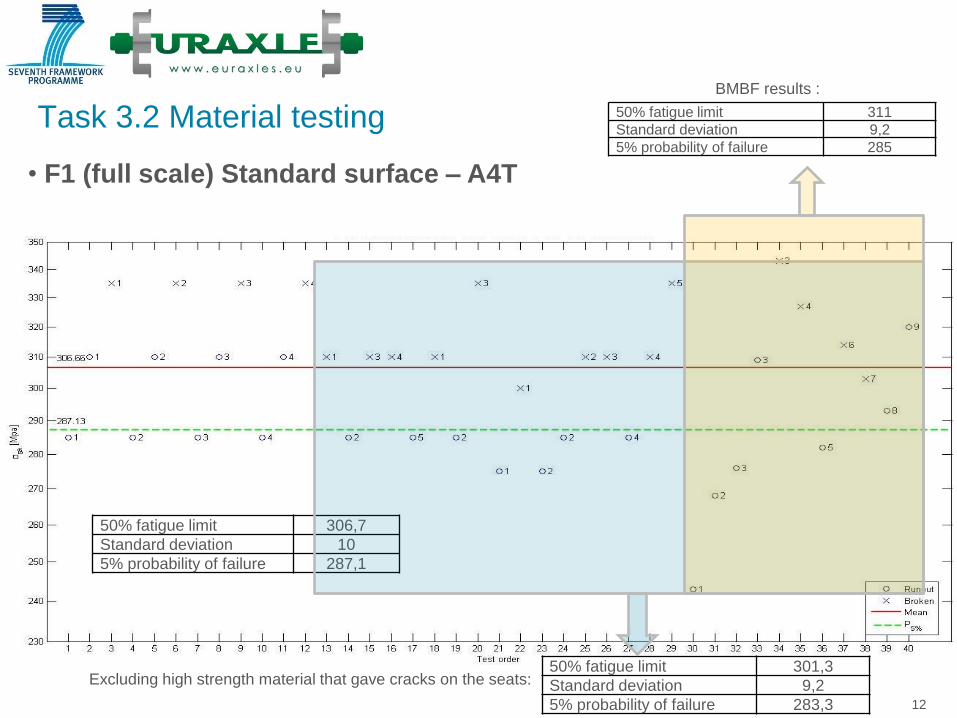
Task 3.2 Material testing
• F1 (full scale) Standard surface – A4T
50% fatigue limit 306,7
Standard deviation 10
5% probability of failure 287,1
50% fatigue limit 301,3
Standard deviation 9,2
5% probability of failure 283,3
50% fatigue limit 311
Standard deviation 9,2
5% probability of failure 285
Excluding high strength material that gave cracks on the seats:
BMBF results :
13
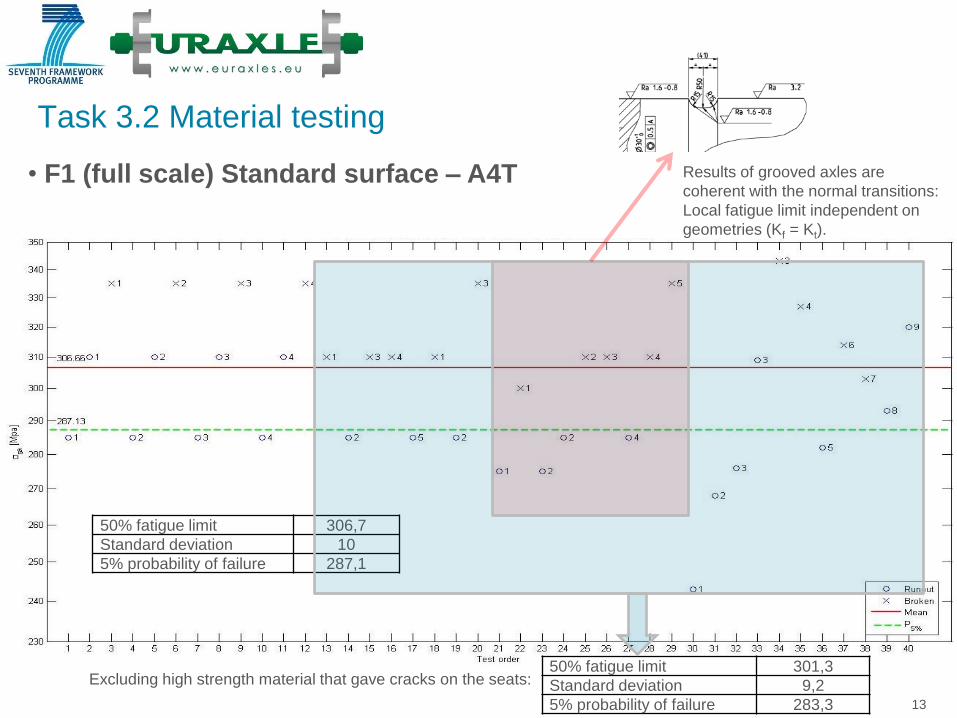
Task 3.2 Material testing
• F1 (full scale) Standard surface – A4T
50% fatigue limit 306,7
Standard deviation 10
5% probability of failure 287,1
50% fatigue limit 301,3
Standard deviation 9,2
5% probability of failure 283,3
Excluding high strength material that gave cracks on the seats:
Results of grooved axles are
coherent with the normal transitions:
Local fatigue limit independent on
geometries (Kf = Kt).
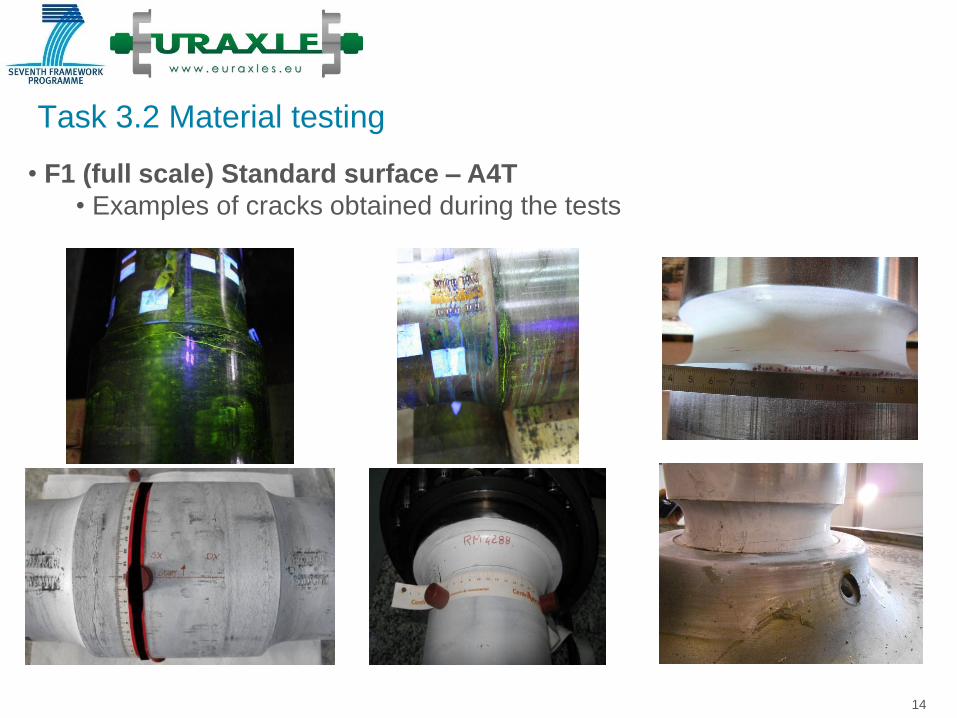
14
Task 3.2 Material testing
• F1 (full scale) Standard surface – A4T
• Examples of cracks obtained during the tests
15
Task 3.2 Material testing
• F1 (full scale) Standard surface – A4T
16
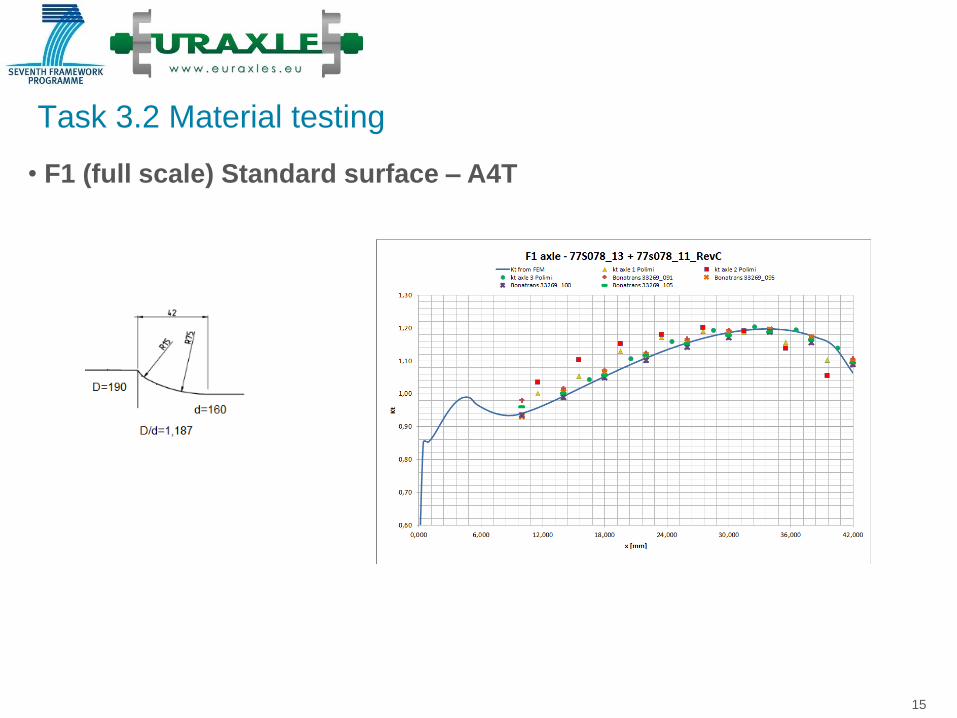
Task 3.2 Material testing
• F1 (full scale) Standard surface – A4T
• Stress concentration in the transitions
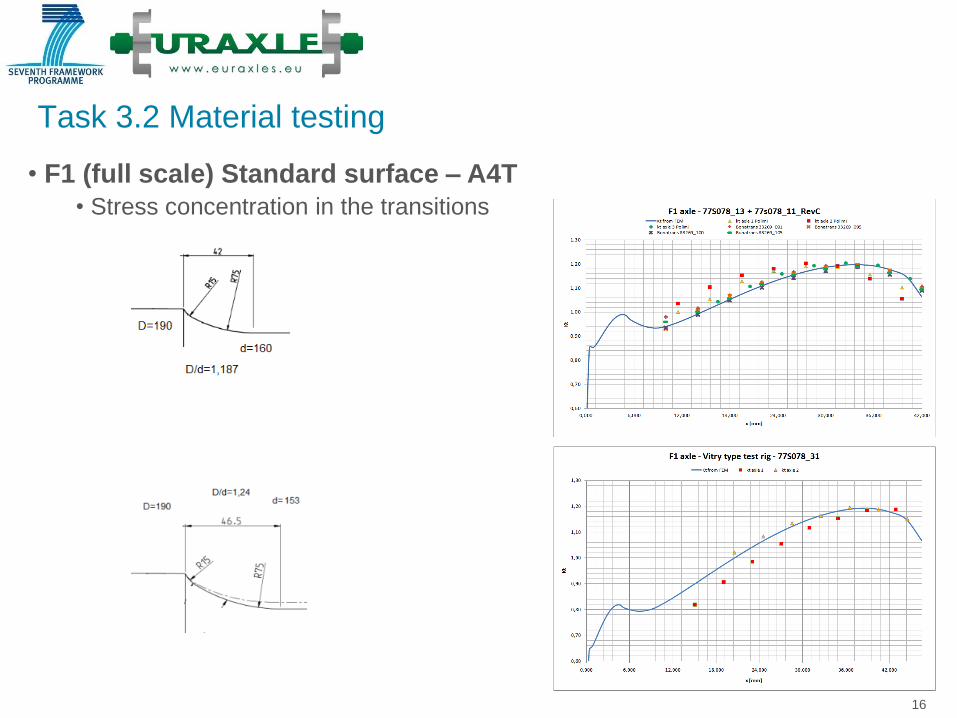
17
Task 3.2 Material testing
• F1 (full scale) Standard surface – A4T
• Stress concentration in the transitions
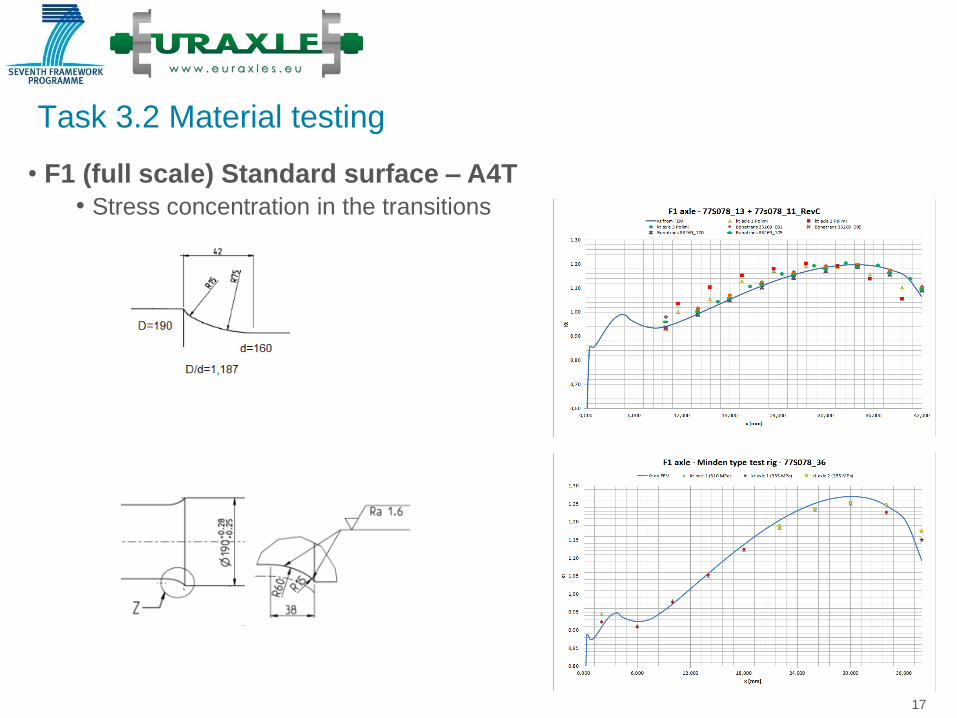
18
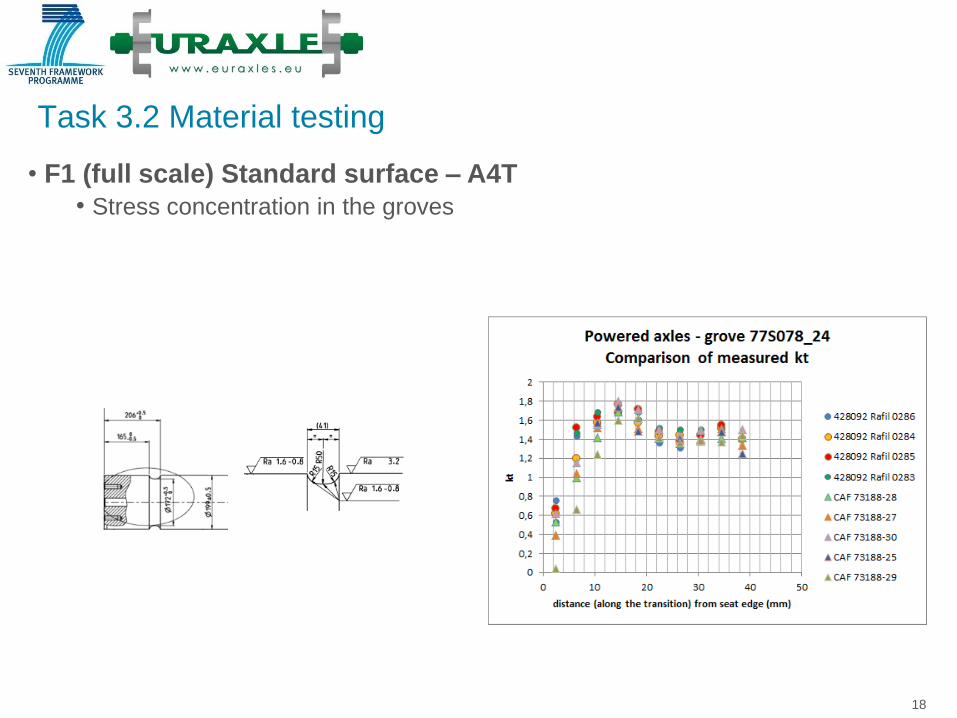
Task 3.2 Material testing
• F1 (full scale) Standard surface – A4T
• Stress concentration in the groves
19
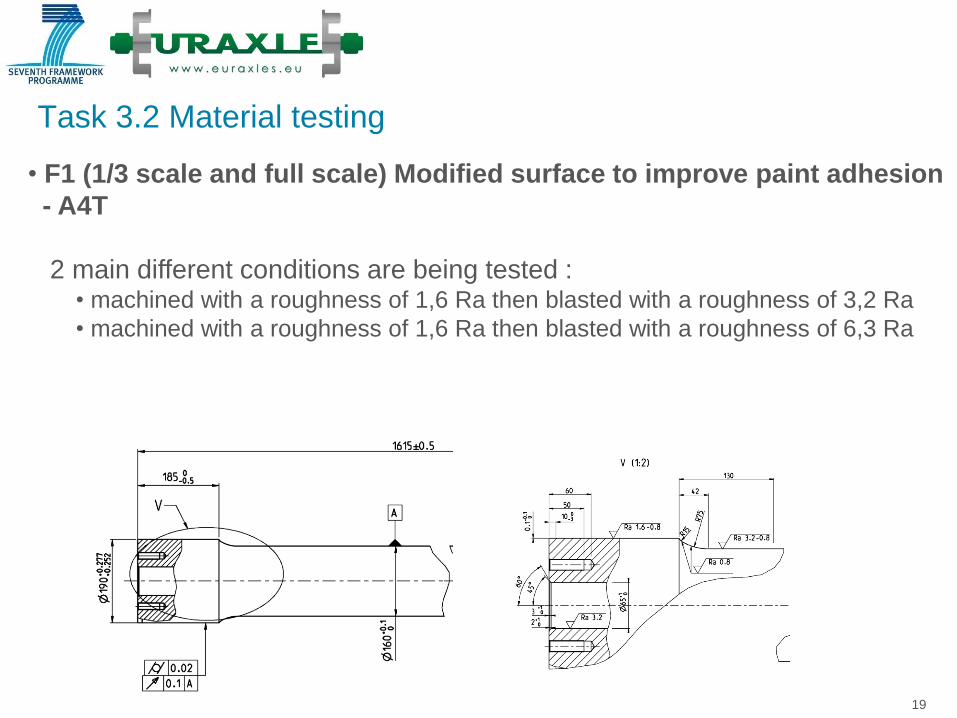
Task 3.2 Material testing
• F1 (1/3 scale and full scale) Modified surface to improve paint adhesion
- A4T
2 main different conditions are being tested : • machined with a roughness of 1,6 Ra then blasted with a roughness of 3,2 Ra
• machined with a roughness of 1,6 Ra then blasted with a roughness of 6,3 Ra

20
Task 3.2 Material testing
• F1 (1/3 scale A4T) Modified surface to improve paint adhesion
• Results of 1/3 scale blasted surface (3,2 Ra) EA4T axles; average fatigue limit = 340 MPa
21
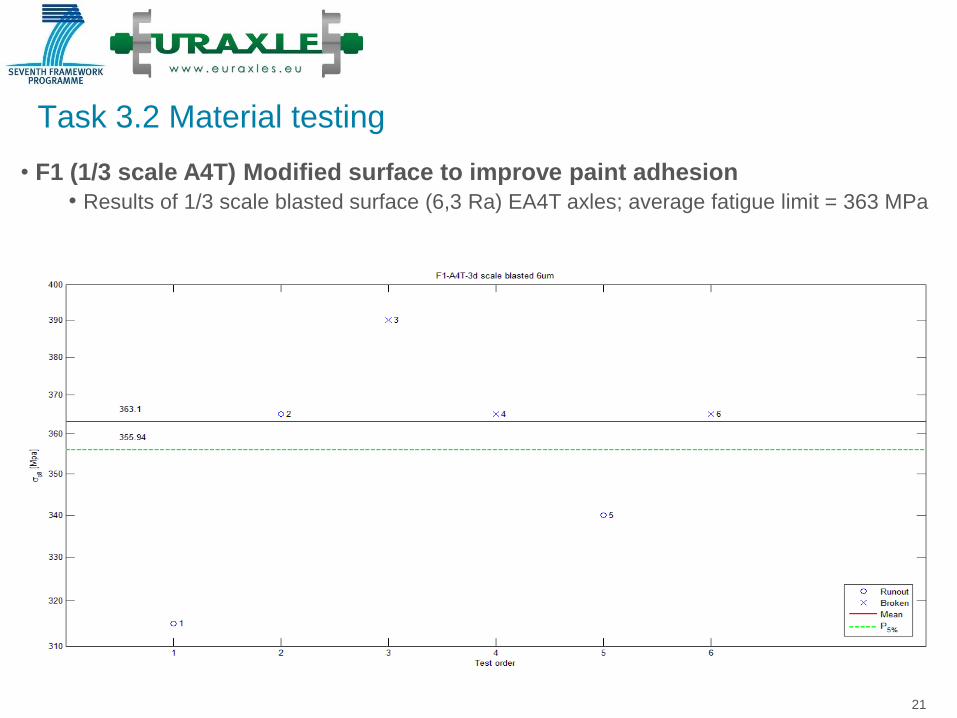
Task 3.2 Material testing
• F1 (1/3 scale A4T) Modified surface to improve paint adhesion
• Results of 1/3 scale blasted surface (6,3 Ra) EA4T axles; average fatigue limit = 363 MPa
22
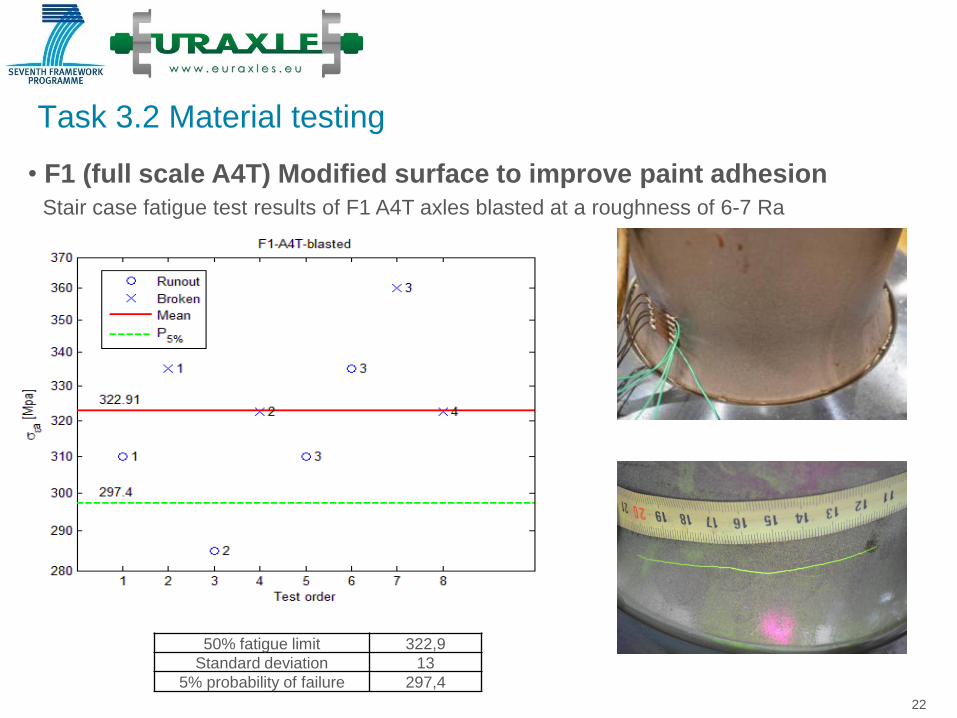
Task 3.2 Material testing
• F1 (full scale A4T) Modified surface to improve paint adhesion
Stair case fatigue test results of F1 A4T axles blasted at a roughness of 6-7 Ra
50% fatigue limit 322,9
Standard deviation 13
5% probability of failure 297,4

23
Task 3.2 Material testing
• F1 (1/3 scale and full scale A4T) Modified surface to improve paint
adhesion
Increase of the fatigue limit is probably due to the compressive stresses
generated by the blasting process
24
Task 3.2 Material testing
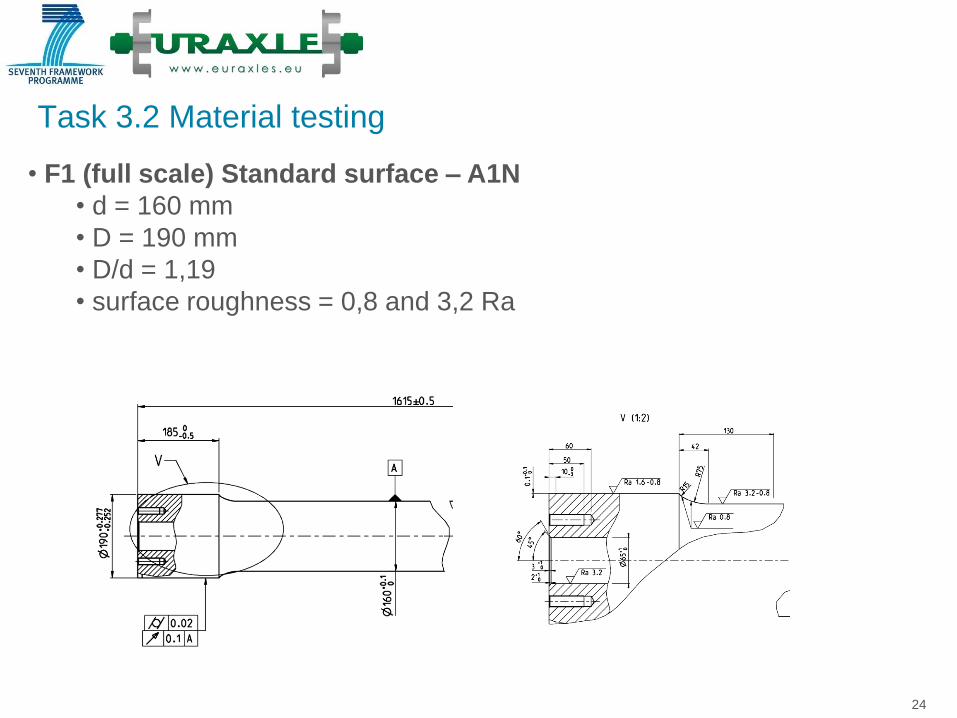
• F1 (full scale) Standard surface – A1N
• d = 160 mm
• D = 190 mm
• D/d = 1,19
• surface roughness = 0,8 and 3,2 Ra
25
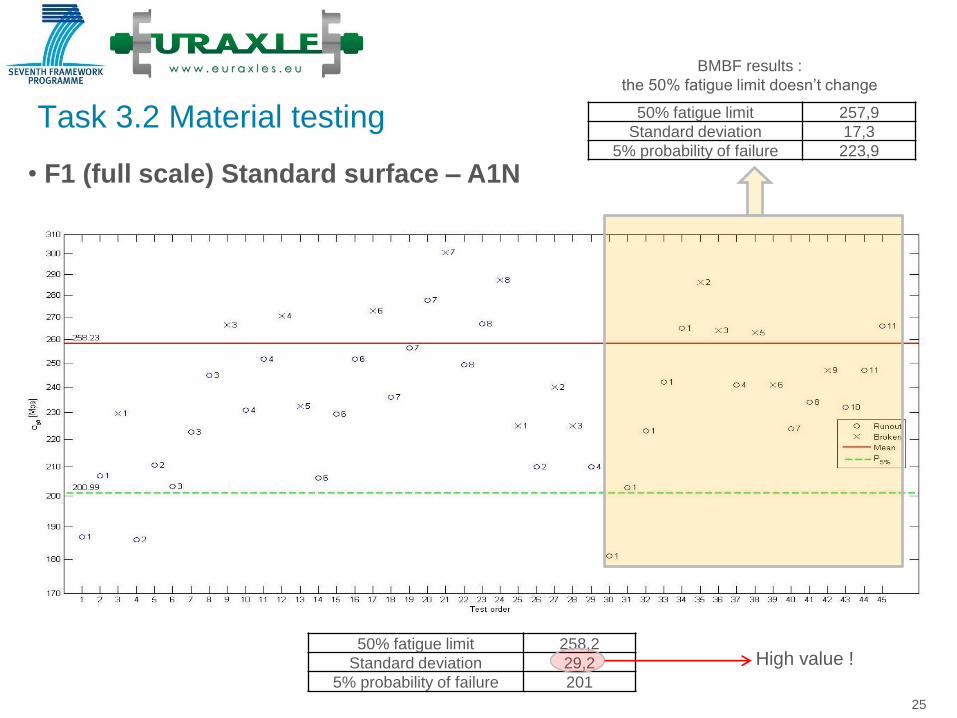
Task 3.2 Material testing
• F1 (full scale) Standard surface – A1N
50% fatigue limit 258,2
Standard deviation 29,2
5% probability of failure 201
High value !
50% fatigue limit 257,9
Standard deviation 17,3
5% probability of failure 223,9
BMBF results :
the 50% fatigue limit doesn’t change
26
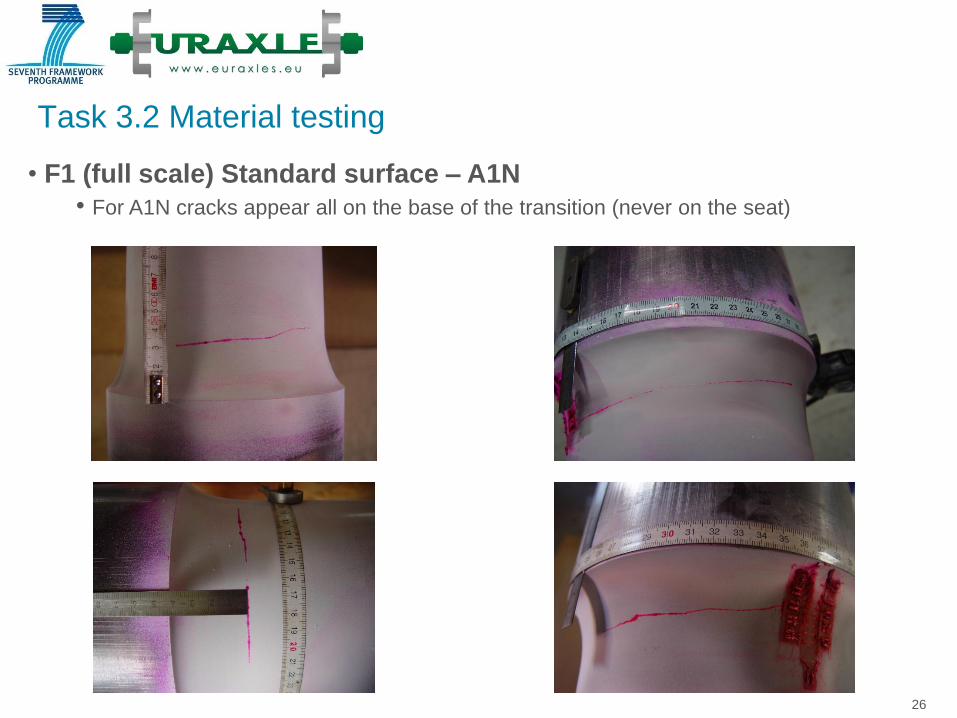
Task 3.2 Material testing
• F1 (full scale) Standard surface – A1N
• For A1N cracks appear all on the base of the transition (never on the seat)
27
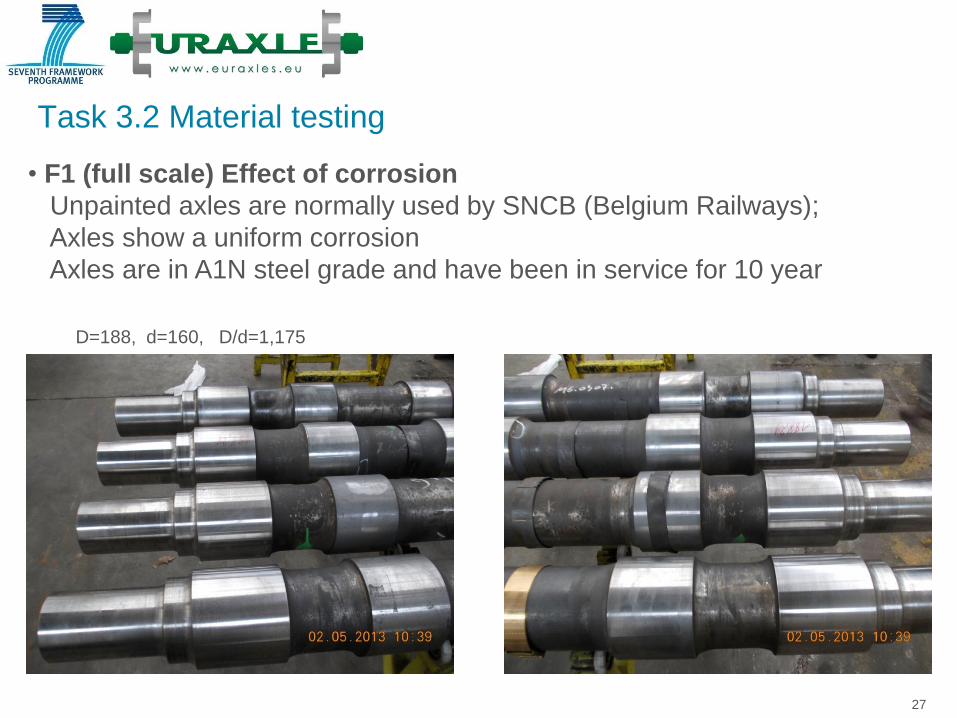
Task 3.2 Material testing
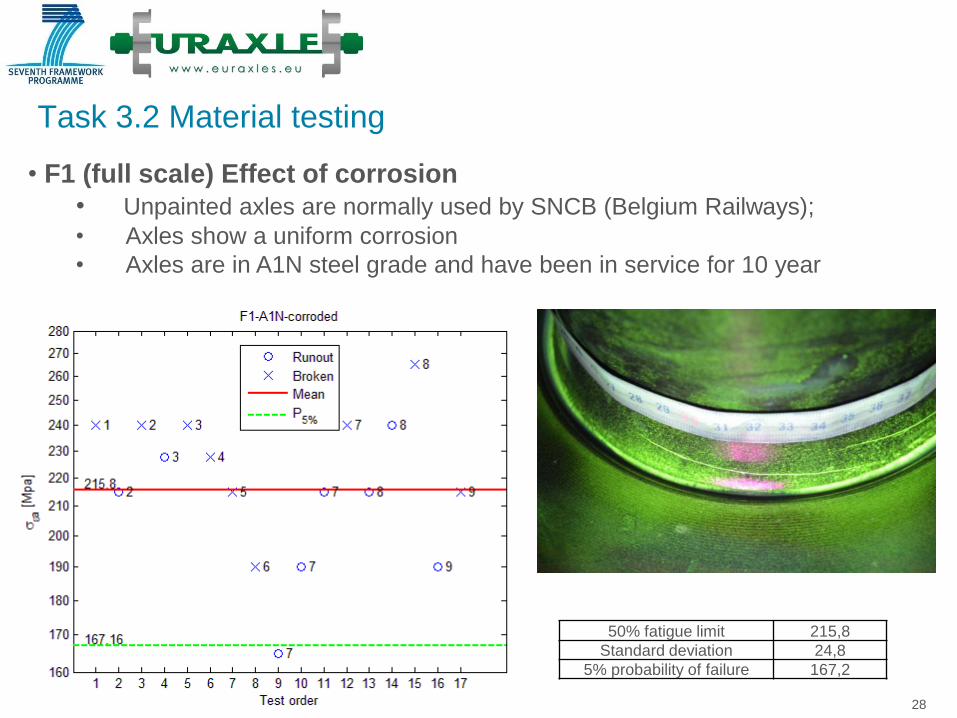
• F1 (full scale) Effect of corrosion
Unpainted axles are normally used by SNCB (Belgium Railways);
Axles show a uniform corrosion
Axles are in A1N steel grade and have been in service for 10 year
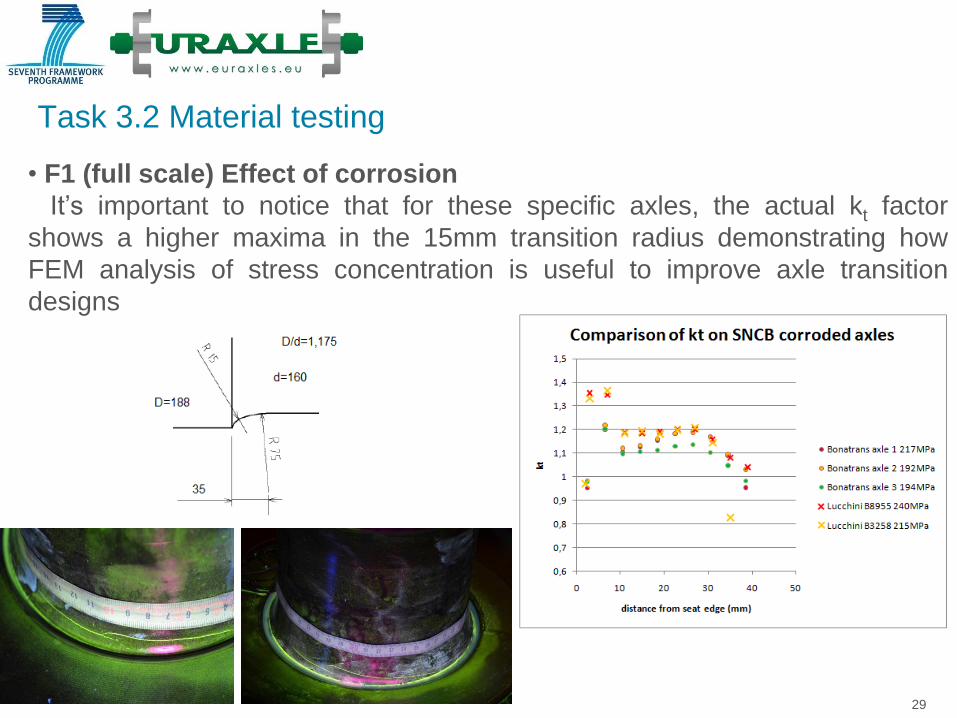
D=188, d=160, D/d=1,175
28
Task 3.2 Material testing
• F1 (full scale) Effect of corrosion
• Unpainted axles are normally used by SNCB (Belgium Railways);
• Axles show a uniform corrosion
• Axles are in A1N steel grade and have been in service for 10 year
50% fatigue limit 215,8
Standard deviation 24,8
5% probability of failure 167,2
29
Task 3.2 Material testing
• F1 (full scale) Effect of corrosion
It’s important to notice that for these specific axles, the actual kt factor
shows a higher maxima in the 15mm transition radius demonstrating how
FEM analysis of stress concentration is useful to improve axle transition
designs
30
Task 3.2 Material testing
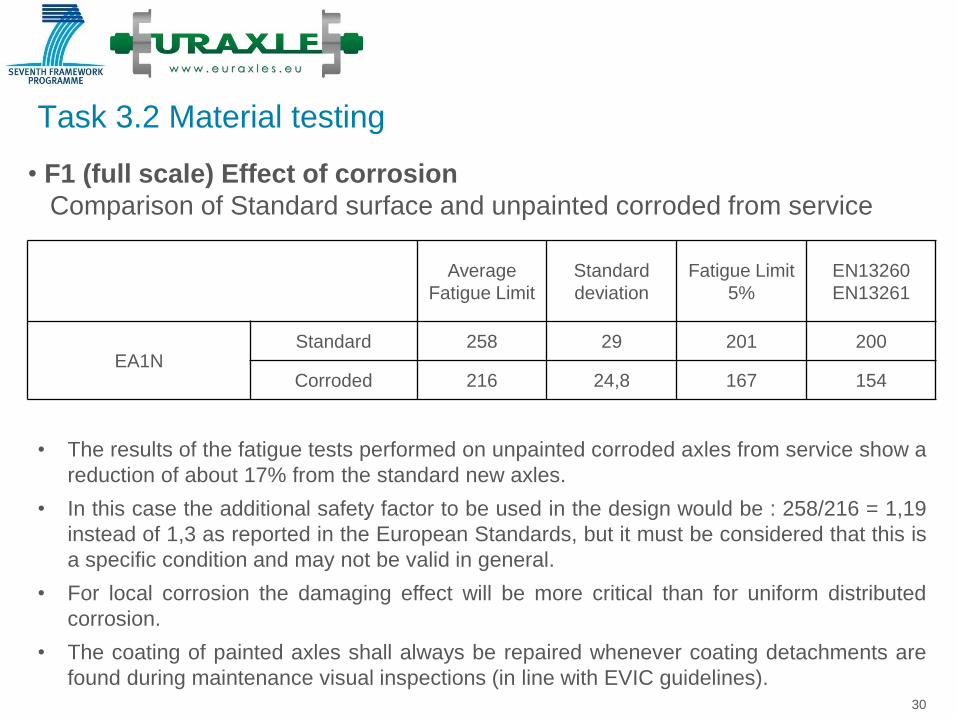
• F1 (full scale) Effect of corrosion
Comparison of Standard surface and unpainted corroded from service
Average
Fatigue Limit
Standard
deviation
Fatigue Limit
5%
EN13260
EN13261
EA1N Standard 258 29 201 200
Corroded 216 24,8 167 154
• The results of the fatigue tests performed on unpainted corroded axles from service show a
reduction of about 17% from the standard new axles.
• In this case the additional safety factor to be used in the design would be : 258/216 = 1,19
instead of 1,3 as reported in the European Standards, but it must be considered that this is
a specific condition and may not be valid in general.
• For local corrosion the damaging effect will be more critical than for uniform distributed
corrosion.
• The coating of painted axles shall always be repaired whenever coating detachments are
found during maintenance visual inspections (in line with EVIC guidelines).
31
Task 3.2 Material testing
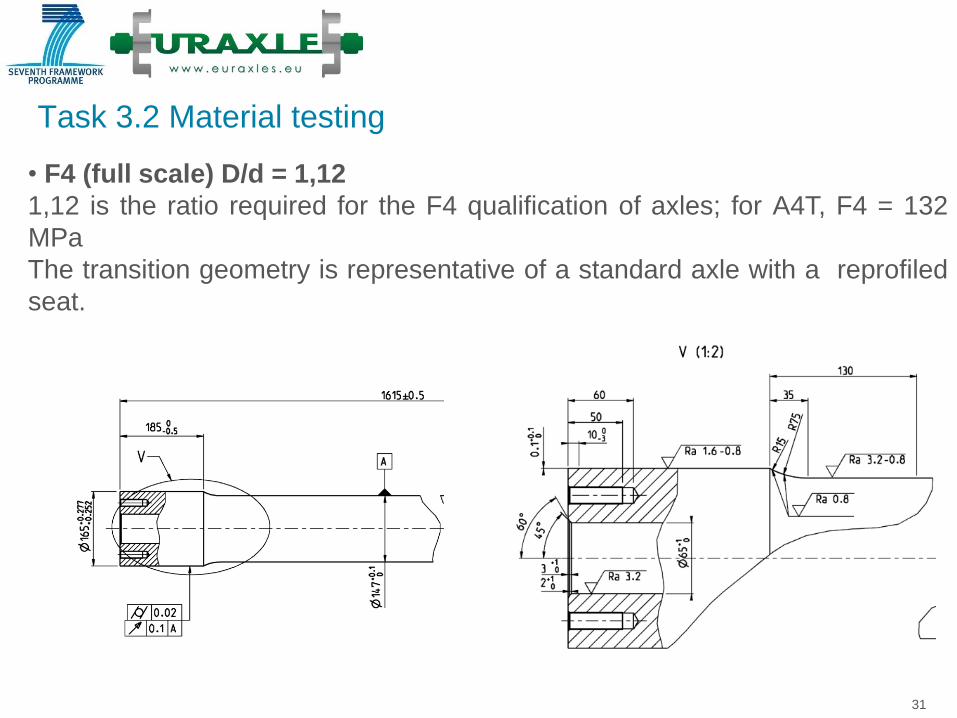
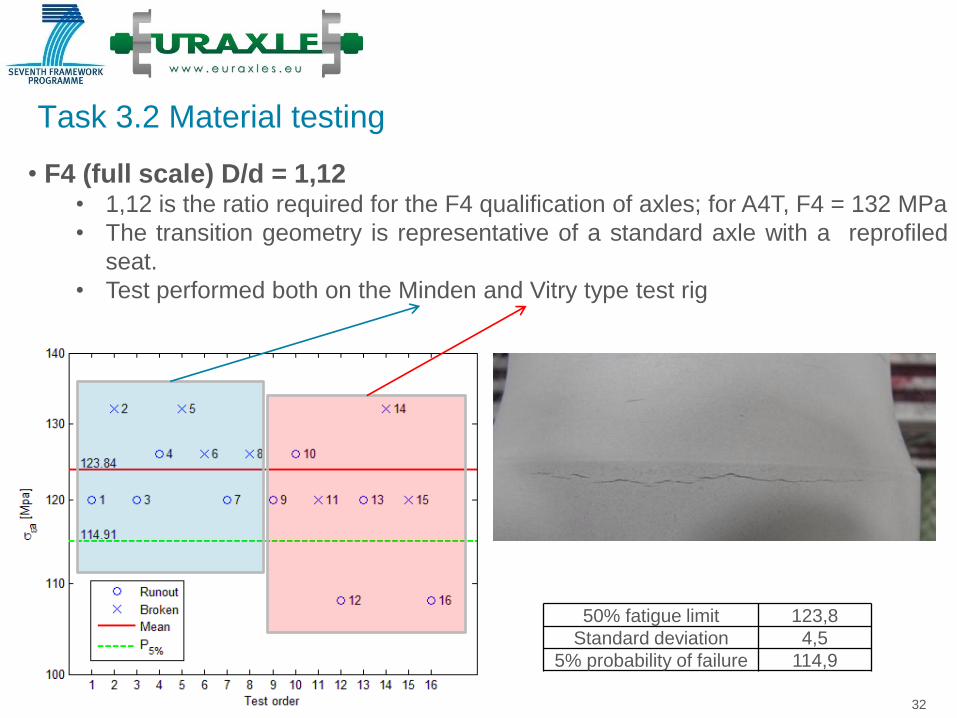
• F4 (full scale) D/d = 1,12
1,12 is the ratio required for the F4 qualification of axles; for A4T, F4 = 132
MPa
The transition geometry is representative of a standard axle with a reprofiled
seat.
32
Task 3.2 Material testing
• F4 (full scale) D/d = 1,12 • 1,12 is the ratio required for the F4 qualification of axles; for A4T, F4 = 132 MPa
• The transition geometry is representative of a standard axle with a reprofiled
seat.
• Test performed both on the Minden and Vitry type test rig
50% fatigue limit 123,8
Standard deviation 4,5
5% probability of failure 114,9
33
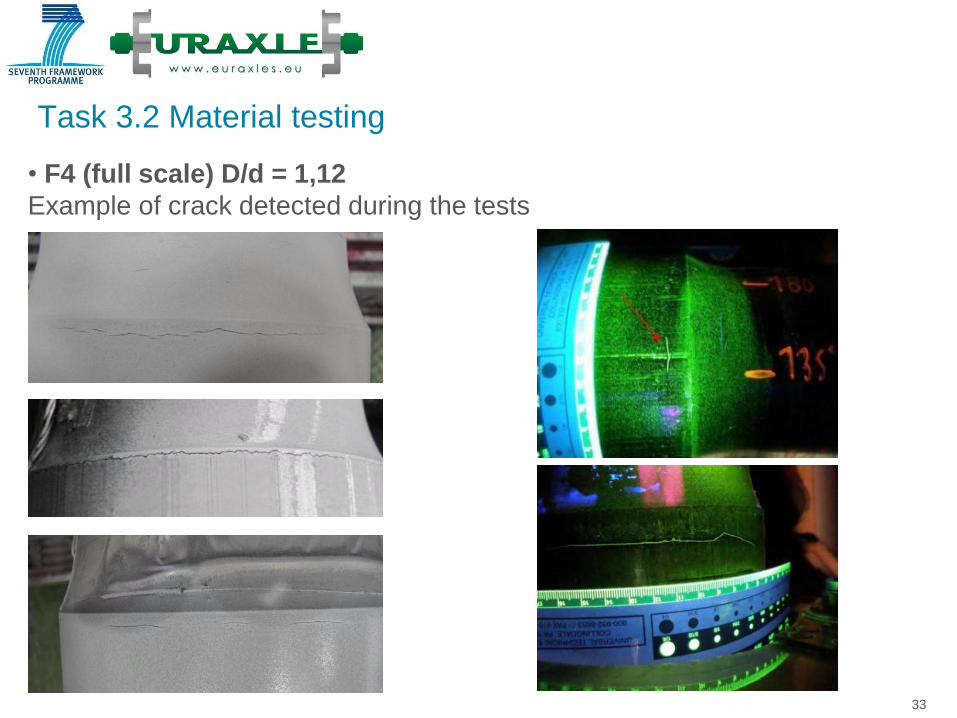
Task 3.2 Material testing
• F4 (full scale) D/d = 1,12
Example of crack detected during the tests
34
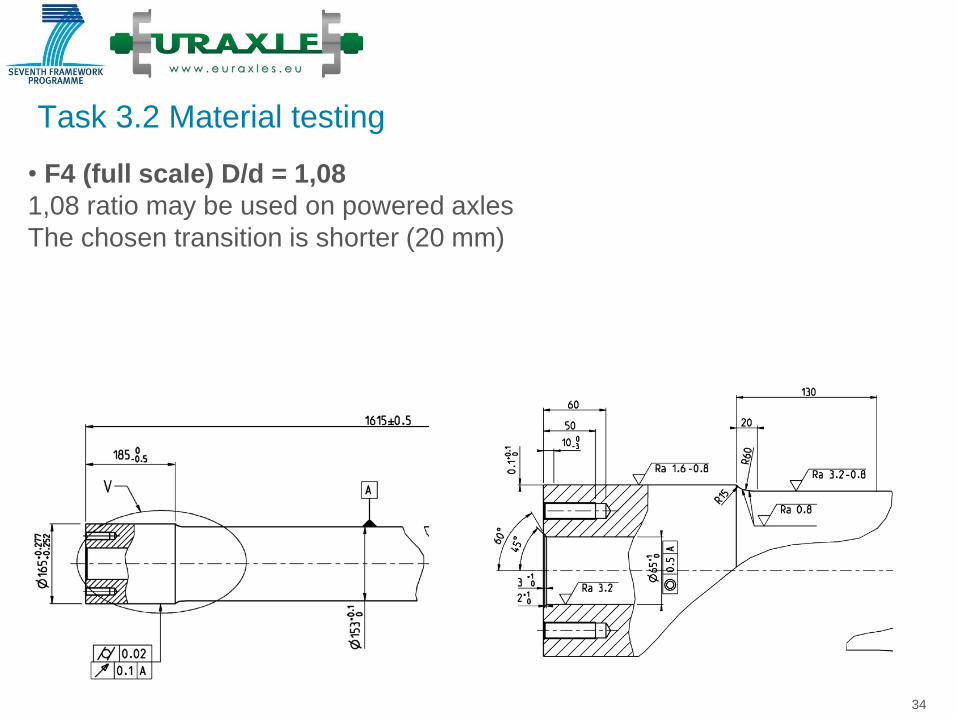
Task 3.2 Material testing
• F4 (full scale) D/d = 1,08
1,08 ratio may be used on powered axles
The chosen transition is shorter (20 mm)
35
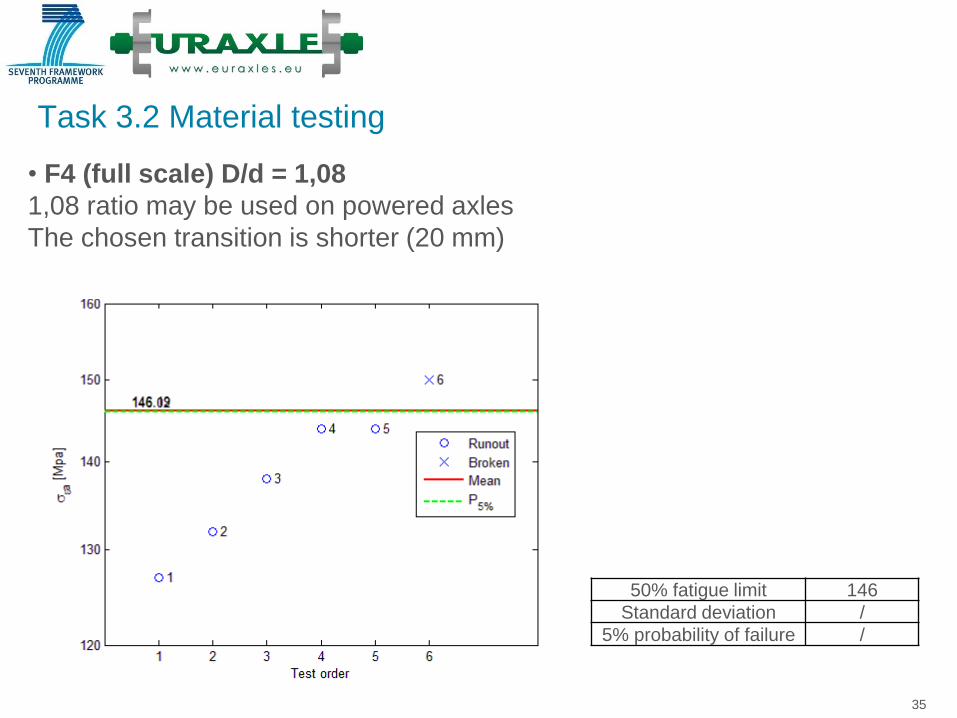
Task 3.2 Material testing
• F4 (full scale) D/d = 1,08
1,08 ratio may be used on powered axles
The chosen transition is shorter (20 mm)
50% fatigue limit 146
Standard deviation /
5% probability of failure /

• F4 (full scale) comparison between D/d = 1,12 and 1,08 • Stress concentration factors along the transitions
37
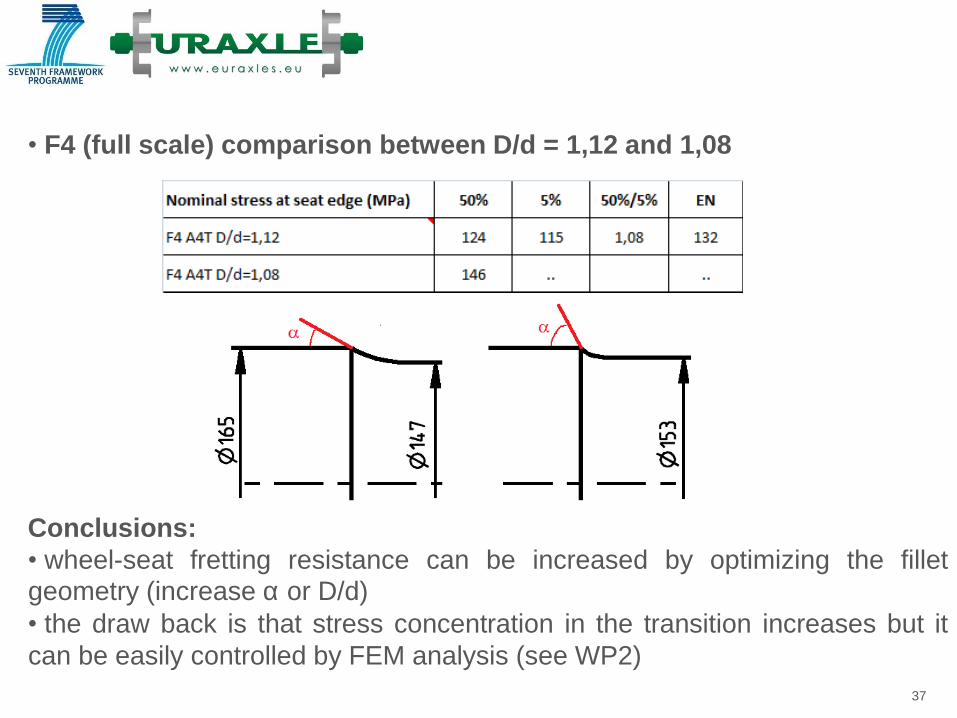
• F4 (full scale) comparison between D/d = 1,12 and 1,08
Conclusions:
• wheel-seat fretting resistance can be increased by optimizing the fillet
geometry (increase a or D/d)
• the draw back is that stress concentration in the transition increases but it
can be easily controlled by FEM analysis (see WP2)
38
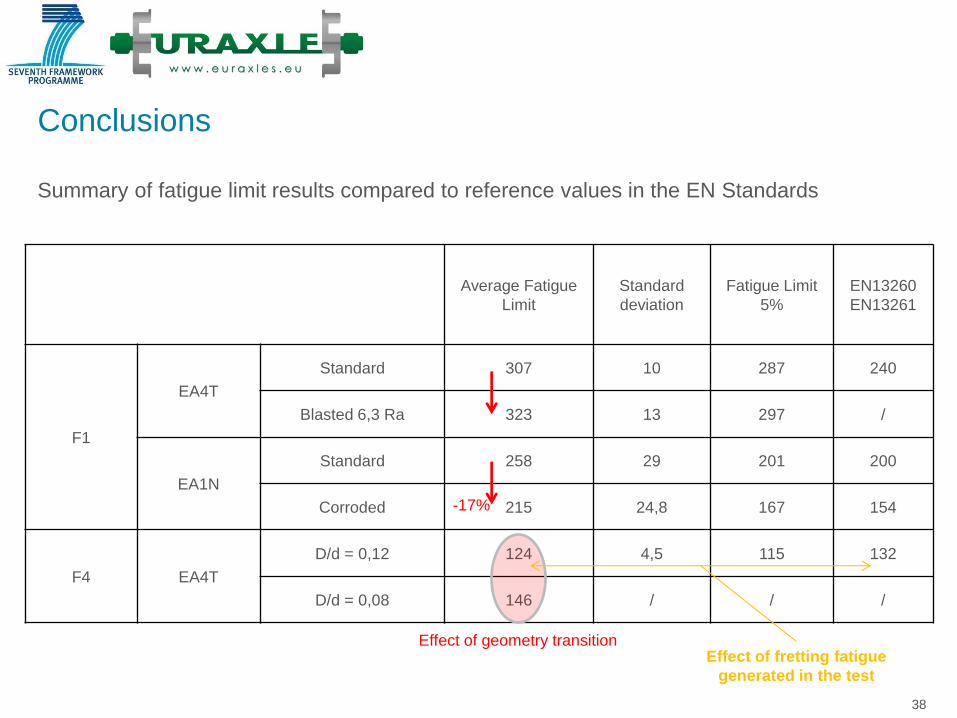
Conclusions
Summary of fatigue limit results compared to reference values in the EN Standards
Average Fatigue
Limit
Standard
deviation
Fatigue Limit
5%
EN13260
EN13261
F1
EA4T
Standard 307 10 287 240
Blasted 6,3 Ra 323 13 297 /
EA1N
Standard 258 29 201 200
Corroded 215 24,8 167 154
F4 EA4T
D/d = 0,12 124 4,5 115 132
D/d = 0,08 146 / / /
-17%
Effect of geometry transition Effect of fretting fatigue
generated in the test
39
Conclusions (Proposals for Standard revision) AXLE TRANSITIONS
● As shown Kt factors determined through FEM model are generally 20% higher
than in the EN.
● Axle can still be calculated by the beam theory (EN 13103), but then apply the
real Kt factors (FEM model).
● In this case local stress fatigue limits (higher than the ones in the EN) should be
used (with a failure probability of 5%).
● Further investigation should address the values of the safety factors to be used; in
the EN they depend on material, type of axle, including effects from unknown
conditions of service loads and material strength scatter; methods developed in
Euraxles-WP2 will allow to define appropriate values.
●In general the use of FEM models to verify the stress distribution in the transitions
and groves will surely improve the axle design.
● It is shown that appropriate surface blasting of the surface can ensure no
reduction of the fatigue limit.
● It is shown that unpainted corroded axles have a 17% lower fatigue limit
compared to new axles.
40
Conclusions (Proposal for Standard revision)
AXLE PRESS-FITTED SEATS
● It is proven that by applying the condition of acceptability that no crack indication
should be found at the end of the fatigue tests, can lead to a reduction of the F4
fatigue limits.
● Nevertheless permissible stress should not be changed due to the positive
feedback from the service.
The reason for the above is in the specific nature of the fretting fatigue phenomena:
different from classical surface fatigue, fretting fatigue damage increases in a non
linear way in relation to the friction coefficient that from a certain level of load enables
dynamic slip damaging the axles seat surface.
● It is also shown that increasing the slope of the transition near the seat edge (and
controlling the higher stress in this area) improves the fretting fatigue resistance of
the press fitted seats.

Thank you for your attention
41