Fatigue Performance of Additively Manufactured Stainless...
12
Fatigue Performance of Additively Manufactured Stainless Steel 316L for Nuclear Applications William Beard 1,a , Robert Lancaster 1,b , Jack Adams 2,c , Dane Buller 2,d 1 Institute of Structural Materials, College of Engineering, Bay Campus, Swansea University, Swansea, SA1 8EN, United Kingdom 2 Rolls-Royce Submarines, P.O. Box 2000, Raynesway, Derby, DE21 7XX, United Kingdom a [email protected] , b [email protected], c [email protected], d [email protected] Keywords Additive manufacturing; laser powder bed fusion; stainless steel 316L; low cycle fatigue Abstract Additive manufacturing (AM) is a rapidly growing technology which is extending its influence into many industrial sectors such as aerospace, automotive and marine. Recently the nuclear sector has considered AM in the production of nuclear reactor components due to its possible advantages over conventional manufacturing routes. This includes considerable cost savings due to less material wastage, the ability to produce complex near net shape components that conventional manufacturing processes are unable to achieve and a reduced manufacturing time. Initially, Stainless Steel 316L (SS316L) manufactured by laser powder bed fusion (LPBF) has been identified as a potential candidate. However, due to the transient nature of the microstructure it is now of fundamental importance to assess and understand the mechanical behaviour of the LPBF material. This paper will highlight some of the recent research at Swansea University in investigating the variation on the fatigue characteristics between wrought SS316L and LPBF processed SS316L material. This will include an extensive microstructural and fractographic investigation. As LPBF material looks to replace conventionally manufactured equivalents, an understanding of how build integrity and orientation affects the mechanical properties of AM material is critical. Wrought and vertical LPBF material are to be assessed to understand how the microstructure controls the fatigue performance of LPBF SS316L material. 2144 Solid Freeform Fabrication 2019: Proceedings of the 30th Annual International Solid Freeform Fabrication Symposium – An Additive Manufacturing Conference Reviewed Paper
Transcript of Fatigue Performance of Additively Manufactured Stainless...
Fatigue Performance of Additively Manufactured Stainless Steel 316L for Nuclear Applications
William Beard1,a, Robert Lancaster1,b, Jack Adams2,c, Dane Buller2,d
1Institute of Structural Materials, College of Engineering, Bay Campus, Swansea University, Swansea, SA1 8EN, United Kingdom
2Rolls-Royce Submarines, P.O. Box 2000, Raynesway, Derby, DE21 7XX, United Kingdom [email protected] , [email protected], [email protected],
Keywords
Additive manufacturing; laser powder bed fusion; stainless steel 316L; low cycle fatigue Abstract
Additive manufacturing (AM) is a rapidly growing technology which is extending its influence into many industrial sectors such as aerospace, automotive and marine. Recently the nuclear sector has considered AM in the production of nuclear reactor components due to its possible advantages over conventional manufacturing routes. This includes considerable cost savings due to less material wastage, the ability to produce complex near net shape components that conventional manufacturing processes are unable to achieve and a reduced manufacturing time. Initially, Stainless Steel 316L (SS316L) manufactured by laser powder bed fusion (LPBF) has been identified as a potential candidate. However, due to the transient nature of the microstructure it is now of fundamental importance to assess and understand the mechanical behaviour of the LPBF material.
This paper will highlight some of the recent research at Swansea University in investigating the variation on the fatigue characteristics between wrought SS316L and LPBF processed SS316L material. This will include an extensive microstructural and fractographic investigation. As LPBF material looks to replace conventionally manufactured equivalents, an understanding of how build integrity and orientation affects the mechanical properties of AM material is critical. Wrought and vertical LPBF material are to be assessed to understand how the microstructure controls the fatigue performance of LPBF SS316L material.
2144
Solid Freeform Fabrication 2019: Proceedings of the 30th Annual InternationalSolid Freeform Fabrication Symposium – An Additive Manufacturing Conference
Reviewed Paper
1. IntroductionAdditive manufacturing (AM) is a near net shape manufacturing process currently under
consideration by the nuclear sector to replace conventional manufacturing techniques. The AM process offers many advantages in the production of parts compared to conventional manufacturing techniques and this has led to many industrial sectors such as medical, automotive and aerospace investing in the technology. Overall, AM has unrivalled design freedom and provides the ability to manufacture single or multiple components from a wide range of materials. This allows the production of complex parts produced to near net shape, meaning there is no need for expensive tooling such as punches, dies or casting moulds. This therefore reduces the amount of processing steps which is not only seen to reduce manufacturing time but also improve component strength and integrity, as parts have fewer joining regions removing possible stress raising features [1]. However, challenges in understanding how the feedstock materials, processing variables and other contributing factors affect the mechanical properties and performance of a component are still required.
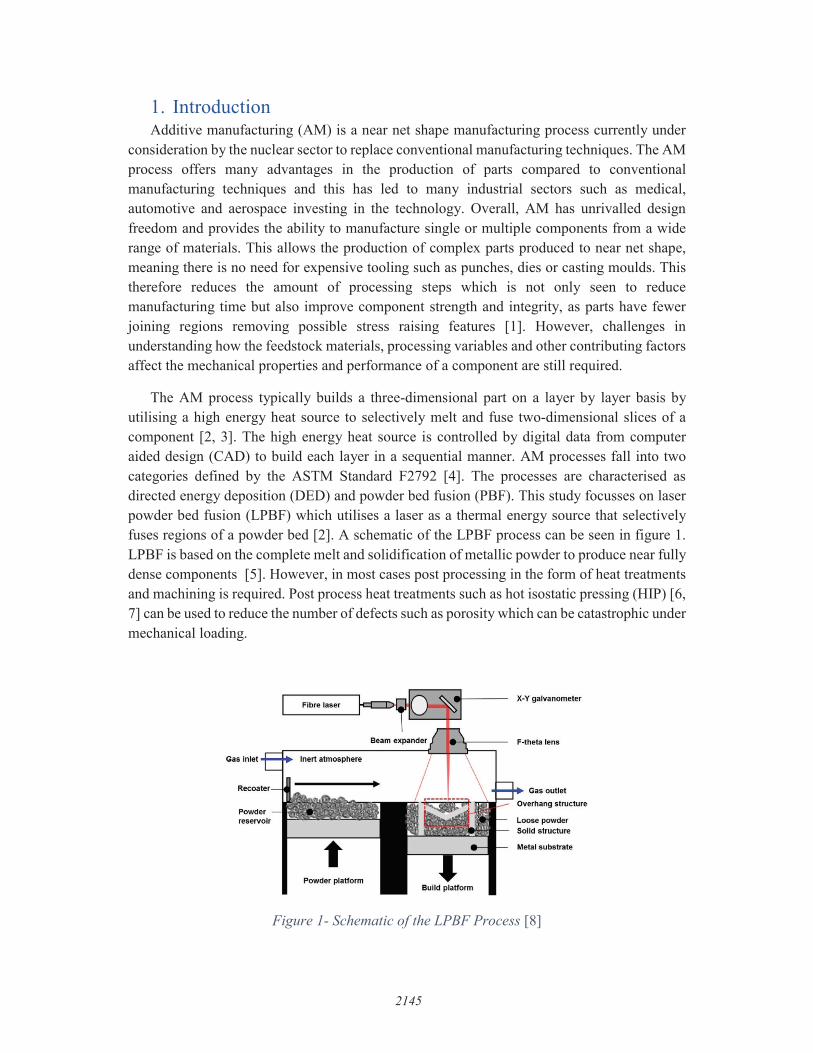
The AM process typically builds a three-dimensional part on a layer by layer basis by utilising a high energy heat source to selectively melt and fuse two-dimensional slices of a component [2, 3]. The high energy heat source is controlled by digital data from computer aided design (CAD) to build each layer in a sequential manner. AM processes fall into two categories defined by the ASTM Standard F2792 [4]. The processes are characterised as directed energy deposition (DED) and powder bed fusion (PBF). This study focusses on laser powder bed fusion (LPBF) which utilises a laser as a thermal energy source that selectively fuses regions of a powder bed [2]. A schematic of the LPBF process can be seen in figure 1. LPBF is based on the complete melt and solidification of metallic powder to produce near fully dense components [5]. However, in most cases post processing in the form of heat treatments and machining is required. Post process heat treatments such as hot isostatic pressing (HIP) [6, 7] can be used to reduce the number of defects such as porosity which can be catastrophic undermechanical loading.
Figure 1- Schematic of the LPBF Process [8]
2145
Gas Inlet Inert atmosphere
t Powder platform
X•Y galvanometer
F·theta lens
Gas outlet
Loose powder Solid structure
Metal substrate

Many studies have been carried out on additive materials under static loads, however dynamic cyclic loading in the form of fatigue is not yet fully understood. These dynamic cyclic loading conditions are a requirement for many critical applications within the aerospace, marine and nuclear industry. Therefore, gaining an understanding of the fatigue behaviour of LPBF materials is of upmost importance. This paper aims to provide a further understanding into the fatigue characteristics of LPBF processed material in comparison with its wrought counterpart.
2. Materials and Methods The material focussed on in this study is stainless steel 316L (SS316L). SS316L is an
austenitic grade of stainless steel with a relatively high nickel content and moderate chromium content. SS316L is a marine grade corrosion resistant stainless steel with good weldability due to its low carbon content and moderate molybdenum content. These properties make it an ideal candidate to be manufactured by LPBF since it displays many similarities with welding.
2.1. Material Variants and fabrication Two variants of SS316L were investigated in this study; a conventionally manufactured
wrought variant and a LPBF variant. The LPBF material was fabricated in the vertical (90°) build orientation using an EOS M290 machine using gas atomised (GA) SS316L powder with the nominal composition seen in table 1 and a powder particle size distribution of 5-60 μm. The processing parameters adopted to manufacture the samples were the standard parameters set by the machine manufacturer EOS to obtain samples with near full density. Four φ 20mm cylindrical samples were built in the vertical orientation to a height of 105mm. After building the cylinders were removed and hot isostatically pressed (HIPped) with the aim of further consolidating the material [6, 7].
Table 1- Nominal composition of SS316L gas atomised powder (wt.%)
Element Fe C Cr Mn Mo Ni P S Si SS316L Bal 0-0.03 16-18 0-2 2-3 10-14 0-0.045 0-0.03 0-1
2.2. Microstructure Characterisation A Hitachi SU3500 scanning electron microscope (SEM) equipped with an electron
backscatter diffraction (EBSD) unit was used to characterise the microstructural features of the two variants. EBSD scans were conducted with the SEM and EBSD settings displayed below in table 2. EBSD data was acquired using the tango plug-in included in the Channel 5 software. Careful noise reduction was performed prior to EBSD analysis whereby wild spikes and zero solutions were replaced. However, zero solutions were only conducted three times. Grain detection was performed using the grain area determination in tango, where no border grains were included and boundaries with a misorientation >10° were used for measurements of grain size.
2146

Table 2- SEM and EBSD settings used during EBSD data acquisition
SEM Settings Accelerating Voltage 20 KV Working Distance 20 mm
EBSD Settings Step Size 1.5 μm EBSD camera binning mode 4 x 4 Hough resolution 60 Phases for acquisition Iron FCC, Iron BCC Band detection mode Optimised EBSD
2.3. Strain Control Low Cycle Fatigue Testing Strain Controlled Low Cycle Fatigue (LCF) tests were performed on a servo-hydraulic
mechanical test machine according to ASTM E606 [9] with specimens machined according to the dimensions depicted in figure 2. After machining, the gauge sections of all specimens were circumferentially polished with emery papers of 320/800/1200 grit and 3 μm diamond suspension. Testing was conducted at 20°C under controlled laboratory conditions, and a 0.4s-
1 triangular waveform with an R ratio of -1 was employed under strain control. Maximum strain ( MAX) values of 0.3 and 0.6% were used to investigate the effects of different loading conditions on the wrought and LPBF material. After testing was complete a Hitachi SU3500 SEM was used to inspect the fracture surfaces.
Figure 2- Specimen drawing of LCF test pieces with dimensions in mm
2.4. Surface Roughness Measurements Prior to testing, an Alicona Infinite Focus microscope was used to measure the roughness
topography and the related parameters of all samples according to ISO 4287; ISO 4288. The surface roughness parameters shown in table 3 were measured to complete an analysis on the effect of surface roughness on LCF performance.
2147
Ml2 x l.75p

Table 3- Surface Roughness Parameters
Height Parameters Amplitude Distribution Parameters Ra (μm) Arithmetical Mean Deviation Rsk (-) Skewness Rt (μm) Total Height of profile Rku (-) Kurtosis of profile Rp (μm) Maximum profile peak height Rpk (μm) Reduced peak height Rv (μm) Maximum profile valley depth Rvk (μm) Reduced valley height Rz (μm) Maximum height of profile Rk (μm) Core roughness depth Rc (μm) Mean height of profile elements RMr1 (%) Peak material component that
can withstand a load Rq (μm) Root mean square deviation RMr2 (%) Valley material component that
can withstand a load
3. Results and Discussion 3.1. Material Characterisation Figure 3 presents the EBSD micrographs for both the wrought and vertical LPBF variants
in both the XY and XZ orientations. The XZ Plane is orientated in the build direction. Overall both the wrought and vertical LPBF material shows an austenitic Face Centre Cubic (FCC) microstructure with minute amounts of retained Body Centre Cubic (BCC) -ferrite distributed throughout and this is shown clearly in figure 4. Grain measurements, kernel average misorientation (KAM), quantity of (twinning boundaries) and amount of BCC ferrite phase for the wrought and vertical samples are reported in table 4.
From the table it is clear that there is a higher percentage of BCC ferrite in the wrought sample. Figure 4a shows that the BCC ferrite phase has a needle like morphology in the wrought microstructure whereas the LPBF material, in figure 4b and c, shows very small amounts of randomly orientated BCC ferrite phase along the grain boundaries. Furthermore, figure 4 shows substructure as highlighted by the silver colour indicator. In the wrought material, very little substructure can be observed whereas the LPBF material shows large amount of substructure within the grains.
The wrought microstructure seen in figure 3a shows an equiaxed grain morphology where mechanical properties would be expected to be predominantly isotropic. Whereas the LPBF material in figure 3b shows a strongly anisotropic structure as the XY face shows an elongated microstructure due to epitaxial grain growth along the build direction and an equiaxed grain morphology perpendicular to the build orientation. This columnar or epitaxial grain growth has most likely arisen due to the complex thermal history occurring in the LPBF process [3]. Since LPBF is a layer by layer manufacturing process, a single layer of metal is cast upon a previous single layer. This causes time dependant temperature profiles and often results in an alloy experiencing repeated solid state and liquid solid phase transformations [3]. Additionally LPBF is a relatively rapid solidification process with reported cooling rates of 104 K/s and heat flow in the build direction frequently results in columnar microstructures [3].
2148
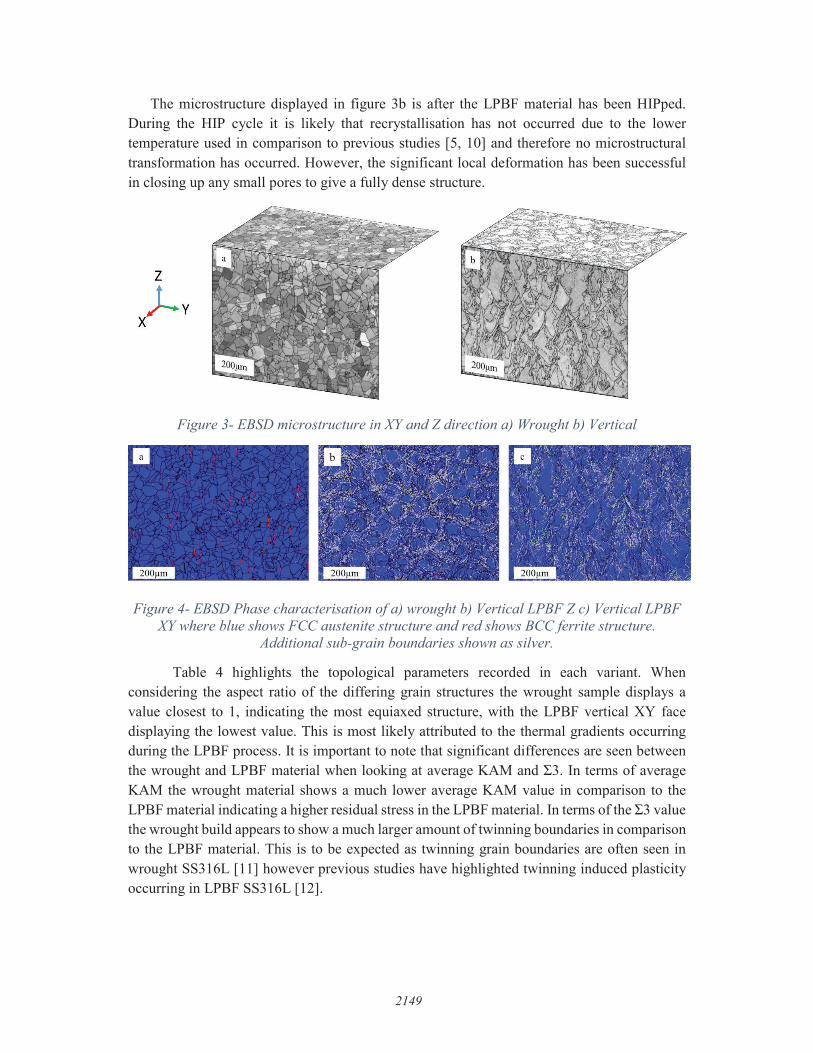
The microstructure displayed in figure 3b is after the LPBF material has been HIPped. During the HIP cycle it is likely that recrystallisation has not occurred due to the lower temperature used in comparison to previous studies [5, 10] and therefore no microstructural transformation has occurred. However, the significant local deformation has been successful in closing up any small pores to give a fully dense structure.
Figure 3- EBSD microstructure in XY and Z direction a) Wrought b) Vertical
Figure 4- EBSD Phase characterisation of a) wrought b) Vertical LPBF Z c) Vertical LPBF XY where blue shows FCC austenite structure and red shows BCC ferrite structure.
Additional sub-grain boundaries shown as silver.
Table 4 highlights the topological parameters recorded in each variant. When considering the aspect ratio of the differing grain structures the wrought sample displays a value closest to 1, indicating the most equiaxed structure, with the LPBF vertical XY face displaying the lowest value. This is most likely attributed to the thermal gradients occurring during the LPBF process. It is important to note that significant differences are seen between the wrought and LPBF material when looking at average KAM and . In terms of average KAM the wrought material shows a much lower average KAM value in comparison to the LPBF material indicating a higher residual stress in the LPBF material. In terms of the value the wrought build appears to show a much larger amount of twinning boundaries in comparison to the LPBF material. This is to be expected as twinning grain boundaries are often seen in wrought SS316L [11] however previous studies have highlighted twinning induced plasticity occurring in LPBF SS316L [12].
2149
z
X J-v

Table 4- Grain measurements
Sample Average Grain Size
( 2)
Number of Grains
Aspect Ratio
Average KAM (°) (%)
Amount of BCC
phase (%) Wrought 1065.5 406 0.72 0.15 49.0 1.5
Vertical XZ 408.51 1143 0.59 0.65 0.573 0.2 Vertical XY 646.19 848 0.38 0.55 0.531 0.4
3.2. Surface Roughness Surface roughness measurements can be seen in table 5. Previous research [13] has
identified strong correlations of fatigue life with surface roughness, however no direct trend was observed in the data collected here. However, it is important to note that the circumferential polish is more likely to affect fatigue performance since the polish marks align with the crack growth direction perpendicular to the applied load [14].
Table 5- Surface Roughness Measurements on Samples
Sample Height Parameters Amplitude Distribution Parameters
Ra (μm)
Rt (μm)
Rp (μm)
Rv (μm)
Rz (μm)
Rq (μm)
Rsk (μm)
Rpk (μm)
Rvk (μm)
Rk (μm)
Mr1 (%)
Mr2 (%)
W-2 0.87 7.11 4.04 3.07 5.36 1.14 0.05 1.33 1.22 2.56 12.07 87.04 W-3 1.08 8.26 3.73 4.53 6.25 1.38 -0.11 1.45 1.51 3.01 16.89 88.53V-2 0.99 7.04 3.91 3.13 5.71 1.25 0.07 1.24 1.07 3.10 11.95 89.32 V-4 0.83 6.20 2.49 3.72 4.84 1.04 -0.55 0.79 1.20 2.60 8.1 87.37
3.3. Strain Control Low Cycle Fatigue (LCF) Testing
Figure 5 presents the stress evolution with time for the eight LPBF specimens tested in this research. In both material variants, it can be seen that there is initial cyclic softening occurring in the first 1000 cycles. Over time the stresses start to level and become more stabilised until final fracture occurs, as indicated by the drop in maximum stress. One obvious difference between the wrought and vertical LPBF material is that at both MAX = 0.3% and 0.6%, the LPBF variant maintains a higher stress range throughout the duration of the test, since the wrought material failed to achieve the same maximum and minimum stress values upon initial loading.
2150

Figure 5- Maximum and minimum stress evolution behaviour for MAX = 0.3% and 0.6% tests
The characteristic hysteresis strain-stress loops for MAX = 0.3% are shown in figure 6. The monotonic loops (N=1) highlight both the Youngs’ modulus (E) of the material and the yield stress ( ys) behaviour. Both variants appear to have a similar modulus of 200MPa however differing yield responses are seen between the wrought and vertical LPBF material. The wrought material is seen to yield at a lower value of around 200MPa in comparison to the vertical LPBF material which yields around 280MPa. The stabilised (½ Nf) loops highlight the stabilised stress range (Δ STAB) of the materials and show further evidence of cyclic softening occurring in the material. Additionally, the Δ STAB values show that the ys in the wrought material has led to a reduced Δ STAB in comparison to the vertical LPBF material.
The characteristic hysteresis loops corresponding to MAX = 0.6% are shown in figure 7. This shows a similar response to the 0.3% regime whereby all materials show a similar E with the wrought material yielding at a lower value. This yielding has also led to a reduced Δ STAB for the wrought material.
Fatigue cracks can nucleate early in LCF due to the large plastic strains occurring in localised regions [15]. The total strain amplitude can be resolved into plastic and elastic strain components. Generally speaking, the width of the hysteresis loops show the amount of plasticity at the given test strain amplitude. As such, in both the MAX = 0.3% and 0.6% regime the wrought material variants are seen to show a wider hysteresis loop than the vertical samples indicating a greater amount of plasticity in these variants. In addition, the results obtained were lower than expected and this is most likely explained by the circumferential polished surface finish [14]. Table 6 highlights the varying fatigue parameters in each sample.
-500
-400
-300
-200
-100
0
100
200
300
400
500
0 5000 10000 15000 20000 25000
Stre
ss (M
Pa)
N
W-1 W-2 W-3 W-4V-1 V-2 V-3 V-4
2151
----- ----- ----- ------~ , ----- ----- ----- -----,~ -rn , ..
- - r 1 ,, I 1 11 .----------.....
,, I 1 11 I '
,, I 1 11 I \
,, - I 11 '- I \ ,1
I 11 1 I \ .. I 11 1 I \ I 11 1 I I
- I 11 1- I I I 1 11 I I I I l l I I I I l l I I ---1- ~----~-------~--------~--~-----~----1- ---
11 1 I 11 1 1 11 I
- I I L I 1 11 I 11 1 I 1 11 I
- 1 11 I 1 11 I 11 1 I 1 11 _,.
11: ------------- ~• II
' -:~-, .. : _,;;-•••I.A
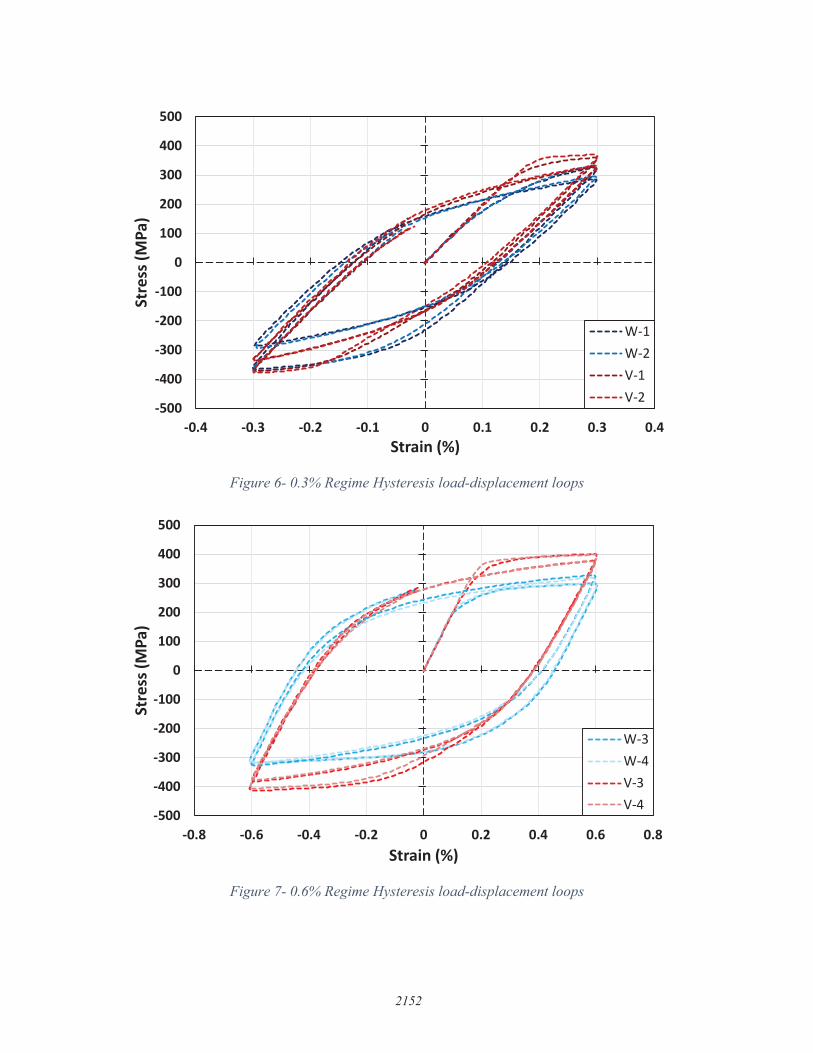
Figure 6- 0.3% Regime Hysteresis load-displacement loops
Figure 7- 0.6% Regime Hysteresis load-displacement loops
-500
-400
-300
-200
-100
0
100
200
300
400
500
-0.4 -0.3 -0.2 -0.1 0 0.1 0.2 0.3 0.4
Stre
ss (M
Pa)
Strain (%)
W-1W-2V-1V-2
-500
-400
-300
-200
-100
0
100
200
300
400
500
-0.8 -0.6 -0.4 -0.2 0 0.2 0.4 0.6 0.8
Stre
ss (M
Pa)
Strain (%)
W-3W-4V-3V-4
2152
-----1- -----1-
-----1---
I I
T I I
T I
--1------1-
,,,,_. ,,,,, --::~-' I T
I I
T I
I I
T I ,,;..---.,---------J;.-----~~,-----------J -- -;-;-~~~-~~-;:-;
I I

Table 6 – Overall Fatigue Results
ID Orientation/Material
Condition
Max Strain (%)
Life, Nf (Cycles)
Stabilised stress range
(MPa) p e
W-1 Wrought 0.3
21253 571 0.30 0.30 W-2 16646 589 0.27 0.33 V-1 Vertical 23427 663 0.24 0.36 V-2 23639 667 0.25 0.35 W-3 Wrought
0.6 1581 651.5 0.83 0.37
W-4 2982 589.4 0.84 0.36 V-3 Vertical 2695 757.9 0.76 0.44 V-4 2329 754.1 0.76 0.44
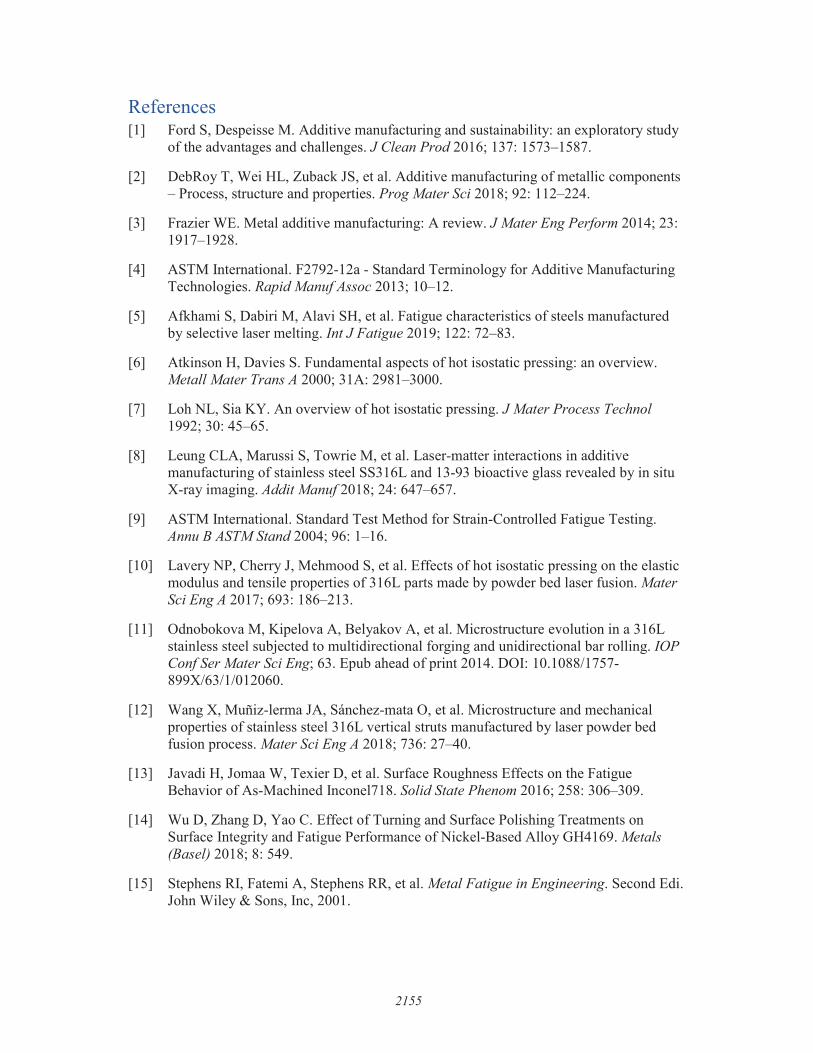
3.4. Fractography The fracture surface of a metallic component subjected to LCF loading is typically
comprised of three main areas [15] and these were identified in all fatigue fracture surfaces analysed by SEM microscopy in figure 8. These include a period of crack nucleation, followed by a zone of crack propagation and the final failure region. The origin of fatigue damage for all samples was related to surface features most likely due to surface roughness and the circumferential polish on the samples. A large area of crack growth can be observed in all fracture surfaces. However, as an R ratio of -1 was employed in this research, fatigue striations were not clearly visible at high magnification due to the fully reversed tensile and compressive forces applied. The final failure areas present a ductile morphology as evidenced by the presence of microscopic pores and necking on the outer surface of the specimens.
2153

Figure 8- Fracture surfaces of fatigue samples a-b) Wrought 0.3% c-d) Vertical 0.3% e-f) Wrought 0.6% g-h) Vertical 0.6
4. Conclusion The LCF behaviour of wrought and vertical LPBF SS316L was assessed and results
showed that the vertical LPBF material performed equally to its wrought equivalent. The initial microstructural characterisation revealed that the wrought material contains an isotropic equiaxed structure with a large amount of twinning boundaries whilst the LPBF material showed an anisotropic structure with epitaxial columnar grains orientated in the build direction. In addition, the LPBF material appeared to contain fewer twinning boundaries and a large amount of sub grain structure. Overall these features were found to have a limited influence on the fatigue properties of the material variants. This is most likely due to the circumferential polish of samples and the relative roughness that has been measured. However no direct correlation was found between roughness and fatigue life. When closely looking at the hysteresis loops it was seen that the wrought material showed greater plasticity under loading than the vertical LPBF samples, and as such, would be expected to exhibit an inferior resistance to fatigue damage.
5. Acknowledgements This research was funded by The Materials and Manufacturing Academy (M2A) supported
by the European Social Fund through the Welsh Government. The provision of a research bursary, materials and supporting information from Rolls-Royce plc is gratefully acknowledged. Alicona surface roughness measurements were completed in the Welsh Centre for Printing and Coating (WCPC) and mechanical tests were performed at Swansea Materials Research and Testing Ltd. (SMaRT).
2154
Mlllhllli
References [1] Ford S, Despeisse M. Additive manufacturing and sustainability: an exploratory study
of the advantages and challenges. J Clean Prod 2016; 137: 1573–1587.
[2] DebRoy T, Wei HL, Zuback JS, et al. Additive manufacturing of metallic components– Process, structure and properties. Prog Mater Sci 2018; 92: 112–224.
[3] Frazier WE. Metal additive manufacturing: A review. J Mater Eng Perform 2014; 23:1917–1928.
[4] ASTM International. F2792-12a - Standard Terminology for Additive ManufacturingTechnologies. Rapid Manuf Assoc 2013; 10–12.
[5] Afkhami S, Dabiri M, Alavi SH, et al. Fatigue characteristics of steels manufacturedby selective laser melting. Int J Fatigue 2019; 122: 72–83.
[6] Atkinson H, Davies S. Fundamental aspects of hot isostatic pressing: an overview.Metall Mater Trans A 2000; 31A: 2981–3000.
[7] Loh NL, Sia KY. An overview of hot isostatic pressing. J Mater Process Technol1992; 30: 45–65.
[8] Leung CLA, Marussi S, Towrie M, et al. Laser-matter interactions in additivemanufacturing of stainless steel SS316L and 13-93 bioactive glass revealed by in situX-ray imaging. Addit Manuf 2018; 24: 647–657.
[9] ASTM International. Standard Test Method for Strain-Controlled Fatigue Testing.Annu B ASTM Stand 2004; 96: 1–16.
[10] Lavery NP, Cherry J, Mehmood S, et al. Effects of hot isostatic pressing on the elasticmodulus and tensile properties of 316L parts made by powder bed laser fusion. MaterSci Eng A 2017; 693: 186–213.
[11] Odnobokova M, Kipelova A, Belyakov A, et al. Microstructure evolution in a 316Lstainless steel subjected to multidirectional forging and unidirectional bar rolling. IOPConf Ser Mater Sci Eng; 63. Epub ahead of print 2014. DOI: 10.1088/1757-899X/63/1/012060.
[12] Wang X, Muñiz-lerma JA, Sánchez-mata O, et al. Microstructure and mechanicalproperties of stainless steel 316L vertical struts manufactured by laser powder bedfusion process. Mater Sci Eng A 2018; 736: 27–40.
[13] Javadi H, Jomaa W, Texier D, et al. Surface Roughness Effects on the FatigueBehavior of As-Machined Inconel718. Solid State Phenom 2016; 258: 306–309.
[14] Wu D, Zhang D, Yao C. Effect of Turning and Surface Polishing Treatments onSurface Integrity and Fatigue Performance of Nickel-Based Alloy GH4169. Metals(Basel) 2018; 8: 549.
[15] Stephens RI, Fatemi A, Stephens RR, et al. Metal Fatigue in Engineering. Second Edi.John Wiley & Sons, Inc, 2001.
2155