FATIGUE OF HIGH RELATIVE RIB AREA REINFORCING BARS By …
83
FATIGUE OF HIGH RELATIVE RIB AREA REINFORCING BARS By Jun Fei David Darwin A Report on Research Sponsored by THE NATIONAL SCIENCE FOUNDATION Research Grant No. CMS-9402563 THE U.S. DEPARTMENT OF TRANSPORTATION FEDERAL HIGHWAY ADMINISTRATION Structural Engineering and Engineering Materials SMReport54 UNIVERSITY OF KANSAS CENTER FOR RESEARCH, INC. LA WREN CE, KANSAS July 1999
Transcript of FATIGUE OF HIGH RELATIVE RIB AREA REINFORCING BARS By …

FATIGUE OF HIGH RELATIVE RIB AREA REINFORCING BARS
By Jun Fei
David Darwin
A Report on Research Sponsored by THE NATIONAL SCIENCE FOUNDATION
Research Grant No. CMS-9402563
THE U.S. DEPARTMENT OF TRANSPORTATION FEDERAL HIGHWAY ADMINISTRATION
Structural Engineering and Engineering Materials SMReport54
UNIVERSITY OF KANSAS CENTER FOR RESEARCH, INC. LA WREN CE, KANSAS
July 1999

ABSTRACT
The fatigue performance of high relative rib area reinforcing bars is compared to that
of conventional bars. Fatigue tests involve No. 4 ( 13mm) and No. 5 ( 16rnm) bars with
relative rib areas (ratio of projected rib area normal to bar axis to the product of the
nominal bar perimeter and the center-to-center rib spacing) ranging from 0.064 to 0.146.
The tests include 69 specimens representing 6 deformation patterns [2 for No. 4 (13mm)
bars and 4 for No. 5 (16mm) bars] to investigate the effect of deformation pattern on
fatigue behavior. The tests were conducted in air using stress ranges of 20, 25, 30, and 35
ksi (138, 172, 207, and 241 MPa) with a minimum stress of zero. Characteristics of
fatigue crack zones and the details of lug geometry are provided.
The test results indicate that the stress range, bar diameter, and surface geometry,
especially the lug base radius-to-height ratio (rib). have significant effects on the fatigue
strength of the bars. Fatigue strength and fatigue life decrease with increased stress range
and bar diameter and decreased r/h ratio. Relative rib area has no effect on fatigue
performance.
Keywords: concrete; deformation pattern; fatigue; reinforcing bars; relative rib area

ill
ACKNOWLEDGEMENTS
This report is based on a thesis submitted by Jun Fei in partial fulfillment of
the requirements of the M.S.C.E. degree. Support for this research was provided by
the National Science Foundation under NSF Grant No. CMS-9402563, the U.S.
Department of Transportation - Federal Highway Administration, the Lester T.
Sunderland Foundation, ABC Coating, Inc., AmeriSteel (formerly Florida Steel
Corporation), Birmingham Steel Corporation, Chaparral Steel, DuPont Powder
Coatings, Fletcher Coating, North Star Steel Company, and 3M Corporation.
Additional support was provided by Geiger Ready-Mix, Iron Mountain Trap Rock
Company, and Dayton Richmond.
iv
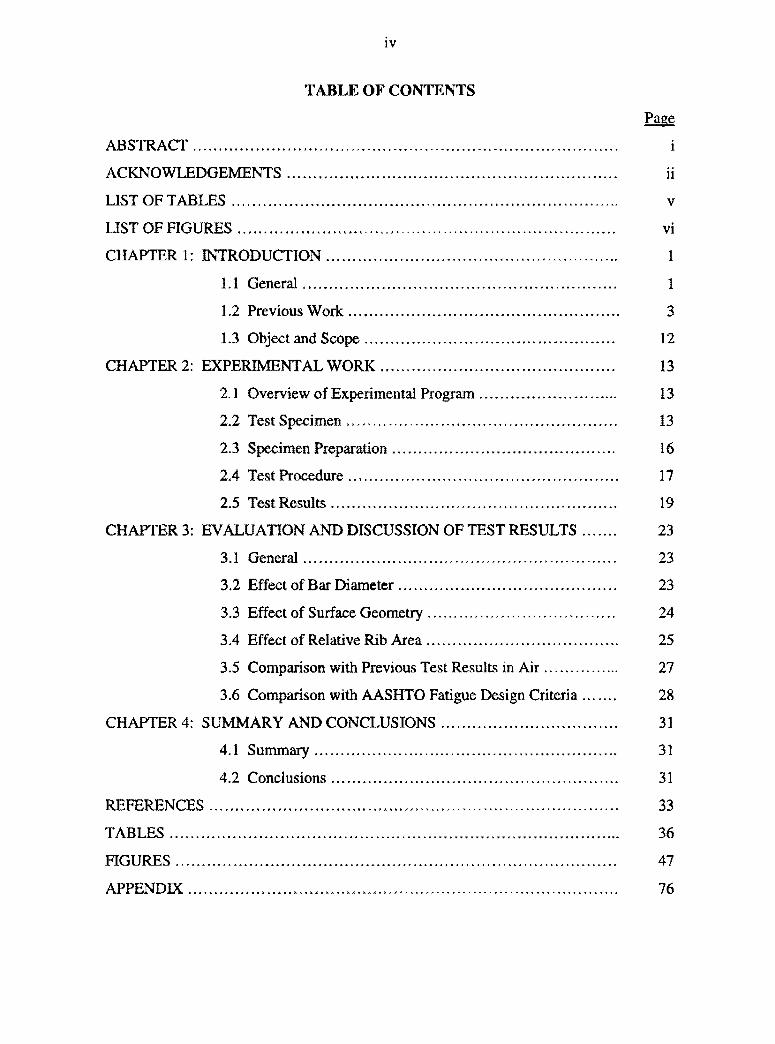
TABLE OF CONTENTS
ABSTRACT ................................................................................ .
ACKNOWLEDGEMENTS . . . . . . . . . . . . . . . . . . . . . . . . . . . . . . . . . . . . . . . . . . . . . . . . . . . . . . . . . . . . . . . u
LIST OFTABl.ES .......................................................................... v
LIST OF FIGURES . . . . . . .. . .. . .. . .. . . . . .. . . . . . . . . . . . . . . . . . . . . . . . . . . . . . . . . . . . . . . . . . . . . . . . . . vi
CHAPTER 1: INTRODUCTION . . . . . . . . . . . . . . . . . . . . . . . . . . . . . . . . . . . . . . . . . . . . . . . . . . . . . . .. 1
1.1 General............................................................ 1
1.2 Previous Work.................................................... 3
1.3 Object and Scope . . . . .. . . . . . . . . . . . .. . .. . . . . . . . . . . . . . . . . . . . . . . . . . . 12
CHAPTER 2: EXPERIMENTAL WORK............................................. 13
2.1 Overview of Experimental Program . . . . . . . .. . . . . . . . . . . . . . . .... 13
2.2 Test Specimen . . . . . . . . . . . . . . . . . . . . . . . . . . . . . . . . . . . . . . . . . . . . . . . . . . . . 13
2.3 Specimen Preparation . . . . . . . . . . . . . . . . . . . . . . . . . . . . . . . . . . . . . . . . . . . 16
2.4 Test Procedure .. .. . . .. . . . . . . . .. .. .. .. . . . .. . . . . . . . . .. . . . . . . . .. . . . .. 17
2.5 Test Results . . . .. . . . . . . .. . . .. . . . . . .. . . . . . . . . . . . . . . . . . . . . . . . . . . . . . .. 19
CHAPTER 3: EVALUATION AND DISCUSSION OF TEST RESULTS .. ..... 23
3. l General . . . . . . . .. . . . . . . . . . . . . . . . . . . . . . . . . . . . . . . . . . . . . . . . . . . . . . . . . . . . 23
3.2 Effect of Bar Diameter . . . . . . . . . . . . . . . . . . . . . . . . . . . . . . . . . . . . . . . . . . 23
3.3 Effect of Surface Geometry . . . . . . . . . . . . . . . . . . . . . . . . . . . . . . . . . . . . 24
3.4 Effect of Relative Rib Area . . . . . . . . . .. . . . . . . . . . . . . . . . . . . . . . . . . . . 25
3.5 Comparison with Previous Test Results in Air............... 27
3.6 Comparison with AASHTO Fatigue Design Criteria . . . . . . . 28
CHAPTER4: SUMMARY AND CONCLUSIONS.................................. 31
4.1 Summary.......................................................... 31
4.2 Conclusions . . . . . . . . . . . . . . . . . . . . . . . . . . . . . . . . . . . . . . . . . . . . . . . . . . . . . .. 31
REFERENCES.............................................................................. 33
TABLES...................................................................................... 36
FIGURES.................................................................................... 47
APPENDIX.................................................................................. 76

v
LIST OF TABLES
Page
Table 2.1 Deformation Properties of Reinforcing Bars . . . . . . . . . . . . . . . . . . . . . . . . . . . . 36
Table 2.2 Rib Heights of Transverse Deformations on Bars Investigated...... 37
Table 2.3 Mechanical Properties of Reinforcing Bars . . . . . . . . . . . . . . . . . . . . . . . . . . . ... 39
Table 2.4 Stresses Introduced by Gripping System................................ 40
Table 2.5 Fatigue Test Results of Reinforcing Bars................................ 41
Table 2.6 Measurements of Lug Properties Obtained with Scanning Electron
Microscope ...... .............................. ........................ ....... 45
vi
LIST OF FIGURES
Page
Fig. 2.1 Test Bars . . . . . . . . . . . . . . . . . . . . . . . . . . . . . . . . . . . . . . . . . . . . . . . . . . . . . . . . . . . . .. . . . . . . . ... 47
Fig. 2.2 Schematic Illustration of Relative Rib Area (see Eq. 2.1) . . . . . . . . . . . . . . . 48
Fig. 2.3 Typical Stress-Strain Curve for Ch4S60 Bars . . . . . . . . . . . . . . . . . . . . . . . . . . . .. 49
Fig. 2.4 Typical Stress-Strain Curve for SMI4S60 Bars . . . . . . . . . . . . . . . . . . . . . . . . . . . 50
Fig. 2.5 Typical Stress-Strain Curve for Ch5S60 Bars............................. 51
Fig. 2.6 Typical Stress-Strain Curve for Ch5S Bars . . . . . . .. . . . .. .. .. . .. . . .. . . . . . ... 52
Fig. 2.7 Typical Stress-Strain Curve for N5S Bars ......... ........................ 53
Fig. 2.8 Typical Stress-Strain Curve for FK5S60 Bars . . . . . . . . . . . . . . . . . . . . . . . . . . . .. 54
Fig. 2.9 Specimen prepared for Fatigue Tests .. . .. .. . . .. . . . .. . . . . . .. . . . . .. . . .. . . .. . . 55
Fig. 2.10 Schematic of Test Set-Up.................................................... 56
Fig. 2.11 S-N Curves for No. 4 ( 13 mm) Bars . . . . . . . . . . . . . . . . . . . . . . . . . . . . . . . . . . . . . . . . 57
Fig. 2.12 S-N Curves for No. 5 ( 16 mm) Bars . . . . . . . . . . . . . . . . . . . . . . . . . . . .. . . . . . . . . . .. 58
Fig. 2.13 Fatigue Crack Surfaces on Ch4S60 Bars . . . . . . . . . . . . . . . . . . . . . . . . . . . . . . . . . .. 59
Fig. 2.14 Fatigue Crack Surfaces on SMl4S60 Bars ......... ......... .... .. .. .. ..... 60
Fig. 2.15 Fatigue Crack Surfaces on ChSS60 Bars ........................ ........ ... 61
Fig. 2.16 Fatigue Crack Surfaces on Ch5S Bars...................................... 62
Fig. 2.17 Fatigue Crack Surfaces on N5S Bars .. . .. . . . . . .. . . . .. . . .. ... .. . . . . . .. .. .. . . 63
Fig. 2.18 Fatigue Crack Surfaces on FK5S60 Bars.................................. 64
Fig. 2.19 Scanning Electron Microscope Image of a Lug on a Ch4S60 Bar . . . ... 65
Fig. 2.20 Scanning Electron Microscope Image of a Lug on a SMl4S60 Bar . .. . 66
Fig. 2.21 Scanning Electron Microscope Image of a Lug on a Ch5S60 Bar...... 67
VII
LIST OF FIGURES (continued)
Page
Fig. 2.22 Scanning Electron Microscope Image of a Lug on a Ch5S Bar . . . . . . ... 68
Fig. 2.23 Scanning Electron Microscope Image of a Lug on a N5S Bar.......... 69
Fig. 2.24 Scanning Electron Microscope Image of a Lug on a FK5S60 Bar . . . ... 70
Fig. 3.1 Effect of Bar Diameter........................................................ 71
Fig. 3.2 Effect of Critical r/h Ratios . . . . . . . . . . . . . . . . . . . . . . . . . . . . . . . . . . . . . . . . . . . . . . . . ... 72
Fig. 3.3 Effect of Average w/h Ratios................................................ 73
Fig. 3 .4 Effect of the Sharpest Average Flank Angles . . . . . . . . . . . . . . . . . . . . . . . . . . . .. . 7 4
Fig. 3.5 Effect of Relative Rib Area (Rr) Values ... ..... .......... ..... .... ......... 75

1.1 General
l
CHAPTER ONE
INTRODUCTION
The requirements for reinforcing bar defonnation patterns used in the United States,
given in ASTM A 61 S/615M, A 616/616M, A 617 /6 l 7M, and A 706n06M, were established
over fifty years ago based on work by Clark ( 1946, 1949). Although a great deal has been
learned about the behavior of reinforced concrete members in the interim, no changes have
been made in those requirements.
Work has been under way at the University of Kansas since 1991 to determine if the
development characteristics of reinforcing bars can be improved by modifying the bar
deformation pattern. Early in the study, Darwin and Graham (1993a, 1993b) demonstrated
that, for uncoated reinforcement, the higher the relative rib area, Rr (ratio of projected rib
area normal to bar axis ro the product of the nominal bar diameter and the center-to-center rib
spacing). the higher the bond strength between reinforcing bars and concrete, if the bars are
confined by transverse reinforcement. If not confined, the bond strength of bars without
epoxy coating is insensitive to the specific combination of rib height and spacing. Darwin et
al. (1995, 1996) also found that epoxy-coating is less detrimental to the bond strength of high
relative rib area bars than to the bond strength of conventional bars, whether or not the bars
are confined by transverse reinforcement. As a result, the maximum development length
modification factor used for high relative rib area epoxy-coated bars could be reduced by 20
percent compared to current requirements. To date, however, there is no data available on the
fatigue performance of high relative rib area bars. Of particular concern is the effect of closer
and/or higher ribs on fatigue performance.
The phenomenon of weakening of a material as the result of repeated loads is called
fatigue (ACI Committee 215 1974). Fatigue is a process by which cracks initiate and then

2
propagate under cyclic loading in a structural member, resulting in damage or complete
fracture of the member. The magnitude of loading required to produce fatigue failure may be
much less than that needed to fail the material with a single application of load. Fatigue
strength is defined as the greatest stress which can be sustained for a given number of stress
cycles without failure (ACI Committee 215 1974). However, for design purposes, fatigue
strength is usually defined as the stress range a material can sustain without failure for a
specific number of cycles (Narayanaswamy et al. 1977).
Fatigue is not a major consideration in the design of most reinforced concrete structures.
To date, there have been no fatigue fractures reported for concrete structures under normal
service loading. However, reinforced concrete is widely used in bridges, offshore structures,
and machine foundations. These structures are subjected to time-dependent oscillatory loads
that result from vehicles, strong wave and wind action, and dynamic loading from machines.
The stresses due to these loads may cause fatigue in the structures and result in premature
failure.
Extensive research on the fatigue strength of conventional deformed bars has been
conducted over the years. Fatigue loading considerations for the United States are reviewed
by ACI Committee 215 (1974) and Helgason et al. (1976). Extensive data exists on the
fatigue characteristics of conventional reinforcing bars (values of Rr between 0.060 and
0.085) tested both in concrete and in the air. That data has been used to establish the
AASHTO requirements on fatigue (AASHTO Standard Specifications for Highway Bridges,
1996). No information, however, has been obtained on the fatigue behavior of the deformed
bars with high relative rib areas. Since bars with new deformation patterns and high relative
rib areas can be used under the provisions of ACI T2.1-98, there is a need to understand the
fatigue behavior of these bars.
This report describes fatigue tests of commercially produced No. 4 (13 mm) and No. 5
(16 mm) reinforcing bars with relative rib areas ranging from 0.064 to 0.146. The test results
show that fatigue behavior is insensitive to the relative rib area, but depends on the bar

3
surface geometry, especially the lug base radius-to-height (r/h.) ratio. Observations on the
location of crack initiation and characteristics of the fatigue failure surface are presented.
Details of test specimen preparation and gripping method, the greatest difficulty involved in
fatigue testing in air, are also provided.
1.2 Previous Work
Since the early 1950' s, considerable research has been performed on the fatigue behavior
of deformed and plain reinforcing bars, alone or embedded in concrete. especially in North
America, Europe, and Japan. This research has provided valuable information on the factors
that influence the fatigue behavior of reinforcing bars.
Pfister and Hognestad (1964) studied the fatigue behavior of reinforcing bars embedded
in concrete. The study covered three grades and four deformation patterns and included 181
reinforced concrete beams with straight or cold bent bars. They found that yield strength, test
beam cross section, and minimum stress level do not significantly affect the fatigue strength
of bars up to 2 million cycles. However, the fatigue strength for one deformation pattern was
35 percent lower than that of another, indicating that surface geometry has a strong effect on
the fatigue performance. They also observed that the fatigue strength of bars cold bent to 45
degrees was only 50 percent of that of straight bars. By examining the locations where the
fatigue cracks initiated, they concluded that all fatigue cracks initiate at the root of a lug.
Burton (1965) reported the results of fatigue tests on reinforcing bars embedded in
concrete. The tests were conducted using three stress ranges, 31, 35 and 39 ksi (214, 241, and
269 MPa), with a minimum tensile stress of 5 ksi (35 MPa), on concrete beams reinforced
with a single No. 8 (25 mm) reinforcing bar conforming to ASTM A 15 for grade and A 305
for the deformations. One deformation pattern produced by fresh rolls, partially worn rolls, or
fully worn rolls at the time of manufacture, was used. The longitudinal ribs were placed in a
horizontal plane (perpendicular to the plane of flexure) in half of the beams, and vertically in
the remainder. A total of thirty six 8 in. wide by 14 in. deep (203 mm by 356 mm) beams
4
were tested. Three major variables, position of the longitudinal ribs, surface geometry due to
different condition of the rolls at the time of manufacture, and stress range were investigated.
From the test results, Burton reported that stress range is the primary factor influencing
fatigue strength. As the stress range increases, fatigue strength decreases. The maximum
stress concentration occurred at the junction between the transverse and longitudinal ribs
instead of at the root of a lug. Burton also concluded that conditions of wear for the rolls had
a minor effect on the fatigue life of the bars in his study.
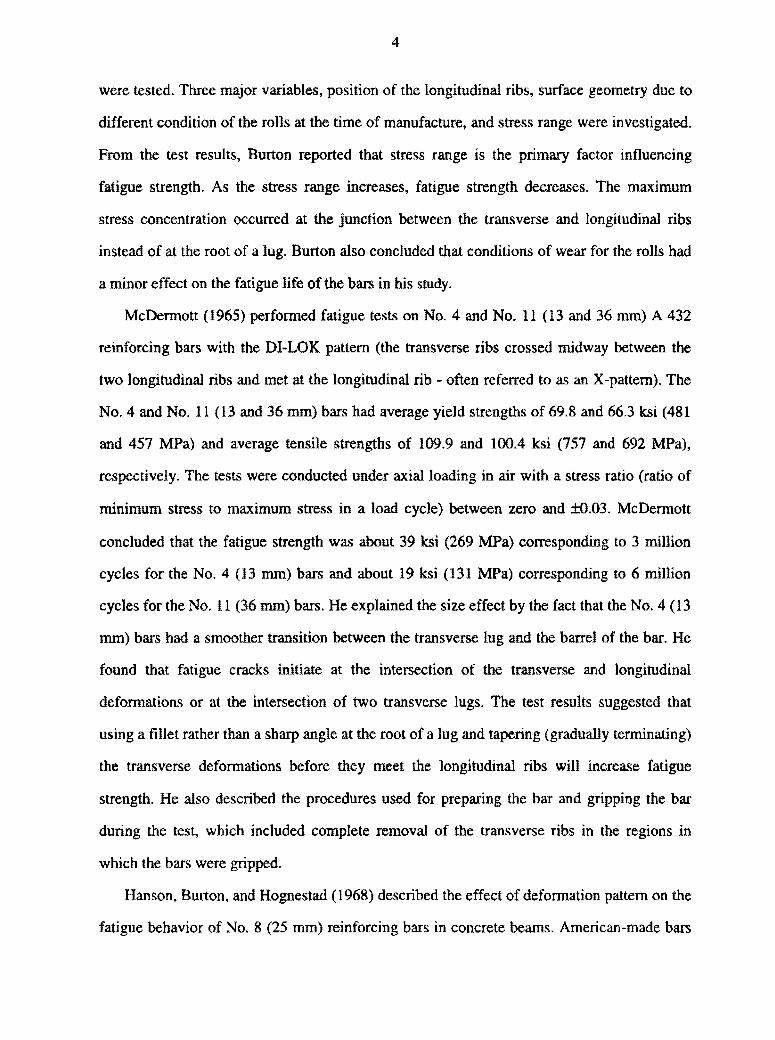
McDermott (1965) performed fatigue tests on No. 4 and No. 11 (13 and 36 mm) A 432
reinforcing bars with the DI-LOK pattern (the transverse ribs crossed midway between the
two longitudinal ribs and met at the longitudinal rib - often referred to as an X-pattern). The
No. 4 and No. 11 (13 and 36 mm) bars had average yield strengths of 69.8 and 66.3 ksi (481
and 457 MPa) and average tensile strengths of 109.9 and 100.4 ksi (757 and 692 MPa),
respectively. The tests were conducted under axial loading in air with a stress ratio (ratio of
minimum stress to maximum stress in a load cycle) between zero and ±0.03. McDermott
concluded that the fatigue strength was about 39 ksi (269 MPa) corresponding to 3 million
cycles for the No. 4 (13 mm) bars and about 19 ksi (131 MPa) corresponding to 6 million
cycles for the No. 11 (36 mm) bars. He explained the size effect by the fact that the No. 4 (13
mm) bars had a smoother transition between the transverse lug and the barrel of the bar. He
found that fatigue cracks initiate at the intersection of the transverse and longitudinal
deformations or at the intersection of two transverse lugs. The test results suggested that
using a fillet rather than a sharp angle at the root of a lug and tapering (gradually terminating)
the transverse deformations before they meet the longitudinal ribs will increase fatigue
strength. He also described the procedures used for preparing the bar and gripping the bar
during the test, which included complete removal of the transverse ribs in the regions in
which the bars were gripped.
Hanson, Burton, and Hognestad (1968) described the effect of deformation pattern on the
fatigue behavior of No. 8 (25 mm) reinforcing bars in concrete beams. American-made bars

5
(Series I) had crescent~shaped transverse lugs, while European-made bars (Series II) had
inclined transverse lugs. All of the bars had transverse lugs that did not merge into the
longitudinal ribs. The beams were 8 in. wide and 14 in. deep (203 mm by 356 mm)
reinforced with one No. 8 (25 mm) bar. Fourteen beams in Series I and 12 beams in Series II
were tested. They found that the fatigue strengths corresponding to 2 million cycles for
Series I and Series II bars were 26 ksi and 37.5 ksi (179 and 258 MPa), respectively. By
comparing the results with previous tests of American-made bars with transverse lugs that
merge into the longitudinal ribs, they found that fatigue strength is not necessarily improved
by terminating the transverse lugs before they meet the longitudinal rib, in contradiction to
the conclusion by McDermott ( 1965). They observed that fatigue cracks initiated at the base
of the crescent-shaped lugs in the Series I bars and adjacent to the sharp side of a lug (the
side with the smaller radius at the root of the lugs) in the Series II bars. The fracture surface
of Series I bars was a plane normal to the axis of the bar, while the fracture surf ace of Series
II bars was a plane inclined at an angle of about 45 degrees with the axis of the bar.
McDermott (1969) studied the fatigue characteristics in air of No. 8 (25 mm) A 615
Grade 60 reinforcing bars with different deformation patterns. Bars with the DI-LOK pattern,
bars with seven different experimental patterns, and four domestic competitors' bars were
included in the program. All tests were conducted under zero-to-tension axial load.
Sinusoidal load variation was selected, with a frequency of 7 Hz. The purpose of the tests
was to find the best deformation pattern for further development. From the test results,
McDermott found that bars with a four-start-helix transverse deformation pattern (a long
pitch spiral pattern in which a transverse cross-section of the bar crosses four transverse
deformations) had the best fatigue behavior of the bars tested. By examining the details of the
deformation patterns, McDermott found that decreasing the angle between the transverse lug
and the longitudinal rib and avoiding the intersection of two transverse deformations results
in an increase in fatigue strength. This report also described test specimen preparation. The
deformations were only partially removed from the end portions of the bar, instead of

6
completely machined off as described in his 1965 report, to avoid removing too much of the
cross-sectional area in the grip region. At both ends of the specimen, he used copper tubing
with fine white sand bonded to the inside surface with USS Nexus adhesive S-7001.
McDermott (1971) provided more information on the fatigue behavior of the four-start
helix bars described in his 1969 report and compared the fatigue behavior of the helix bars
with that of the DI-LOK bars in his 1965 report. In this report, the fatigue strength
corresponding to 4 million cycles for No. 10 (32 mm) and No. 4 (13 mm) helix bars were 29
ksi and 37.5 ksi (200 and 258 MPa), respectively. He observed that larger bars had lower
fatigue strength and explained it by the notch effect resulting from surface imperfections at
the ribs. which are more pronounced in the larger bars. McDermott concluded that the No. l 0
(32 mm) helix bars had better fatigue performance than the No. 11 (36 mm) DI-LOK bars
(McDermott 1965}. The No. 4 (13 mm) helix bars, however, do not appear to behave quite as
well as the earlier No. 4 (13 mm) DI-LOK bars. In general, he felt that the results for larger
bars can be conservatively applied to all bars and used as the basis for design criteria.
Overall, McDermott confirmed his 1969 conclusions that the fatigue characteristics of the
four-start-helix defonnation pattern are superior to those of the Dl·LOK pattern. The test
specimen preparation was the same as that described in his 1969 report except that this time
he used copper tubing only, instead of using the copper tubing with sand bonded to the inside
surface.
MacGregor, Jhamb, and Nuttall (1971) reported the fatigue behavior of No. 5 (16 mm),
No. 8 (25 mm), and No. 11 (36 mm) hot roJled deformed bars with nominal yield strengths of
40, 60, and 75 ksi (276, 413, and 517 MPa). The study included 72 flexural fatigue tests on
reinforced concrete beams containing one defonned bar and 36 standard rotating beam
fatigue tests on plain specimens machined from the bars. They observed that the fatigue
strength of the hot rolled deformed bars ranged from 29 to 37 ksi (200 to 255 MPa), at 5
million cycles, but was independent of grade. In contrast, the fatigue strength of the
specimens machined from the center of the deformed bars increased linearly with an increase

7
of the tensile strength of the bar. They explained the different effects of bar grade on the
fatigue strength of deformed bars and plain specimens by the stress concentrations at the base
of the deformations and the presence of a relatively low strength decarburized layer on the
outside of all the deformed bars. They also observed that larger bars had lower fatigue
strength and that fatigue cracks originated at the base of a transverse lug or at the point where
a transverse lug merged into a longitudinal rib.
Hanson, Helgason. and Ball (1972) studied the fatigue behavior of Grade 60 No. 8 (25
mm) bars on which the transverse lugs. inclined at an angle of about 45 degrees to the bar
axis, form helixes around the bar. Their investigation consisted of 24 fatigue tests of bars
embedded in T-shaped reinforced concrete beams. The minimum stress was 6 ksi (41MPa)
tension throughout the tests. Based on the test results, they concluded that the mean stress
range causing fatigue failure in 5 million cycles was 27.8 ksi (192 MPa). They examined the
fracture surf ace and found that 60 percent of the cracks began at the base of transverse lugs.
while the other cracks began at the edge of the bar identification marks.
Jhamb and MacGregor (1974a) studied the effect of surface geometry on the fatigue of
reinforcing bars. Their study included 88 No. 8 (25 mm) bar specimens and 32 plain
machined bar specimens tested in air under repeated axial loading to determine the effects of
the deformations, decarburization of the bar surf ace, rust and mill scale, and grade of steel.
They concluded that there is a significant decrease in fatigue strength due to the presence of
deformations and decarburization of the bar surf ace. Rust and mill scale do not influence
fatigue strength. The grade of steel had no influence on the fatigue strength of the deformed
bars, while specimens machined from the center of deformed bars showed a linear increase in
fatigue strength with the grade, matching the results of their 1971 report. They also observed
that the fatigue strength of bars tested in air was lower than that of bars tested in concrete
beams. Examining the fracture surface of the deformed bars, they found that the fatigue
failures originated at the base of a transverse lug. The fatigue fracture zone was a smooth
surface surrounded by a rough and crystalline tension fracture zone.

8
Jhamb and MacGregor (1974b) also studied the stress concentrations on the surface of
deformed bars. Typical hot rolled deformed reinforcing bars contain two longitudinal ribs
and a regular pattern of equally spaced transverse lugs, which cause stress concentrations. In
1974, there were no published values for stress concentration factors KT that represented the
stresses at the bases of deformations. They determined the values of KT using finite element
analysis and a 30-inch (762 mm) No. 8 (25 mm) specimen with electrical resistance strain
gages. Based on the study, Jhamb and MacGregor concluded that the ratio of the lug base
radius (r) to the lug height (h) has the most pronounced effect on Ky. The values of Ky
decrease with an increase in r/h value. The fatigue strength of the deformed bars decreases
when the ratio of radius to lug height r/h is less than about 1.25 and is almost constant for rib
ratios greater than 1.25.
Helgason, Hanson, Somes, Corley, and Hognestad (1976) studied the behavior of Grade
60 reinforcing bars in test programs designed to permit a valid statistical appraisal of the
factors that effect fatigue performance. The tests included 353 concrete beams, each
containing a single straight test bar as the main reinforcement. The major test variables were
stress range, minimum stress level, bar diameter, grade and surface geometry, and effective
beam depth. They observed that: (1) The stress range of the load cycle is the predominant
factor determining the fatigue life of the bar. There exists a limiting stress range, the fatigue
limit, above which a reinforcing bar is certain to fracture in fatigue and below which a
reinforcing bar may be able to sustain a virtually unlimited number of cycles. (2) For the
same stress range, the minimum stress level of a stress cycle has a significant effect on
fatigue strength in the finite-life region of the bars. An increase in the tensile minimum stress
(and, thus, an increase in the maximum stress) was found to result in a decrease in fatigue
strength. Fatigue strength was found to increase with an increasing compressive (more
negative) minimum stress. (3) Bar diameter and grade of bar were found to influence the
finite-life fatigue strength of reinforcing bars. Larger size bars have lower fatigue strength,
while higher grade bars have increased fatigue strength. The conclusion about the effect of

9
grade of steel on fatigue strength is in contradiction to the conclusions of MacGregor, Jhamb,
and Nuttall (1971) and Jhamb and MacGregor (1974a). (4) Transverse lugs and
manufacturer's bar identification marks cause stress concentrations at their juncture with the
barrel of a bar. The magnitude of a stress concentration is primarily related to the ratio of the
radius at the base of the deformation to its height. By examining the fracture surface, they
observed that fatigue fractures initiate at the base of a transverse lug or a bar mark. Fatigue
cracks propagate radially from the point of initiation in a direction perpendicular to the axis
of a bar. The relatively smooth, dull-appearing fatigue crack zone is surrounded by a rough,
crystalline tension fracture zone. Fatigue crack growth is most rapid near the end of the
fatigue life. Based on the test results and the statistical analysis, they provided an equation
for the design of flexural reinforcement in concrete members subjected to cyclic loading. The
equation is: fr= 21 - 0.33fmin + 8 (r/h), where fr= stress range (ksi), fmin = minimum stress
(ksi), r/h = ratio of base radius to rib height; if r/h is not known, a value of 0.3 can be used.
Narayanaswamy, Gupta, Chhauda, and Rajaraman (1977) studied the fatigue behavior of
Indian made cold-worked deformed bars. The bars had four longitudinal ribs and crescent
shaped transverse deformations. Their tests included 8 concrete beams with a 300 mm wide
by 350 mm (12 in. by 14 in.) deep cross-section, reinforced with one 25 mm (No. 8) bar at
the bottom of the beam. The stress range corresponding to 2 million loading cycles was 240
MPa (35 ksi), a result comparable to bars of similar type and grade made in Europe. They
also examined the fatigue fracture surface and observed that the point of crack initiation is at
the root of the transverse lugs or longitudinal ribs (the reasons for crack initiation for the
latter case is not clear). By applying a factor of safety of 1.4, they recommended a
permissible stress range value of 171.5 MPa (24.8 ksi) for the design of reinforced concrete
members subjected to repeated loading.
Moss provided information (1980) on the fatigue of British high-yield reinforcing bars
tested in air for use in updating BS5400, which concerned the design of bridges. Continuous
and butt-welded specimens using high-yield reinforcing bars were included in his test. The

10
experimental relationship between stress range and fatigue life for continuous bars had the
same form as the design curves incorporated in BS5400 at that time. The fatigue performance
of reinforcing bars was reduced by the presence of a butt weld. Moss observed that larger
bars were significantly less resistant to fatigue damage than smaller bars of the same type.
Examining the fracture surface, he found that fatigue cracks in continuous bars initiate at
small defects associated with the surface oxide layer and that the rib pattern on deformed
bars has little influence on the point of fatigue crack initiation. His observations do not match
earlier conclusions for U.S. bars that fatigue cracks start at the root of a transverse lug, at the
intersection between a transverse lug and a longitudinal rib, at the intersection of two
transverse lugs, or at the root of identification marks. (Pfister and Hognestad 1964.
McDermott 1965, Hanson, Burton, and Hognestad 1968, Hanson, Helgason, and Ball 1972,
Helgason, Hanson, Somes, Corley, and Hognestad 1976)
Matsumoto (1988) studied the fatigue characteristics of reinforcing bars in air and the
effect of cold-work (pre-strain) on fatigue strength. His experiments included two phases,
both using axial-tension fatigue tests on Grade 60 No. 3 (9.53 mm) straight bars. Fatigue tests
were conducted on 28 specimens to obtain the S-N curves for normal bars in Phase I. Nine
different stress ranges of constant-amplitude sinusoidal load (10 Hz) with 6 ksi (41 MPa)
minimum stress were used in this phase. In Phase II, 8 specimens were used to investigate the
effect of cold-work (pre-strain) on fatigue behavior, using a stress range and minimum stress
of 42 and 6 ksi (289 and 41 MPa), respectively. With the test results, Matsumoto found that
the fatigue strength of Grade 60 No. 3 (9.53 mm) normal bars was 32 ksi (221 MPa)
corresponding to 2 million cycles. The fatigue strength of prestrained (cold-worked) bars was
lower than that of the normal bars by 15 percent or less.
Zheng and Abel (1998) used finite element analysis to investigate stress concentrations
on the surface of bars. They constructed two models to simulate transverse lug patterns.
Model I simulated equally spaced transverse lugs, where each lug is relatively far away from
its neighbors. Model II simulated bars with unequally spaced lugs distributed in a way that a

11
lug is closer to its neighbor on one side but distant from its other neighbor. The results from
Model I showed that stress concentrations exist only in a very small area in the vicinity of the
root of a lug and that the greatest stress is at the junction between the root of the transverse
lug and the base material. From Model II, they found that when the distance between two
neighboring Jugs decreases, the stress concentration factor increases at the inner side of the
lugs and reaches a maximum value of 2.65 when two lugs merge. Zheng and Abel concluded
that the lug base radius-to-height ratio (rib) is the primary factor influencing the stress
concentrations. An increase in the rib ratio results in a decrease in stress concentrations and,
therefore, an increase in fatigue strength. Lug width-to-height ratio (wlh) and flank angles
have minor effects on the stress concentrations. Decreased wlh ratios and flank angles result
in decreased stress concentrations and, thus, an increase in fatigue strength. They also
observed that the stress concentration of bars with transverse lugs normal to the bar axis is
higher than that of bars with transverse lugs at an angle to the bar axis.
Thandavamoorthy (1999) studied the fatigue of quenched and tempered bars embedded
in concrete beams. The bars have low carbon content and are manufactured using the
Tempcore or Thermex process, in which bars are quenched with water after hot rolling,
resulting in a tough outer layer of tempered martensite (with residual compressive stress) and
a core of ferrite-pearlite (with residual tensile stress). The bars have greater ductility than
conventional bars. Eight concrete beams with a 150 x 300 mm (6 x 12 in.) cross-sections
were tested to verify whether the bars can resist the safe stress range for 2 million cycles
determined with the relationship fr= 21 - 0.33fmin + 8(r/h) (ksi) [fr= 145 - 0.33fmin + 55(r/h)
(MPa)] (Helgason et al. 1976) which is now recommended by ACI Committee 343 on Bridge
Structures (1991) and required by the AASHTO Bridge Specifications (1996). The beams
were subjected to sinusoidal constant amplitude loading at 5 Hz (two beams) and 10 Hz (six
beams). Four were under three-point bending and the other four were under four-point
bending. All of the beams sustained the designated stress range without failure for over 2

12
million cycles. Thandavamoorthy concluded that the test results indicated that the fatigue
strength of these bars is comparable to the fatigue strength of conventional bars.
Zheng and Abel (1999) also studied the fatigue performance of Tempcore bars. ln
contrast to Thandavamoorthy's (1999) tests, all of the bars in this study were tested under
axial loading in air instead of being embedded in concrete. Seven different diameters,
ranging from 12 mm to 36 mm (No. 4 to No. 11), with 400 MPa (58 MPa) nominal yield
strength were used in the program. The minimum stress level was 0 ksi. Based on the test
results, Zheng and Abel concluded that the fatigue behavior of the Australian-made
Tempcore bars is superior to that of conventional high-strength bars.
1.3 Obiect and Scoee
The purpose of this research is to compare the fatigue behavior of conventional and high
relative rib area reinforcing bars. Relative rib areas range from 0.064 to 0.146. This report is
also intended to provide information that will serve as a guide for preparing and testing small
diameter bars subjected to fatigue loading in air. Stress range-fatigue life curves, commonly
referred to as S-N curves, are obtained for the bars. h1 this study, four stress ranges [20, 25,
30, 35 ksi (138, 172, 207, and 241 MPa)] with 0 minimum stress level, two bar sizes [No. 4
and No. 5 (13 and 16 mm)], and 6 deformation patterns (Ch4S60, SMI4S60, Ch5S60, Ch5S,
N5S, and FK5S60) are used to evaluate the effects of stress range. bar diameter, surface
geometry, and relative rib area on the fatigue behavior of bars. The characteristics of the
fatigue crack surface and locations of the fatigue crack initiation are examined.
Chapter 2 presents the properties of the reinforcing bars, the test specimen preparation,
the test procedures, and the test results. Chapter 3 presents the evaluation and discussion of
the test results. Chapter 4 summarizes the research effort and presents the conclusions.

13
CHAPTER TWO
EXPERIMENTAL WORK
2.1 Overview of Experimental Work
The experimental program described in this report consisted of 69 fatigue tests of Grade
60 No. 4 (13 mm) and No. 5 (16 mm) reinforcing bars with relative rib areas ranging from
0.064 to 0.146. All of the tests were conducted in air under cyclic axial loading. The
minimum stress level was 0 ksi. The tests included 21 No. 4 (13 mm) bar specimens, 9
Ch4S60 bars and 12 SMI4S60 bars, and 48 No. 5 (16 mm) bars, 12 each of four patterns.
Ch5S60, Ch5S, N5S, and FK5S60. The bars are shown in Fig. 2.1.
The key parameters in the study are stress range (difference between the maximum and
minimum stress in a load cycle), bar size [No. 4 or No. 5 (13 mm or 16 mm)], surface
geometry, and relative rib area (0.064 to 0.146).
Four nominal stress ranges [20, 25, 30, and 35 ksi (138, 172, 207, and 241 MPa)] were
used. Bars that sustained 2 million cycles without breaking were considered to be loaded
below their fatigue strength (the greatest stress range under which a bar can sustain virtually
an unlimited number of cycles without failure). S-N curves, representing the relationship
between the stress range (S) and the number of cycles (N), were obtained. Detailed surface
geometries were measured and characteristics of the fatigue cracks were examined.
2.2 Test Specimens
The reinforcement used in this program included Grade 60 No. 4 (13 mm) and No. S (16
mm) bars with relative rib areas ranging from 0.064 to 0.146. The calculation of relative rib
area, Rr, is illustrated in Fig. 2.2. For the purposes of this study,

14
R, = ~(1- l:gaps) (2.1) s, p
where hr =average height of deformations, in. or mm (explained below)
Sr = average spacing of deformations, in. or mm
l:gaps = sum of the gaps between ends of transverse deformations, plus the width
of any continuous longitudinal lines used to represent the grade of the
bar multiplied by the ratio of the height of the line to hr, in. or mm
p = nominal perimeter of the bar, in. or mm
Two No. 4 (13 mm) bars with MlM (Manufacture Identification Marks) Ch4S60 and
SMI4S60 and 4 No. 5 (16 mm) bars with MIM Ch5S60, Ch5S, NSS, and FKSS60 were used.
The SMI4S60 (Rr = 0.064), NSS (Rr = 0.076), and FKSS60 (R, = 0.088) were conventional
bars, while the Ch4S60 (Rr = 0.128), Ch5S60 (Rr = 0.146), and Ch5S (Rr = 0.100) were high
relative rib area bars. The FK5S60 bar is a Thermex bar, and the other bars are hot rolled
bars.
The Ch4S60, SMI4S60, Ch5S60, and FKSS60 bars had two longitudinal ribs, while the
Ch5S and N5S bars had two main longitudinal ribs and an additional rib. indicating the bar
grade. All of the bars had equally spaced transverse deformations {also referred to as ribs or
lugs). The transverse lugs on the SMI4S60 and FK5S60 bars were normal to the bar axis,
while the transverse lugs of the other four bars were at an angle to the bar axis.
The deformation measurements of bars are summarized in Table 2.1. The transverse rib
height measurements used for calculating Rr are given in Table 2.2. The rib heights shown in
Table 2.2 were measured using a Starrett dial gage with a 0.01 mm least reading. To match
the other measurements, the rib heights are changed from millimeters in Table 2.2 to inches
in Table 2.1.

15
A sample of a bar, about three feet long, was selected and cleaned with a dry cloth to
remove dust to prepare for the rib height, rib spacing, and gap widths measurements. The rib
heights were measured at five locations, evenly distributed along the length of the bar. At
each location, the rib heights were measured at ten points around the bar perimeter (Table
2.2). The dial gage had a pointed tip to measure the rib heights. At each point, the rib height
is taken as the difference between measurements at the top of the rib and the barrel of the bar
(midway between the measured rib and an adjacent rib). The average rib height hr at each
location is a weighted average. The heights measured at the four points at the base of the
longitudinal ribs are weighted at one-half of the heights of the other six points
[(0.5(A+E+F+J)+(B+C+D+G+H+l))/8 Table 2.2J. The average rib height shown in Table 2.1
represents the average of the 5 locations. This value is slightly different from the ASTM
average, which is based on three measurements per deformation, one at the center of the
overall length and the other two at the quarter points of the overall length (ASTM 615).
The center-to-center rib spacing and gap width for the longitudinal ribs were measured
using a Peacock caliper with a 0.001 in. least reading. The average rib spacing was
determined by measuring the distance between the faces of two widely separated ribs and
divided by the number of ribs within the distance. Gap widths are determined at the points
where the longitudinal ribs meet the barrel of the bar. The gap width measurements were
taken at five locations (at least 3 ribs between two adjacent locations) along each longitudinal
rib. When a bar, such as Ch5S or NSS, had an extra longitudinal rib indicating the bar grade,
the height and width of that rib were also measured. The height was determined by taking the
difference between a measurement at the top of the rib and the average of measurements on
both sides of the rib where it meets the barrel of the bar. The width was measured similar to
gap width. Measurements on extra longitudinal ribs were taken midway between transverse
ribs at five locations along the bar.
The mechanical properties of the bars were obtained using standard tension tests on three
specimens for each type of bar. The results are given in Table 2.3. Typical stress-strain

16
curves for Ch4S60, SMI4S60, Ch5S60, Ch5S, NSS, and FK5S60 bars are shown in Figs. 2.3-
2.8. All bars met the requirements of ASTM A 615.
The fatigue test specimens were designed to fit the testing machine grips and provide a
test section length of at least five-bar diameters. The No. 4 (13 mm) and No. 5 (16 mm) bars,
had lengths of 12 inches and 13 inches (305 and 330 mm), respectively.
2.3 Specimen Preparation
Compared with fatigue tests of bars in concrete, tests of bars in air are cheaper, quicker
and easier to perform. However, establishing a technique for gripping the bars in the testing
machine can be difficult because the combination of the gripping force and the fatigue
loading may cause the test specimen to fail in the grip instead of in the test section. No
standard testing method has been established to determine the fatigue strength of deformed
reinforcing bars in the United States. Based on previous work, especially the techniques
developed by McDermott ( 1969 and 1971) and experience gathered from the pilot tests, a
procedure for specimen preparation was established. Specimens prepared using this
procedure are illustrated in Fig. 2.9.
All of the specimens were free of manufacture's identification marks because their effect
on the fatigue behavior of reinforcing bars is not considered in this study. Specimen
preparation involved machining the bars to partially remove the deformations, with a tapered
transition, at both ends of the bar. The tapered transition was introduced because it provided
a gradual and smooth surface change, thus, reducing the possibility of the introduction of a
stress concentration due to specimen preparation. The deformations were not completely
removed because complete removal reduced the cross-sectional area enough to cause the
specimen to break and made the bar difficult to grip. The higher gripping pressure needed to
prevent the bar from slipping caused the bar to break in the grips. After the bars were
machined, the ends of the bars were shot peened. The central portion of the bar was protected
during this operation by wrapping with multifold paper towels and UT-602 electrical tape. As
17
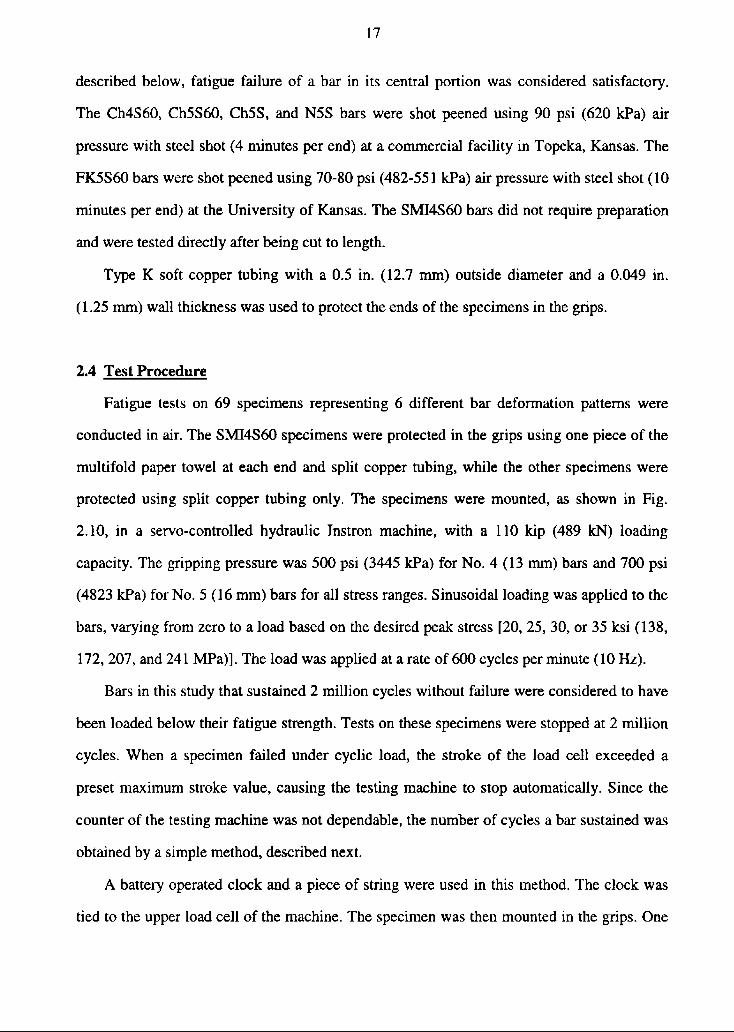
described below, fatigue failure of a bar in its central portion was considered satisfactory.
The Ch4S60, Ch5S60, Ch5S, and N5S bars were shot peened using 90 psi (620 kPa) air
pressure with steel shot (4 minutes per end) at a commercial facility in Topeka, Kansas. The
FK5S60 bars were shot peened using 70-80 psi (482-551 kPa) air pressure with steel shot (10
minutes per end) at the University of Kansas. The SMI4S60 bars did not require preparation
and were tested directly after being cut to length.
Type K soft copper tubing with a 0.5 in. (12.7 mm) outside diameter and a 0.049 in.
( 1.25 mm) wall thickness was used to protect the ends of the specimens in the grips.
2.4 Test Procedure
Fatigue tests on 69 specimens representing 6 different bar deformation patterns were
conducted in air. The SMI4S60 specimens were protected in the grips using one piece of the
multifold paper towel at each end and split copper tubing, while the other specimens were
protected using split copper tubing only. The specimens were mounted, as shown in Fig.
2.10, in a servo-controlled hydraulic Instron machine, with a 110 kip (489 kN) loading
capacity. The gripping pressure was 500 psi (3445 kPa) for No. 4 (13 mm) bars and 700 psi
(4823 kPa) for No. 5 (16 mm) bars for all stress ranges. Sinusoidal loading was applied to the
bars, varying from zero to a load based on the desired peak stress [20, 25, 30, or 35 ksi (138,
172, 207, and 241 MPa)]. The load was applied at a rate of 600 cycles per minute (10 Hz).
Bars in this study that sustained 2 million cycles without failure were considered to have
been loaded below their fatigue strength. Tests on these specimens were stopped at 2 million
cycles. When a specimen failed under cyclic load, the stroke of the load cell exceeded a
preset maximum stroke value, causing the testing machine to stop automatically. Since the
counter of the testing machine was not dependable, the number of cycles a bar sustained was
obtained by a simple method, described next.
A battery operated clock and a piece of string were used in this method. The clock was
tied to the upper load cell of the machine. The specimen was then mounted in the grips. One

18
end of the piece of string was tied to the bottom of the specimen; the other end was tied to a
battery in the clock. making sure that the string was almost tight. The fatigue test was started
in the load control mode, and the starting time was recorded. When the specimen broke, the
lower grip moved down, causing the string to pull out the battery, stopping the clock. The
number of cycles sustained was calculated based on the time difference and the loading
frequency.
Tests in which fatigue failure occurred within the central portion of the bars were
considered satisfactory. The results for any specimen that broke within the grips or shot
peened portions were not used. Testing of each type of bar at a particular stress range was
terminated when three satisfactory tests were obtained.
Because the fatigue test specimens were not perfectly straight and the grips of the
machine may not have been perfectly aligned, tensile stress (detrimental to fatigue) may be
introduced when a specimen was clamped in the jaws. To investigate the stresses introduced
by the gripping system, the surface deformations of a No. 5 (16 mm) bar were removed in the
central 4 in. ( 102 mm) portion of the specimen. The diameter of the section was 0.53 in.
(13.5 mm), as shown in Table 2.4. Three strain gages were glued on the surface of the central
part of the bar along the longitudinal axis. The gages were located 120 degrees apart around
the bar perimeter. Copper tubing was used at both ends of the specimen. The load on the
machine was preset at 0. Before the gripping pressure was applied, the initial strain readings
of the three strain gages were recorded. Then the gripping pressure was applied and the
machine was changed from Stroke Control to Load Control. Final strain values were then
obtained. The process was repeated two more times as the specimen in the grips was
repositioned. The results of the measurements are given in Table 2.4. The results indicate that
the specimen was not in a zero stress state before the fatigue loading was applied, and that
initial tensile stresses as high as 3 ksi (21 MPa) could have existed on the surface of the
specimen during a test.

19
After testing of the Ch5S60, Ch5S, and N5S bars was completed, the Instron machine
was recalibrated. According to the recalibration report, the nominal load was 95 percent of
the actual load that the specimen sustained. Therefore, the actual stress ranges for these three
types of bars were 21.05, 26.32, 31.58, and 36.84 ksi (145, 181, 218, and 254 MPa) instead
of 20, 25, 30, and 35 ksi ( 138, 172, 207, and 241 MPa).
Using the specimen preparation and gripping method described in this Chapter, a success
rate of greater than 80 percent was achieved for stress cycles from 0 ksi up to 35 ksi (241
MPa). Considering the pilot tests to establish the gripping techniques, about 150 specimens
were tested. The following test results represent the 69 successful specimens.
2.5 Test Results
The experimental results and observations are summarized in this section. Detailed
evaluation and discussion are presented in Chapter 3.
The fatigue test results are listed in Table 2.5. Plots of the S-N curves are shown in Fig.
2.11 for the No. 4 (13 mm) bars and in Fig. 2.12 for the No. 5 (16 mm) bars, respectively.
The best fit curves for the bars were based on the average number of cycles at each stress
range. Based on the report of Jhamb and MacGregor (1974a), the best fit equation was
chosen in the logarithm form for each series:
LogN=A+BS
where Log N = logarithm of number of cycles, to the base 1 O; N (million)
S = stress range, ksi
A, B = coefficients
Fatigue crack sections for Ch4S60, SMl4S60, Ch5S60, Ch5S, NSS, and FK5S60 bars are
shown in Figs. 2.13-2. 18. The images were obtained with a scanner.

20
To investigate the effect of the surface geometry on fatigue behavior, samples of the bars
were examined using a scanning electron microscope (SEM) interfaced with a digital image
acquisition system. One sample was taken from each type of bar. The sample was cut
through the longitudinal axis and prepared so that two complete deformations were left on
both sides of the sample as shown in Table 2.6. The sample was cleaned using degreaser and
100 percent alcohol to remove surf ace dust. Before measuring the bar samples, the SEM was
calibrated using a low magnification calibration standard with a 1 mm length and a 0.01 mm
least reading. The SEM was calibrated in both the horizontal and vertical directions. Lug
measurements were taken using the SEM images. Typical images are shown in Figs. 2.19-
2.24.
Lug base radii, flank angles, and heights and widths were measured following the
method described by Helgason et al. (1976). The lug base radii were determined using
different diameter circles on a template. Flank angles were determined by drawing the lug
base line and using a protractor to establish the angle that best represented the slopes of the
sides of the lug. The lug height was determined as the greatest height from the lug base line.
The lug width was determined as the distance along the lug base line between the points of
intersection of the tangent lines used to determine the flank angles. A schematic illustration
and the measurement results are shown in Table 2.6. The specimen has two lugs on each
side, representing 2 of about 40 lugs between the bar identification marks. The results in
Table 2.6 indicate that different sides (side 1 and side 2) of the specimen have different
surface geometry. On the same side of the specimen, different lugs have different properties.
Even for the same lug, the lug base radius (ra. rb) and flank angles (ex. {3) at the left and right
side are different.
The following test results were observed.
Stress Range: As expected, fatigue strength decreased as the stress range increased. The
Ch4S60 bars and SMI4S60 bars sustained 2 million cycles without breaking under stress
ranges of 25 ksi and 20 ksi ( 172 and 138 MPa), respectively.
21
Bar Size: For a given stress range, the No. 4 (13 mm) bars exhibited a longer fatigue life
than that the No. 5 (16mm) bars.
Surface Treatment: The Thennex bar (FK.5S60) did not show superior fatigue behavior
compared to the hot rolled bars of the same diameter (Ch5S60, Ch5S, and N5S).
Relative Rib Area: Of the No. 4 (13 mm) bars, the Ch4S60 bars had a higher value of
Rr (0.128) and a longer fatigue life than the SMI4S60 bars (Rr::;: 0.064). For the No. 5 (16
mm) bars, the S-N curves show very little difference, especially between the Ch5S60, Ch5S,
and NSS bars, with relative rib areas of 0.146, 0.100, and 0.076, respectively. The fatigue
strength of the test bars was insensitive to relative rib area.
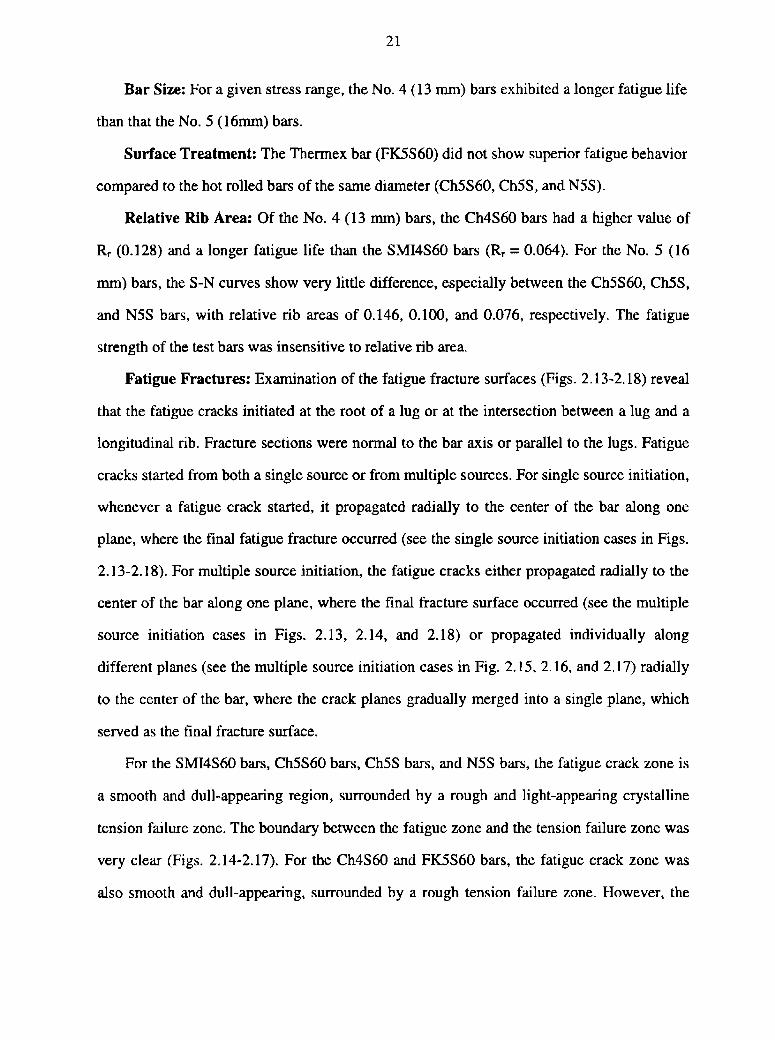
Fatigue Fractures: Examination of the fatigue fracture surfaces (Figs. 2.13-2.18) reveal
that the fatigue cracks initiated at the root of a lug or at the intersection between a lug and a
longitudinal rib. Fracture sections were normal to the bar axis or parallel to the lugs. Fatigue
cracks started from both a single source or from multiple sources. For single source initiation,
whenever a fatigue crack started, it propagated radially to the center of the bar along one
plane, where the final fatigue fracture occurred (see the single source initiation cases in Figs.
2.13-2.18). For multiple source initiation, the fatigue cracks either propagated radially to the
center of the bar along one plane, where the final fracture surface occurred (see the multiple
source initiation cases in Figs. 2.13, 2.14, and 2.18) or propagated individually along
different planes (see the multiple source initiation cases in Fig. 2.15, 2.16, and 2.17) radially
to the center of the bar, where the crack planes gradually merged into a single plane, which
served as the final fracture surf ace.
For the SMI4S60 bars, Ch5S60 bars, Ch5S bars, and N5S bars, the fatigue crack zone is
a smooth and dull-appearing region, surrounded by a rough and light-appearing crystalline
tension failure zone. The boundary between the fatigue zone and the tension failure zone was
very clear (Figs. 2.14-2.17). For the Ch4S60 and FK5S60 bars, the fatigue crack zone was
also smooth and dull-appearing, surrounded by a rough tension failure zone. However, the

22
tension failure zone did have a crystalline appearance and the boundary between the two
zones was not clear (Fig. 2.13 and Fig. 2.18).
Surface Geometry: Based on the images shown in Figs. 2.19-2.24 and the
measurements in Table 2.6, it is clear that different deformation patterns have completely
different lug geometries. For the No. 4 (13 mm) bars, the Ch4S60 and SMI4S60 bars have
critical r/h values of 1.31 and 0.79, respectively. For the No. 5 (16 mm) bars, the Ch5S60,
Ch5S, and NSS bars have slightly different critical r/h values of 0.78, 0.80, and 0.90,
respectively. While the FK5S60 bars have the lowest critical r/h value, 0.45, in the tests.

23
CHAPTER THREE
EVALUATION AND DISCUSSION OF TEST RESULTS
3.1 General
Jn this chapter, the results reported in Chapter 2 are evaluated. The effects of bar
diameter, surface geometry, and relative rib area on the fatigue performance of the bars are
discussed. The fatigue strength of reinforcing bars tested in this study is compared with
previous tests on bars in air and with the design criterion given by the AASHTO Bridge
Specifications ( 1996).
3.2 Effect of Bar Diameter
In the current tests, the fatigue behavior of the No. 4 ( 13 mm) bars is superior to that of
the No. 5 (16 mm) bars. The effect of bar diameter on the fatigue behavior of bars is shown
in Fig. 3.1. This observation is in agreement with results reported by McDermott (1965,
1971), MacGregor, Jhamb, and Nuttall (1971), Helgason et al. (1976), and Moss (1980) that
showed that the fatigue strength of deformed reinforcing bar decreases as the bar diameter
mcreases.
The increase in fatigue strength with decreased bar diameter, as explained by Weisman
( 1969), results from the additional work needed to produce smaller size bars. The additional
work in the rolling operation results in a finer grain structure and the fragmentation and
dispersion of inclusions. These factors produce an increase in fatigue strength. Osgood
( 1970) also attributes a significant part of the size effect to the total amount of work that the
material receives, particularly the reduction in thickness from the original ingot to the final
form. Kravshenko (1964) points out that an increase in the absolute dimensions of a bar
results in an increase in the surface area that is subjected to maximum stress. Thus, the larger
surface area increases the likelihood of a fatigue crack being initiated. Tetelman and McEvily

24
(1967) support Kravshenko's opinion and state that there is a size effect related to the
probability of finding a critical flaw within the most highly stressed regions. ACI Committee
215 (1974) attributes the size effect to the probability of finding a critical notch on the bar
surface, supporting the opinion of Tetelman and McEvily (1967). Both the extra work on the
smaller bars and the increased surface area on the larger bars likely play a role in the effect of
bar size on fatigue strength.
3.3 Effect of Surface Geometry
The transverse deformations on the surface of reinforcing bars provide improved
bond characteristics between the concrete and the steel. The surface geometry or deformation
pattern is designed primarily for bond characteristics, not fatigue considerations. The
transverse deformations, in addition to transmitting forces between steel and concrete, also
cause stress concentrations on the surface of the bar. which serve as potential fatigue crack
initiators. In the current tests. fatigue cracks started at the root of a lug or at the intersection
between a longitudinal rib and a lug, where the highest stress concentrations exist. The effect
of manufacture's identification marks on the fatigue behavior of the bars was not considered
in this study.
As described in Chapter 1, stress concentrations are related to the lug base radius-to
height ratio (r/h), to the lug width-to-height ratio (w/h), and to the flank angles. The lug base
radius-to-height ratio (r/h) is considered to be the prime factor affecting the stress
concentration factors (Hanson, Burton, and Hognestad 1968, MacGregor, Jhamb, and Nuttall
1971, Jhamb and MacGregor 1974a, 1974b, Helgason et al. 1976, Zheng and Abel 1998,
1999).
Based on the fatigue results shown in Table 2.5 and the SEM measurements shown in
Table 2.6, the effect of surface geometry such as the critical r/h ratio, average w/h ratio, and
the sharpest average flank angles are shown in Figs. 3.2-3.4. Comparisons are made based on
the average number of cycles (from best-fit lines) at 25 and 35 ksi (172 and 241 MPa) for

25
each pattern. In Fig. 3.4, for each type of bar, the sharpest average flank angle was obtained
by comparing the values of the average left flank angles and the average right flank angles of
the two lugs on each side of the specimen, as shown in Table 2.6.
For the No. 4 (13 mm) bars, N increases as the critical r/h ratio increases (Fig. 3.2). N
decreases as the average w/h ratio increases (Fig. 3.3). Thus, increased rib ratio and
decreased w/h ratio result in increased fatigue strength. This is in agreement with the
conclusions of Zheng and Abel (1998). However, as shown in Fig. 3.4, N increases as the
sharpest average flank angle increases.
For the No. 5 (16 mm) bars, N increases as the critical r/h ratio increases (Fig. 3.2), also
in agreement with Zheng and Abel's (1998) conclusions. However, the effects of average
w/h ratio and flank angle on the fatigue performance of the bars are not clear (Figs. 3.3 and
3.4).
The current results confirm the previous conclusions that the r/h value has a significant
influence on the fatigue behavior of deformed bars. The w/h value and flank angles have
much less effect. The lower the r/h ratio, the higher the resulting stress concentration.
Increasing the r/h value decreases the stress concentration, and, thus, results in an increase in
fatigue strength.
As mentioned in Chapter 1, Jhamb and MacGregor (1974b) reported that the fatigue
strength of deformed bars decreases when the r/h ratio is less than 1.25 and is almost constant
for r/h ratios greater than L25. In the current study, only the Ch4S60 bars had a critical r/h
ratio (1.31) greater than 1.25. Therefore, determining of fatigue strength is almost constant
for r/h ratios greater than 1.25 is not possible. However, for critical r/h ratios less than 1.25,
the number of cycles sustained clearly decreases as the r/h ratio decreases.
3.4 Effect of Relative Rib Area
As described in Chapter 1, high relative rib area bars have advantages over conventional
26
bars. But until the current study, the effect of increased relative rib area on the fatigue
behavior of deformed reinforcing bars has been unclear.
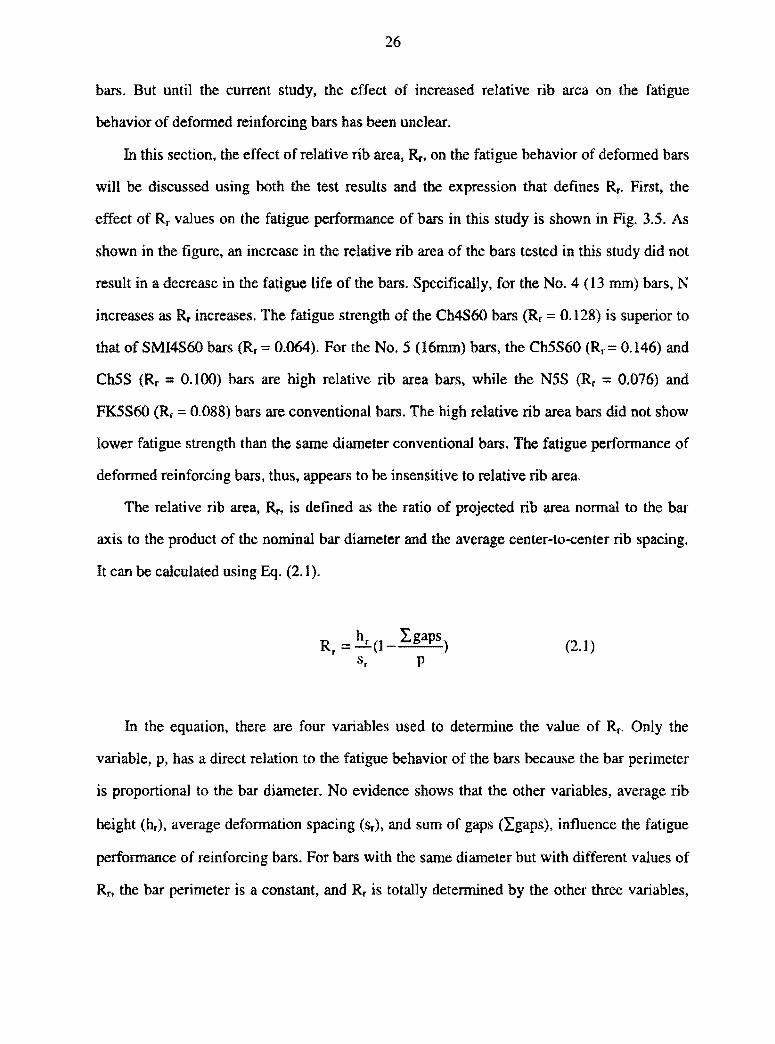
In this section, the effect of relative rib area, Rr, on the fatigue behavior of deformed bars
will be discussed using both the test results and the expression that defines Rr. First, the
effect of Rr values on the fatigue performance of bars in this study is shown in Fig. 3.5. As
shown in the figure, an increase in the relative rib area of the bars tested in this study did not
result in a decrease in the fatigue life of the bars. Specifically, for the No. 4 ( 13 mm) bars, N
increases as Rr increases. The fatigue strength of the Ch4S60 bars (Rr = 0.128) is superior to
that of SMI4S60 bars (Rr = 0.064). For the No. 5 (16mm) bars, the Ch5S60 (Rr= 0.146) and
ChSS (Rr = 0.100) bars are high relative rib area bars, while the N5S (Rr :;; 0.076) and
FK5S60 (Rr = 0.088) bars are conventional bars. The high relative rib area bars did not show
lower fatigue strength than the same diameter conventional bars. The fatigue performance of
deformed reinforcing bars, thus, appears to be insensitive to relative rib area.
The relative rib area, Rr, is defined as the ratio of projected rib area normal to the bar
axis to the product of the nominal bar diameter and the average center-to--center rib spacing.
It can be calculated using Eq. (2.1 ).
Rr = ~(1 I gaps) (2.1) s, p
In the equation, there are four variables used to determine the value of Rr. Only the
variable, p, has a direct relation to the fatigue behavior of the bars because the bar perimeter
is proportional to the bar diameter. No evidence shows that the other variables, average rib
height (hr), average deformation spacing (Sr), and sum of gaps (I.gaps), influence the fatigue
performance of reinforcing bars. For bars with the same diameter but with different values of
Rn the bar perimeter is a constant, and Rr is totally determined by the other three variables,
27
hr. Sr, and Z,gaps. Because none of these has any effect on fatigue strength, Rr should have no
effect on the fatigue strength of reinforcing bars.
The results clearly demonstrate that high relative rib area bars, because of the value of Rr
alone, should not be expected to show lowered fatigue strength compared with conventional
bars of the same diameter.
3.5 Comparison with Previous Test Results in Air
In the current study, fatigue tests were conducted on No. 4 (13 mm) and No. 5 (16 mm)
deformed bars. In this section, fatigue test results of small diameter deformed bars in air from
previous studies are compared with the current results.
In McDermott's 1965 report, the fatigue tests were conducted in air with a stress ratio
between 0 and± 0.03. The DI-LOK No. 4 (13 mm) bars had a fatigue strength of 39 ksi (269
MPa) at 3 million cycles.
In McDermott's 1971 report, No. 4 (13 mm) helix bars were tested in air with a stress
ratio of 0. The test results showed that the fatigue strength of the No. 4 (13 mm) bars was
37.5 ksi (258 MPa) at 4 million cycles.
In Moss's 1980 report, fatigue tests on British high-yield bars were conducted in air. The
fatigue strength of the 16 mm diameter continuous bars under constant amplitude cyclic
loading (stress ratio= 0.2) was 190 MPa (28 ksi) at 108 cycles.
In Matsumoto's 1988 report, Grade 60 No. 3 (9.53 mm) bars were tested in air with a
minimum stress of 6 ksi ( 41 MPa). The fatigue strength of the bars was 32 ksi (22 l MPa) at 2
million cycles.
In Zheng and Abel's 1999 report, the fatigue characteristics of Australian-made
Tempcore 12 mm (No. 4) to 36 mm (No. 11) bars were tested in air with a stress ratio of 0.
The fatigue strengths of the 12 mm (No. 4) and the 16 mm (No. 5) bars were 270 and 310
MPa (39 and 45 ksi), respectively, corresponding to 5 million cycles.

28
In the current study, fatigue tests of No. 4 (13 mm) and No. 5 (16 mm) bars were
conducted in air at a stress ratio of 0. The fatigue strengths of the Ch4S60 and SMl4S60 bars
were 25 ksi and 20 ksi (172 and 138 MPa), corresponding to 2 million cycles, respectively.
However, all of the No. 5 ( 16 mm) bars failed in less than 1 million cycles at 21.05 ksi ( 145
MPa) [20 ksi (138 MPa) for FK5S60 bars]. Thus, the fatigue performance of the bars tested
in this study was inferior to that obtained in the previous tests. One reason may come from
the fact, as described in Chapter 2 (Table 2.4), that before the fatigue load was applied,
tensile stresses were induced in the specimens when the specimens were gripped. These
tensile stresses [as high as 3 ksi (21 MPa)] result in an increased minimum stress, a positive
stress ratio instead of 0, and a higher maximum stress level. All of these factors are known to
decrease fatigue strength.
3.6 Comparison with AASHTO Fatigue Design Criteria
In real reinforced concrete members, it is hard to know the exact state of stress at the
root of a rolled deformation. It is also hard to know how forces are transmitted between
reinforcing bars and concrete at crack locations in the concrete. No statistically valid
comparison between fatigue tests of reinforcing bars in air and embedded in concrete has
been carried out (ACI Committee 215 1974). Questions exist as to whether a bar has the
same fatigue strength when tested in air as it does in a concrete member. And so far, no test
has been standardized in the United States to detennine the fatigue properties of deformed
reinforcing bars. Based on the equations developed by Helgason et al. (1976), the AASHTO
Bridge Specifications (1996) provides a simplified design criterion for straight deformed hot
rolled reinforcing bars embedded in concrete. According to that criterion, the design stress
range is
fr= 21 - 0.33fmin + 8(r/h) ksi (3. la)
fr= 145-0.33fmin+55(r/h)MPa (3. lb)

29
where ff = stress range, in ksi (MPa)
fmin =algebraic minimum stress, tension positive, compression negative, in ksi
(MP a)
rib = ratio of base radius to rib height, a value of 0.3 can be used
In the current tests, the minimum stress is 0 ksi. According to Eq. (3.1) above, the design
stress range should be 23.4 ksi (161.5 MPa). This means that for any stress range below 23.4
ksi (161.5 MPa), a bar in this experiment should sustain virtually an unlimited number of
cycles without breaking. Only the fatigue behavior of the Ch4S60 bars met this criterion.
Corresponding to 2 million cycles, the Ch4S60 bars did not break at a stress range of 25 ksi
(172 MPa). The SMI4S60 bars did not break at a stress range of 20 ksi (138 MPa) and were
not evaluated at fr= 23.4 ksi.
The No. 5 (16 mm) bars ill this study deviated significantly from the criteria in Eq. (3.1).
The bars broke after less than 1 million cycles for a stress range of 21.05 k:si (145 MPa) [20
ksi (138 MPa) for FK.5S60 bars]. These results, however, do not mean that the No. 5 (16
mm) bars in this study are not qualified for use in concrete structures subjected to fatigue
loading.
The principle reasons are two fold, both due to the severity of the current tests. First, the
bars had added stresses, as high as 3 ksi (21 MPa), induced due to the gripping mechanism.
Second, testing in air results in a shorter fatigue life than testing in concrete where the tensile
strength of concrete between cracks helps to limit the effect of the cyclic loading on
reinforcing steel. Thus, for most of the length of reinforcing bars embedded in concrete, the
tension stress is well below the value calculated by neglecting the tensile strength of the
concrete. Only at flexural cracks will reinforcing steel be subjected to the full stress, and
statistically, those locations are not expected to expose a region of the bar with the lowest
fatigue life. This contrasts with tests in air that involve a length of bar, all of which is

30
exposed to the maximum tensile stress, allowing the region with the lowest fatigue life to
govern.
4.1 Summary
31
CHAPTER FOUR
SUMMARY AND CONCLUSIONS
The purpose of this research is to study the fatigue performance of high relative rib area
bars and compare their performance with conventional bars. This study includes a review of
previous work; results from fatigue tests on 69 specimens under axial loading in air; and a
discussion of the factors that may influence the fatigue behavior of the bars. The major test
variables in this research are the stress range [20, 25, 30, and 35 ksi ( 138, 172, 207, and 241
MPa)] with 0 ksi minimum stress, bar diameter [No. 4 (13mm) and No. 5 (16mm)], surface
geometry (6 different bar deformation patterns), and relative rib area (0.064 to 0.146).
4.2 Conclusions
The following conclusions are made based on the test results and the discussion
presented in this report:
1. The results confirm previous conclusions that the stress range is the predominant
factor influencing the fatigue strength of reinforcing bars.
2. The results tend to confirm previous conclusions that there exists a stress range. the
fatigue strength above which a bar is certain to break in fatigue and below which a
bar can sustain a virtually unlimited number of cycles without fatigue failure.
3. Bar diameter has a significant effect on the fatigue strength of reinforcing bars. For
bars subjected to the same stress range, an increase in bar diameter results in a
decrease in fatigue strength.
4. Surface geometry has a great effect on the fatigue strength of reinforcing bars. The
lug base radius-to-height ratio (r/h) was found to have a primary influence on the

32
fatigue strength of the bars. For bars with the same diameter, the lower the r/h ratio,
the lower the fatigue strength.
5. Relative rib area value, Rr. does not effect the fatigue strength of deformed
reinforcing bars. High relative rib area bars exhibit similar fatigue performance to
conventional bars of the same bar diameter, subjected to the same stress range.
33
REFERENCES
AASHTO. 1996. "Standard Specifications for Highway Bridges," American Association of State Highway and Transportation Officials, Washington, D.C., pp. 183-184.
ACI Committee 215. 1974. Consideration for Design of Concrete Structures Subjected to Fatigue Loading (AC! 215R-74, 1997, Revised 1992), American Concrete Institute, Farmington Hills, MI> 24 pp.
ACI Innovation Task Group 2. 1998. Splice and Development Length of High Relative Rib Area Reinforcing Bars (ACI 2.1-98), An ACI Provisional Standard, American Concrete Institute, Farmington Hills, MI.
ASTM. "Standard Specification for Deformed and Plain Billet-Steel Bars for Concrete Reinforcement. (ASTM A 615/A 615M-96a)," 1999 Annual Book of ASTM Standards, Vol. 1.04, American Society of Testing and Materials, Philadelphia, PA, pp. 308-312.
ASTM. "Standard Specification for Rail-Steel Deformed and Plain Bars for Concrete Reinforcement. (ASTM A 616/A 616M-96a)," 1999 Annual Book of ASTM Standards, Vol. 1.04, American Society of Testing and Materials, Philadelphia, PA, pp. 313-316.
ASTM. "Standard Specification for Axle-Steel Deformed and Plain Bars for Concrete Reinforcement. (ASTM A 617/A617M-96a)," 1999 Annual Book of ASTM Standards, Vol. L04, American Society of Testing and Materials, Philadelphia, PA, pp. 317-320.
ASTM. "Standard Specification for Low-Alloy Steel Deformed and Plain Bars for Concrete Reinforcement. (ASTM 706n06M-96b)," 1999 Annual Book of ASTM Standards, Vol. 1.04, American Society of Testing and Materials, Philadelphia, PA, pp. 346-350.
Burton, K. T. 1965. "Fatigue Tests of Reinforcing Bars," Journal, PCA Research and Development Laboratories, Vol. 7, No. 3, Sept., pp. 13-23. Also, Development Department Bulletin No. 093, Portland Cement Association.
Clark, A. P. (1946) "Comparative Bond Efficiency of Deformed Concrete Reinforcing Bars," ACI Journal, Proceedings Vol. 43, No. 4, Dec .• pp. 381-400.
Darwin, D. and Graham, E. K. 1993a. "Effect of Deformation Height and Spacing on Bond Strength of Reinforcing Bars," SL Report 93-1, University of Kansas Center for Research, Lawrence, Kansas, Jan., 68 pp.
Darwin, D. and Graham, E. K. l 993b. "Effect of Deformation Height and Spacing on Bond Strength of Reinforcing Bars," AC/ Structural Journal, Nov.-Dec., Vol. 90, No. 6, pp. 646-657.

34
Darwin, D.; Tholen, M. L.~ Idun, E. K.; and Zuo, J. 1995. "Splice Strength of High Relative Rib Area Reinforcing Bars," SL Report 95-3, University of Kansas Center for Research, Lawrence, Kansas, May, 58 pp.
Darwin, D.; Tholen, M. L.; Idun, E. K.; and Zuo, J. 1996. "Splice Strength of High Relative Rib Area Reinforcing Bars," AC/ Structural Journal, Vol. 93, No. 1, Jan-Feb, pp. 95-107.
Hanson, J. M.; Burton, K. T.; and Hognestad, E. 1968. "Fatigue Tests of Reinforcing Bars Effect of Deformation Pattern," Journal, PCA Research and Development Laboratories, Vol. 10. No. 3, Sept., pp. 2-13. Also, Development Department Bulletin No. D145, Portland Cement Association.
Hanson, J.M.; Helgason, Th.; and Ball, C. 1972. "Fatigue Strength of Experimental No. 8 Grade 60 Helix Reinforcing Bars," Research and Development Laboratories, Cement and Concrete Research Institute, Portland Cement Association, June, 29 pp.
Helgason, T.; Hanson, T. M.; Somes, N. F.; Corley, W. G.; and Hognestad, E. 1976. "Fatigue Strength of High Yield Reinforcing Bars," National Cooperative Highway Research Program Report 164, Transportation Research Board, National Research Council, Washington, D. C.
Jharnb, J.C. and MacGregor, J. G. 1974a. "Effect of Surface Characteristics On Fatigue Strength of Reinforcing Steel," Abeles Symposium on Fatigue of Concrete, ACI SP 41, American Concrete Institute, Detroit, pp. 139-150.
Jharnb, I.C. and MacGregor, J. G. 1974b. "Stress Concentrations Caused By Reinforcing Bar Deformations," Abeles Symposium on Fatigue of Concrete, ACI SP 41, American Concrete Institute, Detroit, pp. 169-182.
Kravshenko, P. Ye. 1964. Fatigue Resistance, Pergamon Press, New York. 112 pp.
MacGregor, J. G.; Jhamb, I. C.; and Nuttall, N. 1971. "Fatigue Strength of Hot-Rolled Reinforcing Bars," ACI Journal, Proceedings Vol. 68, No. 3, Mar., pp. 169-179.
Matsumoto, N. 1988. "A Study on Fatigue Behavior of Cold-Worked Deformed Reinforcing Bars;• Proceedings of Japan Society of Civil Engineers, Vol. 9, No. 396, Aug., pp. 177-186.
McDermott, J. F. 1965. "Fatigue Tests of A 432 High-Strength-Steel Reinforcing Bars," Applied Research Laboratory Report 57.019-901 (5), November 12, 23 pp.
McDermott, J. F. 1969. "Fatigue Characteristics of Reinforcing Bars With Various Deformation Patterns," Applied Research Laboratory Report 45.019-001 (1), July 3, 30 pp.

35
McDennott, J. F. 1971. "Fatigue Strength of Grade 60 Reinforcing Bars With A Spiral Deformation Pattern," Applied Research Laboratory Report 57.019-452 (5), March 26, 20pp.
Moss, D.S. 1980. "Axial Fatigue of High-Yield Reinforcing Bars In Air," Transport and Road Research Laboratory, Department of The Environment, Department of Transport, Supplementary Report 622.
Narayanaswamy, V. P.; Gupta, V. K.; Chhauda, J. N.; and Rajaraman, A. 1977. "Experimental Investigation on The Fatigue Behavior of Cold-Worked Deformed Bars," Materials and Structures, Vol. 10, No. 57, May-June, pp. 153-158.
Osgood, C. 1970. Fatigue Design, Wiley-lnterscience, New York.
Pfister, J. F. and Hognestad, E. 1964. "High Strength Bars as Concrete Reinforcement, Part 6, Fatigue Tests." Journal, PCA Research and Development Laboratories, Vol. 6, No. 1, Jan., pp. 65-84. Also, Development Department Bulletin No. D74, Portland Cement Association.
Tetelman, A. S. and McEvily, JR., A. J. 1967. Fracture of Structural Materials, Wiley, New York, 697 pp.
Thandavamoorthy. T. S. 1999. "Static And Fatigue of High-Ductility Bars Reinforced Concrete Beams,n Journal of Materials in Civil Engineering, ASCE, Feb., pp. 41-50.
Weisman, M. H. 1969 "Detailed Design and Manufacturing Considerations," Metal Fatigue; Theory and Design, ed. A. F. Madayag, Wiley, New York.
Zheng, H. and Abel, A. 1998. ''Stress Concentration and Fatigue of Profiled Reinforcing Steels," International Journal of Fatigue, Vol. 20, No. 10, Nov., pp. 767-773.
Zheng, H. and Abel, A. 1999 ... Fatigue Properties of Reinforcing Steel Produced By TEMPCORE Process," Journal of Materials in Civil Engineering, ASCE, Vol. 11, No. 2 May, pp. 158-165.
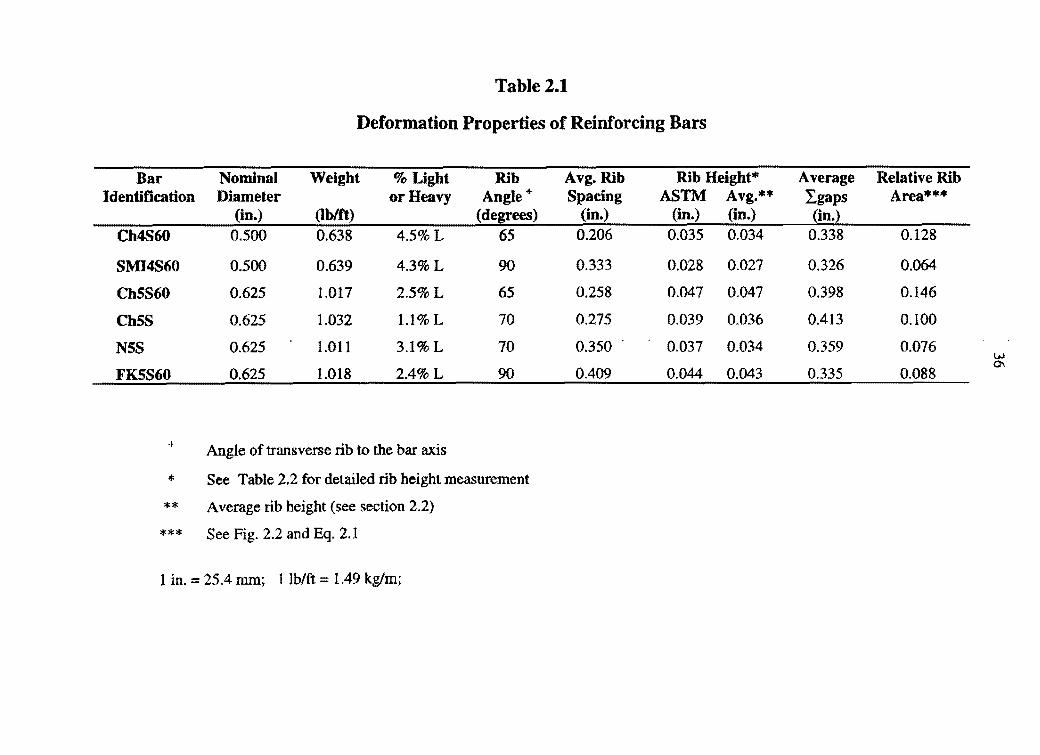
Table 2.1
Deformation Properties of Reinforcing Bars
Bar Identification
Ch4S60
SMI4S60
ChSS60
Ch SS
NSS
FKSS60
+
* ** ***
Nominal Weight % Light Rib Diameter or Heavy Angle+
(in.) (lb/ft) (degrees) 0.500 0.638 4.5%L 65
0.500 0.639 4.3%L 90
0.625 1.017 2.5%L 65
0.625 1.032 1.1% L 70
0.625 1.011 3.1%L 70
0.625 I.018 2.4%L 90
Angle of transverse rib to the bar axis
See Table 2.2 for detailed rib height measurement
Average rib height (see section 2.2)
See Fig. 2.2 and Eq. 2.1
I in. = 25.4 mm; 1 lb/ft= 1.49 kglm;
Avg. Rib Rib Height* Spacing ASTM Avg.**
(in.) (in.) (in.)
0.206 0.035 0.034
0.333 0.028 0.027
0.258 0.047 0.047
0.275 0.039 0.036
0.350 0.037 0.034
0.409 0.044 0.043
Average Relative Rib 2,gaps Area*** ~in.~
0.338 0.128
0.326 0.064
0.398 0.146
0.413 0.100
0.359 0.076 w
0.335 0.088 0\

Table 2.2
Rib Heights of Transverse Deformations on Bars Investigated
Am=E J F
I . H
I
Bar Rib Heights * (mm) Identification A B C D E F G H I J
Ch4S60 0.68 0.90 0.87 1.00 0.86 0.74 0.86 0.86 0.85 0.72 0.68 0.93 0.85 0.98 0.88 0.72 0.83 0.87 0.83 0.72
VJ 0.70 0.93 0.85 0.95 0.85 0.73 0.85 0.87 0.84 0.74 -...} 0.70 0.95 0.86 0.98 0.88 0.71 0.84 0.87 0.85 0.73 0.68 0.94 0.86 0.99 0.87 0.73 0.80 0.86 0.85 0.72
Sl\114S60 0.61 0.72 0.67 0.73 0.74 0.62 0.73 0.69 0.65 0.56 0.61 0.72 0.66 0.73 0.74 0.62 0.75 0.70 0.65 0.55 0.63 0.73 0.66 0.74 0.75 0.62 0.75 0.70 0.64 0.54 0.63 0.73 0.67 0.73 0.74 0.63 0.74 0.69 0.62 0.54 0.63 0.73 0.66 0.73 0.74 0.62 0.74 0.70 0.63 0.55
Ch5S60 1.42 1.32 1.25 1.25 1.15 1.00 1.32 0.82 1.25 1.15 1.45 1.33 1.23 1.26 1.13 1.00 1.33 0.85 1.25 1.14 1.41 1.32 1.20 1.26 1.10 1.00 1.34 0.95 1.25 1.11 1.43 1.31 1.23 1.25 1.10 1.03 1.34 0.85 1.25 1.14 1.43 1.32 1.22 1.25 1.09 1.00 1.33 0.83 1.26 1.14

Table 2.2 (continued)
Rib Heights of Transverse Deformations on Bars Investigated
Bar Rib Heights* ~mm~ Identification A B c D E F G H I J
Ch5S 0.60 0.96 0.86 1.04 0.89 1.02 1.26 0.88 0.90 0.56 0.61 0.98 0.89 I.03 0.86 1.02 1.22 0.87 0.92 0.56 0.57 0.99 0.90 1.03 0.84 1.07 1.21 0.88 0.91 0.54 0.63 0.96 0.89 1.00 0.82 1.10 1.24 0.86 0.89 0.55 0.61 0.95 0.88 1.01 0.85 1.16 1.20 0.88 0.92 0.52
NSS 0.66 0.77 0.95 1.20 0.80 0.56 0.70 0.90. 0.97 0.64 0.64 0.79 0.99 1.17 0.80 0.57 0.70 0.93 0.96 0.69 w
0.69 00
0.63 0.83 0.99 1.14 0.85 0.55 0.95 0.99 0.66 0.62 0.85 0.97 1.17 0.83 0.56 0.67 0.94 1.01 0.64 0.60 0.82 0.95 1.13 0.80 0.55 0.72 0.95 0.99 0.62
FKSS60 1.14 1.15 1.04 I.17 1.13 1.06 0.99 1.05 1.17 1.08 1.15 1.15 1.03 1.22 1.14 1.04 1.00 l.06 1.20 1.13 1.13 1.18 1.04 1.19 1.13 1.04 1.00 1.06 1.22 1.12 1.12 1.17 1.05 1.17 1.13 1.07 0.99 1.06 1.19 1.15 1.12 1.17 1.04 1.17 1.08 1.05 1.01 1.06 1.21 1.13
* Measured using Starrett dial gage with 0.0 I mm ]east reading

39
Table 2.3
Mechanical Properties of Reinforcing Bars
Bar Diameter L L' AL Elongation Yield Strength Tensile strength
Name (in) (in) (in) (in) AL/L (%) (ksi) (ksi) Ch4S60 0.500 8.000 9.500 1.500 18.75 71.0 103.9
0.500 8.000 9.250 .1.250 15.63 75.8 108.4
0.500 8.000 9.250 1.250 15.63 74.7 107.6
SMI4S60 0.500 8.000 ! 9.250 l.250 15.63 63.2 107.4
0.500 1.375 17.19 ""st 110.0
0.500 .375 1.375 17.19 107.9
Ch5S60 0.625 8.000 9.500 1.500 18.75 106.1
0.625 8.000 9.300 l.300 16.25 102.9
0.625 0 1.350 16.88 71.1 t- 102.3
_ f-9.500 Ch5S 0.625 1.500 18.75 65.3 102.7 -0.625 8.000 9.500 l.500 18.75 --·-0.625 8.000 9.450 1.450 18.13 6::u:s 98.9
N5S 0.625 8.000 9.450 1.450 18.13 71.1 115.3
0.625 8.000 9.400 1.400 17.50 72.6 109.8
0.625 8.000 9.450 1.450 18.13 72.l 109.5
FK5S60 0.625 8.000 9.525 ·l.525 19.06 77.4 103.4
0.625 ,.. ,...,...,...
".375 1.375 17.19 78.9 103.4
0.625 8.000 9.500 l.500 18.75 Ill ?. 103.2
where: L = original gage length, in.
L' = final gage length, in .
.6L = elongation of the bar, in.
1 in. = 25.4 mm; I ksi = 6.89 MPa;

40
Table 2.4 Stresses Introduced by Gripping System
+
Measuring Strain Gage Strain
Time Number (microstrain)
1 -14
1st Time 2 41
3 31
1 -12
2nd Time 2 34
3 92
1 -50
3rd Time 2 37
3 53
strain reading before the gripping pressure was applied
strain reading after the gripping pressure was applied
modulus of elasticity of the steel bar = 29 x 103 ksi
1 ksi = 6.89 MPa
o.s9l A I strain gage
I
4.5 in. 41n.
stntinpgc 1
2®t!ln. A
Stress
(ksi)
-0.41
1.19
0.90
-0.35
0.99
2.67
-1.45
1.07
1.54
4.Sln.
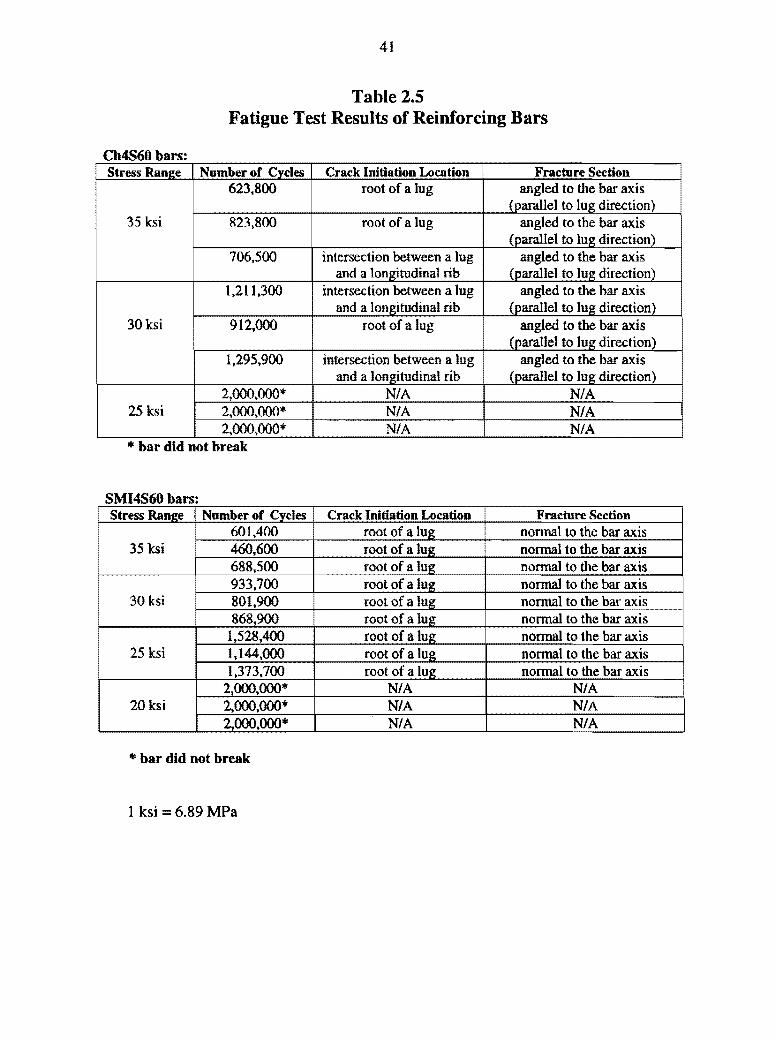
41
Table 2.5 Fatigue Test Results of Reinforcing Bars
Ch4S60 bars: Stress Ranee Number of Cycles Crack Initiation Location Fracture Section
623,800 root of a lug angled to the bar axis (parallel to lue: direction)
35 ksi 823,800 root of a lug angled to the bar axis (parallel to lue; direction)
706,500 intersection between a lug angled to the bar ax.is and a longitudinal rib (parallel to lu2 direction)
1,211,300 intersection between a lug angled to the bar axis and a longitudinal rib (parallel to lue; direction)
30ksi 912,000 root of a lug angled to the bar axis (parallel to lue: direction)
1,295,900 intersection between a lug angled to the bar axis and a longitudinal rib (parallel to lug direction)
2,000,000* = NIA NIA 25 ksi 2,000,000* NIA NIA
2,000,000* NIA NIA * bar did not break
SMI4S60 bars: Stress Ranee Number of Cvcles Crack Initiation Location Fracture Section
601,400 root of aluS?: nonnal to the bar axis 35 ksi 460,600 root of a lug normal to the bar a.xis
688,500 root of a lug normal to the bar axis 933,700 root of a lu2 nonnal to the bar axis
30ksi 801.900 root of a lug normal to the bar axis 868,900 root of a lusi; normal to the bar axis
1,528,400 root of a lug normal to the bar a.xis 25 ksi 1,144,000 root of a lug normal to the bar a.xis
1,373,700 root of a lu2 normal to the bar axis 2,000,000* NIA NIA
20ksi 2,000.000* NIA NIA 2,000,000* NIA NIA
• bar did not break
1 ksi = 6.89 MPa

ChSS60 bars: Stress Ran2e
36.84 ksi
31.58 ksi
26.32 ksi
21.05 ksi
42
Table 2.5 (continued) Fatigue Test Results of Reinforcing Bars
Number of Cvcles Crack Initiation Location Fracture Section 171,600 intersection between a lug normal to bar axis
and a.longitudinal rib 164,600 intersection between a lug normal to bar axis
and a lon~itudinal rib 168,900 intersection between a lug nonnal to bar axis
and a lon~itudinal rib 243,300 intersection between a lug normal to bar axis
and a longitudinal rib 317,200 intersection between a lug normal to bar axis
and a longitudinal rib 266,600 intersection between a lug normal to bar axis
and a lonRitudinal rib 409,800 intersection between a lug normal to bar axis
and a longitudinal rib 394,400 intersection between a lug normal to bar axis
and a longitudinal rib 381,700 intersection between a lug nonnal to bar axis
and a longitudinal rib 643,600 intersection between a lug normal to bar axis
and a lonlritudinal rib 676,600 intersection between a lug normal to bar axis
and a longitudinal rib 651.100 intersection between a lug nonnal to bar axis
and a longitudinal rib
l ksi = 6.89 MPa

43
Table 2.5 (continued) Fatigue Test Results of Reinforcing Bars
ChSS bars: Stress Ranee Number of Cvcles Crack Initiation Location Fracture Section
204,100 intersection between a lug normal to bar axis and a longitudinal rib
36.84 ksi 169,900 intersection between a lug normal to bar axis and a longitudinal rib
193,500 intersection between a Jug normal to bar axis and a longitudinal rib
281,200 intersection between a lug normal to bar axis and a longitudinal rib
31.58 ksi 255,300 intersection between a lug normal to bar axis and a lon~itudinal rib
312,800 intersection between a lug normal to bar axis and a longitudinal rib
430,800 intersection between a lug normal to bar axis and a longitudinal rib
26.32 ksi 417,800 intersection between a lug normal to bar axis and a longitudinal rib
424,400 intersection between a lug normal to bar axis and a longitudinal rib
720,700 intersection between a lug normal to bar axis and a longitudinal rib
21.05 ksi 659,800 intersection between a lug normal to bar axis and a lon~itudinal rib
701,700 intersection between a lug normal to bar axis and a longitudinal rib
1ksi=6.89 MPa

44
Table 2.5 (continued) Fatigue Test Results of Reinforcing Bars
NSS bars: Stress Ran2e Number of Cvcles Crack Initiation Location Fracture Section
210,800 root of a lug: normal to the bar axis 235,200 root of a lug angled to the bar axis
36.84 ksi (parallel to Jui;?; direction) 215,100 intersection between a lug normal to the bar axis
and a fomdtudinal rib 293,600 root of a lu2 nonnal to the bar axis
31.58 ksi 272,900 root of a lug normal to the bar axis 210,300 root of a lug angled to the bar axis
(parallel to lug direction) 410,400 root of a lug angled to the bar axis
(parallel to lug direction) 26.32ksi 396,600 root of a lug angled to the bar axis
(oarallel to lul? direction) 436,600 root of a lug normal to the bar axis 702,200 root of a lug = normal to the bar axis
21.05 ksi 660.400 root of a lug normal to the bar axis 679,600 root of a lu2 normal to the bar axis
FKSS60 bars: Stress Ranee Number of Cycles Crack Initiation Location Fracture Section
137,100 root of a lue: normal to the bar axis 35 ksi 173,000 root of a lu2 normal to the bar axis
162,900 root of a lug normal to the bar axis 270,100 root of a lue normal to the bar axis
30ksi 246.300 root of a luR nonnal to the bar axis 222,000 root of a lug onnal to the bar axis 360.600 root of a Jug nonnal to the bar axis
25 ksi 374,200 root of alu~ nonnal to the bac axis 282.000 root of a lug normal to the bar axis 657,400 root of a lug normal to the bar a.xis
20ksi 566,900 root of a Im! normal to the bar axis 604,100 root of a lu2 normal to the bar axis
I ksi = 6.89 MPa
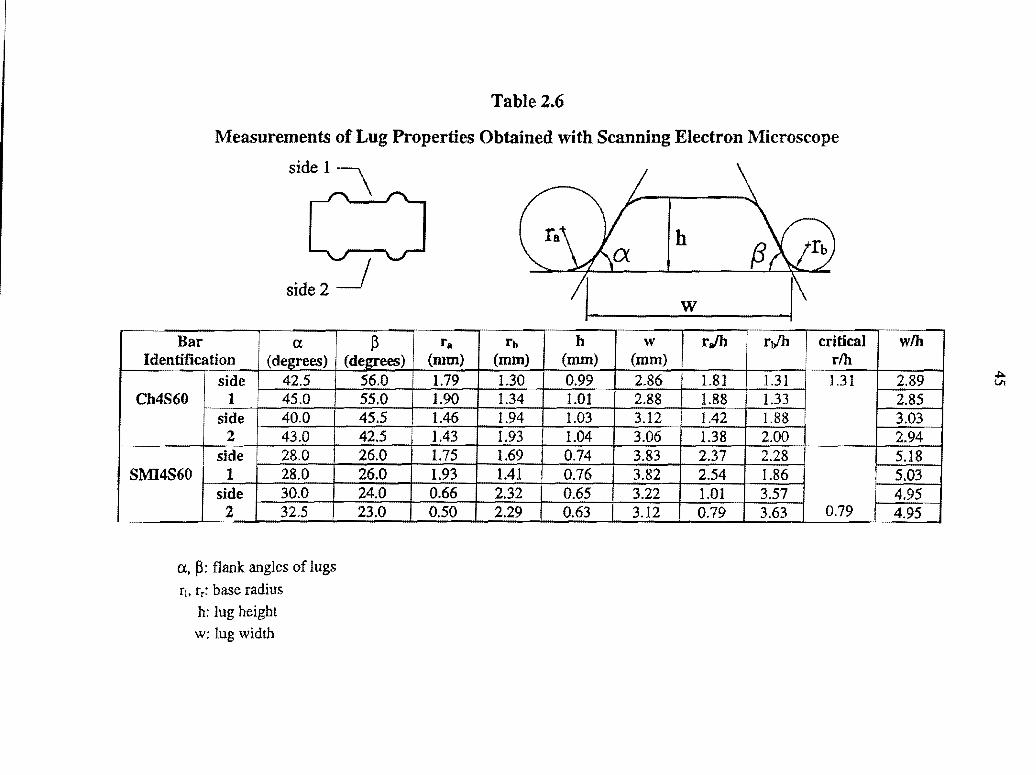
Table 2.6
Measurements of Lug Properties Obtained with Scanning Electron Microscope
Bar ex Identification (degrees)
side 42.5 Ch4S60 1 45.0
side 40.0 2 43.0
side 28.0 SMI4S60 1 28.0
side 30.0 2 32.5
ex, ~: flank angles of lugs r1, rr: base radius
h: lug height
w: lug width
~ ra rb (de2rees) (mm) (mm)
56.0 I.79 1.30 55.0 1.90 1.34 45.5 1.46 1.94 42.5 1.43 1.93 26.0 1.75 I.69 26.0 1.93 l.41 24.0 0.66 2.32 23.0 0.50 2.29
I ------,
h w rJh ri/h critical (mm) (mm) rib 0.99 2.86 1.81 1.31 1.31 1.01 2.88 1.88 1.33 1.03 3.12 1.42 1.88 1.04 3.06 1.38 2.00 0.74 3.83 2.37 2.28 0.76 3.82 2.54 I.86 0.65 3.22 1.01 3.57 0.63 3.12 0.79 3.63 0.79
w/h
2.89 2.85 3.03 2.94 5.18 5.03 4.95 4.95
~ Ui

Bar (l
Identification (degrees) ChSS60 I side 34.0
1 33.0 side 49.0
2 48.5 Ch SS I Side 46.5
1 48.0-Side 44.0
2 43.0 NSS I side 46.5
1 43.0 side 48.5
2 46.0 FKSS60 I Side 45.0
1 45.5 Side 41.5
2 43.0
~
Table 2.6 (continued)
Measurements of Lug Properties
r. rb h w (degrees) (mm) (mm) (mm) (mm)
52.0 1.78 1.43 1.25 3.85 49.0 1.86 1.41 1.27 4.10 53.0 1.15 1.71 1.48 3.69 48.0 1.35 l.76 1.52 3.95 45.0 1.26 1.01 1.27 3.82 46.0 1.35 1.15 1.30 3.79. 45.0 1.39 1.25 1.34 3.93 47.0 1.52 1.06 1.31 3.80 50.0 1.28 1.07 1.15 4.22 48.0 1.62 1.09 1.21 4.46 32.0 1.02 2.49 1.05 4.79 43.0 1.20 1.43 1.06 4.40 48.0 1.36 0.62 1.37 4.42 48.0 0.94 0.74 1.35 4.47 45.0 1.30 0.95 1.32 4.79 53.0 1.50 0.66 1.35 4.58
rJh ri/h critical I w/h r/h
1.42 1.14 3.08 1.32 1.11 3.23 0.78 1.16 0.78 2.49 0.89 1.16 2.36 0.99 0.80 0.80 3.01 1.04 0.88 Z.92 . 1.04 0.93 2.93 I .i::..
°' 1.16 0.81 2.90 1.11 0.93 3.67 1.34 0.90 0.90 3.69 0.97 2.37 4.56 1.13 1.35 4.15 0.99 0.45 0.45 3.23 0.70 0.55 3.31 0.98 0.72 3.63 1.11 0.49 3.39

. 47
Ch4S60 - .. - . .l ,..-. ~ - - --- - - ~
SMI4S60 . . .
Ch5S60
Ch5S
NSS
FK5S60
Fig. 2.1 Test Bars

Bearing Area
Bearing Area Rr= Shearing Area
Shearing Area
= _h_r (1--L_g_ap_s) s p r
Fig. 2.2 Schematic Illustration of Relative Rill Area (see Eq. 2.1)
~ 00

120
110
100
90
80
,-... 70 •• ~ ._, rl.I 60 VJ QI J..f ....
50 ~ ti)
I .j::.. \0
40
30
20
10
0
0 2 4 6 8 IO 12 14 16 18 20
Strain(%)
Fig. 2.3 Typical Stress-Strain Curve for Ch4S60 Bars

120
110
100
90
80
- 70 ..... lifJ
.!;id .._, lifJ 60 lifJ Q;l .... ~ 50 ~
I VI 0
40
30
20
10
0
0 2 4 6 8 10 12 14 16 18 20
Strain(%)
Fig. 2.4 Typical Stress-Strain Curve for SMI4S60 Bars
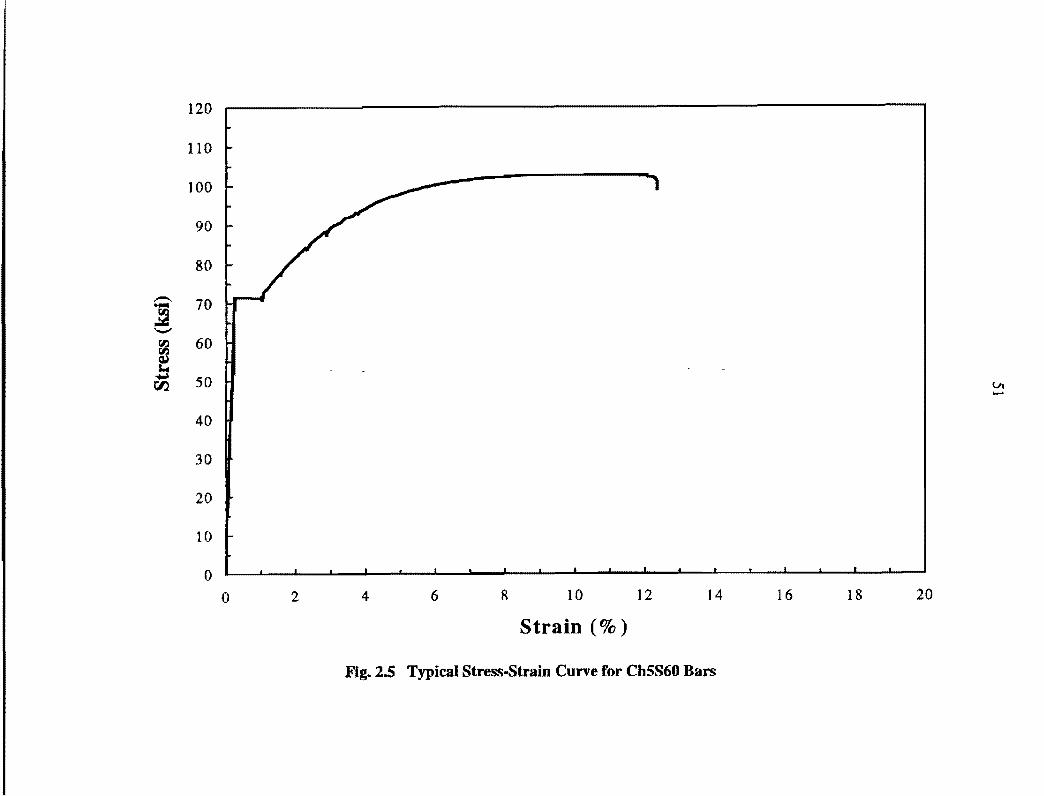
120
110
100
90
80
- 70 ..... rl:l ~ ....,,, rl:l 60 (;l.l ~ :... .... 50 ~ Lil ,._..
40
30
20
10
0
0 2 4 6 8 10 12 14 16 18 20
Strain(%)
Fig. 2.5 Typical Stress-Strain Curve for Ch5S60 Bars

120
110
100
90
80
,_ 70 ·-~ -ti:! 60
~ s.. ~ 50 H" I VI rJ'). ~
40
30
20
10
0
0 2 4 6 8 10 12 14 16 18 20
Strain(%)
Fig. 2.6 Typical Stress-Strain Curve for ChSS Bars
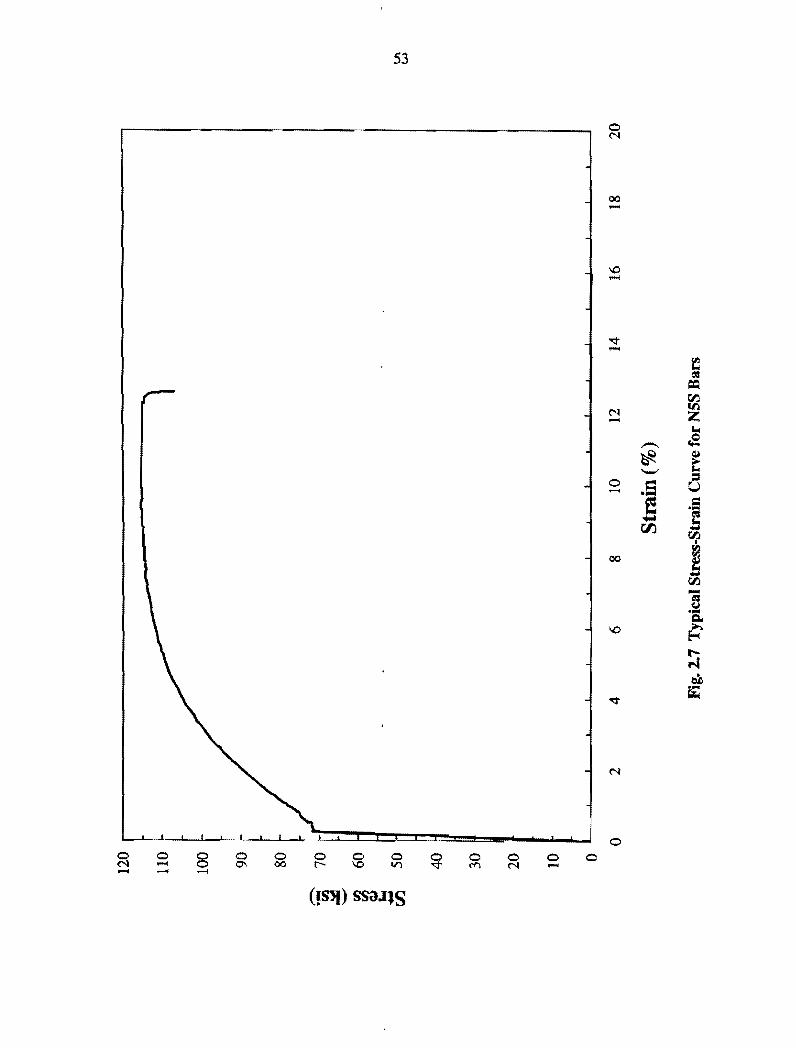
53
00 -
~ -N -0
00
0
-~ '--'
.5 Ii 00.
~ eis ~ il,j I.I) z "" ~ ~
t ::I u = ·-Cl
"" .... tl'J
I Cf.I
f .... tl'J -i= u ·-Cl..
~ t--. ""' . co ~

120
110
100
90
80
-- 70 ..... ~ -r.I} 60 r.I}
e! .... 50 ~J I
Lit 00 ~
40
30
20
10
0
0 2 4 6 8 10 12 14 16 18 20
Strain(%)
Fig. 2.8 Typical Stress-Strain Curve for FKSS60 Bars

. 55
l 12 in.
t 3in. 15· ~5r. 3in.
- itapered tapered - -
!o.49in.
i 4in. l 4in. l 4in. l , 1 , shot peened central portion shot peened
No.4 bar .
specimen
t 3 in. ]' 1 inj/tope"d top•••d~ in. t 3 in. t I ,, 7/ ~ #7T0 ~ I Jo.59 in.
13 in.
,l 4.5in. i 4in. ,l 4.5in. ~ shot peened central portion shot peened
No.5 bar specimen
R 0.50
Type K copper tubing
Fig. 2.9 Specimen Prepared for Fatigue Tests

I
I
/ / /
---
I
'·
/ /
56
----~Support columns ......
. . . . l I I I L..J
/ /
I
I
I
/ / /
Upper crosshead
oad cell L
Specimen
Lower crosshead
Hydraulic ram
Base fixture
Fig. 2.10 Schematic of Test Set-Up

15
0.1 1.0
Number of Cycles (N) (million) Fig. 2.11 S-N Curves for No. 4 (13 mm) Bars
10.0

-~ """" -rn """" <I.> c,,.I) c:I
~
!
40
35
30
25
20
15
0.1
•
...
FKSS60 Bar
N5S Bar
/Log N 0.51628 - 0.03337 S
• Ch5S60 Bar
• Ch5S Bar
"NSS Bar • FKSS60 Bar
ChSS Bar Log N = 0.53533 - 0.03859 S
• Log N = 0.58182 - 0.03569 S
Ch5S60 Bar
Log N = 0.58564 - 0.03672 S
Number of Cycles (N) (million) Fig. 2.12 S-N Curves for No. 5 (16 mm) Bars
a•
1.0
v. OQ

59
Fig. 2.13 Fatigue Crack Surfaces on Ch4S60 Bars
crack initiation
crack initiation

crack initiation
60
crack initiation
crack =~~===:::::i initiation
Fig. 2.14 Fatigue Crack Surfaces on SMI4S60 Bars

crack initi;ition
61
Fig. 2.15 Fatigue Cr-ack Surfaces on Ch5S60 Bars
crack initiation
crack initiation.

crack initiation
Fig. 2.16 Fatigue Crack Surfaces on Ch5S Bars
crack initiation
crack initiation

63
crack initiation Lo..:===~
Fig. 2.l!7 Fatigue Crack Surfaces on NSS Bars
crack initiation
crack initiation

crack initiation
crack initiation
64
Fig. 2.18 Fatigue Crack Surfaces on FK5S60 Bars

65
Fig. 2.19 Scanning Rlectroo Microscope Image of a LU?g on a Ch4S60 Bar

66
Fig. 2.20 Scanning Electron Microscope Image ·of a Lug on a SMI4S60 Bar

67
Fig. 2.21 Scanning Electron Microscope Image of a Lug on a ChSS60 Bar

68
Fig. 2.22 Scanning Electron Microscope Image of a Lug on a Ch SS Bu

69
Fig. 2;23 Scanning Electron Microscope Image of a Lug on a N5S Bar
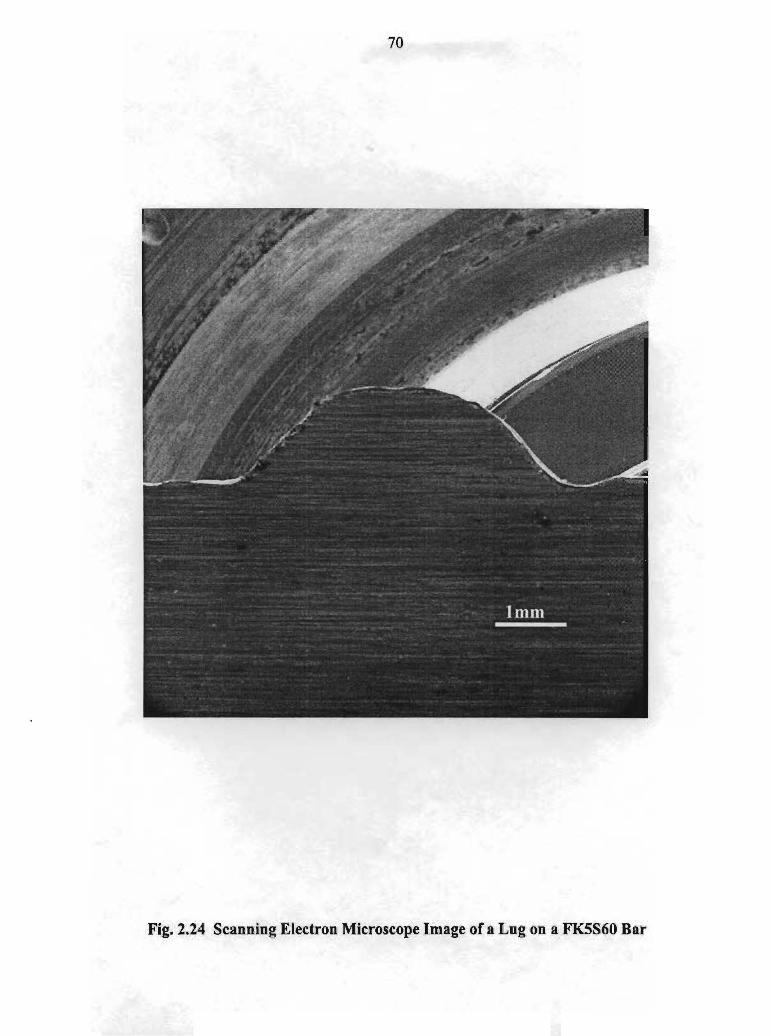
70
Fig. 2.24 Scanning Electron Microscope Image of a Lug. on a FK5S60 Bar

20
15
0. ~
_...
1 .0
Number of Cycles (N) (milli0n) Fig. 3.1 !Effect of Bar Diameter
10.0

2.5 ,,.........~~~~~~~~~~~~~~~~~~~~~~~-
-= 0 :.=
2.0
] II - 1.5 ~ -u >. u
c.... 0
~ 1.0 ..c s :s z
0.5
0.0
0
No. 5 Bars (25 ksi) -
No. 5 Bars (35 ksi)
0.2 0.4
No. 4 Bars (25 ksi)
No. 4 Bars (35 ksi)
0.6 0.8
Critical r/h Ratio Fig. 3.2 Ef(cct of Critical rib Ratios
__,,,...
1.2 l.4
-.J IV
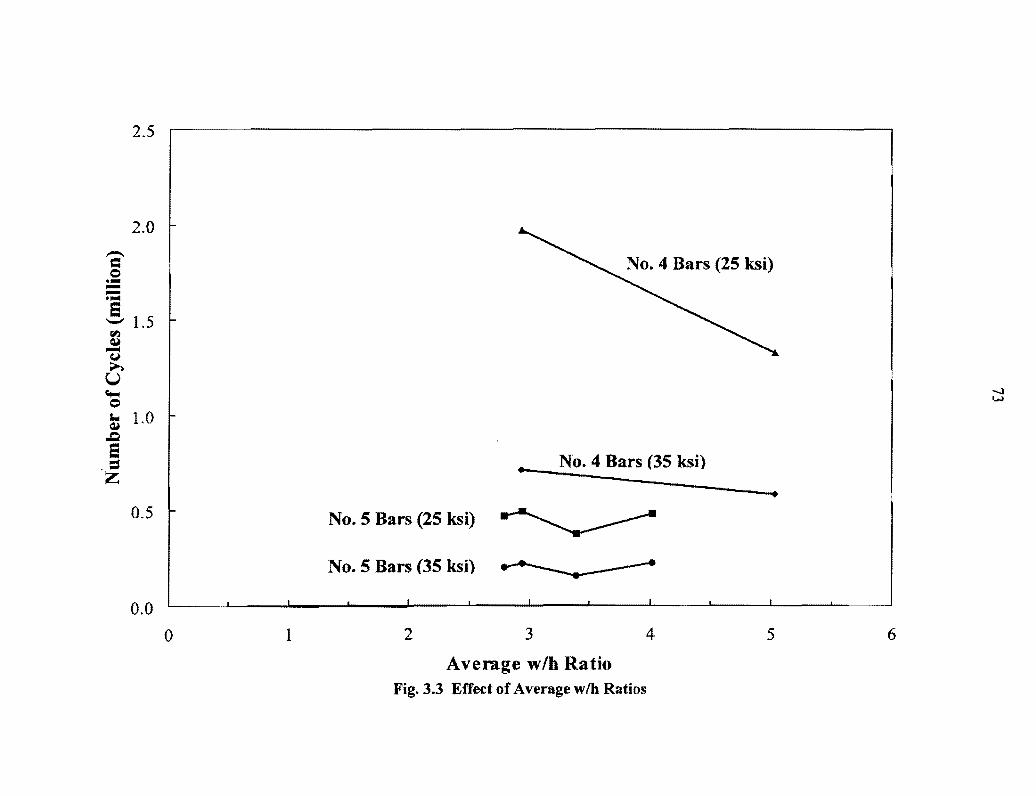
2.5
2.0
= 0 .,... --.,... e '-' 1.5
Gll'J
~ >. u ~ 0
t 1.0 .Q e -= z
0.5
0.0 0 1
No. 4 Bars (25 ksi)
No. 4 Bars (35 ksi)
No. 5 Bars (25 ksi) ~
No. 5 Bars (35 ksi) __.,___________
2 3 4
Average w/h Ratio Fig. 3.3 Effect of Average w /h Ratios
5 6
-...) w

,.-. = C> §
2.5
2.0
! 1.5 ~ ~ -CJ ;.... u -C>
t 1.0 ~ e = z
0.5
0.0
0 5 10
No. 4 Bars (25 ksi)
No. 4 Bars (35 ksi) _...
.. No. 5 Bars (25 ksi) ~ No. 5 Bars (35 ksi) ______.....____
15 20 25 30 35
Sharpest Average Flank Angle (degrees) Fig. 3.4 Effect of the Sharpest Average Flank Angles
40 45 50
-...J
"""
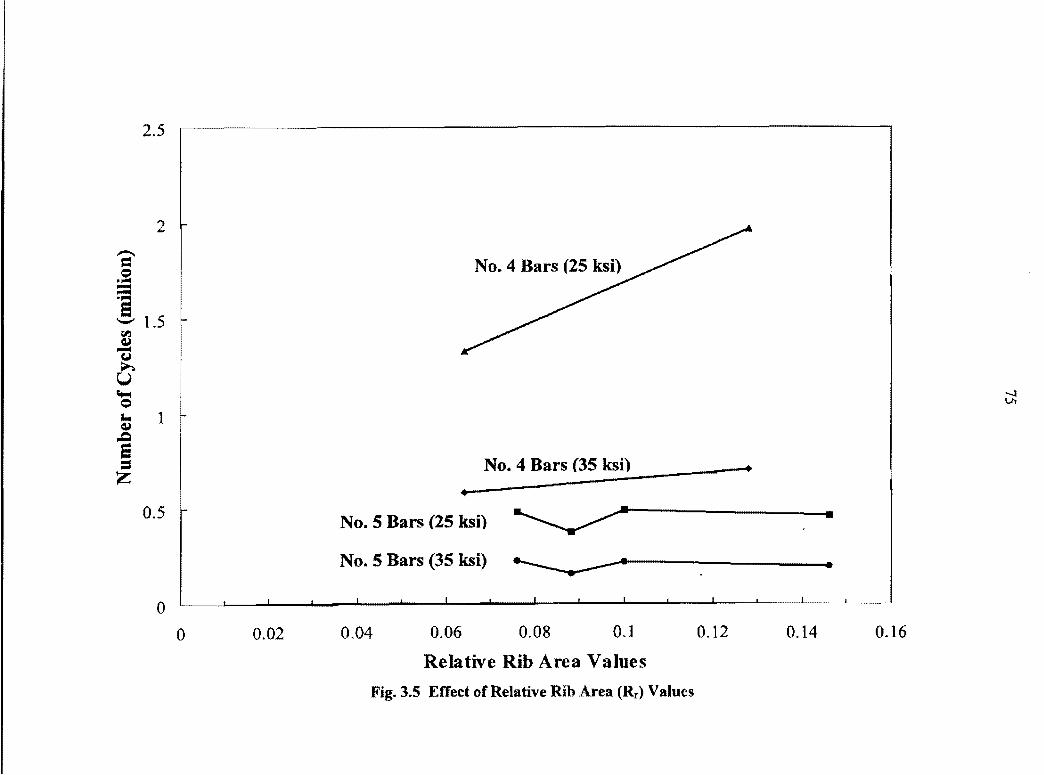
.-.. = = . """ = ••
2.5
2
e -- 1.5
rl.l Cl.> -Cj
~ u ~ = .. 1
Cl.> ,.Q
s = z 0.5
0
0 0.02
No. 4 Bars (25 ksi)
No. 4 Bars (35 ksi)
No. 5 Bars (25 ksi)
No. S Bars (35 ksi) .____
0.04 0.06 0.08 0.1
Relative Rib Area Values
Fig. 3.S Effect of Relative Rib Area (Rr) Values
0.12 0.14 0.16
-..J Vl

76
APPENDIX
NOMENCLATURE
fatigue: the phenomenon of rupture of a material, when subjected to repeated loading, at a stress substantially less than the static strength.
fatigue strength: the greatest stress which can be sustained for a given number of load cycles without failure. For design purposes, the fatigue strength is usually defined as the stress range sustained without failure for a specified number of cycles.
stress range: the difference between the maximum stress and the minimum stress in a stress cycle, (S).
S-N curve: the curve reflecting the relationship between the stress range (S) and the number of load cycles (N).
relative rib area: ratio of projected rib area normal to bar ax.is to the product of the nominal bar perimeter and the center-to-center rib spacing.