Fatigue life assessment of large scale T-jointed steel ... · Fatigue life assessment of large...
12
Cai, S., Chen, W., Kashani, M., Vardanega, P., & Taylor, C. (2017). Fatigue life assessment of large scale T-jointed steel truss bridge components. Journal of Constructional Steel Research, 133, 499-509. DOI: 10.1016/j.jcsr.2017.01.008 Publisher's PDF, also known as Version of record License (if available): CC BY Link to published version (if available): 10.1016/j.jcsr.2017.01.008 Link to publication record in Explore Bristol Research PDF-document This is the final published version of the article (version of record). It first appeared online via Elsevier at http://www.sciencedirect.com/science/article/pii/S0143974X17300081. Please refer to any applicable terms of use of the publisher. University of Bristol - Explore Bristol Research General rights This document is made available in accordance with publisher policies. Please cite only the published version using the reference above. Full terms of use are available: http://www.bristol.ac.uk/pure/about/ebr-terms
Transcript of Fatigue life assessment of large scale T-jointed steel ... · Fatigue life assessment of large...
Cai, S., Chen, W., Kashani, M., Vardanega, P., & Taylor, C. (2017). Fatiguelife assessment of large scale T-jointed steel truss bridge components.Journal of Constructional Steel Research, 133, 499-509. DOI:10.1016/j.jcsr.2017.01.008
Publisher's PDF, also known as Version of record
License (if available):CC BY
Link to published version (if available):10.1016/j.jcsr.2017.01.008
Link to publication record in Explore Bristol ResearchPDF-document
This is the final published version of the article (version of record). It first appeared online via Elsevier athttp://www.sciencedirect.com/science/article/pii/S0143974X17300081. Please refer to any applicable terms ofuse of the publisher.
University of Bristol - Explore Bristol ResearchGeneral rights
This document is made available in accordance with publisher policies. Please cite only the publishedversion using the reference above. Full terms of use are available:http://www.bristol.ac.uk/pure/about/ebr-terms
Journal of Constructional Steel Research 133 (2017) 499–509
Contents lists available at ScienceDirect
Journal of Constructional Steel Research
Fatigue life assessment of large scale T-jointed steel trussbridge components
Shunyao Cai a, Weizhen Chen a, Mohammad M. Kashani b,c, Paul J. Vardanega c,⁎, Colin A. Taylor c
a Department of Bridge Engineering, Tongji University, Chinab University of Southampton, Faculty of Engineering and the Environment, University of Southampton, United Kingdomc Department of Civil Engineering, University of Bristol, United Kingdom
⁎ Corresponding author.E-mail address: [email protected] (P.J. Varda
http://dx.doi.org/10.1016/j.jcsr.2017.01.0080143-974X/© 2017 The Authors. Published by Elsevier Ltd
a b s t r a c t
a r t i c l e i n f oArticle history:Received 26 July 2016Received in revised form 30 December 2016Accepted 1 January 2017Available online xxxx
Among current approaches for fatigue strength assessment, the effective notch stressmethod iswidely employedby practising engineers designingwelded joints. This is particularly important in the situationwhere the nominalstress and structural stress cannot be easily quantified. In this paper, the applicability of the so called effectivenotch stress approach on large-size T-joints in truss bridges is investigated through a comprehensive experimen-tal programme supported by numerical analysis. A series of large-scale fatigue tests on prototype large-size T-joints with cope holes were conducted. These types of joints are normally used in fully welded truss bridges. Fur-thermore, a simple parametric studywas conducted using finite element analysis to investigate the effect of platethickness and cope-hole radius on effective notch stress. Comparison of the results with commonly used designguidance documents reveals that the effective notch stress approach provides a conservative estimate of the fa-tigue strength of the specimens tested in this experimental programme.
© 2017 The Authors. Published by Elsevier Ltd. This is an open access article under the CC BY license (http://creativecommons.org/licenses/by/4.0/).
Keywords:Steel bridgesWelded jointsFatigueCope holesNotch stress
Notation list
The following symbols are used in this paper:
h height of butt weldKf fatigue notch factorN number of cyclesR cope hold radius (also denoted as Rch)ref fictitious notch radiust plate thicknesstf flange thicknesstw web thicknessw width of butt weldΔσk notch stress rangeΔσn nominal stress rangeΔσs structural stress rangeεhs hot spot strainε0.4t strain at 0.4t distance from weld toeε1.0t strain at 1.0t distance from weld toeσn nominal stressσk effective notch stress
nega).
. This is an open access article under
1. Introduction
Steel bridges are a very common type of bridge structural system [1].Estimation of the fatigue lives of these structures is an important task forbridge managers and owners [2]. The fatigue failure of the gusset plateconnecting the web member to the chord member is a commonly ob-served fatigue failure mechanism in truss bridges [3–6].
More modern rapid construction techniques tend to employ fullywelded truss bridge systems rather than more traditional methods,which often utilised combinations of both bolting and welding [2,7]. Infully welded connections either the gusset nodes or splices of thechord and bracingmembers are allwelded together,mainly using trans-verse butt welds [8,9]. In butt weld connections, once fatigue cracks de-velop, further propagation will affect both the connection and theconnected components.
Furthermore, the so called nominal stress approach (the global effect,see [10–12]) is a commonly employed method used in industry thatprovides a simple assessment procedure for practising engineers to as-sess the performance of welded joints [10–12]. However, this methodexcludes stress-concentration effects (local effect) which is counter tothe current state of practice which calls for detailed analysis to developbetter optimised construction methods [13,14]. On the other hand, thestructural stress approach (the local effect), takes account of the influ-ence of overall geometry and, according to recommendations from theInternational Institute of Welding (IIW) [12], structural stress can be de-rived by extrapolation of local strains measured at a specific distance
the CC BY license (http://creativecommons.org/licenses/by/4.0/).
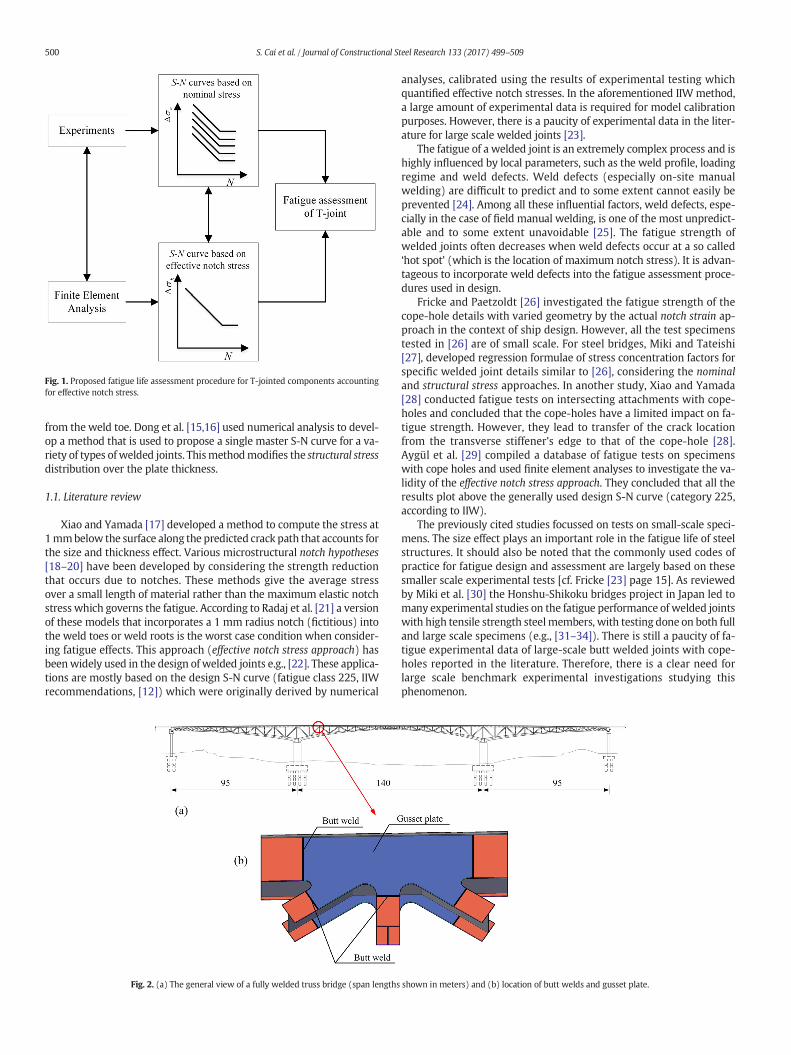
Fig. 1. Proposed fatigue life assessment procedure for T-jointed components accountingfor effective notch stress.
500 S. Cai et al. / Journal of Constructional Steel Research 133 (2017) 499–509
from the weld toe. Dong et al. [15,16] used numerical analysis to devel-op a method that is used to propose a single master S-N curve for a va-riety of types ofwelded joints. Thismethodmodifies the structural stressdistribution over the plate thickness.
1.1. Literature review
Xiao and Yamada [17] developed a method to compute the stress at1mmbelow the surface along the predicted crack path that accounts forthe size and thickness effect. Various microstructural notch hypotheses[18–20] have been developed by considering the strength reductionthat occurs due to notches. These methods give the average stressover a small length of material rather than the maximum elastic notchstress which governs the fatigue. According to Radaj et al. [21] a versionof these models that incorporates a 1 mm radius notch (fictitious) intothe weld toes or weld roots is the worst case condition when consider-ing fatigue effects. This approach (effective notch stress approach) hasbeenwidely used in the design of welded joints e.g., [22]. These applica-tions are mostly based on the design S-N curve (fatigue class 225, IIWrecommendations, [12]) which were originally derived by numerical
Fig. 2. (a) The general view of a fully welded truss bridge (span lengths
analyses, calibrated using the results of experimental testing whichquantified effective notch stresses. In the aforementioned IIW method,a large amount of experimental data is required for model calibrationpurposes. However, there is a paucity of experimental data in the liter-ature for large scale welded joints [23].
The fatigue of a welded joint is an extremely complex process and ishighly influenced by local parameters, such as the weld profile, loadingregime and weld defects. Weld defects (especially on-site manualwelding) are difficult to predict and to some extent cannot easily beprevented [24]. Among all these influential factors, weld defects, espe-cially in the case of field manual welding, is one of the most unpredict-able and to some extent unavoidable [25]. The fatigue strength ofwelded joints often decreases when weld defects occur at a so called‘hot spot’ (which is the location of maximum notch stress). It is advan-tageous to incorporate weld defects into the fatigue assessment proce-dures used in design.
Fricke and Paetzoldt [26] investigated the fatigue strength of thecope-hole details with varied geometry by the actual notch strain ap-proach in the context of ship design. However, all the test specimenstested in [26] are of small scale. For steel bridges, Miki and Tateishi[27], developed regression formulae of stress concentration factors forspecific welded joint details similar to [26], considering the nominaland structural stress approaches. In another study, Xiao and Yamada[28] conducted fatigue tests on intersecting attachments with cope-holes and concluded that the cope-holes have a limited impact on fa-tigue strength. However, they lead to transfer of the crack locationfrom the transverse stiffener's edge to that of the cope-hole [28].Aygül et al. [29] compiled a database of fatigue tests on specimenswith cope holes and used finite element analyses to investigate the va-lidity of the effective notch stress approach. They concluded that all theresults plot above the generally used design S-N curve (category 225,according to IIW).
The previously cited studies focussed on tests on small-scale speci-mens. The size effect plays an important role in the fatigue life of steelstructures. It should also be noted that the commonly used codes ofpractice for fatigue design and assessment are largely based on thesesmaller scale experimental tests [cf. Fricke [23] page 15]. As reviewedby Miki et al. [30] the Honshu-Shikoku bridges project in Japan led tomany experimental studies on the fatigue performance of welded jointswith high tensile strength steelmembers, with testing done on both fulland large scale specimens (e.g., [31–34]). There is still a paucity of fa-tigue experimental data of large-scale butt welded joints with cope-holes reported in the literature. Therefore, there is a clear need forlarge scale benchmark experimental investigations studying thisphenomenon.
shown in meters) and (b) location of butt welds and gusset plate.

Fig. 3. The geometry of specimens (mm), and the location of strain gauge.
501S. Cai et al. / Journal of Constructional Steel Research 133 (2017) 499–509
1.2. Research plan
The research presented in this paper aims to investigate the fatiguestrength of typical welded joints from a fully welded truss bridge inChina. The research programme includes a series of benchmark testson large-scale T-joint specimens with different connection types withand without varying cope-hole arrangements. This experimental datais then compared with the simple prediction models in two commonlyused codes of practice [11,12].
Fig. 4. Experimental se
Furthermore, the applicability of the effective notch stress ap-proach (the local effect) for the fatigue assessment of large-size T-joints with cope-holes is also explored (using finite element analysisas these phenomena cannot be directly explored with experiments).To investigate the fatigue life of transverse butt welds on the web orflanges, fatigue tests of two types of T-joint were conducted. The fa-tigue life of the specimens, employing the effective notch stress ap-proach, is explored using finite element modelling of the testedcomponents. The influences of parameters affecting the fatigue life
t-up (unit: mm).
Fig. 5. Location of cracks (joint type B) via magnetic particle inspection (photograph (a) is taken from [35]).
502 S. Cai et al. / Journal of Constructional Steel Research 133 (2017) 499–509
of T-joints are then explored by a parametric study using the validat-ed finite element model. The research process undertaken is showndiagrammatically in Fig. 1. This is done through a comprehensive,large-scale benchmark experimental testing regime of T-jointed,fully welded truss bridge components. Some aspects of this studyhave been reported previously in a short conference paper by Caiet al. [35].
2. Experimental programme
2.1. Test specimens
The truss components tested in the experimentsweremanufacturedbased on the as-built construction details of a newly-built highwaybridge (a fully welded truss bridge, as shown in Fig. 2a) located in Tian-jin, in the north of China. This bridge consists of a rectangular box sec-tion as the top chord with I-shaped sections as the bracing members(Fig. 2b). The two connection types tested were:
• K-T joints (Fig. 2b). A large gusset plate connects the top chord andbracing members mainly by a transverse butt weld; and
• The top chord and bracing member splices (Fig. 3c, a, respectively).The box section top chord and I-shaped section brace memberswere spliced by a transverse butt-weld either on the web or on theflange.
Table 1Summary of fatigue tests results.
Type of T-joints Specimen Plate thickness tw = tf (mm) Radius of co
Type-A T1-1 30 35T1-2 30 35T2-1 24 35T2-2 24 35
Type-B T3-1 (weld defect) 30 35T3-2 30 35
Fig. 6. Location of surface cracks (joint typ
For simplicity, to investigate the fatigue behaviour of welded jointson aforementioned connections, two representative cope-hole detailswere extracted from these components:
• Type A: T-joint with butt weld in flange (Fig. 3b), corresponding tospecimen T1 (30 mm) and T2 (24 mm) in different plate thicknesses;
• Type B: T-jointwith buttweld inweb (Fig. 3d), corresponding to spec-imen T3 (30 mm).
During this experiment, the box section top chord and I-shapedbracing member were first manufactured at large-scale. To emulatethe residual stress state as for the real structure, two types of T-jointswere cut from these sections. The material of the T-joints is a low-alloy structural steel Q345d widely used in the bridge industry,conforming to GB/T1591-2008 (China) [36]. The grade of this steel,used in this experiment, had 345 MPa yield strength.
2.2. Experimental programme
Six specimens were constructed. For each type of T-joint two identi-cal specimenswere prepared. The specimenswere categorised into twotest groups:
• Group A. Consists of two specimens of type T1 (identical) and twospecimens of type T3 (one of standard quality and the other with anundercut defect);
pe hole (mm) Nominal stress range (MPa) Testing cycles Failure or not
51.33 6.00E+06 Not51.33 6.00E+06 Not53.12 8.00E+06 Not53.12 5.00E+06 Not51.33 3.00E+06 Failure51.33 6.00E+06 Not
e A) via magnetic particle inspection.
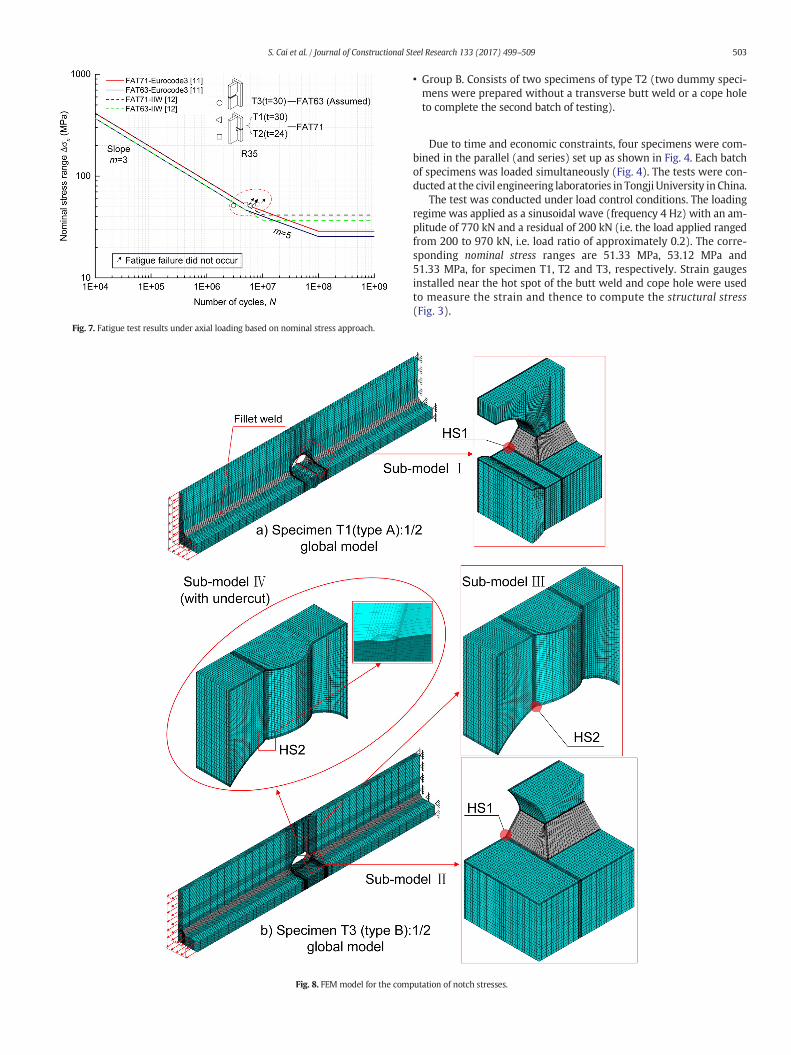
Fig. 7. Fatigue test results under axial loading based on nominal stress approach.
Fig. 8. FEM model for the comp
503S. Cai et al. / Journal of Constructional Steel Research 133 (2017) 499–509
• Group B. Consists of two specimens of type T2 (two dummy speci-mens were prepared without a transverse butt weld or a cope holeto complete the second batch of testing).
Due to time and economic constraints, four specimens were com-bined in the parallel (and series) set up as shown in Fig. 4. Each batchof specimens was loaded simultaneously (Fig. 4). The tests were con-ducted at the civil engineering laboratories in Tongji University in China.
The test was conducted under load control conditions. The loadingregime was applied as a sinusoidal wave (frequency 4 Hz) with an am-plitude of 770 kN and a residual of 200 kN (i.e. the load applied rangedfrom 200 to 970 kN, i.e. load ratio of approximately 0.2). The corre-sponding nominal stress ranges are 51.33 MPa, 53.12 MPa and51.33 MPa, for specimen T1, T2 and T3, respectively. Strain gaugesinstalled near the hot spot of the butt weld and cope hole were usedto measure the strain and thence to compute the structural stress(Fig. 3).
utation of notch stresses.
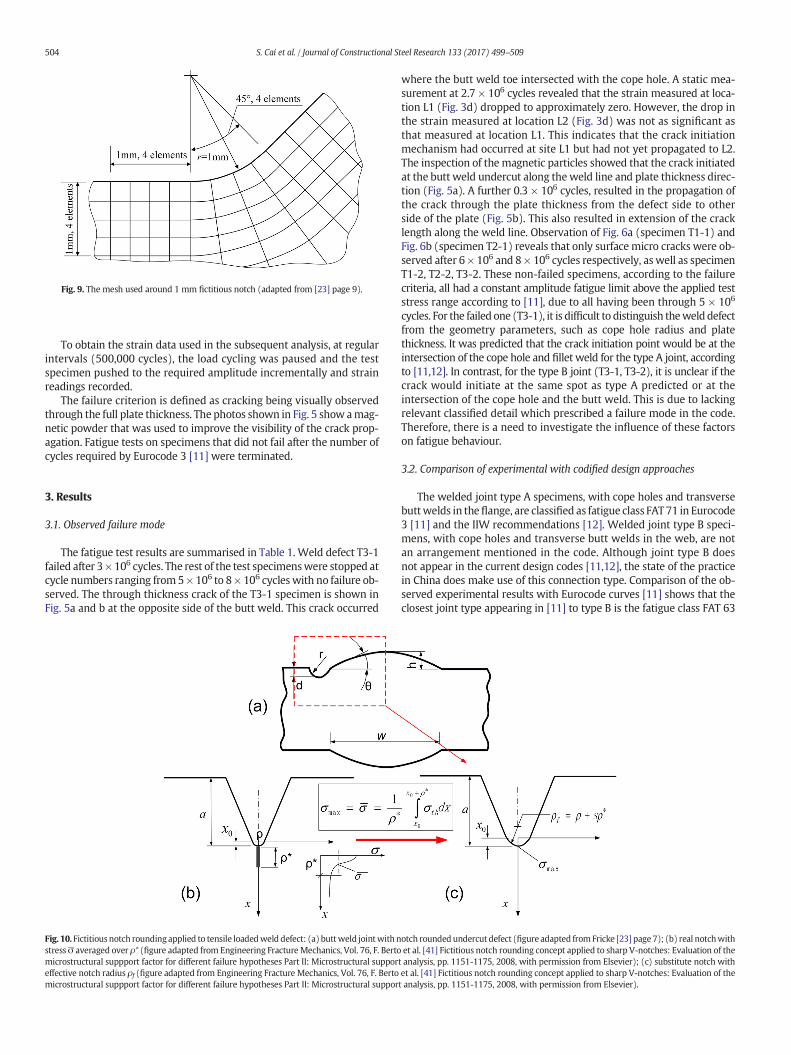
Fig. 9. The mesh used around 1 mm fictitious notch (adapted from [23] page 9).
504 S. Cai et al. / Journal of Constructional Steel Research 133 (2017) 499–509
To obtain the strain data used in the subsequent analysis, at regularintervals (500,000 cycles), the load cycling was paused and the testspecimen pushed to the required amplitude incrementally and strainreadings recorded.
The failure criterion is defined as cracking being visually observedthrough the full plate thickness. The photos shown in Fig. 5 show amag-netic powder that was used to improve the visibility of the crack prop-agation. Fatigue tests on specimens that did not fail after the number ofcycles required by Eurocode 3 [11] were terminated.
3. Results
3.1. Observed failure mode
The fatigue test results are summarised in Table 1. Weld defect T3-1failed after 3 × 10⁶ cycles. The rest of the test specimenswere stopped atcycle numbers ranging from 5× 10⁶ to 8 × 10⁶ cycles with no failure ob-served. The through thickness crack of the T3-1 specimen is shown inFig. 5a and b at the opposite side of the butt weld. This crack occurred
Fig. 10. Fictitiousnotch roundingapplied to tensile loadedweld defect: (a) buttweld jointwith nstressσ averaged over ρ* (figure adapted from Engineering Fracture Mechanics, Vol. 76, F. Bertomicrostructural suppport factor for different failure hypotheses Part II: Microstructural supporeffective notch radius ρf (figure adapted from Engineering Fracture Mechanics, Vol. 76, F. Bertomicrostructural suppport factor for different failure hypotheses Part II: Microstructural suppor
where the butt weld toe intersected with the cope hole. A static mea-surement at 2.7 × 10⁶ cycles revealed that the strain measured at loca-tion L1 (Fig. 3d) dropped to approximately zero. However, the drop inthe strain measured at location L2 (Fig. 3d) was not as significant asthat measured at location L1. This indicates that the crack initiationmechanism had occurred at site L1 but had not yet propagated to L2.The inspection of themagnetic particles showed that the crack initiatedat the butt weld undercut along theweld line and plate thickness direc-tion (Fig. 5a). A further 0.3 × 10⁶ cycles, resulted in the propagation ofthe crack through the plate thickness from the defect side to otherside of the plate (Fig. 5b). This also resulted in extension of the cracklength along the weld line. Observation of Fig. 6a (specimen T1-1) andFig. 6b (specimen T2-1) reveals that only surface micro cracks were ob-served after 6 × 10⁶ and 8 × 10⁶ cycles respectively, aswell as specimenT1-2, T2-2, T3-2. These non-failed specimens, according to the failurecriteria, all had a constant amplitude fatigue limit above the applied teststress range according to [11], due to all having been through 5 × 10⁶
cycles. For the failed one (T3-1), it is difficult to distinguish theweld defectfrom the geometry parameters, such as cope hole radius and platethickness. It was predicted that the crack initiation point would be at theintersection of the cope hole and fillet weld for the type A joint, accordingto [11,12]. In contrast, for the type B joint (T3-1, T3-2), it is unclear if thecrack would initiate at the same spot as type A predicted or at theintersection of the cope hole and the butt weld. This is due to lackingrelevant classified detail which prescribed a failure mode in the code.Therefore, there is a need to investigate the influence of these factorson fatigue behaviour.
3.2. Comparison of experimental with codified design approaches
The welded joint type A specimens, with cope holes and transversebuttwelds in theflange, are classified as fatigue class FAT 71 in Eurocode3 [11] and the IIW recommendations [12]. Welded joint type B speci-mens, with cope holes and transverse butt welds in the web, are notan arrangement mentioned in the code. Although joint type B doesnot appear in the current design codes [11,12], the state of the practicein China does make use of this connection type. Comparison of the ob-served experimental results with Eurocode curves [11] shows that theclosest joint type appearing in [11] to type B is the fatigue class FAT 63
otch roundedundercut defect (figure adapted fromFricke [23] page7); (b) real notchwithet al. [41] Fictitious notch rounding concept applied to sharp V-notches: Evaluation of the
t analysis, pp. 1151-1175, 2008, with permission from Elsevier); (c) substitute notch withet al. [41] Fictitious notch rounding concept applied to sharp V-notches: Evaluation of thet analysis, pp. 1151-1175, 2008, with permission from Elsevier).
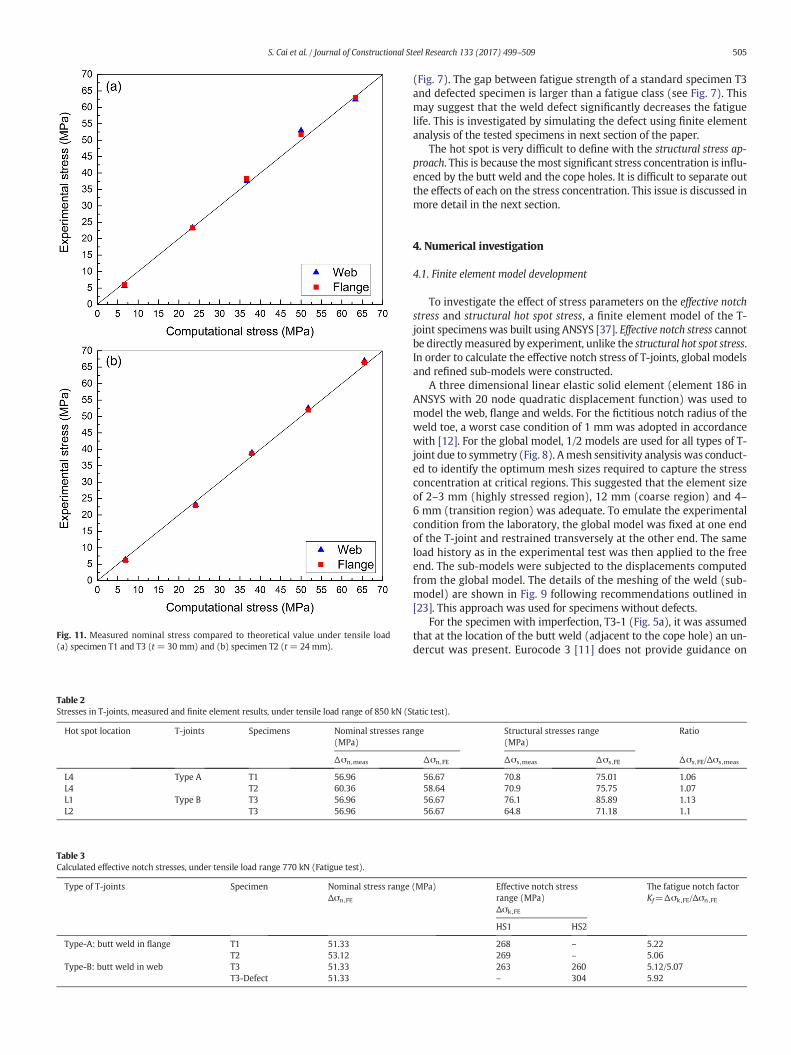
Fig. 11. Measured nominal stress compared to theoretical value under tensile load(a) specimen T1 and T3 (t = 30 mm) and (b) specimen T2 (t = 24 mm).
Table 2Stresses in T-joints, measured and finite element results, under tensile load range of 850 kN (S
Hot spot location T-joints Specimens Nominal stresses ra(MPa)
Δσn,meas
L4 Type A T1 56.96L4 T2 60.36L1 Type B T3 56.96L2 T3 56.96
Table 3Calculated effective notch stresses, under tensile load range 770 kN (Fatigue test).
Type of T-joints Specimen Nominal stress rangeΔσn,FE
Type-A: butt weld in flange T1 51.33T2 53.12
Type-B: butt weld in web T3 51.33T3-Defect 51.33
505S. Cai et al. / Journal of Constructional Steel Research 133 (2017) 499–509
(Fig. 7). The gap between fatigue strength of a standard specimen T3and defected specimen is larger than a fatigue class (see Fig. 7). Thismay suggest that the weld defect significantly decreases the fatiguelife. This is investigated by simulating the defect using finite elementanalysis of the tested specimens in next section of the paper.
The hot spot is very difficult to define with the structural stress ap-proach. This is because themost significant stress concentration is influ-enced by the butt weld and the cope holes. It is difficult to separate outthe effects of each on the stress concentration. This issue is discussed inmore detail in the next section.
4. Numerical investigation
4.1. Finite element model development
To investigate the effect of stress parameters on the effective notchstress and structural hot spot stress, a finite element model of the T-joint specimenswas built using ANSYS [37]. Effective notch stress cannotbe directlymeasured by experiment, unlike the structural hot spot stress.In order to calculate the effective notch stress of T-joints, global modelsand refined sub-models were constructed.
A three dimensional linear elastic solid element (element 186 inANSYS with 20 node quadratic displacement function) was used tomodel the web, flange and welds. For the fictitious notch radius of theweld toe, a worst case condition of 1 mm was adopted in accordancewith [12]. For the global model, 1/2 models are used for all types of T-joint due to symmetry (Fig. 8). Amesh sensitivity analysis was conduct-ed to identify the optimum mesh sizes required to capture the stressconcentration at critical regions. This suggested that the element sizeof 2–3 mm (highly stressed region), 12 mm (coarse region) and 4–6 mm (transition region) was adequate. To emulate the experimentalcondition from the laboratory, the global model was fixed at one endof the T-joint and restrained transversely at the other end. The sameload history as in the experimental test was then applied to the freeend. The sub-models were subjected to the displacements computedfrom the global model. The details of the meshing of the weld (sub-model) are shown in Fig. 9 following recommendations outlined in[23]. This approach was used for specimens without defects.
For the specimen with imperfection, T3-1 (Fig. 5a), it was assumedthat at the location of the butt weld (adjacent to the cope hole) an un-dercut was present. Eurocode 3 [11] does not provide guidance on
tatic test).
nge Structural stresses range(MPa)
Ratio
Δσn,FE Δσs,meas Δσs,FE Δσs,FE/Δσs,meas
56.67 70.8 75.01 1.0658.64 70.9 75.75 1.0756.67 76.1 85.89 1.1356.67 64.8 71.18 1.1
(MPa) Effective notch stressrange (MPa)Δσk,FE
The fatigue notch factorKf=Δσk,FE/Δσn,FE
HS1 HS2
268 – 5.22269 – 5.06263 260 5.12/5.07– 304 5.92
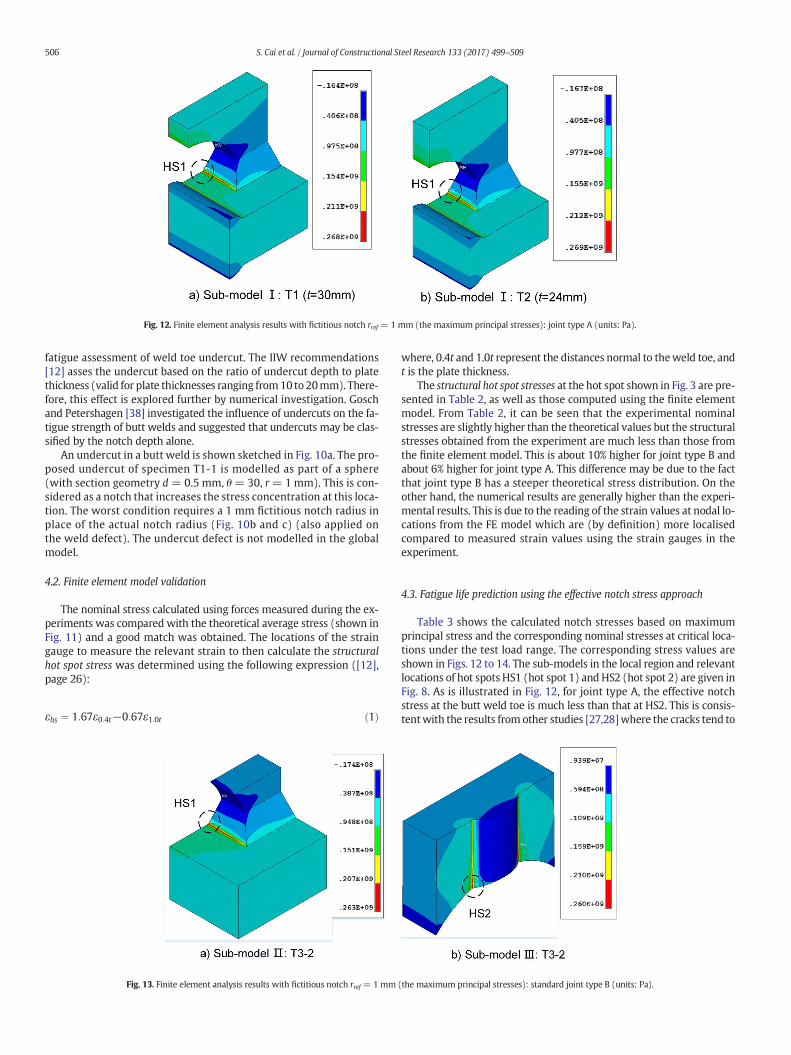
Fig. 12. Finite element analysis results with fictitious notch rref = 1 mm (the maximum principal stresses): joint type A (units: Pa).
506 S. Cai et al. / Journal of Constructional Steel Research 133 (2017) 499–509
fatigue assessment of weld toe undercut. The IIW recommendations[12] asses the undercut based on the ratio of undercut depth to platethickness (valid for plate thicknesses ranging from10 to 20mm). There-fore, this effect is explored further by numerical investigation. Goschand Petershagen [38] investigated the influence of undercuts on the fa-tigue strength of butt welds and suggested that undercuts may be clas-sified by the notch depth alone.
An undercut in a butt weld is shown sketched in Fig. 10a. The pro-posed undercut of specimen T1-1 is modelled as part of a sphere(with section geometry d = 0.5 mm, θ = 30, r = 1 mm). This is con-sidered as a notch that increases the stress concentration at this loca-tion. The worst condition requires a 1 mm fictitious notch radius inplace of the actual notch radius (Fig. 10b and c) (also applied onthe weld defect). The undercut defect is not modelled in the globalmodel.
4.2. Finite element model validation
The nominal stress calculated using forces measured during the ex-periments was compared with the theoretical average stress (shown inFig. 11) and a good match was obtained. The locations of the straingauge to measure the relevant strain to then calculate the structuralhot spot stress was determined using the following expression ([12],page 26):
εhs ¼ 1:67ε0:4t−0:67ε1:0t ð1Þ
Fig. 13. Finite element analysis results with fictitious notch rref = 1 mm
where, 0.4t and 1.0t represent the distances normal to theweld toe, andt is the plate thickness.
The structural hot spot stresses at the hot spot shown in Fig. 3 are pre-sented in Table 2, as well as those computed using the finite elementmodel. From Table 2, it can be seen that the experimental nominalstresses are slightly higher than the theoretical values but the structuralstresses obtained from the experiment are much less than those fromthe finite element model. This is about 10% higher for joint type B andabout 6% higher for joint type A. This difference may be due to the factthat joint type B has a steeper theoretical stress distribution. On theother hand, the numerical results are generally higher than the experi-mental results. This is due to the reading of the strain values at nodal lo-cations from the FE model which are (by definition) more localisedcompared to measured strain values using the strain gauges in theexperiment.
4.3. Fatigue life prediction using the effective notch stress approach
Table 3 shows the calculated notch stresses based on maximumprincipal stress and the corresponding nominal stresses at critical loca-tions under the test load range. The corresponding stress values areshown in Figs. 12 to 14. The sub-models in the local region and relevantlocations of hot spots HS1 (hot spot 1) and HS2 (hot spot 2) are given inFig. 8. As is illustrated in Fig. 12, for joint type A, the effective notchstress at the butt weld toe is much less than that at HS2. This is consis-tentwith the results from other studies [27,28]where the cracks tend to
(the maximum principal stresses): standard joint type B (units: Pa).
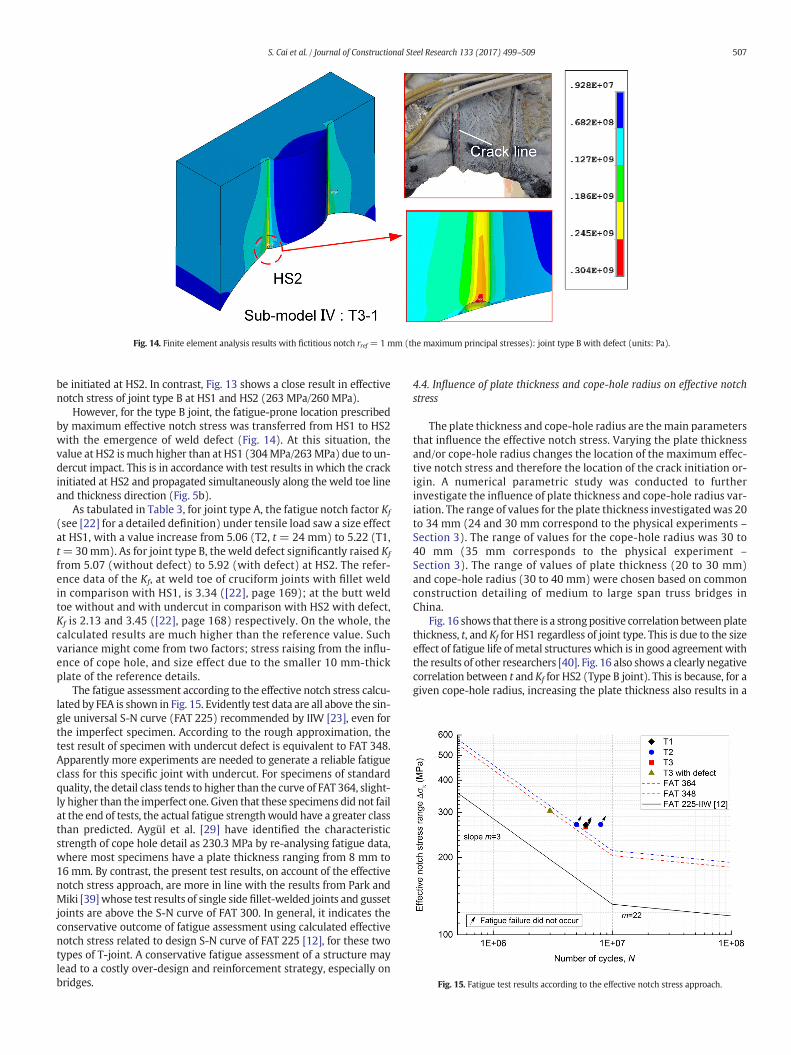
Fig. 14. Finite element analysis results with fictitious notch rref = 1 mm (the maximum principal stresses): joint type B with defect (units: Pa).
Fig. 15. Fatigue test results according to the effective notch stress approach.
507S. Cai et al. / Journal of Constructional Steel Research 133 (2017) 499–509
be initiated at HS2. In contrast, Fig. 13 shows a close result in effectivenotch stress of joint type B at HS1 and HS2 (263 MPa/260 MPa).
However, for the type B joint, the fatigue-prone location prescribedby maximum effective notch stress was transferred from HS1 to HS2with the emergence of weld defect (Fig. 14). At this situation, thevalue at HS2 ismuch higher than at HS1 (304MPa/263MPa) due to un-dercut impact. This is in accordance with test results in which the crackinitiated at HS2 and propagated simultaneously along the weld toe lineand thickness direction (Fig. 5b).
As tabulated in Table 3, for joint type A, the fatigue notch factor Kf
(see [22] for a detailed definition) under tensile load saw a size effectat HS1, with a value increase from 5.06 (T2, t = 24 mm) to 5.22 (T1,t=30mm). As for joint type B, the weld defect significantly raised Kf
from 5.07 (without defect) to 5.92 (with defect) at HS2. The refer-ence data of the Kf, at weld toe of cruciform joints with fillet weldin comparison with HS1, is 3.34 ([22], page 169); at the butt weldtoe without and with undercut in comparison with HS2 with defect,Kf is 2.13 and 3.45 ([22], page 168) respectively. On the whole, thecalculated results are much higher than the reference value. Suchvariance might come from two factors; stress raising from the influ-ence of cope hole, and size effect due to the smaller 10 mm-thickplate of the reference details.
The fatigue assessment according to the effective notch stress calcu-lated by FEA is shown in Fig. 15. Evidently test data are all above the sin-gle universal S-N curve (FAT 225) recommended by IIW [23], even forthe imperfect specimen. According to the rough approximation, thetest result of specimen with undercut defect is equivalent to FAT 348.Apparently more experiments are needed to generate a reliable fatigueclass for this specific joint with undercut. For specimens of standardquality, the detail class tends to higher than the curve of FAT 364, slight-ly higher than the imperfect one. Given that these specimens did not failat the end of tests, the actual fatigue strengthwould have a greater classthan predicted. Aygül et al. [29] have identified the characteristicstrength of cope hole detail as 230.3 MPa by re-analysing fatigue data,where most specimens have a plate thickness ranging from 8 mm to16 mm. By contrast, the present test results, on account of the effectivenotch stress approach, are more in line with the results from Park andMiki [39]whose test results of single side fillet-welded joints and gussetjoints are above the S-N curve of FAT 300. In general, it indicates theconservative outcome of fatigue assessment using calculated effectivenotch stress related to design S-N curve of FAT 225 [12], for these twotypes of T-joint. A conservative fatigue assessment of a structure maylead to a costly over-design and reinforcement strategy, especially onbridges.
4.4. Influence of plate thickness and cope-hole radius on effective notchstress
The plate thickness and cope-hole radius are themain parametersthat influence the effective notch stress. Varying the plate thicknessand/or cope-hole radius changes the location of the maximum effec-tive notch stress and therefore the location of the crack initiation or-igin. A numerical parametric study was conducted to furtherinvestigate the influence of plate thickness and cope-hole radius var-iation. The range of values for the plate thickness investigatedwas 20to 34 mm (24 and 30 mm correspond to the physical experiments –Section 3). The range of values for the cope-hole radius was 30 to40 mm (35 mm corresponds to the physical experiment –Section 3). The range of values of plate thickness (20 to 30 mm)and cope-hole radius (30 to 40 mm) were chosen based on commonconstruction detailing of medium to large span truss bridges inChina.
Fig. 16 shows that there is a strongpositive correlation between platethickness, t, and Kf for HS1 regardless of joint type. This is due to the sizeeffect of fatigue life of metal structures which is in good agreement withthe results of other researchers [40]. Fig. 16 also shows a clearly negativecorrelation between t and Kf for HS2 (Type B joint). This is because, for agiven cope-hole radius, increasing the plate thickness also results in a
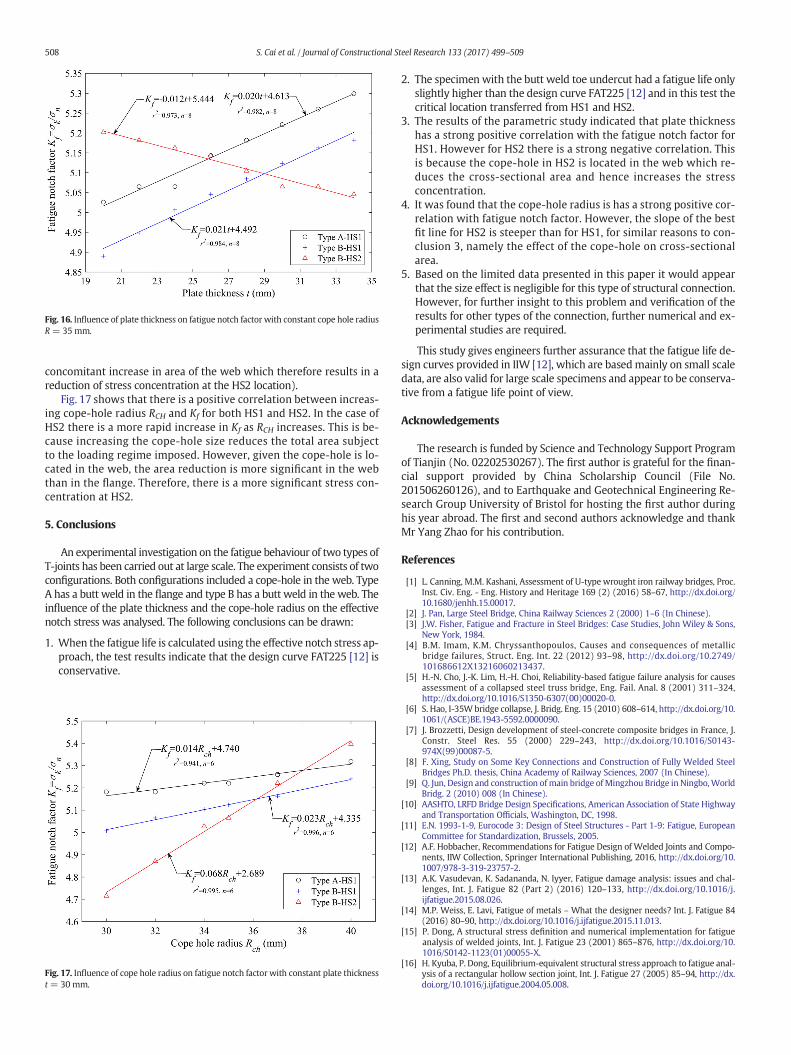
Fig. 16. Influence of plate thickness on fatigue notch factor with constant cope hole radiusR = 35 mm.
508 S. Cai et al. / Journal of Constructional Steel Research 133 (2017) 499–509
concomitant increase in area of the web which therefore results in areduction of stress concentration at the HS2 location).
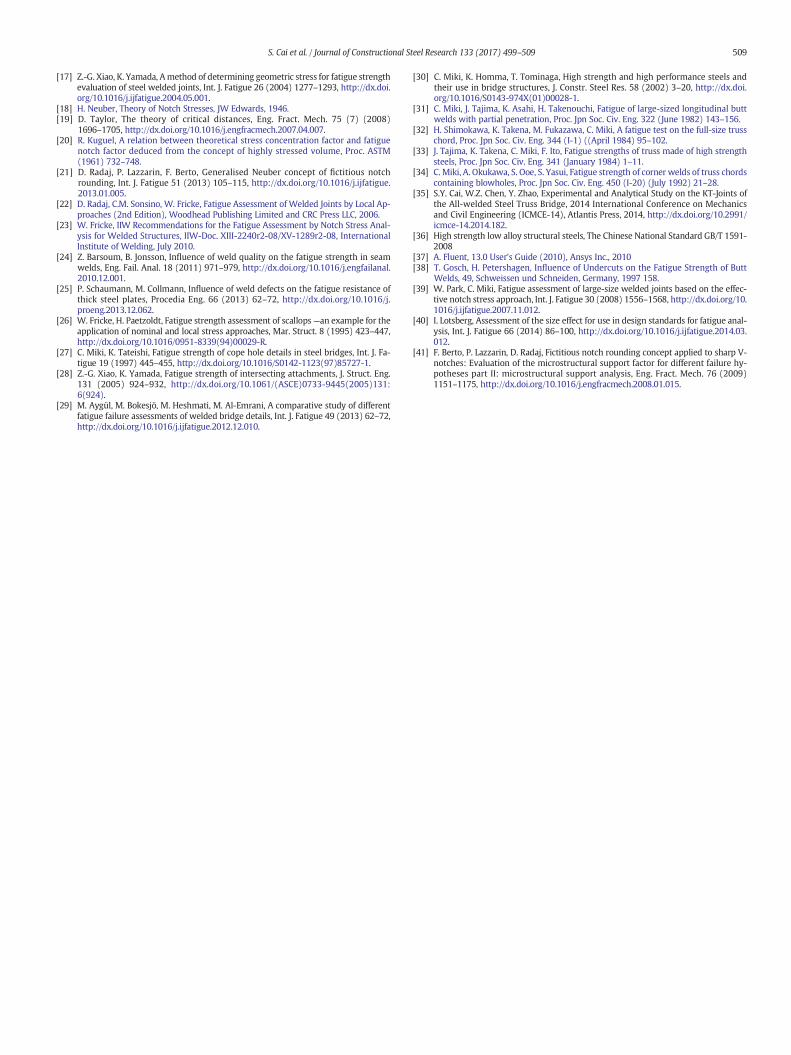
Fig. 17 shows that there is a positive correlation between increas-ing cope-hole radius RCH and Kf for both HS1 and HS2. In the case ofHS2 there is a more rapid increase in Kf as RCH increases. This is be-cause increasing the cope-hole size reduces the total area subjectto the loading regime imposed. However, given the cope-hole is lo-cated in the web, the area reduction is more significant in the webthan in the flange. Therefore, there is a more significant stress con-centration at HS2.
5. Conclusions
An experimental investigation on the fatigue behaviour of two types ofT-joints has been carried out at large scale. The experiment consists of twoconfigurations. Both configurations included a cope-hole in the web. TypeA has a butt weld in the flange and type B has a butt weld in the web. Theinfluence of the plate thickness and the cope-hole radius on the effectivenotch stress was analysed. The following conclusions can be drawn:
1. When the fatigue life is calculated using the effective notch stress ap-proach, the test results indicate that the design curve FAT225 [12] isconservative.
Fig. 17. Influence of cope hole radius on fatigue notch factor with constant plate thicknesst = 30 mm.
2. The specimen with the butt weld toe undercut had a fatigue life onlyslightly higher than the design curve FAT225 [12] and in this test thecritical location transferred from HS1 and HS2.
3. The results of the parametric study indicated that plate thicknesshas a strong positive correlation with the fatigue notch factor forHS1. However for HS2 there is a strong negative correlation. Thisis because the cope-hole in HS2 is located in the web which re-duces the cross-sectional area and hence increases the stressconcentration.
4. It was found that the cope-hole radius is has a strong positive cor-relation with fatigue notch factor. However, the slope of the bestfit line for HS2 is steeper than for HS1, for similar reasons to con-clusion 3, namely the effect of the cope-hole on cross-sectionalarea.
5. Based on the limited data presented in this paper it would appearthat the size effect is negligible for this type of structural connection.However, for further insight to this problem and verification of theresults for other types of the connection, further numerical and ex-perimental studies are required.
This study gives engineers further assurance that the fatigue life de-sign curves provided in IIW [12], which are basedmainly on small scaledata, are also valid for large scale specimens and appear to be conserva-tive from a fatigue life point of view.
Acknowledgements
The research is funded by Science and Technology Support Programof Tianjin (No. 02202530267). The first author is grateful for the finan-cial support provided by China Scholarship Council (File No.201506260126), and to Earthquake and Geotechnical Engineering Re-search Group University of Bristol for hosting the first author duringhis year abroad. The first and second authors acknowledge and thankMr Yang Zhao for his contribution.
References
[1] L. Canning, M.M. Kashani, Assessment of U-type wrought iron railway bridges, Proc.Inst. Civ. Eng. - Eng. History and Heritage 169 (2) (2016) 58–67, http://dx.doi.org/10.1680/jenhh.15.00017.
[2] J. Pan, Large Steel Bridge, China Railway Sciences 2 (2000) 1–6 (In Chinese).[3] J.W. Fisher, Fatigue and Fracture in Steel Bridges: Case Studies, John Wiley & Sons,
New York, 1984.[4] B.M. Imam, K.M. Chryssanthopoulos, Causes and consequences of metallic
bridge failures, Struct. Eng. Int. 22 (2012) 93–98, http://dx.doi.org/10.2749/101686612X13216060213437.
[5] H.-N. Cho, J.-K. Lim, H.-H. Choi, Reliability-based fatigue failure analysis for causesassessment of a collapsed steel truss bridge, Eng. Fail. Anal. 8 (2001) 311–324,http://dx.doi.org/10.1016/S1350-6307(00)00020-0.
[6] S. Hao, I-35W bridge collapse, J. Bridg. Eng. 15 (2010) 608–614, http://dx.doi.org/10.1061/(ASCE)BE.1943-5592.0000090.
[7] J. Brozzetti, Design development of steel-concrete composite bridges in France, J.Constr. Steel Res. 55 (2000) 229–243, http://dx.doi.org/10.1016/S0143-974X(99)00087-5.
[8] F. Xing, Study on Some Key Connections and Construction of Fully Welded SteelBridges Ph.D. thesis, China Academy of Railway Sciences, 2007 (In Chinese).
[9] Q. Jun, Design and construction ofmain bridge of Mingzhou Bridge in Ningbo,WorldBridg. 2 (2010) 008 (In Chinese).
[10] AASHTO, LRFD Bridge Design Specifications, American Association of State Highwayand Transportation Officials, Washington, DC, 1998.
[11] E.N. 1993-1-9, Eurocode 3: Design of Steel Structures - Part 1-9: Fatigue, EuropeanCommittee for Standardization, Brussels, 2005.
[12] A.F. Hobbacher, Recommendations for Fatigue Design of Welded Joints and Compo-nents, IIW Collection, Springer International Publishing, 2016, http://dx.doi.org/10.1007/978-3-319-23757-2.
[13] A.K. Vasudevan, K. Sadananda, N. Iyyer, Fatigue damage analysis: issues and chal-lenges, Int. J. Fatigue 82 (Part 2) (2016) 120–133, http://dx.doi.org/10.1016/j.ijfatigue.2015.08.026.
[14] M.P. Weiss, E. Lavi, Fatigue of metals – What the designer needs? Int. J. Fatigue 84(2016) 80–90, http://dx.doi.org/10.1016/j.ijfatigue.2015.11.013.
[15] P. Dong, A structural stress definition and numerical implementation for fatigueanalysis of welded joints, Int. J. Fatigue 23 (2001) 865–876, http://dx.doi.org/10.1016/S0142-1123(01)00055-X.
[16] H. Kyuba, P. Dong, Equilibrium-equivalent structural stress approach to fatigue anal-ysis of a rectangular hollow section joint, Int. J. Fatigue 27 (2005) 85–94, http://dx.doi.org/10.1016/j.ijfatigue.2004.05.008.
509S. Cai et al. / Journal of Constructional Steel Research 133 (2017) 499–509
[17] Z.-G. Xiao, K. Yamada, Amethod of determining geometric stress for fatigue strengthevaluation of steel welded joints, Int. J. Fatigue 26 (2004) 1277–1293, http://dx.doi.org/10.1016/j.ijfatigue.2004.05.001.
[18] H. Neuber, Theory of Notch Stresses, JW Edwards, 1946.[19] D. Taylor, The theory of critical distances, Eng. Fract. Mech. 75 (7) (2008)
1696–1705, http://dx.doi.org/10.1016/j.engfracmech.2007.04.007.[20] R. Kuguel, A relation between theoretical stress concentration factor and fatigue
notch factor deduced from the concept of highly stressed volume, Proc. ASTM(1961) 732–748.
[21] D. Radaj, P. Lazzarin, F. Berto, Generalised Neuber concept of fictitious notchrounding, Int. J. Fatigue 51 (2013) 105–115, http://dx.doi.org/10.1016/j.ijfatigue.2013.01.005.
[22] D. Radaj, C.M. Sonsino, W. Fricke, Fatigue Assessment of Welded Joints by Local Ap-proaches (2nd Edition), Woodhead Publishing Limited and CRC Press LLC, 2006.
[23] W. Fricke, IIW Recommendations for the Fatigue Assessment by Notch Stress Anal-ysis for Welded Structures, IIW-Doc. XIII-2240r2-08/XV-1289r2-08, InternationalInstitute of Welding, July 2010.
[24] Z. Barsoum, B. Jonsson, Influence of weld quality on the fatigue strength in seamwelds, Eng. Fail. Anal. 18 (2011) 971–979, http://dx.doi.org/10.1016/j.engfailanal.2010.12.001.
[25] P. Schaumann, M. Collmann, Influence of weld defects on the fatigue resistance ofthick steel plates, Procedia Eng. 66 (2013) 62–72, http://dx.doi.org/10.1016/j.proeng.2013.12.062.
[26] W. Fricke, H. Paetzoldt, Fatigue strength assessment of scallops—an example for theapplication of nominal and local stress approaches, Mar. Struct. 8 (1995) 423–447,http://dx.doi.org/10.1016/0951-8339(94)00029-R.
[27] C. Miki, K. Tateishi, Fatigue strength of cope hole details in steel bridges, Int. J. Fa-tigue 19 (1997) 445–455, http://dx.doi.org/10.1016/S0142-1123(97)85727-1.
[28] Z.-G. Xiao, K. Yamada, Fatigue strength of intersecting attachments, J. Struct. Eng.131 (2005) 924–932, http://dx.doi.org/10.1061/(ASCE)0733-9445(2005)131:6(924).
[29] M. Aygül, M. Bokesjö, M. Heshmati, M. Al-Emrani, A comparative study of differentfatigue failure assessments of welded bridge details, Int. J. Fatigue 49 (2013) 62–72,http://dx.doi.org/10.1016/j.ijfatigue.2012.12.010.
[30] C. Miki, K. Homma, T. Tominaga, High strength and high performance steels andtheir use in bridge structures, J. Constr. Steel Res. 58 (2002) 3–20, http://dx.doi.org/10.1016/S0143-974X(01)00028-1.
[31] C. Miki, J. Tajima, K. Asahi, H. Takenouchi, Fatigue of large-sized longitudinal buttwelds with partial penetration, Proc. Jpn Soc. Civ. Eng. 322 (June 1982) 143–156.
[32] H. Shimokawa, K. Takena, M. Fukazawa, C. Miki, A fatigue test on the full-size trusschord, Proc. Jpn Soc. Civ. Eng. 344 (I-1) ((April 1984) 95–102.
[33] J. Tajima, K. Takena, C. Miki, F. Ito, Fatigue strengths of truss made of high strengthsteels, Proc. Jpn Soc. Civ. Eng. 341 (January 1984) 1–11.
[34] C. Miki, A. Okukawa, S. Ooe, S. Yasui, Fatigue strength of corner welds of truss chordscontaining blowholes, Proc. Jpn Soc. Civ. Eng. 450 (I-20) (July 1992) 21–28.
[35] S.Y. Cai, W.Z. Chen, Y. Zhao, Experimental and Analytical Study on the KT-Joints ofthe All-welded Steel Truss Bridge, 2014 International Conference on Mechanicsand Civil Engineering (ICMCE-14), Atlantis Press, 2014, http://dx.doi.org/10.2991/icmce-14.2014.182.
[36] High strength low alloy structural steels, The Chinese National Standard GB/T 1591-2008
[37] A. Fluent, 13.0 User's Guide (2010), Ansys Inc., 2010[38] T. Gosch, H. Petershagen, Influence of Undercuts on the Fatigue Strength of Butt
Welds, 49, Schweissen und Schneiden, Germany, 1997 158.[39] W. Park, C. Miki, Fatigue assessment of large-size welded joints based on the effec-
tive notch stress approach, Int. J. Fatigue 30 (2008) 1556–1568, http://dx.doi.org/10.1016/j.ijfatigue.2007.11.012.
[40] I. Lotsberg, Assessment of the size effect for use in design standards for fatigue anal-ysis, Int. J. Fatigue 66 (2014) 86–100, http://dx.doi.org/10.1016/j.ijfatigue.2014.03.012.
[41] F. Berto, P. Lazzarin, D. Radaj, Fictitious notch rounding concept applied to sharp V-notches: Evaluation of the microstructural support factor for different failure hy-potheses part II: microstructural support analysis, Eng. Fract. Mech. 76 (2009)1151–1175, http://dx.doi.org/10.1016/j.engfracmech.2008.01.015.