FATIGUE DURABILITY EVALUATION OF TROUGH TO DECK PLATE ...
14
FATIGUE DURABILITY EVALUATION OF TROUGH TO DECK PLATE WELDED JOINT OF ORTHOTROPIC STEEL DECK Samol YA 1 and Kentaro YAMADA 2 1 Member of JSCE, Student, Dept. of Environment Eng. and Architecture, Nagoya University (Furo-cho, Chikusa-ku, Nagoya 464-8603, Japan) E-mail:[email protected] 2 Member of JSCE, Professor, Dept. of Environment Eng. and Architecture, Nagoya University (Furo-cho, Chikusa-ku, Nagoya 464-8603, Japan) E-mail:[email protected] The present study is intended as analysis investigations of fatigue durability of the trough to deck plate welded joint failed at weld root in deck plate. The investigations are carried out on the basis of three key factors: fatigue strengths of the welded details obtained by analysis method in conjunction with fatigue tests, stress ranges by FEM analyses with a unit wheel load, and the loads and their frequencies for the fatigue evaluations are the wheel loads in service, represented by an equivalent wheel load, assumed from the axle load measurements. Consistency between fatigue strength and stress range is simply demonstrated. Using this method for fatigue evaluation, it is found that large-rib-deck model has longer fatigue life than standard-deck models. An increase in deck plate thickness may prolong fatigue life of the orthotropic steel deck. Load distribution due to the rigidity of pavement may also help enhancement the fatigue life. Key Words : orthotropic steel deck, trough to deck plate welded detail, fatigue durability evaluation 1. INTRODUCTION Various types of fatigue cracks have been found in the welded details of orthotropic steel bridge decks in heavily loaded highways, such as Metropolitan Ex- pressway 1) and Hanshin Expressway 2) . Among these fatigue cracks, the cracks which initiated at weld roots of fillet welds of troughs to deck plates and propagated through deck plates, as shown in Fig.1 and Photo 1, have caused some maintenance prob- lems. For example, the cracks occurred inside of troughs, and could not be detected by visual inspec- tions. Once the cracks went through the deck plates, water often penetrated into troughs, and also dete- riorated the asphalt pavements. Such a crack, called as root-deck crack, herein, is investigated in this paper. The troughs to deck plate welded details exist along the bridge direction, and are subjected to the same wheel loadings. Therefore, it is possible that once a fatigue crack occurred, many more fatigue cracks may develop at any other locations along the weld lines. Non-destructive inspection techniques have been investigated to detect such a root-deck crack 3),4) . So far, they are still difficult to apply in the field. 12mm 6 or 8mm Fatigue crack Fig.1 Root-deck fatigue crack in trough to deck plate welded detail of orthotropic steel deck Photo 1 Macro-section of actual fatigue crack (Courtesy of Nagoya City)
Transcript of FATIGUE DURABILITY EVALUATION OF TROUGH TO DECK PLATE ...
FATIGUE DURABILITY EVALUATION OF
TROUGH TO DECK PLATE WELDED JOINT OF ORTHOTROPIC STEEL DECK
Samol YA1 and Kentaro YAMADA2
1Member of JSCE, Student, Dept. of Environment Eng. and Architecture, Nagoya University (Furo-cho, Chikusa-ku, Nagoya 464-8603, Japan)
E-mail:[email protected] 2Member of JSCE, Professor, Dept. of Environment Eng. and Architecture, Nagoya University
(Furo-cho, Chikusa-ku, Nagoya 464-8603, Japan) E-mail:[email protected]
The present study is intended as analysis investigations of fatigue durability of the trough to deck plate welded joint failed at weld root in deck plate. The investigations are carried out on the basis of three key factors: fatigue strengths of the welded details obtained by analysis method in conjunction with fatigue tests, stress ranges by FEM analyses with a unit wheel load, and the loads and their frequencies for the fatigue evaluations are the wheel loads in service, represented by an equivalent wheel load, assumed from the axle load measurements. Consistency between fatigue strength and stress range is simply demonstrated. Using this method for fatigue evaluation, it is found that large-rib-deck model has longer fatigue life than standard-deck models. An increase in deck plate thickness may prolong fatigue life of the orthotropic steel deck. Load distribution due to the rigidity of pavement may also help enhancement the fatigue life. Key Words : orthotropic steel deck, trough to deck plate welded detail, fatigue durability evaluation
1. INTRODUCTION
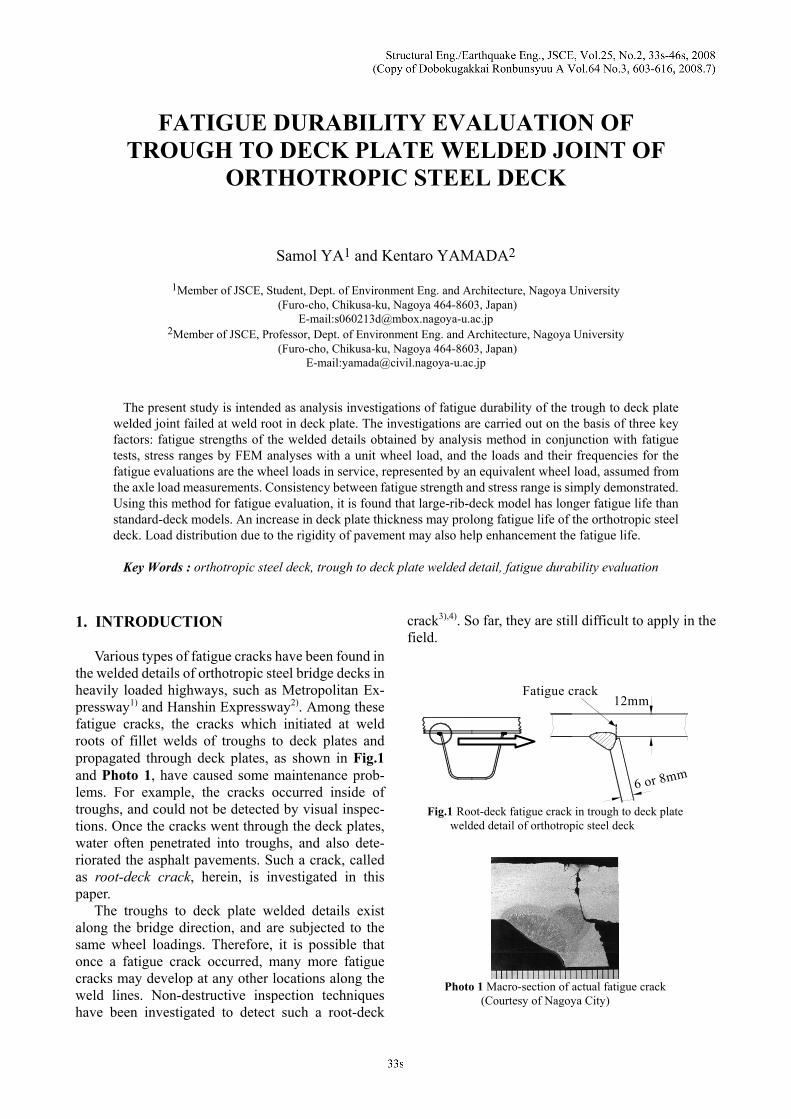
Various types of fatigue cracks have been found in the welded details of orthotropic steel bridge decks in heavily loaded highways, such as Metropolitan Ex-pressway1) and Hanshin Expressway2). Among these fatigue cracks, the cracks which initiated at weld roots of fillet welds of troughs to deck plates and propagated through deck plates, as shown in Fig.1 and Photo 1, have caused some maintenance prob-lems. For example, the cracks occurred inside of troughs, and could not be detected by visual inspec-tions. Once the cracks went through the deck plates, water often penetrated into troughs, and also dete-riorated the asphalt pavements. Such a crack, called as root-deck crack, herein, is investigated in this paper.
The troughs to deck plate welded details exist along the bridge direction, and are subjected to the same wheel loadings. Therefore, it is possible that once a fatigue crack occurred, many more fatigue cracks may develop at any other locations along the weld lines. Non-destructive inspection techniques have been investigated to detect such a root-deck
crack3),4). So far, they are still difficult to apply in the field.
12mm
6 or 8mm
Fatigue crack
Fig.1 Root-deck fatigue crack in trough to deck plate
welded detail of orthotropic steel deck
Photo 1 Macro-section of actual fatigue crack
(Courtesy of Nagoya City)
Quite a few investigations on durability evalua-tion on root-deck crack have been carried out by various organizations. For example, full-scale specimens, consisted of one or two panel decks, were tested under static loading5), or were fatigue-tested under fixed loading6) or moving wheel load-ing7),8),9),10),11). Finite element analyses were also carried out for the full-scale models to correlate local stresses and fatigue cracks. Stress measurements in service were also carried out for standard type orthotropic steel decks at various locations. Although little information was available concerning durability of orthotropic steel deck for the root-deck crack, computation of fatigue damages revealed possibility of the root-deck crack12).
In this study, analytical procedure of fatigue life evaluation of root-deck crack is proposed. The fa-tigue lives of the welded details can be estimated by knowing fatigue strength curves, i.e. S-N curves of the details, stress ranges due to loadings and their number of cycles. First, S-N curves of the trough to deck fillet weld are investigated by using a so-called one-millimeter method. Then, stress analyses are carried out to investigate relation between wheel loadings and stress ranges. Fatigue lives are finally computed using wheel loadings and their daily number of loading, which are determined from measured wheel loadings at heavily loaded highways near Nagoya.
Two types of orthotropic steel deck models are considered. One is standard-deck model with 12 mm thick deck plate stiffened with 6 or 8 mm troughs. Additional analyses are also carried out for 14 and 16 mm thick deck plates. The other model is large-rib-deck model with roughly 1.5 times as large as the standard-deck model13).
2. S-N CURVES OF TROUGH TO DECK DETAILS
(1) Fatigue strength evaluation for root-deck
crack The fatigue strength curves, i.e. S-N curves for the
fillet welds of troughs to deck plates failed at root are defined by one-millimeter method14) and then veri-fied with some fatigue tests. The concept of the one-millimeter method is similar to the conventional hot spot stress method, but using stress at 1 mm in depth along the path of fatigue crack propagation. The fatigue strength of the detail can be evaluated by correlating with the S-N diagram of the fatigue test data of non-load-carrying fillet welded joints of 10 mm thick, and 160 and 200 mm wide, called as ref-erence detail.
For the trough to deck plate welded details con-sidered herein, it is wheel loads which cause plate bending, and then the root-deck crack. It is assumed that the same procedure of the one-millimeter method as in axial cases is applicable to the plate bending cases. (2) Analytical models
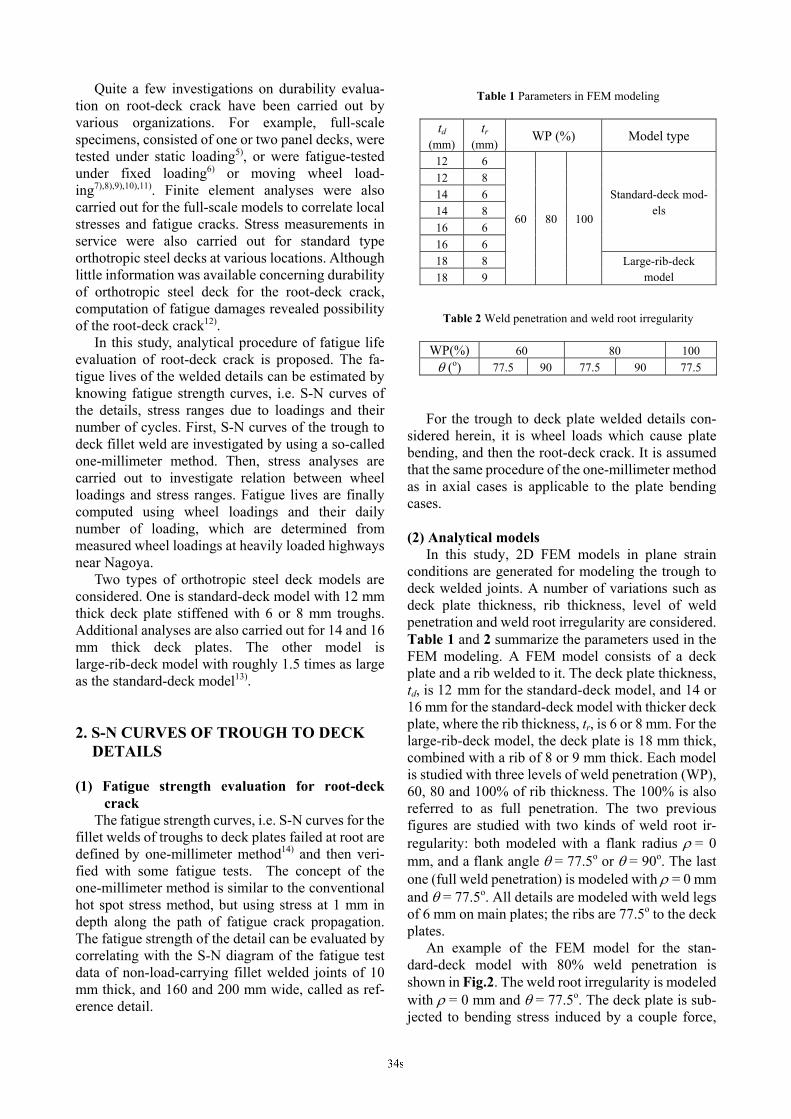
In this study, 2D FEM models in plane strain conditions are generated for modeling the trough to deck welded joints. A number of variations such as deck plate thickness, rib thickness, level of weld penetration and weld root irregularity are considered. Table 1 and 2 summarize the parameters used in the FEM modeling. A FEM model consists of a deck plate and a rib welded to it. The deck plate thickness, td, is 12 mm for the standard-deck model, and 14 or 16 mm for the standard-deck model with thicker deck plate, where the rib thickness, tr, is 6 or 8 mm. For the large-rib-deck model, the deck plate is 18 mm thick, combined with a rib of 8 or 9 mm thick. Each model is studied with three levels of weld penetration (WP), 60, 80 and 100% of rib thickness. The 100% is also referred to as full penetration. The two previous figures are studied with two kinds of weld root ir-regularity: both modeled with a flank radius ρ = 0 mm, and a flank angle θ = 77.5o or θ = 90o. The last one (full weld penetration) is modeled with ρ = 0 mm and θ = 77.5o. All details are modeled with weld legs of 6 mm on main plates; the ribs are 77.5o to the deck plates.
An example of the FEM model for the stan-dard-deck model with 80% weld penetration is shown in Fig.2. The weld root irregularity is modeled with ρ = 0 mm and θ = 77.5o. The deck plate is sub-jected to bending stress induced by a couple force,
Table 1 Parameters in FEM modeling
td
(mm)tr
(mm)WP (%) Model type
12 6 12 8 14 6 14 8 16 6 16 6
Standard-deck mod-els
18 8 18 9
60 80 100
Large-rib-deck model
Table 2 Weld penetration and weld root irregularity
WP(%) 60 80 100
θ (o) 77.5 90 77.5 90 77.5
and the rib present but carrying no load. The mini-mum mesh size is 0.05 mm x 0.05 mm. As for mate-rial properties, the Young modulus of 2 x 10⁵ MPa and the Poisson ratio of 0.3 are assumed.
(3) Analytical results and some fatigue tests
results Little variation in the one-mm stress is observed
by changing weld root irregularity. This was also observed for weld toe of cruciform joint14). Therefore, it is suggested that the fatigue strength of the trough to deck detail appears independent of weld root ir-regularity. Preliminarily analyses revealed that the levels of weld penetration showed little difference in fatigue strength for the root-deck crack. Thus, the values corresponding to the cases of 80% weld penetration are selected for the fatigue durability evaluations. The Japan Road Association Specifica-tion (JRA) specified weld penetration is to be more than 75% of trough thickness15).
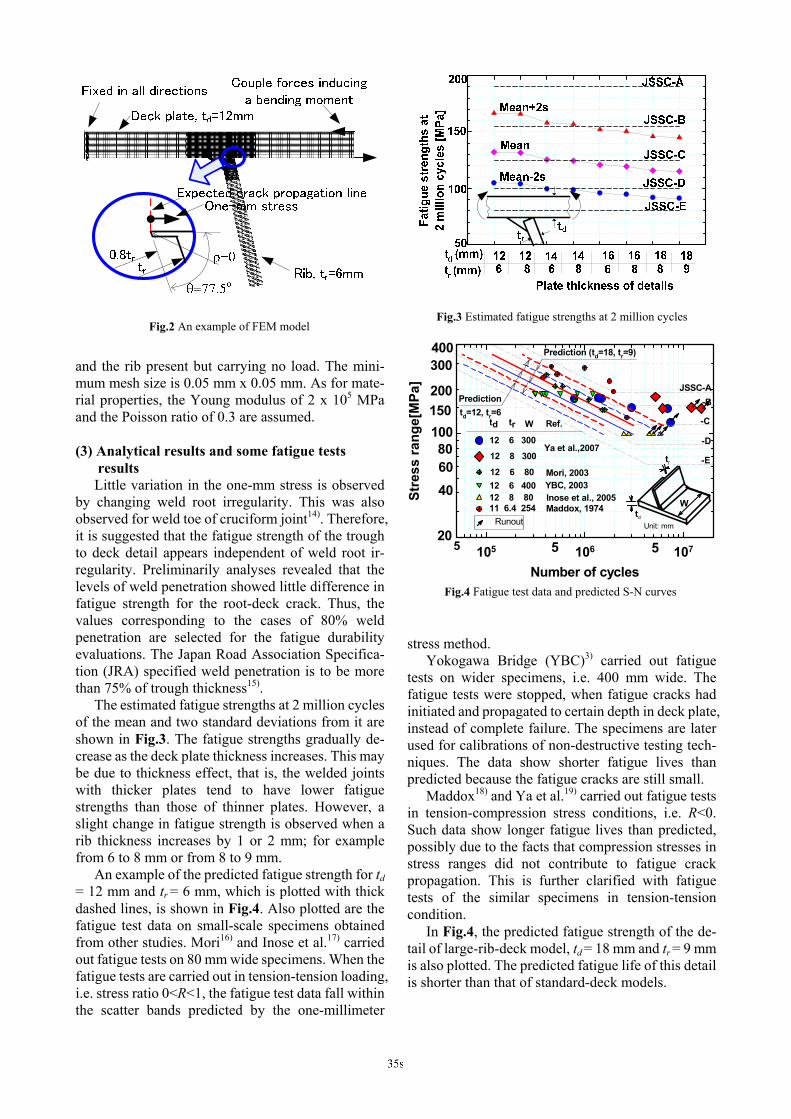
The estimated fatigue strengths at 2 million cycles of the mean and two standard deviations from it are shown in Fig.3. The fatigue strengths gradually de-crease as the deck plate thickness increases. This may be due to thickness effect, that is, the welded joints with thicker plates tend to have lower fatigue strengths than those of thinner plates. However, a slight change in fatigue strength is observed when a rib thickness increases by 1 or 2 mm; for example from 6 to 8 mm or from 8 to 9 mm.
An example of the predicted fatigue strength for td = 12 mm and tr = 6 mm, which is plotted with thick dashed lines, is shown in Fig.4. Also plotted are the fatigue test data on small-scale specimens obtained from other studies. Mori16) and Inose et al.17) carried out fatigue tests on 80 mm wide specimens. When the fatigue tests are carried out in tension-tension loading, i.e. stress ratio 0<R<1, the fatigue test data fall within the scatter bands predicted by the one-millimeter
stress method. Yokogawa Bridge (YBC)3) carried out fatigue
tests on wider specimens, i.e. 400 mm wide. The fatigue tests were stopped, when fatigue cracks had initiated and propagated to certain depth in deck plate, instead of complete failure. The specimens are later used for calibrations of non-destructive testing tech-niques. The data show shorter fatigue lives than predicted because the fatigue cracks are still small.
Maddox18) and Ya et al.19) carried out fatigue tests in tension-compression stress conditions, i.e. R<0. Such data show longer fatigue lives than predicted, possibly due to the facts that compression stresses in stress ranges did not contribute to fatigue crack propagation. This is further clarified with fatigue tests of the similar specimens in tension-tension condition.
In Fig.4, the predicted fatigue strength of the de-tail of large-rib-deck model, td = 18 mm and tr = 9 mm is also plotted. The predicted fatigue life of this detail is shorter than that of standard-deck models.
Fig.2 An example of FEM model
Fig.3 Estimated fatigue strengths at 2 million cycles
Number of cycles105 106 107
Stre
ss ra
nge[
MPa
]
5 5
JSSC-A-B
-C
-D
-E
td tr W
12 6 300
12 8 300
400300
200150
20
100
6040
5
8012 6 80 Mori, 200312 6 400 YBC, 200312 8 80 Inose et al., 200511 6.4 254 Maddox, 1974
Predictiontd=12, tr=6
Prediction (td=18, tr=9)
Runout
Ya et al.,2007
Ref.
Unit: mmtd
W
tr
Fig.4 Fatigue test data and predicted S-N curves

3. COMPUTATION OF STRESS RANGES BY FEM ANALYSES
(1) FEM models of orthotropic steel decks
The geometries and main dimensions of the troughs and deck plates of the orthotropic steel deck models, denoted as standard-deck model and large-rib-deck model are shown in Fig.5. The FEM models are shown in Fig.6. The models consist of two panels with three cross beams and four troughs. For the large-rib-deck model, cross beam spacing is twice as large as the standard-deck model. The ob-jective joint in each kind of models, at which the fatigue evaluations are to be carried out, is shown by a circle in the inset of Fig.6. The detailed information on FEM models is given in Table 3.
Shell elements (SHELL4) with membrane and bending capacities20) are used. The fillet weld ge-ometries are not modeled in the analyses. The mini-mum mesh sizes of 10 mm x 10 mm are used near the
objective joints. The stress analyses are performed using a software package COSMOS/M version 2.9. The Young module is 2 x 10⁵ MPa and the Poisson ratio is 0.3.
The boundary conditions of the FEM models are shown in the inset of Fig.6. Displacements on nodes along the edges in Z-direction are constrained. The nodes at intersections between deck plate and cross beams are fixed in all directions as these locations are assumed to have large rigidity.
Unit: mm
440
910
td
tr
340
686
td
tr
Cross beam section
span sectionCross beam
sectionSpan section
CLCL
(a) Standard-deck model (b) Large-rib-deck model
Fig.5 Details of troughs to deck plate of the steel deck models
2@2240
Elements: 71140
Nodes: 69765
X
ZY
Objective joints
(a) Standard-deck model (b) Large-rib-deck model
Fig.6 3D FEM models
Table 3 Detail of FEM models (unit: mm)
Model td tr Trough span Model types
GD12R6 12 6GD12R8 12 8GD14R6 14 6GD14R8 14 8GD16R6 16 6GD16R8 16 8
2240 Standard-deck
models
GD18R9 18 8GD18R9 18 9
4000 Large-rib-deck
models

(2) Wheel loads and asphalt pavement In the FEM analyses, wheel loading of trucks and
effect of asphalt pavement are assumed, as shown schematically in Fig.7. It is assumed that the running positions of truck wheels vary transversely from the assumed mean position by normal distribution with a standard deviation σ = 35 cm21). The mean position is assumed at the line at which the fatigue durability evaluations are to be evaluated.
Truck wheels act on an orthotropic steel deck through their contact areas between the wheels and the pavement surface. The wheels of trucks are as-sumed to be single in the front axles and double in the rear axles. The contact areas are assumed to have the following sizes, as shown in Fig.8. The single wheel is 200 mm x 200 mm; the rear double wheel has two patterns: pattern 1, a combination of two single wheels spacing 100 mm apart; and pattern 2, a rec-tangle of 200 mm x 500 mm. The pattern 2 is the one specified in the JRA specification22).
Asphalt pavements on the existing orthotropic steel decks are 60 to 80 mm thick. The load distri-bution due to the rigidity of asphalt pavement is not considered in the design specification22) because of temperature-dependency characteristics of the stiff-ness of the material. However, a load distribution may be expected for some reasons. First, the rigidity of asphalt pavement may be still significant over a period of time as long as the ambient temperature stays below a certain degree. A previous study23) on dynamic response of asphalt pavement revealed that its Young modulus was around 800 MPa, under a low vehicle speed 10 km/h, at a temperature of 25℃. Second, monthly average temperature24) in most areas in Japan is lower than this temperature for about 6 months. If other materials, such as steel fiber re-inforced concrete, are used, the stiffness of the pave-ment increases and little temperature effect is expected25),26).
A modeling of the load distribution due to the ri-gidity of pavement is shown in Fig.9. A concentrated load, P, produces a uniformly distributed pressure, σnp, over a contact area (a x b). This pressure further spreads with an angle, φ, in all directions throughout the pavement thickness, h, inducing an applied pres-sure, σp, over an enlarged contact area (a’ x b’) at deck plate surface.
In the analyses, the rigidity, and hence the loading distribution effect, of asphalt pavement is considered by changing the applied pressure on the relevant enlarged contact area, as shown in Fig.10. In this study, it is assumed that the thickness of the asphalt pavement is 75 mm and that the pressure spreads with angle φ of 45o for the with-load-distribution case27). For the no-load-distribution case, φ is taken as 0o. In
other words, the no-load-distribution case is equiva-lent to the case where there is no asphalt pavement on the deck plate. The former’s applied pressure is about 65% of the latter for the type of wheel shown in Fig.10.
For the FEM analyses, three transverse wheel running positions are selected for double wheel. They are Pass-1, center of double wheel is above the center
Fig.7 Illustration of running wheel on deck
Single wheel Double wheel
200
200
200
200
200
100
500
200
Pattern 1
Pattern 2Unit : mm
Fig.8 Contact areas of truck wheels
Fig.9 Model of load distribution due to pavement stiffness

of trough; Pass-2, above mid-point between two troughs; and Pass-3, right above the trough web. The center of the double wheel coincides with the mean position of lateral distribution of wheel loading, as shown in Fig.7. It is expected that stress range due to Pass-3 is the highest among the three positions con-sidered for double wheel. Two positions are chosen for the single wheel. Pass-4 is the same position as Pass-1, and Pass-5 is the same position as Pass-2. Examples of these transverse wheel positions are shown in Fig.11.
(3) Stresses computed by FEM analyses a) Definition of nominal stresses
The S-N curves for the root-deck crack are de-fined by nominal bending stress, as shown in Fig.4. Therefore, it is necessary to compute nominal bend-ing stress for the orthotropic steel deck under desired loading condition. In the analyses, the nodal stress at bottom face of deck plate at 10 mm apart from the intersection of trough web to deck plate is defined as nominal stress for fatigue evaluation.
A preliminary analysis revealed that the mem-brane component is so small and may be neglected, and the bending component is a dominant factor which affects root-deck fatigue cracking. An exam-
ple is shown in Fig.12, which shows the nodal stress in the direction transverse to the joint (Y-direction) in the deck plate at mid span, subjected to a unit double wheel load of pattern 2. The stress distribution in deck plate in the section A-A, which is 10 mm away from the intersection between trough and deck plate, is also given. The membrane stress is around 3% of the total stress at lower surface of the deck plate. The similar checks are also carried out for other loading cases and other points, at mid-span of the trough (L/2) or at central cross beam (CCB). It is found that the highest membrane stress is still smaller than 10% of the bending stress, suggesting membrane stress is negligible against bending stress.
For the fatigue analyses, the stresses at the node, 10 mm away from the intersection inside the trough, are used as nominal stress. As shown in Fig.13, one may see that stress at the position of 10 mm apart from the intersection is similar to the stress at the weld root. If the stresses at 20 or 30 mm away from the intersection are used for the fatigue analyses, stresses are smaller than that at weld root. Then, it may end up with unexpectedly longer estimated fatigue life.
It should be noted that the FEM analyses indicate that the stresses also exist in the web of the trough. These stresses are due to bending and axle force in the web of the trough. However, these stresses do not contribute to the root-deck fatigue cracking, since directions of stresses are almost parallel to the crack path. If one considers the crack emanating from root and propagating through the fillet weld, then the stresses in the web of the trough are to be considered. The detail of this consideration is summarized in Appendix.
Fig.12 Components of a stress transverse to the joint
75
200
350
no-load-distribution case with-load-distribution case
Fig.10 Modeling of load distribution for double wheel of patter-2
Pass-5
Pass-4
Pass-3
Pass-2
Pass-1
(a) Double wheel (b) Single wheel
Fig.11 Transverse running locations of wheels
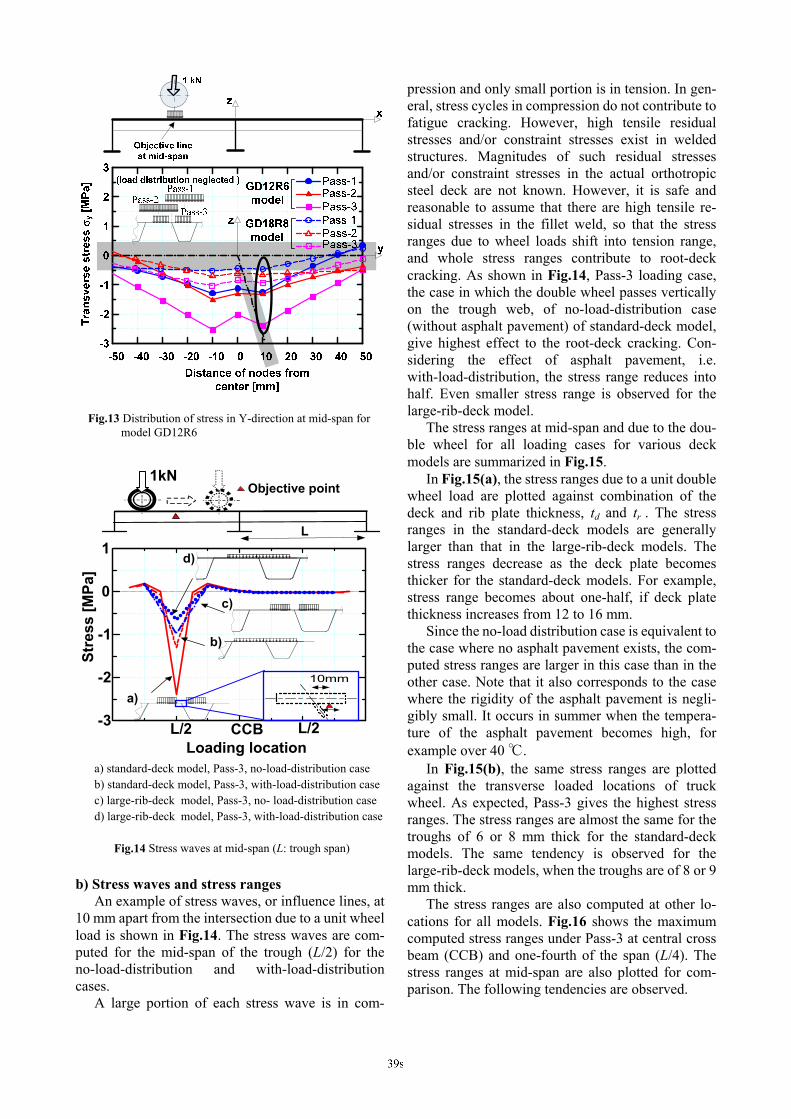
b) Stress waves and stress ranges An example of stress waves, or influence lines, at
10 mm apart from the intersection due to a unit wheel load is shown in Fig.14. The stress waves are com-puted for the mid-span of the trough (L/2) for the no-load-distribution and with-load-distribution cases.
A large portion of each stress wave is in com-
pression and only small portion is in tension. In gen-eral, stress cycles in compression do not contribute to fatigue cracking. However, high tensile residual stresses and/or constraint stresses exist in welded structures. Magnitudes of such residual stresses and/or constraint stresses in the actual orthotropic steel deck are not known. However, it is safe and reasonable to assume that there are high tensile re-sidual stresses in the fillet weld, so that the stress ranges due to wheel loads shift into tension range, and whole stress ranges contribute to root-deck cracking. As shown in Fig.14, Pass-3 loading case, the case in which the double wheel passes vertically on the trough web, of no-load-distribution case (without asphalt pavement) of standard-deck model, give highest effect to the root-deck cracking. Con-sidering the effect of asphalt pavement, i.e. with-load-distribution, the stress range reduces into half. Even smaller stress range is observed for the large-rib-deck model.
The stress ranges at mid-span and due to the dou-ble wheel for all loading cases for various deck models are summarized in Fig.15.
In Fig.15(a), the stress ranges due to a unit double wheel load are plotted against combination of the deck and rib plate thickness, td and tr . The stress ranges in the standard-deck models are generally larger than that in the large-rib-deck models. The stress ranges decrease as the deck plate becomes thicker for the standard-deck models. For example, stress range becomes about one-half, if deck plate thickness increases from 12 to 16 mm.
Since the no-load distribution case is equivalent to the case where no asphalt pavement exists, the com-puted stress ranges are larger in this case than in the other case. Note that it also corresponds to the case where the rigidity of the asphalt pavement is negli-gibly small. It occurs in summer when the tempera-ture of the asphalt pavement becomes high, for example over 40 ℃.
In Fig.15(b), the same stress ranges are plotted against the transverse loaded locations of truck wheel. As expected, Pass-3 gives the highest stress ranges. The stress ranges are almost the same for the troughs of 6 or 8 mm thick for the standard-deck models. The same tendency is observed for the large-rib-deck models, when the troughs are of 8 or 9 mm thick.
The stress ranges are also computed at other lo-cations for all models. Fig.16 shows the maximum computed stress ranges under Pass-3 at central cross beam (CCB) and one-fourth of the span (L/4). The stress ranges at mid-span are also plotted for com-parison. The following tendencies are observed.
Fig.13 Distribution of stress in Y-direction at mid-span for
model GD12R6
Loading location
Stre
ss [M
Pa]
-3
-2
-1
0
1
L/2 CCB L/2
10mm
1kNObjective point
L
a)
b)
c)
d)
a) standard-deck model, Pass-3, no-load-distribution case b) standard-deck model, Pass-3, with-load-distribution case c) large-rib-deck model, Pass-3, no- load-distribution case d) large-rib-deck model, Pass-3, with-load-distribution case
Fig.14 Stress waves at mid-span (L: trough span)

For the standard-deck models, stress ranges at L/4 points are slightly higher than that at L/2. However, the difference is so small, so that fatigue cracking possibly occurred at any point in these points. Stress ranges are less at CCB points, there is less possibility for the crack to initiate at CCB. Stress ranges at L/4 and CCB points become smaller, as the deck plate thickness increases, which is the same tendency as the stress at L/2, except the large-rib-deck type. For the large-rib-deck models, the stress ranges at CCB become the highest.
FEM analyses shows that the magnitudes of stress ranges under a unit single wheel load are somewhat comparable to that under a unit double wheel load. But, the single wheel loads of the most trucks in service are lighter than double wheel loads, making the stress ranges due to single wheel load less im-portant. The single wheel loads are not considered for fatigue evaluation in this study.
4. WHEEL LOAD AND ITS FREQUENCY USED IN FATIGUE LIFE EVALUATION In order to evaluate fatigue life of the root-deck
type fatigue, one has to know wheel load and its frequency during a unit period. One way is to use design wheel load specified in JRA specification22). Then, its frequency must be assumed.
In this paper, wheel loads and their number of cycles are determined based on measured wheel load distributions in service. They were measured in heavily loaded national highways by bridge weigh-in-motion system using reaction forces28). An example of axle load distribution measured at the National Route 23 near Yokkaichi for one week is shown in Fig.17. Note that more than 1000 axles exceed over 100 kN axle load limit for the trucks in weekdays, indicating that there is high possibility of overloaded trucks on the national highways. Note also that a few axles exceeded the design axle load of 200 kN, specified by JRA specification22).
In order to simplify fatigue durability evaluation, an equivalent axle load, Weq, is computed using Equation (1) from the measured axle load distribu-tions where m = 3, and Wj is an axle load in service corresponding to its frequency nj.
m
jjmjeq nnWW ∑ ∑×= /)( (1)
The data used are from the slow lanes measured at three bridge locations near Nagoya for one week, two in the national routes and one in an expressway. In the computation, axle loads less than 100 kN are not
Thickness of plates used in deck models
Stre
ss ra
nge
[MPa
]
0.0
0.5
1.0
1.5
2.0
2.5
3.0L/2L/4CCBL/2L/4CCB
126
128
146
148
166
168
188
189
td(mm)tr(mm)
with-load-distribution
no-load-distribution
Fig.16 Stress ranges at L/2, L/4 and CCB under Pass-3
(L : trough span)
Thickness of plates used in deck models
Stre
ss ra
nge
[MPa
]
0.0
0.5
1.0
1.5
2.0
2.5
3.0Pass-1Pass-2Pass-3Pass-1Pass-2Pass-3
126
128
146
148
166
168
188
189
td(mm)tr(mm)
with-load-distribution
no-load-distribution
(a) Stress ranges vs. plate thickness
Transverse wheel locations
Stre
ss ra
nge
[MPa
]
0
1
2
3
Pass-2 Pass-3 Pass-1
td tr12 812 614 814 616 816 618 918 8(Unit:mm)
(b) Stress ranges vary with transverse wheel passage
Fig.15 Stress ranges at L/2 (L: trough span)
No-load-distribution

counted, assuming that axle loads less than the legal limit do not contribute to the fatigue of orthotropic steel deck. This assumption must be further investi-gated.
The computed Weq are plotted against their cor-responding frequencies, i.e. daily number of cycles, in Fig.18. Note that the computed Weq are about 110 kN although the data are from different bridge loca-tions. Only the number of cycles differs depending on the bridge location, for example, national route R23, notorious for heavy truck trucks, carries over 2,000 equivalent axle loads of 110 kN daily.
For the fatigue analyses of orthotropic steel deck, the equivalent wheel load of 55 kN (= 110 kN / 2) is used, and the corresponding daily number of cycles is assumed as 1000. 5. FATIGUE DURABILITY EVALUATION (1) Some assumptions in the analyses
The fatigue strengths, or S-N curves, for various combinations of deck plates and trough ribs are de-fined by fatigue strengths at 2 million cycles shown in Fig.3 and slope of m = 3. The fatigue life defined here corresponds to the number of cycles when the crack propagates approximately to a half of the deck
plate thickness for the root-deck crack29). The cut-off limits are not considered in the analyses. As men-tioned previously, an equivalent wheel load, Weq/2 = 55 kN, and its daily frequency of 1000 are used. It is also assumed this traffic condition does not change over time.
The fatigue evaluations are carried at three ob-jective locations: mid-span (L/2), one-fourth of the span (L/4), and central cross beam (CCB). (2) Fatigue lives under double wheel load
The computed fatigue lives are plotted in Fig.19 for orthotropic steel decks under double wheels, which always pass at any time on Pass-3 in the cases of no-load-distribution and with-load-distribution. Note that Pass-3 gives the maximum stress range compared with Pass-1 or Pass-2.
In the no-load-distribution case, relatively short fatigue lives are obtained for the case when the deck plate thickness is less than 14 mm. The fatigue life increases as the deck plate thickness increases. For example, the fatigue life of 3 to 5 years increases to 10 to 20 years when deck plate becomes thicker from 12 to 16 mm. The large-rib-deck model shows somewhat longer fatigue life, i.e. 6 to 20 years, than the standard-deck model, i.e. 3 ~ 5 years.
When the deck plate thickness increases, fatigue strength decreases due to plate thickness effect. For example, the mean fatigue strength at 2 million cy-cles is 132 MPa for the 12 mm thick deck decreases to 115 MPa for the 18 mm thick deck plate. However, less stress range is observed for the thicker deck plate. For example, under the equivalent wheel load of 55 kN, the stress range drops 43% at L/2 point. That is from 143 to 62 MPa, as the deck plate thickness increases from 12 to 18 mm. Therefore, the fatigue life is expected to increase by (0.87/0.43)3 = 8.3 times. It corresponds to increase in life from 4 to 36 years. It implies that the using thick deck plate may increase fatigue life for the root-deck crack.
Note that the point at center cross beam (CCB) shows shorter fatigue lives than L/2 or L/4 for the large-rib-deck models. This is because the stress ranges at CCB are larger than that at L/2 or L/4 for the large-rib-deck models. This difference is thought to be a result of difference configuration of the model-ing of the detail at the intersection between the cross beam, deck plate and trough (see Fig.5).
When the stiffness of the asphalt pavement is ef-fective, or the with-load-distribution case, an in-crease in computed fatigue life is significant for each model. For instance, it increases 10 to 25 years in-stead of 3 to 5 years for the standard-deck model, at L/2. This is because of the drop in stress range in the case of with-load-distribution compared to the case
0
5 0
1 0 0
1 5 0
2 0 0
2 5 0
1 .E + 00 1 .E + 01 1 .E + 02 1 . E +0 3 1 . E +0 4 1 . E +0 5
C u m u lat i ve Fr e que n c y (N )
Axle
Load
(kN
)M o nT u eW e dT h uF r iS a tSu n
Fig.17 Cumulative axle load from a stress measurement
0
20
40
60
80
100
120
140
0 500 100 0 1 500 2 000 2 500
Number o f A xle s (N)
We
q (
kN
E xpre ssway Eas t Slow
Expressway Wes t Slow
R23 East Slow
R23 West Slow
R1 Wes t Slow
110kN
Fig.18 Equivalent axle load and its frequency for various highways near Nagoya

of no-load-distribution as the fatigue strength is the same for both cases. With an increase of deck plate from 12 to 16 mm, the mean-2s fatigue life at any location becomes over 50 years.
It is due to two factors. Thicker deck plate de-creases the stress range, and the pressure type loading decreases with the load distribution associated with rigidity of the asphalt pavement. The analytical re-sults imply that the stiffness of the asphalt pavement plays somewhat important factors to increase fatigue durability of the root-deck crack of the orthotropic steel deck.
It should also note that the large-rib-deck model normally shows longer fatigue life than the stan-dard-deck model. However, the mean-2s life at CCB is around 20 years, suggesting that fatigue life of the large-rib-deck model needs some attention in the future, if the loading increases to the one assumed in
this analysis. Compared with Pass-3 loading, either Pass-1
loading or Pass-2 loading gives longer fatigue lives under same conditions. It is because such loadings cause smaller stress ranges to the root-deck cracks.
(3) Effect of wheel positions in transverse
direction In the first step of the analysis, it is assumed that
the wheels run at the same lines on the deck plate. However, it is more appropriate to consider trans-verse distribution of wheel running position in the analysis. The factor, αL, accounts for the running position of the wheel, and can be computed by Equation (2).
3 3 /∑ ∑×= iiiL nnλα (2)
where ni is the frequency of occurrence, which
corresponds to a transverse load distribution factor λi. The factor λi is the ratio of stress range due to any running position to the mean location.
In this study, the mean location is fixed at the Pass-3, which gives the shortest fatigue life as men-tioned previously. Then, ni is defined for two side locations, Pass-1 and Pass-2, assuming that wheels run in the normal distribution with standard deviation σ = 35 cm21). Then, the correction factors, αL, can be computed. An example of λi and ni for the stan-dard-deck model is shown in Fig.20(a) in the case of no-load-distribution.
The correction factor, αL, is plotted in Fig.20(b). The factor αL, ranges from 0.8 to 0.95, indicating that considering effect of wheel running position in-creases computed fatigue life. Note that higher cor-rection factors are obtained for the with-load-distribution case than that in the other case. The large-rib-deck models give higher correction factors than the standard-deck models.
The computed fatigue lives correspond to the mean and mean-2s of S-N curves considering lateral distribution of running wheels, are shown in Fig.21. The correction factors αL are 0.8 ~ 0.95, and it cor-responds as if the stress ranges decreased by 15% to 20%, compared with the Pass-3 case. Therefore, the expected fatigue lives are 1.5 ~ 1.7 (= 1.153 ~ 1.23) times as long as the case where the wheel run only on Pass-3.
In the no-load-distribution case, the estimated fa-tigue life of the standard-deck model, is still short, i.e. 4 ~ 10 years, and shorter if compared with 6 ~ 35 years of the large-rib-deck model. If the deck plate thickness is increased to 16 mm, the estimated life increases to 18 to 40 years, still shorter than 100
Thickness of plates used in deck models
Fatig
ue li
fe [Y
ears
]
0102030405060708090
100
Mean-2s(L/2) Mean(L/2) Mean-2s(L/4) Mean(L/4) Mean-2s (CCB) Mean (CCB)
126
128
146
148
166
168
188
189
td(mm)tr(mm)
(a) No-load-distribution case
Thickness of plates used in deck models
Fatig
ue li
fe [Y
ears
]
0102030405060708090
100Mean-2s(L/2) Mean(L/2) Mean-2s(L/4) Mean(L/4) Mean-2s (CCB) Mean (CCB)
126
128
146
148
166
168
188
189
td(mm)tr(mm)
(b) With-load-distribution case
Fig.19 Estimated fatigue lives of the welded joint under double wheel of Pass-3
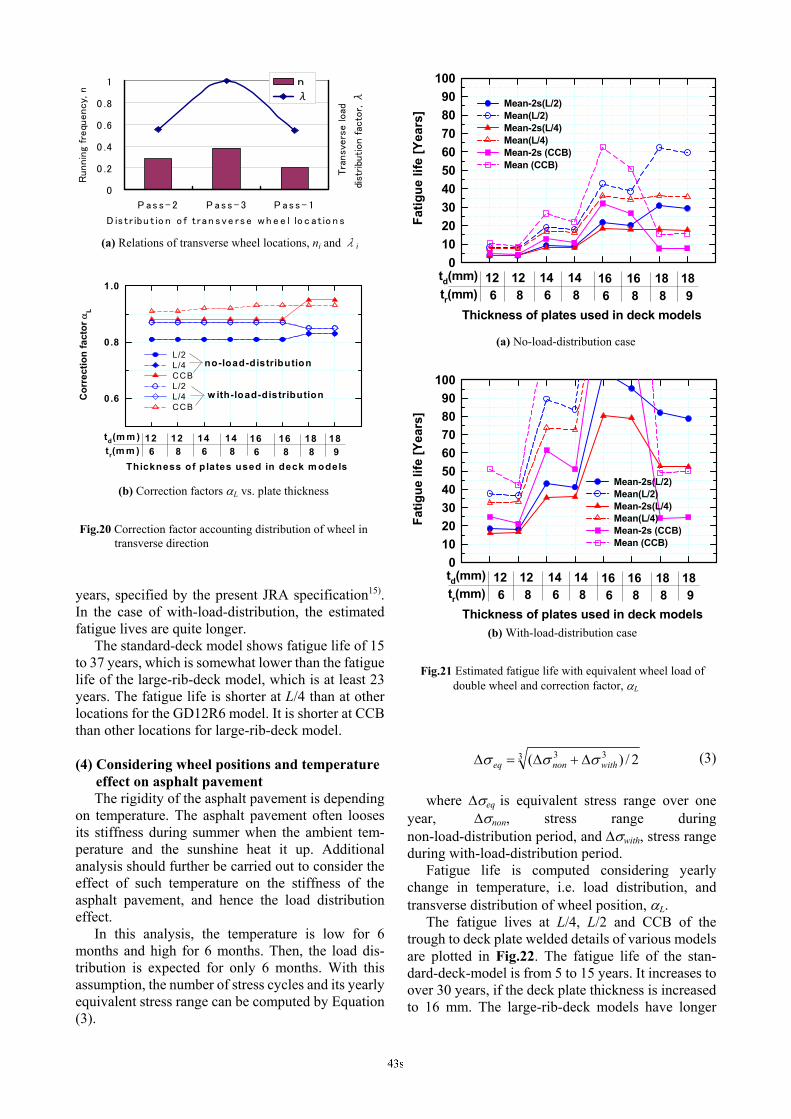
years, specified by the present JRA specification15). In the case of with-load-distribution, the estimated fatigue lives are quite longer.
The standard-deck model shows fatigue life of 15 to 37 years, which is somewhat lower than the fatigue life of the large-rib-deck model, which is at least 23 years. The fatigue life is shorter at L/4 than at other locations for the GD12R6 model. It is shorter at CCB than other locations for large-rib-deck model.
(4) Considering wheel positions and temperature
effect on asphalt pavement The rigidity of the asphalt pavement is depending
on temperature. The asphalt pavement often looses its stiffness during summer when the ambient tem-perature and the sunshine heat it up. Additional analysis should further be carried out to consider the effect of such temperature on the stiffness of the asphalt pavement, and hence the load distribution effect.
In this analysis, the temperature is low for 6 months and high for 6 months. Then, the load dis-tribution is expected for only 6 months. With this assumption, the number of stress cycles and its yearly equivalent stress range can be computed by Equation (3).
3 33 2/)( withnoneq σσσ ∆+∆=∆ (3)
where ∆σeq is equivalent stress range over one
year, ∆σnon, stress range during non-load-distribution period, and ∆σwith, stress range during with-load-distribution period.
Fatigue life is computed considering yearly change in temperature, i.e. load distribution, and transverse distribution of wheel position, αL.
The fatigue lives at L/4, L/2 and CCB of the trough to deck plate welded details of various models are plotted in Fig.22. The fatigue life of the stan-dard-deck-model is from 5 to 15 years. It increases to over 30 years, if the deck plate thickness is increased to 16 mm. The large-rib-deck models have longer
Thickness of plates used in deck models
Fatig
ue li
fe [Y
ears
]
0102030405060708090
100
Mean-2s(L/2) Mean(L/2) Mean-2s(L/4) Mean(L/4) Mean-2s (CCB) Mean (CCB)
126
128
146
148
166
168
188
189
td(mm)tr(mm)
(a) No-load-distribution case
Thickness of plates used in deck models
Fatig
ue li
fe [Y
ears
]
0102030405060708090
100
Mean-2s(L/2) Mean(L/2) Mean-2s(L/4) Mean(L/4) Mean-2s (CCB) Mean (CCB)
126
128
146
148
166
168
188
189
td(mm)tr(mm)
(b) With-load-distribution case
Fig.21 Estimated fatigue life with equivalent wheel load of double wheel and correction factor, αL
0
0 .2
0 .4
0 .6
0 .8
1
P as s- 2 P ass- 3 P ass- 1
D is t r ibu t io n o f t ran sve rse wh e e l lo c a t io n s
Runnin
g fr
equ
ency,
nn
λ
Tra
nsv
ers
e load
dist
ribu
tion f
acto
r, λ
(a) Relations of transverse wheel locations, ni and λi
Thickness of p lates used in deck m odels
Cor
rect
ion
fact
or α
L
0 .6
0.8
1.0
L/2L/4CCBL/2L/4CCB
126
128
146
148
166
168
188
189
td(m m )tr(m m )
w ith-load-distribution
no-load-distribution
(b) Correction factors αL vs. plate thickness
Fig.20 Correction factor accounting distribution of wheel in
transverse direction

fatigue lives than that of the standard-deck model. The fatigue life at CCB is lower than other locations for the large-rib-deck models, but is longer than other locations for the standard-deck model.
6. SUMMARY OF FINDINGS Fatigue life of a welded joint with a crack initi-
ating from root and propagating through deck plate, namely root-deck crack, of the orthotropic steel deck is estimated in this paper. The fatigue strengths of the trough to deck plate welded details regarding to the root-deck crack are evaluated first by the analytical method using one-millimeter method. The estimated S-N curves are further verified by the previous test results.
The FEM stress analyses are carried out with shell elements on two-panel-deck models representing the standard type orthotropic steel decks commonly used in practice and large-rib models with large troughs and thicker deck plate. The stress waves are com-puted for the points of interest, which are at L/4, L/2 and CCB. Various combinations of the plate thick-ness of decks and ribs are also considered in the analyses. The effect of stiffness of the asphalt pavement on fatigue life is considered by load dis-tribution. For the root-deck crack, stress ranges at 10 mm away from the trough to deck plate intersection are used to evaluate fatigue life.
The fatigue life evaluations are carried out with an equivalent wheel load of 55 kN, representing the wheel loads of trucks in service, obtained from the wheel load distributions measured in several major highways near Nagoya. The corresponding daily number of wheels is assumed as 1000, which can be modified according to condition of truck traffic.
Under a given loading condition, standard-deck models showed possibility of fatigue cracking in relatively short service life. The large-rib-deck model appears to have longer fatigue life than a stan-dard-deck model.
The fatigue life is shorter at L/4 than at other lo-cations for the standard-deck models. It implies that the fatigue crack may appear at L/4 earlier than other location. However, the large-rib-deck models show possibility of fatigue crack at CCB, since estimated fatigue life is shorter at CCB than other locations.
When deck plate thickness is increased for the standard-deck models, the fatigue life of the trough to deck welded connection is considerably increased. Therefore, it is recommended to use thicker deck plate, such as 14 or 6 mm thick deck plate instead of 12 mm for a standard-deck model when root-deck fatigue cracks are anticipated due to heavy truck traffics in future.
Distribution of the wheel loads with the asphalt pavement contributes to prolong fatigue life of root-deck crack by factor of three for the mean-2s fatigue life. Maintaining asphalt pavement on the orthotropic steel deck in a good condition is neces-sary to prevent such cracks. It is obvious that root-deck fatigue cracks may be prevented if steel fiber reinforced concrete is used to pave orthotropic steel deck. The steel fiber reinforced concrete in-creases stiffness of the orthotropic steel deck as well as load distribution.
APPENDIX: Effect of stress in the trough web on root-deck crack
For the root-deck crack, it is necessary to consider
stresses associated with bending moments and mem-brane forces acting both deck plate and trough web, as shown in Fig.23. From 3D FEM analysis, the membrane stresses are small compared with stresses due to bending. Then, the membrane stresses can be neglected, and only the stresses due to bending are considered, as shown schematically in Fig.24.
Then, effect of stresses due to forces in the deck plate and the trough rib web on the root-deck crack is computed. The one-millimeter method is used to see the effect of these stresses, where the FEM analyses are carried out separately to see stress at one mm in depth in the expected crack path, as shown in Fig.25, for the standard-deck model with weld penetration of 75% of trough rib.
In the computation of one-mm stress range, an unit bending stress, ∆σb_deck, and an unit bending stress, ∆σb_rib, and an unit membrane stress, ∆σm_rib, are applied to the deck and the rib web, respectively.
Thickness of plates used in deck models
Fatig
ue li
fe [Y
ears
]
0102030405060708090
100Mean-2s(L/2) Mean(L/2) Mean-2s(L/4) Mean(L/4) Mean-2s (CCB) Mean (CCB)
126
128
146
148
166
168
188
189
td(mm)tr(mm)
Fig.22 Estimated fatigue life with yearly equivalent stress
range

The results are shown in Fig.26, where the stresses are normalized with one-mm stress due to the bend-ing stresses applied to deck plate. It shows that the one-mm stresses caused by the bending stress or axial stress in the rib web are less than 10% of that due to bending stress in the deck plate.
If one assumes that relative fatigue life can be
computed with the power of 3, the loadings in rib web give the fatigue lives over (1/0.1)3=1,000 times as long as the loading in deck plate. It implies that the stress due to bending of the deck plate is the domi-nant factor affecting on the root-deck crack.
The analysis is made with the standard-deck model with deck of 12 mm thick and rib of 6 mm thick. Other details are believed to follow the same tendency. The demonstration is more or less limited to fatigue crack initiation stages and propagation stage up to a half of deck plate thickness, since shear forced in the deck plate due to wheel load is ne-glected in the analysis. Including such effect are to be discussed in the future investigation.
REFERENCES 1) Yuge, T., Machinda, F., Morikawa, H., Miki, T., Kamiki, T.,
Masui,T.: Analysis of fatigue damage patterns in orthotropic steel deck of Tokyo Metropolitan Expressways, Orthotropic Bridge Conference, Sacramento, USA, pp.531-542, CD-ROM, 2004.
2) Takada, Y., Hirano, T., Sakano, M.: Report on conditions of fatigue damage of orthotropic steel deck of Hanshin Ex-pressway, Proc. of 61th JSCE Annual meeting, Division 1., pp.1067-1068, CD-ROM, 2006. (in Japanese)
3) Investigation of flaw detection method for fatigue cracking in deck plate using of ultrasonic wave, mid-term report, Yoko-gawa Bridge Corp., 2003. (in Japanese)
4) Arima, Y., Murakoshi, J., and Fujiki, O.: Experimental in-vestigation of ultrasonic testing with propagating crack in orthotropic steel deck plate, Proc. of 60th JSCE Annual meeting, Division 1., pp.329-330, CD-ROM, 2005. (in Japa-nese)
5) Ono, S., Shimozato, T., Masui, T., Machida, F., Miki, C.: Retrofitting method for existing orthotropic steel deck, J. Struct. Eng., JSCE, No.801/I-73, pp.213-226, 2005. (in Japa-nese)
6) Kagara, N., Irube, T., Hosomi, N., Nagasaki, Y., Tanaka, M., Mori, T.: Proposal of reinforcing works for fatigue damage in orthotropic steel deck, Tokotsu Technical Report, No.51, pp. 6-31, 2006. (in Japanese)
7) Shimozato, T., Kamiki, T., Inaba, N., Tomita, Y., Ono, S.: Fatigue test with moving load on orthotropic steel deck, Proc. of 60th JSCE Annual meeting, Division 1., pp.795-796, CD-ROM, 2005. (in Japanese)
8) Shimozato, T., Kamiki, T., Inaba, N., Tomita, Y., Ono, S.: Fatigue test on retrofitted crack in trough to deck plate of orthotropic steel deck, Proc. of 61th JSCE Annual meeting, Division 1., pp.1095-1096, CD-ROM, 2006. (in Japanese)
9) Inokuchi, S., Kawabata, A., Hironaka, O., Saito, S.: Fatigue test by the wheel loading machine intended for weld of the trough rib to deck plate of orthotropic decks (Second report), Proc. of 61th JSCE Annual meeting, Division 1., pp.1081-1082, CD-ROM, 2006. (in Japanese)
10)Arima, Y., Murakoshi, J.: Simulation of propagating crack in orthotropic steel deck plate by fatigue test with moving load, Proc. of 61th JSCE Annual meeting, Division 1., pp.1083-1084, CD-ROM, 2006. (in Japanese)
11)Oka, T., Aiba, M., Murakoshi, J., Arima, Y., Hayashi, N., Kameyama, T.: Fatigue test with moving load on cracked orthotropic steel deck reinforced by stringer or by filling the trough ribs, Proc. of 61th JSCE Annual meeting, Division 1., pp.1107-1108, CD-ROM, 2006. (in Japanese)
Fig.23 Internal forces acting on sections near joint under
action of wheel load
= +
Fig.24 Superposition of internal forces after negligence of axial force in deck plate
Assumed expected crack path
12mm deck plate
6mm rib
Fig.25 FEM model with separate applied stress range
One-m illim eter stress range from
one-
mm
str
ess
rang
e/∆
σ b_de
ck
0 .0
0.5
1.0
∆σb_deck ∆ σb_rib ∆ σm _rib
Fig.26 Comparison of ∆σ1mm from separately applied stress
range
12)Murakoshi, J.: Approach on fatigue of orthotropic steel deck and the countermeasure. Power point handout, Proceedings of SGST assembly, 2007. (in Japanese)
13)Mizuguchi, K., Yamada, K., Iwasaki, M., Inokuchi, S.: Rationalized steel deck structure and large model test for developing new type of structure, Orthotropic Bridge Con-ference, Sacramento, USA, pp.675-688, CD-ROM, 2004.
14)Xiao, Z.G., Yamada, K.: A method of determining geometric stress for fatigue strength evaluation of welded joints, Int. J. Fatigue, pp.1277-1293, 2004.
15)Fatigue Design Guideline for Steel Highway Bridges, Japan Road Association, pp.45, 2002. (in Japanese)
16)Mori, T.: Influence of weld penetration of fatigue strength of single-sided fillet welded joins, J. JSSC, Vol. 10, No.40, pp.9-15, 2003. (in Japanese)
17)Inose, K., Saito, S., Kurada, Y., Nakanishi, T.: Investigation on small-scale test specimens containing fatigue cracks of joints between orthotropic steel deck plate and trough rib, Proc. of 61th JSCE Annual meeting, Division 1., pp.1187-1188, CD-ROM, 2006. (in Japanese)
18)Maddox, S.J.: Fatigue of welded joints loaded in bending, TRRL Supplementary Report 84 UC, Crowthorne, Berkshire, 1974.
19)Ya, S., Yamada, K., Ojio, T.: Fatigue tests of welded joints between trough to orthotropic steel deck in bending stress, Meetings of JSCE of Chubu Area, pp.61-62, CD-ROM, 2007.
20)COSMOSM User’s guide, Structural Research Analysis Corporation (SRAC), 2004.
21)Shinohara, H.: Fatigue of orthotropic steel bridge deck, Steel
structure series 4, pp.54, 1990. (in Japanese) 22)Specifications for Highway Bridges and Commentary. Part I,
General, and Part II, Steel Bridges, Japan Road Association (JRA), 2002. (in Japanese)
23)Kasahara, A., Okagawa, H., Sugawara, T.: Dynamic property of bituminous mixture and its application to analysis of pavement structure, JSCE Technical report, No.254, pp.107-117, 1976. (in Japanese)
24)Japan Meteorological Agency, http://www.data.kishou.go.jp 25)Kagata, M., Nakamura, M., Ishida, M., Kodama, T., Nshi-
kawa, T., Kurihara, K.: SFRC pavement on the steel bridge deck to improve its fatigue performance, Bridge and Foun-dation Engineering, Vol. 38, pp.27-32, 2004. (in Japanese)
26)Buitelaar, P., Braam, R., Kaptijn, N.: Reinforced high per-formance concrete overlay system for rehabilitation and strengthening of orthotropic steel bridge decks, Orthotropic Bridge Conference, Sacramento, USA, pp.384-401, CD-ROM, 2004.
27)Xanthakos, P.P.: Theory and Design of Bridges, Wiley-Interscience, pp.616, 1993.
28)Yamada, K.: Some new approaches to fatigue evaluation of steel bridges, Int. J. Steel Structures, KSSC, Vol.6, No.4, pp.319-326, 2006.
29)Yamada, K., Ya, S.: Plate bending fatigue tests for root crack of trough rib of orthotropic steel deck, Journal of Structure Engineering, JSCE, 2008.3. (in Japanese)
(Received October 17, 2007)