FATIGUE DAMAGE MAPPING - NASA...N88-22423 FATIGUE DAMAGE MAPPING Darrell Socie Department of...
8
N88-22423 FATIGUE DAMAGE MAPPING Darrell Socie Department of Mechanical and Industrial Engineering University of Illinois at Urbana-Champaign Observations of fatigue crack nucleation and early growth are presented. The state of stress/strain has been shown to play a significant role in this process. Early growth occurs on planes experiencing the largest range of shear strain (Mode II) or normal strain (Mode I) depending on the stress state, strain amplitude, and microstructure. These observations have been summarized in a fatigue damage map for each material. These maps provide regions where one fatigue failure mode dominates the behavior. Each failure mechanism results in a different failure mode. Once the expected failure mode has been identified, bulk deformation models based on the cyclic stresses and strains can be used to obtain reliable estimates of fatigue lives for complex loading situations. Work done under NASA Grant NAG3-465. 3-213 https://ntrs.nasa.gov/search.jsp?R=19880013039 2020-03-10T15:11:43+00:00Z
Transcript of FATIGUE DAMAGE MAPPING - NASA...N88-22423 FATIGUE DAMAGE MAPPING Darrell Socie Department of...

N88-22423
FATIGUE DAMAGE MAPPING
Darrell Socie
Department of Mechanical and Industrial EngineeringUniversity of Illinois at Urbana-Champaign
Observations of fatigue crack nucleation and early growth are presented.The state of stress/strain has been shown to play a significant role inthis process. Early growth occurs on planes experiencing the largestrange of shear strain (Mode II) or normal strain (Mode I) depending on thestress state, strain amplitude, and microstructure. These observationshave been summarized in a fatigue damage map for each material. Thesemaps provide regions where one fatigue failure mode dominates thebehavior. Each failure mechanism results in a different failure mode.Once the expected failure mode has been identified, bulk deformationmodels based on the cyclic stresses and strains can be used to obtainreliable estimates of fatigue lives for complex loading situations.
Work done under NASA Grant NAG3-465.
3-213
https://ntrs.nasa.gov/search.jsp?R=19880013039 2020-03-10T15:11:43+00:00Z

EXECUTIVE OVERVIEW OF FATIGUE DAMAGE MAPPING
I I I I I
A
LO
088
rc 0.6 7
z \ 0'4
082
0
A fatigue damage map for Inconel 718 loaded in cyclic tension is given below. The vertical scale is presented in terms of life fraction and the horizontal scale in terms of fatigue life. The solid line repre- sents the first observation of a surface crack 100 pm long and serves as a demarcation between initiation and growth. The dashed line represents the demarcation between crack growth on planes of maximum shear strain ampli- tude and crack growth on planes of maximum principal strain amplitude. Region A is characterized by shear initiation followed by extensive shear crack growth with final failure occurring by a linking of shear cracks similar to the tearing of perforated paper. Region B is characterized by shear initiation followed by crack growth along the principal stress direction. A third region is often observed at long lives and small strains where there is no observable initiation or shear initiation resulting in nonpropagating cracks. A separate damage model is required for each region.
IN-718, Tension
-Region A lB \ \ . \ Tensile Crack Growth
Shetar Crack Growth / A _ - I
3-214

EXECUTIVE OVERVIEW OF FATIGUE DAMAGE MAPPING
The damage maps indicate that a shear strain ba_ed theory is mostappropriate for this material for lives below about i0 _ cycles. One suchdamage parameter has been proposed by Fatemi and Socie (1985)
0
n]Oy
Two parameters are considered to cause fatigue damage. The primary damageis caused by the cyclic shear strains (y). Stresses normal to the cyclicshear strain tend to open any microcracks and enhance their growth. Hencethe second term can be interpreted as including crack closure effects.The term also includes effects from any additional cyclic hardening thatis often observed during nonproportional loading. The stress normal tothe shear crack (On) is normalized with the yield strength (o) to retainthe dimensionless _eatures of strain. In this formulationJno fatigue
damage is computed for planes in the material that do not experiencecyclic shear strain. Results are presented for a wide variety of loadinghistories including tension, torsion, biaxial tension, and tests withcomplex multiaxial mean stresses. Both proportional and nonproportionaltests are included. This degree of correlation is only possible becausethe damage mechanism does not change for the variety of tests consideredhere.
162
io-34-
<_.
I i I I i Illl I I i I I I I1| I
r/=1.0
DD
x x
I I I I I Ill I I I I I IIII I I I I I I1_
FATIGUE OF INCONEL 718
O TENSION-ToRsION, COMPLETELY REVERSED
TENSION-TORSION, MEAN STRAIN
Q TENSION-ToRsION, OUT-OF-PHASE
• BIAXIAL-TENSION
X UNIAXIAL, SMOOTH SPECIMEN
X XX
• coX x
X X _X
xx
Z_ x x x--re.
I I l J IIII I I I I I IIII
104
I I I I I IIII f t I i trill I I t I II
,o ,o" ,o'
Nf, Cycles
3-215
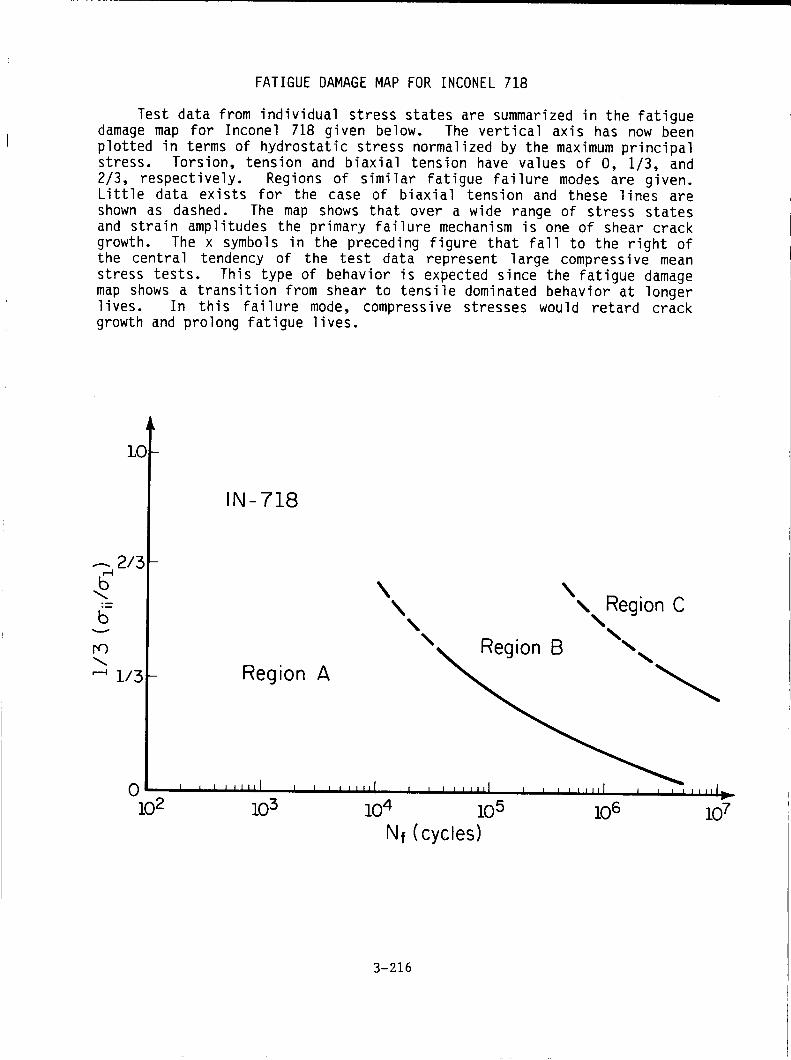
FATIGUE DAMAGE MAP FOR INCONEL 718
Test data from individual stress states are summarized in the fatiguedamage map for Inconel 718 given below. The vertical axis has now beenplotted in terms of hydrostatic stress normalized by the maximum principalstress. Torsion, tension and biaxial tension have values of O, i/3, and2/3, respectively. Regions of similar fatigue failure modes are given.Little data exists for the case of biaxial tension and these lines areshown as dashed. The map shows that over a wide range of stress statesand strain amplitudes the primary failure mechanism is one of shear crack
growth. The x symbols in the preceding figure that fall to the right ofthe central tendency of the test data represent large compressive meanstress tests. This type of behavior is expected since the fatigue damagemap shows a transition from shear to tensile dominated behavior at longerlives. In this failure mode, compressive stresses would retard crackgrowth and prolong fatigue lives.
I0
---2/3f-N
b
_ 1/3-
0102
IN-718
Region A
i I I IIII]
103
\\ %%. Region C
%%
I I Illllj I , I I IIIIj I I I I I IIIj I I I r I,IfJ_.
10 4 10 5 10 6 10 7
Nf (cycles)
3-216
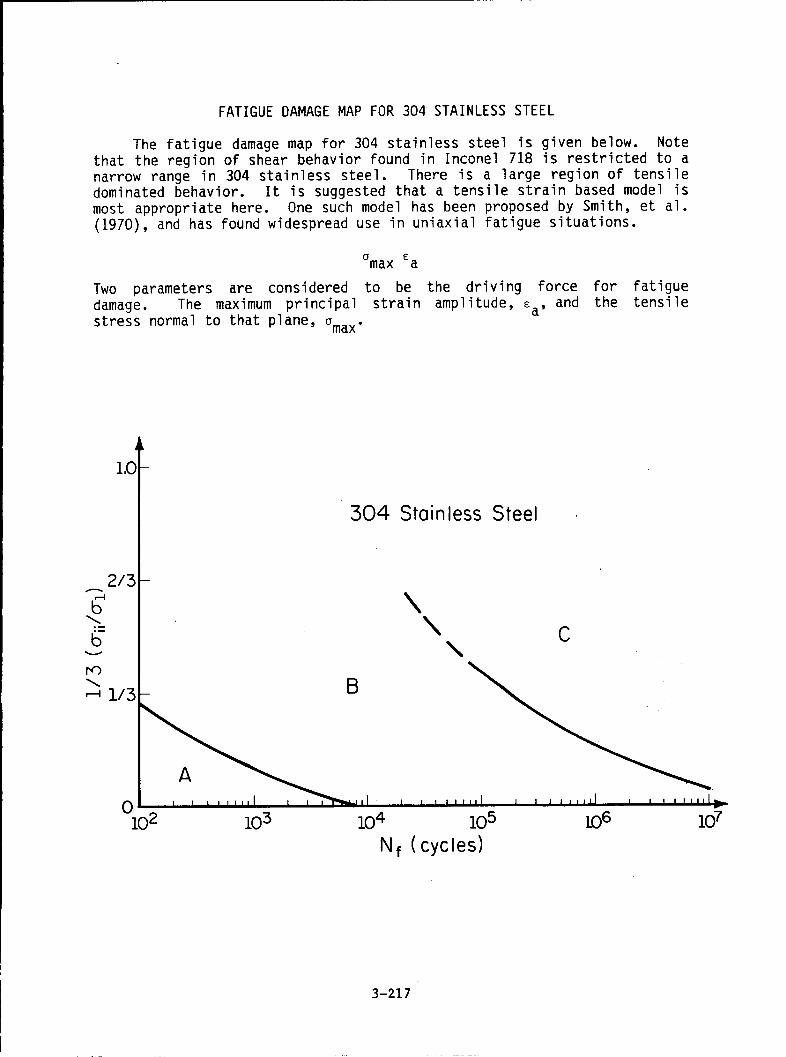
FATIGUE DAMAGE MAP FOR 304 STAINLESS STEEL
The fatigue damage map for 304 stainless steel is given below. Notethat the region of shear behavior found in Inconel 718 is restricted to anarrow range in 304 stainless steel. There is a large region of tensiledominated behavior. It is suggested that a tensile strain based model ismost appropriate here. One such model has been proposed by Smith, et al.(1970), and has found widespread use in uniaxial fatigue situations.
°max s a
Two parameters are considereddamage. The maximum principal
stress normal to that plane, Omax.
to be the driving force for fatigue
strain amplitude, s a, and the tensile
I0
2/3
b
b
304 Stainless Steel
\\
\C
I130 -
102 103 104 105 lO6 I07
Nf (cycles)
3-217

LIFE ESTIMATIONS FOR 304 STAINLESS STEEL
Test data for 304 stainless steel from Socie (1987) for bothproportional and nonproportional tests are given below. This materialcyclically hardens under nonproportional loading to a stable stress levelthat is nearly double that of a proportional test. The increase in cyclicstress is very damaging and must be accounted for in the model. For thesame total strain range, uniaxial loading has the largest plastic strainrange and longest life. Nonproportional loading tests have the smallestplastic strain range, largest stress range and shortest life.
1i0
O4
_u
0E
0
%
0%
0
J I I I Ill
104
304 Stainless Steel
O0 o0 00CD o
&
I i i ]liil
105
Nz.o
I I I i i 'lllil
3-218

MULTIAXIAL MEAN STRESS EXAMPLE
Two loading cases that have the same shear damage parameter are givenbelow. Consider a standard uniaxial test specimen, Case A, tested in zeroto maximum strain cycling. A tensile mean stress o will result. Nowconsider a second test, Case B, of a tubular specimen _ested with the sameaxial strain range only in completely reversed loading. The magnitude ofthe mean stress in the first test is applied as a hoop stress in thesecond test. Since the shear damage parameter is the same for both teststhe fatigue lives would be expected to be similar for a material thatfails in a shear mode. Note that the tensile damage parameter for thesecond test is much lower since there is no mean stress in the planeexperiencing the largest range of cyclic principal strain. Results forInconel 718 are as follows:
a_/2 o Case A Case B0.0005 2_0 4245 6735
9768 7221
These tests confirm the selection of the damage parameter since the livesare the same for both tests. The tensile model predicts an increase infatigue life for Case B that was not observed experimentally.
Case A
( R = 0 loadingwith OoMeanTensile Stress)
GCase B o
(R =-1 loadingwith OoMean Hoop Stress)
ExternalLoading
Conditions
2'2
t A_ Ao
oo
o
Maximum Stressand Maximum Strain
Amplitude on Shear Plane
//
/
G 7//
oo ;/
/
/
T= (l+v) _'_2
3-219
/
/
/
/
/
/
/
T= (1+v)"_2
%°=_2 2 +0°)
Maximum Stressand Maximum Strain
Amplitude on Tensile Plane
2
o_ax=A.__o+ %2
ornax
E = A-.-_2
_ax =Aa2

i" REFERENCES
Fatemi, A., and Socie, D. F. (1987), "A Critical Plane Approach toMultiaxial Fatigue DamageIncluding Out-of-Phase Loading," accepted forpublication in Fatigue and Fracture Engineering Materials and Structures.
Smith, R. N., Watson, P., and topper, T. H. (1970), "A Stress-StrainFunction for the Fatigue of Metals," Journal of Materials, JMLSA, Vol. 5,No. 4, pp. 767-778.
Socie, D. F. (1987), "Multiaxial Fatigue Damage Models," Journal ofEngineering Materials and Technology, Vol. 109, No. 4, pp. 293-298.
3-220