Fatigue damage cumulation in brass under variable loading · Fatigue damage cumulation in brass...
6
ARCHIVES of FOUNDRY ENGINEERING Published quarterly as the organ of the Foundry Commission of the Polish Academy of Sciences ISSN (1897-3310) Volume 9 Issue 3/2009 275 – 280 49/3 ARCHIVES of FOUNDRY ENGINEERING Volume 9, Issue 3/2009, 275-280 275 Fatigue damage cumulation in brass under variable loading S. Mroziński a * , S. Dymski b ** a Department of Machine Design, Mechanical Engineering Faculty, University of Technology and Life Sciences Kaliskiego 7, 85-796 Bydgoszcz, Poland *Corresponding author. E-mail address: [email protected] b Department of Materials Science and Engineering, Mechanical Engineering Faculty, University of Technology and Life Sciences, Kaliskiego 7, 85-796 Bydgoszcz, Poland *Corresponding author. E-mail address:[email protected] Received 21.04.2009; accepted in revised form 24.04.2009 Abstract In the paper there was presented the course of fatigue damage cumulation in specimens made of CuZn37 brass. During the analysis the course of damage cumulation there were used parameters of hysteresis loop and microstructure changes for different levels of fatigue damage, that were registered during the tests. Basing on the analysis of three hysteresis loop parameters (stress amplitude a , plastic strain amplitude ap and plastic strain energy W pl ) it has been found that during variable loading the smallest changes are observed for the energy W pl . Microscopic analysis of brass specimens after various fatigue levels showed that fatigue damage cumulation is also visible in changes taking place both within grains and at their boundaries. These changes include the presence of failures at boundaries of grains and slide banding systems inside of them, which are typical for plastic strain of the material. Keywords: Damage cumulation, Cyclic properties, Fatigue damages 1. Introduction Variable loadings of construction units generate, in the material of which they are made, specific changes and fatigue phenomena. If these loadings are big enough they may locally cause the plastic strains in such a unit. During fatigue life calculations of the construction units containing locally areas of the plastic – elastic strains there are used material data defined in the low-cycle fatigue area [1]. Experimental conditions in this fatigue area are defined i.e. in the standards [2, 3]. The characteristic feature of the low-cycle fatigue area is forming, in every cycle of variable loading, of hysteresis loop (Fig. 1). Characteristic loop parameters i.e. are: total strain amplitude ac , plastic strain amplitude ap , stress amplitude a and ranges of the mentioned parameters, that is: ac , ap , a (Fig. 1). The area enclosed by the loop is the yardstic of the energy dissipated in the material during one loading cycle. This energy is also called as the plastic strain energy W pl . Analysis of the mentioned parameters in the function of the loading cycles number enables the description of changes of the cyclic properties of the material and also the course of the damage cumulation. The changes of the properties as the result of the variable loadings (cyclic hardening or softening) belong to extraordinary processes that accompany the low- cycle fatigue of metals. At the present moment there is a number of cyclic hardening or softening hypotheses. Some of these hypotheses are in connection with hypotheses elaborated for the static loading or they directly result from them [4, 5]. The aim of the paper is the analysis of the course changes of the basic hysteresis loop parameters under fatigue loading. The additional aim is the microscopic structure analysis.
Transcript of Fatigue damage cumulation in brass under variable loading · Fatigue damage cumulation in brass...
A R C H I V E S
o f
F O U N D R Y E N G I N E E R I N G
Published quarterly as the organ of the Foundry Commission of the Polish Academy of Sciences
ISSN (1897-3310) Volume 9
Issue 3/2009
275 – 280
49/3
A R C H I V E S o f F O U N D R Y E N G I N E E R I N G V o l u m e 9 , I s s u e 3 / 2 0 0 9 , 2 7 5 - 2 8 0 275
Fatigue damage cumulation in brass under
variable loading
S. Mrozińskia*
, S. Dymski
b**
aDepartment of Machine Design, Mechanical Engineering Faculty, University of Technology and Life Sciences
Kaliskiego 7, 85-796 Bydgoszcz, Poland
*Corresponding author. E-mail address: [email protected] bDepartment of Materials Science and Engineering, Mechanical Engineering Faculty,
University of Technology and Life Sciences, Kaliskiego 7, 85-796 Bydgoszcz, Poland
*Corresponding author. E-mail address:[email protected]
Received 21.04.2009; accepted in revised form 24.04.2009
Abstract In the paper there was presented the course of fatigue damage cumulation in specimens made of CuZn37 brass. During the analysis the
course of damage cumulation there were used parameters of hysteresis loop and microstructure changes for different levels of fatigue
damage, that were registered during the tests. Basing on the analysis of three hysteresis loop parameters (stress amplitude a, plastic strain
amplitude ap and plastic strain energy Wpl) it has been found that during variable loading the smallest changes are observed for the
energy Wpl. Microscopic analysis of brass specimens after various fatigue levels showed that fatigue damage cumulation is also visible in
changes taking place both within grains and at their boundaries. These changes include the presence of failures at boundaries of grains and
slide banding systems inside of them, which are typical for plastic strain of the material.
Keywords: Damage cumulation, Cyclic properties, Fatigue damages
1. Introduction
Variable loadings of construction units generate, in the
material of which they are made, specific changes and fatigue
phenomena. If these loadings are big enough they may locally
cause the plastic strains in such a unit. During fatigue life
calculations of the construction units containing locally areas of
the plastic – elastic strains there are used material data defined in
the low-cycle fatigue area [1]. Experimental conditions in this
fatigue area are defined i.e. in the standards [2, 3]. The
characteristic feature of the low-cycle fatigue area is forming, in
every cycle of variable loading, of hysteresis loop (Fig. 1).
Characteristic loop parameters i.e. are: total strain amplitude
ac, plastic strain amplitude ap, stress amplitude a and ranges of
the mentioned parameters, that is: ac, ap, a (Fig. 1). The
area enclosed by the loop is the yardstic of the energy dissipated
in the material during one loading cycle. This energy is also
called as the plastic strain energy Wpl. Analysis of the
mentioned parameters in the function of the loading cycles
number enables the description of changes of the cyclic
properties of the material and also the course of the damage
cumulation.
The changes of the properties as the result of the variable
loadings (cyclic hardening or softening) belong to extraordinary
processes that accompany the low- cycle fatigue of metals. At the
present moment there is a number of cyclic hardening or
softening hypotheses. Some of these hypotheses are in
connection with hypotheses elaborated for the static loading or
they directly result from them [4, 5].
The aim of the paper is the analysis of the course changes of
the basic hysteresis loop parameters under fatigue loading. The
additional aim is the microscopic structure analysis.
A R C H I V E S o f F O U N D R Y E N G I N E E R I N G V o l u m e 9 , I s s u e 3 / 2 0 0 9 , 2 7 5 - 2 8 0 276
ap ae
2a=
2 ac= ac
a + a
+
-
Wpl
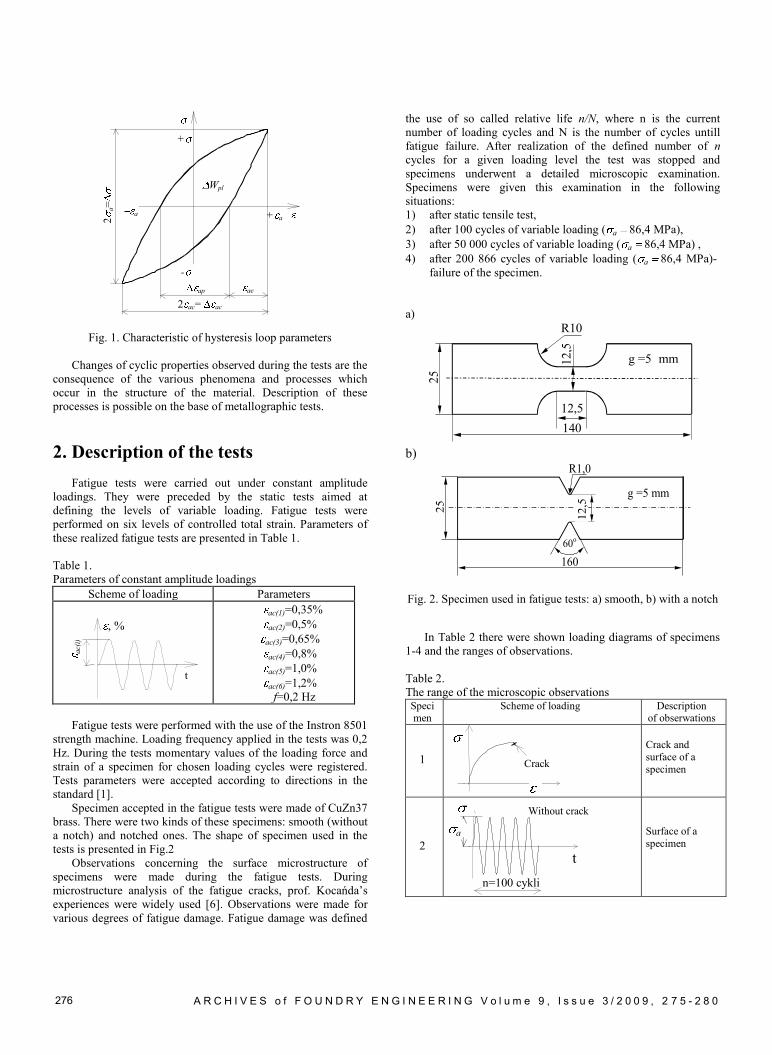
Fig. 1. Characteristic of hysteresis loop parameters
Changes of cyclic properties observed during the tests are the
consequence of the various phenomena and processes which
occur in the structure of the material. Description of these
processes is possible on the base of metallographic tests.
2. Description of the tests
Fatigue tests were carried out under constant amplitude
loadings. They were preceded by the static tests aimed at
defining the levels of variable loading. Fatigue tests were
performed on six levels of controlled total strain. Parameters of
these realized fatigue tests are presented in Table 1.
Table 1.
Parameters of constant amplitude loadings
Scheme of loading Parameters
, %
ac(
i)
t
ac(1)=0,35%
ac(2)=0,5%
ac(3)=0,65%
ac(4)=0,8%
ac(5)=1,0%
ac(6)=1,2%
f=0,2 Hz
Fatigue tests were performed with the use of the Instron 8501
strength machine. Loading frequency applied in the tests was 0,2
Hz. During the tests momentary values of the loading force and
strain of a specimen for chosen loading cycles were registered.
Tests parameters were accepted according to directions in the
standard [1].
Specimen accepted in the fatigue tests were made of CuZn37
brass. There were two kinds of these specimens: smooth (without
a notch) and notched ones. The shape of specimen used in the
tests is presented in Fig.2
Observations concerning the surface microstructure of
specimens were made during the fatigue tests. During
microstructure analysis of the fatigue cracks, prof. Kocańda’s
experiences were widely used [6]. Observations were made for
various degrees of fatigue damage. Fatigue damage was defined
the use of so called relative life n/N, where n is the current
number of loading cycles and N is the number of cycles untill
fatigue failure. After realization of the defined number of n
cycles for a given loading level the test was stopped and
specimens underwent a detailed microscopic examination.
Specimens were given this examination in the following
situations:
1) after static tensile test,
2) after 100 cycles of variable loading ( a 86,4 MPa),
3) after 50 000 cycles of variable loading ( a 86,4 MPa) ,
4) after 200 866 cycles of variable loading ( a 86,4 MPa)-
failure of the specimen.
a)
b)
R1,0
25
160
g =5 mm
60o
12,5
Fig. 2. Specimen used in fatigue tests: a) smooth, b) with a notch
In Table 2 there were shown loading diagrams of specimens
1-4 and the ranges of observations.
Table 2.
The range of the microscopic observations Specimen
Scheme of loading Description of obserwations
1
Crack
Crack and
surface of a
specimen
2
a
t
n=100 cykli
Without crack
Surface of a
specimen
12,5
12,5
R10
25
140
g =5 mm
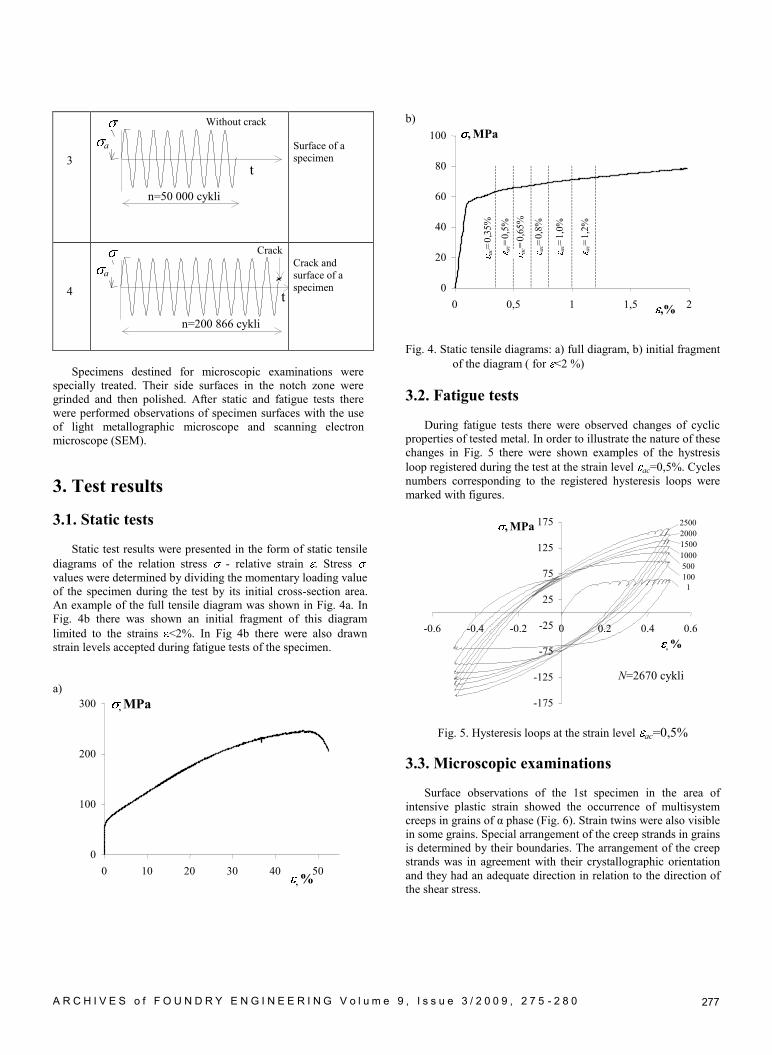
A R C H I V E S o f F O U N D R Y E N G I N E E R I N G V o l u m e 9 , I s s u e 3 / 2 0 0 9 , 2 7 5 - 2 8 0 277
3
a
t
n=50 000 cykli
Without crack
Surface of a
specimen
4
a
t
n=200 866 cykli
Crack
Crack and
surface of a
specimen
Specimens destined for microscopic examinations were
specially treated. Their side surfaces in the notch zone were
grinded and then polished. After static and fatigue tests there
were performed observations of specimen surfaces with the use
of light metallographic microscope and scanning electron
microscope (SEM).
3. Test results
3.1. Static tests
Static test results were presented in the form of static tensile
diagrams of the relation stress - relative strain . Stress
values were determined by dividing the momentary loading value
of the specimen during the test by its initial cross-section area.
An example of the full tensile diagram was shown in Fig. 4a. In
Fig. 4b there was shown an initial fragment of this diagram
limited to the strains <2%. In Fig 4b there were also drawn
strain levels accepted during fatigue tests of the specimen.
a)
0
100
200
300
0 10 20 30 40 50
, MPa
, %
b)
0
20
40
60
80
100
0 0,5 1 1,5 2
, MPa
,%
ac=
0,3
5%
ac=
0,5
%
ac=
0,8
%
ac=
1,0
%
ac=
1,2
%
ac=
0,6
5%
Fig. 4. Static tensile diagrams: a) full diagram, b) initial fragment
of the diagram ( for <2 %)
3.2. Fatigue tests
During fatigue tests there were observed changes of cyclic
properties of tested metal. In order to illustrate the nature of these
changes in Fig. 5 there were shown examples of the hystresis
loop registered during the test at the strain level ac=0,5%. Cycles
numbers corresponding to the registered hysteresis loops were
marked with figures.
-175
-125
-75
-25
25
75
125
175
-0.6 -0.4 -0.2 0 0.2 0.4 0.6
, MPa
, %
N=2670 cykli
1
100
500
1000
1500
2000
2500
Fig. 5. Hysteresis loops at the strain level ac=0,5%
3.3. Microscopic examinations
Surface observations of the 1st specimen in the area of
intensive plastic strain showed the occurrence of multisystem
creeps in grains of α phase (Fig. 6). Strain twins were also visible
in some grains. Special arrangement of the creep strands in grains
is determined by their boundaries. The arrangement of the creep
strands was in agreement with their crystallographic orientation
and they had an adequate direction in relation to the direction of
the shear stress.
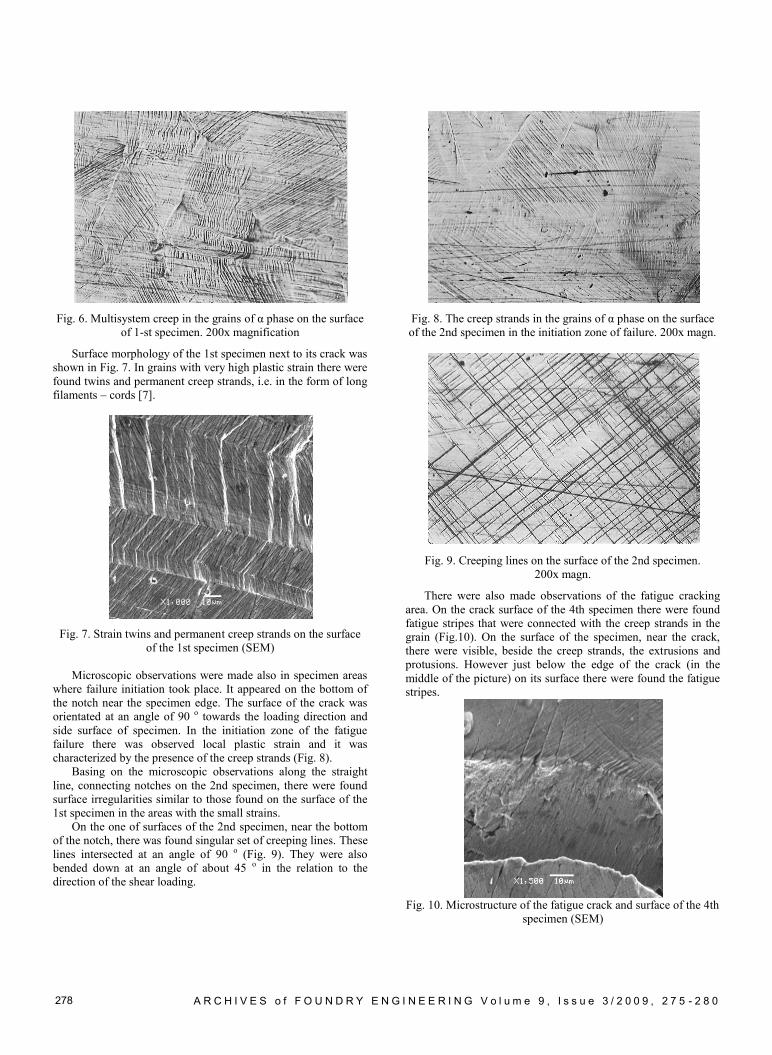
A R C H I V E S o f F O U N D R Y E N G I N E E R I N G V o l u m e 9 , I s s u e 3 / 2 0 0 9 , 2 7 5 - 2 8 0 278
Fig. 6. Multisystem creep in the grains of α phase on the surface
of 1-st specimen. 200x magnification
Surface morphology of the 1st specimen next to its crack was
shown in Fig. 7. In grains with very high plastic strain there were
found twins and permanent creep strands, i.e. in the form of long
filaments – cords [7].
Fig. 7. Strain twins and permanent creep strands on the surface
of the 1st specimen (SEM)
Microscopic observations were made also in specimen areas
where failure initiation took place. It appeared on the bottom of
the notch near the specimen edge. The surface of the crack was
orientated at an angle of 90 o towards the loading direction and
side surface of specimen. In the initiation zone of the fatigue
failure there was observed local plastic strain and it was
characterized by the presence of the creep strands (Fig. 8).
Basing on the microscopic observations along the straight
line, connecting notches on the 2nd specimen, there were found
surface irregularities similar to those found on the surface of the
1st specimen in the areas with the small strains.
On the one of surfaces of the 2nd specimen, near the bottom
of the notch, there was found singular set of creeping lines. These
lines intersected at an angle of 90 o (Fig. 9). They were also
bended down at an angle of about 45 o in the relation to the
direction of the shear loading.
Fig. 8. The creep strands in the grains of α phase on the surface
of the 2nd specimen in the initiation zone of failure. 200x magn.
Fig. 9. Creeping lines on the surface of the 2nd specimen.
200x magn.
There were also made observations of the fatigue cracking
area. On the crack surface of the 4th specimen there were found
fatigue stripes that were connected with the creep strands in the
grain (Fig.10). On the surface of the specimen, near the crack,
there were visible, beside the creep strands, the extrusions and
protusions. However just below the edge of the crack (in the
middle of the picture) on its surface there were found the fatigue
stripes.
Fig. 10. Microstructure of the fatigue crack and surface of the 4th
specimen (SEM)
A R C H I V E S o f F O U N D R Y E N G I N E E R I N G V o l u m e 9 , I s s u e 3 / 2 0 0 9 , 2 7 5 - 2 8 0 279
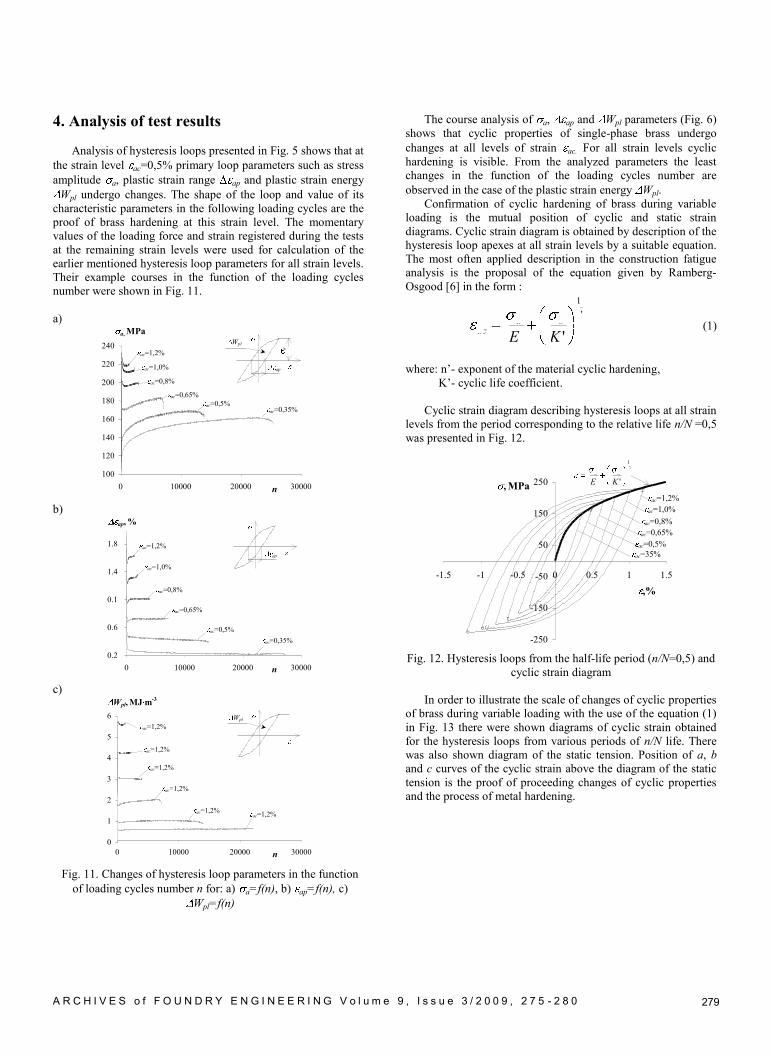
4. Analysis of test results
Analysis of hysteresis loops presented in Fig. 5 shows that at
the strain level ac=0,5% primary loop parameters such as stress
amplitude a, plastic strain range ap and plastic strain energy
Wpl undergo changes. The shape of the loop and value of its
characteristic parameters in the following loading cycles are the
proof of brass hardening at this strain level. The momentary
values of the loading force and strain registered during the tests
at the remaining strain levels were used for calculation of the
earlier mentioned hysteresis loop parameters for all strain levels.
Their example courses in the function of the loading cycles
number were shown in Fig. 11.
a)
100
120
140
160
180
200
220
240
0 10000 20000 30000
ap
a
Wpl
ac=0,35%
ac=1,2%
a, MPa
n
ac=0,8%
ac=0,65%
ac=0,5%
ac=1,0%
b)
0.2
0.6
0.1
1.4
1.8
0 10000 20000 30000
ap, %
ac=1,2%
ap
n
ac=1,0%
ac=0,8%
ac=0,65%
ac=0,35%
ac=0,5%
c)
0
1
2
3
4
5
6
0 10000 20000 30000
Wpl, MJ m-3
ac=1,2%
Wpl
n
ac=1,2%
ac=1,2%
ac=1,2%
ac=1,2% ac=1,2%
Fig. 11. Changes of hysteresis loop parameters in the function
of loading cycles number n for: a) a=f(n), b) ap=f(n), c)
Wpl=f(n)
The course analysis of a, ap and Wpl parameters (Fig. 6)
shows that cyclic properties of single-phase brass undergo
changes at all levels of strain ac. For all strain levels cyclic
hardening is visible. From the analyzed parameters the least
changes in the function of the loading cycles number are
observed in the case of the plastic strain energy Wpl.
Confirmation of cyclic hardening of brass during variable
loading is the mutual position of cyclic and static strain
diagrams. Cyclic strain diagram is obtained by description of the
hysteresis loop apexes at all strain levels by a suitable equation.
The most often applied description in the construction fatigue
analysis is the proposal of the equation given by Ramberg-
Osgood [6] in the form :
'
1
'
naa
acKE
(1)
where: n’- exponent of the material cyclic hardening,
K’- cyclic life coefficient.
Cyclic strain diagram describing hysteresis loops at all strain
levels from the period corresponding to the relative life n/N =0,5
was presented in Fig. 12.
-250
-150
-50
50
150
250
-1.5 -1 -0.5 0 0.5 1 1.5
, MPa
,%
ac=1,0%
ac=0,8%
ac=0,65%
ac=0,5%
ac=35%
ac=1,2%
'
1
'
naa
KE
Fig. 12. Hysteresis loops from the half-life period (n/N=0,5) and
cyclic strain diagram
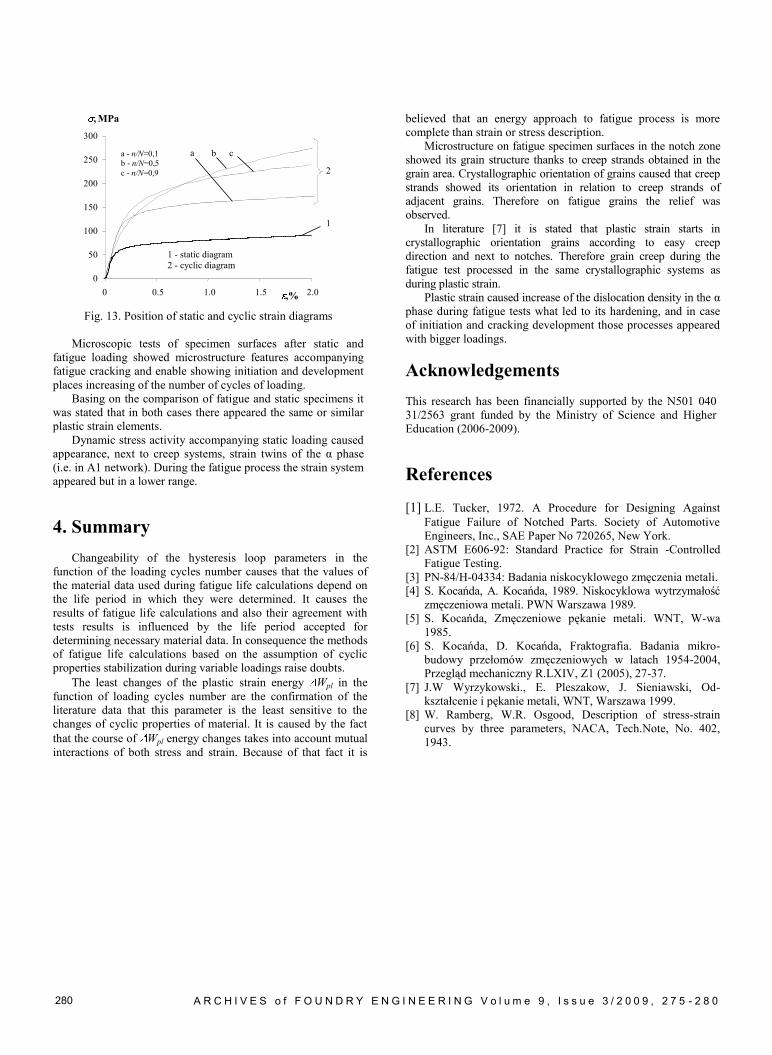
In order to illustrate the scale of changes of cyclic properties
of brass during variable loading with the use of the equation (1)
in Fig. 13 there were shown diagrams of cyclic strain obtained
for the hysteresis loops from various periods of n/N life. There
was also shown diagram of the static tension. Position of a, b
and c curves of the cyclic strain above the diagram of the static
tension is the proof of proceeding changes of cyclic properties
and the process of metal hardening.
A R C H I V E S o f F O U N D R Y E N G I N E E R I N G V o l u m e 9 , I s s u e 3 / 2 0 0 9 , 2 7 5 - 2 8 0 280
0
50
100
150
200
250
300
0 0.5 1.0 1.5 2.0
a - n/N=0,1
b - n/N=0,5
c - n/N=0,9
b c
1 - static diagram
2 - cyclic diagram
1
2
a
, MPa
,%
Fig. 13. Position of static and cyclic strain diagrams
Microscopic tests of specimen surfaces after static and
fatigue loading showed microstructure features accompanying
fatigue cracking and enable showing initiation and development
places increasing of the number of cycles of loading.
Basing on the comparison of fatigue and static specimens it
was stated that in both cases there appeared the same or similar
plastic strain elements.
Dynamic stress activity accompanying static loading caused
appearance, next to creep systems, strain twins of the α phase
(i.e. in A1 network). During the fatigue process the strain system
appeared but in a lower range.
4. Summary
Changeability of the hysteresis loop parameters in the
function of the loading cycles number causes that the values of
the material data used during fatigue life calculations depend on
the life period in which they were determined. It causes the
results of fatigue life calculations and also their agreement with
tests results is influenced by the life period accepted for
determining necessary material data. In consequence the methods
of fatigue life calculations based on the assumption of cyclic
properties stabilization during variable loadings raise doubts.
The least changes of the plastic strain energy Wpl in the
function of loading cycles number are the confirmation of the
literature data that this parameter is the least sensitive to the
changes of cyclic properties of material. It is caused by the fact
that the course of Wpl energy changes takes into account mutual
interactions of both stress and strain. Because of that fact it is
believed that an energy approach to fatigue process is more
complete than strain or stress description.
Microstructure on fatigue specimen surfaces in the notch zone
showed its grain structure thanks to creep strands obtained in the
grain area. Crystallographic orientation of grains caused that creep
strands showed its orientation in relation to creep strands of
adjacent grains. Therefore on fatigue grains the relief was
observed.
In literature [7] it is stated that plastic strain starts in
crystallographic orientation grains according to easy creep
direction and next to notches. Therefore grain creep during the
fatigue test processed in the same crystallographic systems as
during plastic strain.
Plastic strain caused increase of the dislocation density in the α
phase during fatigue tests what led to its hardening, and in case
of initiation and cracking development those processes appeared
with bigger loadings.
Acknowledgements
This research has been financially supported by the N501 040
31/2563 grant funded by the Ministry of Science and Higher
Education (2006-2009).
References
[1] L.E. Tucker, 1972. A Procedure for Designing Against
Fatigue Failure of Notched Parts. Society of Automotive
Engineers, Inc., SAE Paper No 720265, New York.
[2] ASTM E606-92: Standard Practice for Strain -Controlled
Fatigue Testing.
[3] PN-84/H-04334: Badania niskocyklowego zmęczenia metali.
[4] S. Kocańda, A. Kocańda, 1989. Niskocyklowa wytrzymałość
zmęczeniowa metali. PWN Warszawa 1989.
[5] S. Kocańda, Zmęczeniowe pękanie metali. WNT, W-wa
1985.
[6] S. Kocańda, D. Kocańda, Fraktografia. Badania mikro-
budowy przełomów zmęczeniowych w latach 1954-2004,
Przegląd mechaniczny R.LXIV, Z1 (2005), 27-37.
[7] J.W Wyrzykowski., E. Pleszakow, J. Sieniawski, Od-
kształcenie i pękanie metali, WNT, Warszawa 1999.
[8] W. Ramberg, W.R. Osgood, Description of stress-strain
curves by three parameters, NACA, Tech.Note, No. 402,
1943.