Fatigue Damage Analysis of an Elastomeric Tank Track Component · Fatigue Damage Analysis of an...
14
2012 SIMULIA Community Conference 1 Fatigue Damage Analysis of an Elastomeric Tank Track Component William V. Mars Endurica LLC David Ostberg U.S. Army TARDEC Abstract: The backerpad on the Abrams tank track system is an elastomeric cushion that protects the track and has direct contact with the tank’s wheels. The backerpad’s service life is limited by harsh operating conditions, and system designers are challenged to extend that limit. Accordingly, an analysis is demonstrated here of an experimental backerpad’s fatigue performance under the action of a tank roadwheel repeatedly rolling over the pad. First, the elastomer is characterized via tests that define its fatigue behavior. Next, the multiaxial, variable amplitude duty cycle of the pad through a representative rollover event is computed in ABAQUS/Explicit. Finally, the material characterization and duty cycle are analyzed via the fe-safe/Rubber fatigue life solver to estimate damage accumulation in each finite element of the model. The calculation identifies the location and number of duty cycle repeats associated with the first appearance of 1 mm cracks for the selected duty cycle, providing an example of how fatigue analysis may be applied to understand damage development in elastomeric components. Keywords: Damage, Fatigue, Elastomer, Material Characterization, Postprocessing UNCLASSIFIED: Distribution Statement A. Approved for public release. **Disclaimer: Reference herein to any specific commercial company, product, process, or service by trade name, trademark, manufacturer, or otherwise, does not necessarily constitute or imply its endorsement, recommendation, or favoring by the United States Government or the Department of the Army (DoA). The opinions of the authors expressed herein do not necessarily state or reflect those of the United States Government or the DoA, and shall not be used for advertising or product endorsement purposes.** 1. Introduction The backerpad on the Abrams tank track system is an elastomeric cushion and has repeated, load- bearing contact with the tank’s wheels during operation. The backerpad’s service life is limited by these harsh operating conditions, and system designers are challenged to extend that limit. We demonstrate here how fatigue analysis technology developed by Endurica, and available now in
Transcript of Fatigue Damage Analysis of an Elastomeric Tank Track Component · Fatigue Damage Analysis of an...

2012 SIMULIA Community Conference 1
Fatigue Damage Analysis of an Elastomeric Tank Track Component
William V. Mars
Endurica LLC
David Ostberg
U.S. Army TARDEC
Abstract: The backerpad on the Abrams tank track system is an elastomeric cushion that protects
the track and has direct contact with the tank’s wheels. The backerpad’s service life is limited by
harsh operating conditions, and system designers are challenged to extend that limit. Accordingly,
an analysis is demonstrated here of an experimental backerpad’s fatigue performance under the
action of a tank roadwheel repeatedly rolling over the pad. First, the elastomer is characterized
via tests that define its fatigue behavior. Next, the multiaxial, variable amplitude duty cycle of the
pad through a representative rollover event is computed in ABAQUS/Explicit. Finally, the
material characterization and duty cycle are analyzed via the fe-safe/Rubber fatigue life solver to
estimate damage accumulation in each finite element of the model. The calculation identifies the
location and number of duty cycle repeats associated with the first appearance of 1 mm cracks for
the selected duty cycle, providing an example of how fatigue analysis may be applied to
understand damage development in elastomeric components.
Keywords: Damage, Fatigue, Elastomer, Material Characterization, Postprocessing
UNCLASSIFIED: Distribution Statement A. Approved for public release.
**Disclaimer: Reference herein to any specific commercial company, product, process, or service
by trade name, trademark, manufacturer, or otherwise, does not necessarily constitute or imply its
endorsement, recommendation, or favoring by the United States Government or the Department of
the Army (DoA). The opinions of the authors expressed herein do not necessarily state or reflect
those of the United States Government or the DoA, and shall not be used for advertising or
product endorsement purposes.**
1. Introduction
The backerpad on the Abrams tank track system is an elastomeric cushion and has repeated, load-
bearing contact with the tank’s wheels during operation. The backerpad’s service life is limited by
these harsh operating conditions, and system designers are challenged to extend that limit. We
demonstrate here how fatigue analysis technology developed by Endurica, and available now in

2 2012 SIMULIA Community Conference
the fe-safe/Rubber module, has been applied to analyze the fatigue lifetime of an experimental
backer pad under the action of a tank road wheel rolling over the pad.
2. Materials Characterization
The backer pad material consists of a custom-formulated, carbon-black filled, Styrene-Butadiene
(SBR) elastomer. As a preliminary to analysis, it is necessary to establish parameters that describe
the material’s nonlinearly elastic stress-strain response, as well as its fatigue behavior.
2.1 Stress-Strain Behavior
For purposes of the present analysis, a 2-term Ogden hyperelastic law has been selected to
represent the rubber’s stress-strain behavior on first extension (i.e. the primary stress-strain curve),
and the Ogden-Roxburgh (Ogden and Roxburgh 1999, Mars 2004) law has been selected to soften
the rubber’s primary stress-strain response as a representation of the Mullins effect. The relevant
theories are described fully in the ABAQUS theory manual (section 4.6 and 4.7), and these are not
repeated here. The fit of the resulting stress-strain model is shown in Figure 1 for three typical
modes of straining: simple tension, planar tension, and equibiaxial tension. An accurate
representation was achieved for all modes of deformation at all strain levels characterized. The
material model parameters derived from the fitting process are summarized in Table 1.
0
0.5
1
1.5
2
2.5
3
3.5
0 0.2 0.4 0.6 0.8 1
ST, fit
ST, Experiment
PT, Experiment
PT, fit
EB, Experiment
EB, fit
Figure 1. Cyclic softened stress-strain curves compared with experimental measurements.
Table 1. Stress-strain model parameters for the backer pad.
MU1=2.275319 ! MPa
MU2=0.054452 ! MPa
ALPHA1=-1.00837
ALPHA2=7.863497
MULLINSR=6.641545796

2012 SIMULIA Community Conference 3
MULLINSM=0.558478587 ! MPa
MULLINSBETA=0.029639767
BULK_MODULUS=140.7 ! MPa
2.2 Fatigue Behavior
The fatigue behavior of the backerpad material was characterized through crack growth
experiments run at Axel Products, Inc using the edge-cracked pure shear test piece. Results from a
typical experiment are shown in Figure 2. A scheme due to Lake and Lindley (1964) has been
employed to represent the data, and the fit is also shown in the Figure. The associated material
parameters are summarized in Table 2. These experiments were run under fully relaxing
conditions (R = Tmin/Tmax = 0). The fitted crack growth behavior has been computed both for
fully relaxing conditions (R = 0), and for two nonrelaxing conditions (R=0.1 and R=0.2). Little
effect of R ratio is predicted, consistent with expectations for an elastomer that does not strain-
crystallize (Mars 2009, Mars and Fatemi 2003). The duration of the fatigue test was only
sufficient to accurately resolve crack growth rates down to approximately 2 x 10⁻⁷ m / cyc. It has
been assumed here that the crack growth rate follows a powerlaw until the crack driving force
drops below the Transition and Threshold values. Here, we have adoped Lake and Lindley’s
observation that the Threshold is approximately 50 J/m2. Below the threshold, zero crack growth
is assumed. Above the threshold, the crack growth rate follows
0F
c
cT
Trr
(1)
Where r is the rate of crack growth, T is the crack driving force, and rc, Tc, and F0 are material
parameters.
1.E-10
1.E-09
1.E-08
1.E-07
1.E-06
1.E-05
1.E+01 1.E+02 1.E+03 1.E+04
Cra
ck
Gro
wth
Ra
te,
m/c
yc
Crack Driving Force, J/m^2
Test Data
Endurica, R = 0
Endurica, R = 0.1
Endurica, R = 0.2
Figure 2. Comparison of Endurica-computed fatigue crack growth law with experimental data.

4 2012 SIMULIA Community Conference
Table 2. Material parameters for the backer pad in Endurica.
TCRITICAL=10e3 ! J/m^2
THRESHOLD=50 ! J/m^2
TRANSITION=150 ! J/m^2
RC=3.42E-5 ! m/cyc
F0=2
In addition to the fatigue crack growth rate law, Endurica’s fatigue analysis requires an estimate of
the size of the typical crack precursor that exists in this material prior to any damage
accumulation. The crack precursor size depends on the microstructure of the polymer/filler
system, as well as on manufacturing influences. The size was inferred from a known result, that
the fatigue life at 50% strain in simple tension for the subject material is roughly 30k cycles
(Brown et al 2010). Calibration curves were computed with the Endurica fatigue solver, showing
how the fatigue life depends on the precursor size for each of 5 different strain levels under simple
tension cyclic loading. The calibration curves are shown in Figure 3. The known point is plotted
on the curve for 50% strain. These results imply a precursor size of 15.7 x 10⁻⁶
m, and this size
has been used in our analysis.
1.E+00
1.E+01
1.E+02
1.E+03
1.E+04
1.E+05
1.E+06
1.E+07
1.E+08
1.E-06 1.E-05 1.E-04 1.E-03
Lif
e, c
yc
les
Flaw Size, m
25%
50%
100%
150%
200%
Calibration Point
Figure 3. Computed flaw size calibration curves, at various strain levels in simple tension. A point is plotted at the intersection of Nf = 30 x 10
3 with the calibration
curve for 50% strain, implying a flaw size of 15.7 x 10⁻⁶
m.
2012 SIMULIA Community Conference 5
3. Finite Element Analysis
In order to make an analysis with the Endurica fatigue solver, it is necessary to estimate the time-
domain strain history occurring within each element of the finite element model. In this section,
we describe the model, analysis steps, and provide an example of typical strain history recovered
for fatigue analysis. This modeling effort is a continuation of a two dimensional idealization
which was validated with test data of the T158LL track system used on the Abrams M1A2
Vehicle (Ostberg and Bradford 2009).
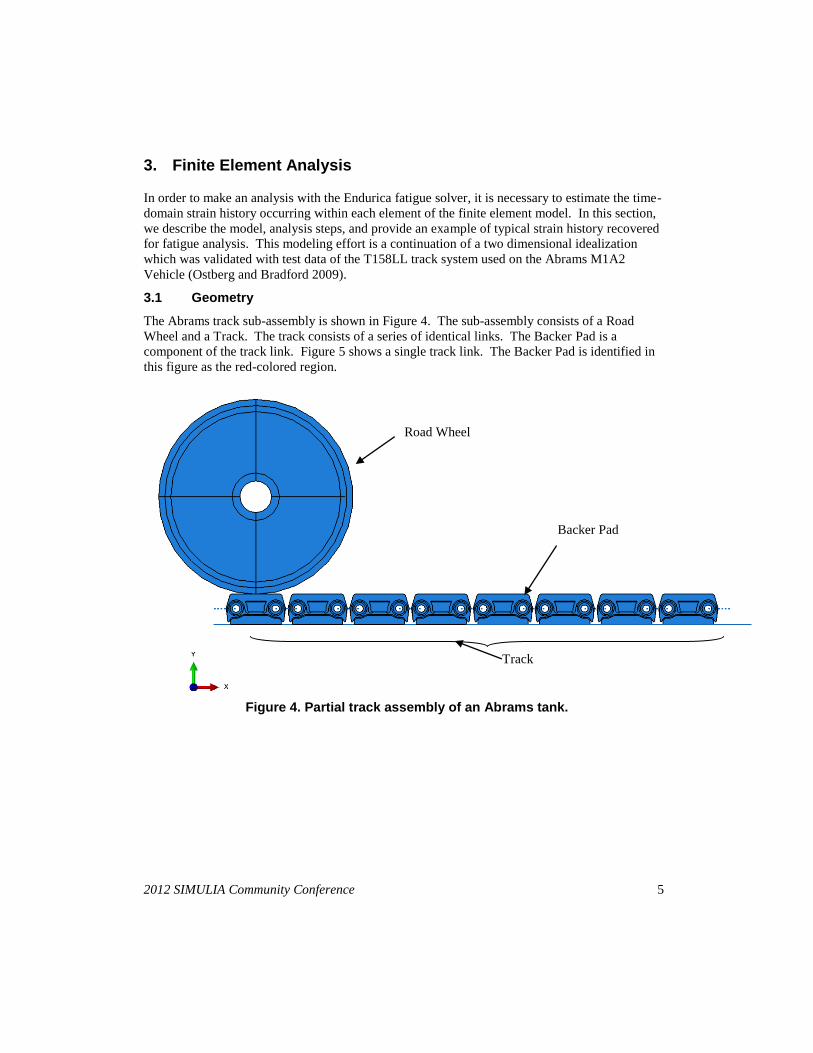
3.1 Geometry
The Abrams track sub-assembly is shown in Figure 4. The sub-assembly consists of a Road
Wheel and a Track. The track consists of a series of identical links. The Backer Pad is a
component of the track link. Figure 5 shows a single track link. The Backer Pad is identified in
this figure as the red-colored region.
Figure 4. Partial track assembly of an Abrams tank.
Road Wheel
Track
Backer Pad

6 2012 SIMULIA Community Conference
Figure 5. Cross sectional view of a track link, shown without the ground pad. The Backer Pad is shown in red.
3.2 Boundary conditions
For purposes of this analysis, the track assembly is assumed to be resting on flat ground, which
has been represented as a rigid analytical surface. The rigid surface is constrained in all (three
rotational and three translation) degrees of freedom (see figure 6).
In this simulation, only a portion of the track is modeled. It is assumed that this portion of the
track has no slack due to the loading. Also, it is assumed that the ground pad (which is in contact
with the ground) has its vertical degree of freedom constrained in the vertical direction. The
vertical direction in this model is represented by the y-axis. Figure 7 shows the constraint applied
on all ground pads used in the model. The links between track pad sub-assemblies are represented
via solid beams.
Figure 6. Applied boundary condition that represents flat, non-movable ground.

2012 SIMULIA Community Conference 7
Figure 7. Applied boundary condition for the ground pads in contact with the ground surface.
Figure 8. Applied boundary conditions for modeling track tension.
To tension the track assembly, the left end of the partial assembly was kept fixed while at the other
end, a load of 5000 lbf in the negative x-direction was applied. The load and the constraints were

8 2012 SIMULIA Community Conference
applied on the reference points of connection beams as shown in Figure 8. Also, the rotational
degrees of freedom were constrained for the left end of the partial track assembly (In figure 5, the
left end is indicated by RP1).
The dynamic load experienced by the track assembly was simulated by applying 8000 lbf load to
the Road Wheel spindle, and by applying a linear velocity of 771 inch/second (i.e. corresponding
to a road wheel rotation rate of 10 revolutions per second). The angular velocity of 62.8 rad/sec
(i.e 10 revolution/sec) was also applied to the Roadwheel in order to simulate rotation of the
wheel. The spindle of the Roadwheel was created by creating a reference point on the center of the
wheel, and by creating a kinematic link between the reference point and surrounding nodes of the
Roadwheel. See figure 9 below for the location of the reference point and the kinematic coupling.
Figure 9. Location of reference point and kinematic coupling through which spindle of the Roadwheel was created.
3.3 Computed Strain History
In Figure 10, contours of maximum principal strain are plotted on the third Backer Pad at different
times as the rolling Road Wheel loads the BackerPad. It can be seen that at time t=2.0018 seconds,
the road wheel deforms the backer pad fully, causing the maximum deformation on the top of the
left beam joint. The beam joint is protected by much the stiffer steel plate on which the backer pad
rubber is situated. As the backer pad material is softer than steel material it undergoes higher
deformation. Also, it is important to note here that as the road wheel is rolling at higher speed, the
backer pad material also deforms in combined shear and compression. The shearing effect can be

2012 SIMULIA Community Conference 9
observed at the left side of the backer pad which is slightly at an angle when not deformed while,
under full deformation the same side is curved and moves drastically on the left.
Additionally, the deformation shown in Figure 10 represents a highly dynamic wheel which is
bouncing along the length of the track. It should be noted the duty cycle corresponding to the
actual deformation experienced in the field has yet to be determined.
Figure 10. Maximum principal strain contour plot on representative backer pad (3rd in row) at different times.
For illustrative purposes, Figure 11 displays the strain history recovered from the element with the
shortest fatigue life. The strain history exhibits a complex dependence of the 3 strain components
with time. The 22 component of the strain shows a single major compression event at time 2.018,
with a corresponding coupled response in the 11 component. The shear response shows a number

10 2012 SIMULIA Community Conference
of positive and negative deformations during the considered duty cycle. The challenge, then, for
the fatigue analysis is how to estimate the cumulative effects of these applied strain histories.
Figure 11. History of nominal strain components during backerpad rollover event, at point of shortest life.
4. Fatigue Analysis
4.1 Analysis Scheme
The number of cycles Nf required to grow a flaw on some particular potential failure plane from its
initial size a0 to its final size af may then be computed via integration of the fatigue crack growth
rate law f(T), as follows:
fa
af da
taTfN
0 )),((
1 (2)
The Endurica fatigue solver repeats this calculation for a series of candidate failure planes. The
failure plane is then selected as the one that minimizes Nf. The calculation scheme is outlined in
Figure 12. The process is repeated for each element in the finite element model.

2012 SIMULIA Community Conference
11
For every material point
For every plane
Loading History on plane
Identification of Events via
Rainflow count
Integration of damage law
Identification of material point and plane with
minimum life
Figure 12. Calculation scheme for simulation of fatigue life and identification of plane of crack nucleation.
4.2 Results
The computed fatigue life distribution in the backer pad is shown in Figure 13. The most
damaged point in the backer pad is shown in red. The life calculation also predicts the plane on
which cracks will first initiate. In the case considered, the orientation of the weakest plane at the
weakest point is shown with the plane’s unit normal vector, which is drawn at 47.36 degrees. It
appears that there are a number of points in the backer pad which experience damage levels
similar to the point of minimum life. This implies that many crack precursors would be expected
to develop simultaneously. These occur both within the bulk of the component, and on the
external surface. The locations that accumulate damage are very likely to depend strongly on the
details of how the road wheel impacts the backer pad. Here, we have simulated one specific event
type lasting only 0.06 sec. Eventually, a larger number of cases will need to be considered to
better understand backer pad failure modes.

12 2012 SIMULIA Community Conference
Figure 13. Backer Pad fatigue damage distribution. Contours are colored according to the base 10 logarithm of fatigue life. The predicted failure plane
orientation at the point of minimum life is sketched.
Figure 14 shows the evolution of typical damage in the backerpad. In a way that is strikingly
reminiscent of our calculation, surface cracking first becomes visible in the backer pad above the
steel sleeve. Also, as expected, cracking develops simultaneously at a number of initiation points.
Here, for demonstration purposes, we have considered one particular duty cycle out of a large set
of possible scenarios.
Although there certainly remains much more to do with analysis of the backer pad, it is already
clear that the Endurica fatigue solver embodies problem physics sufficiently to bring new insights
to the analysis and design of more durable track systems.

2012 SIMULIA Community Conference
13
Figure 14. Evolution of fatigue damage during backer pad operation. Note location of initial damage at 500 miles.
5. References
1. Lake, G. J., Lindley P. B., Journal of Applied Polymer Science 8, 707, 1964.
2. Mars W. V., Cracking Energy Density as a predictor of fatigue life under multiaxial
conditions, Rubber Chemistry and Technology, vol. 75, pp. 1-18, 2002
3. Ogden, R. W., Roxburgh, D. G., "A pseudo-elastic model for the Mullins effect in filled
rubber," Proceedings of the Royal Society of London, A, Vol. 455, pp. 2861-2877, 1999.
4. Mars W. V., Evaluation of a Pseudo-Elastic Model for the Mullins Effect, Tire Science and
Technology, Vol. 32, No. 3, pp. 120-145, 2004.
5. Mars WV, Fatemi A, 2003, "A phenomenological model for the effect of R ratio on fatigue of
strain-crystallizing rubbers", Rubber Chem. Tech., Vol 76, No. 5.
6. Mars WV, Rubber Chem. Technol. 82, 51 (2009). (computed dependence on strain cryst)
7. H.R. Brown, J.L. Bouvard, D. Oglesby, E. Marin, D. Francis, A. Antonyraj, H. Toghiani, P.
Wang, M.F. Horstemeyer, M.P. Castanier, 2010 NDIA GROUND VEHICLE SYSTEMS
ENGINEERING AND TECHNOLOGY SYMPOSIUM MODELING & SIMULATION,
TESTING AND VALIDATION (MSTV) MINI-SYMPOSIUM, AUGUST 17-19
DEARBORN, MICHIGAN.
8. D. Ostberg and B. Bradford, “Impact of Loading Distribution of Abrams Suspension on Track
Performance and Durability”, Proceedings of the 2009 Ground Vehicle Systems Engineering
and Technology Symposium.

14 2012 SIMULIA Community Conference
6. Acknowledgement and Disclaimer
This work was completed with financial support from the U. S. Army under Phase I SBIR contract
W56HZV-10-C-0201 and with technical support from the U.S. Army TARDEC Elastomer
Improvement Program. The authors would like to acknowledge helpful input from Bill Bradford
and Matt Castanier.