PROBABLE FATIGUE LIFE OF PRESTRESSED ... - Lehigh University
Construction and Building Materials 106 (2016) 198–208
Contents lists available at ScienceDirect
Construction and Building Materials
journal homepage: www.elsevier .com/locate /conbui ldmat
Fatigue behavior of corroded prestressed concrete beams
http://dx.doi.org/10.1016/j.conbuildmat.2015.12.1190950-0618/� 2015 Elsevier Ltd. All rights reserved.
⇑ Corresponding author.E-mail addresses: [email protected] (W. Zhang), [email protected]
(X. Liu), [email protected] (X. Gu).
Weiping Zhang, Xiguang Liu, Xianglin Gu ⇑Department of Structural Engineering, Tongji University, 1239 Siping Road, Shanghai 200092, PR China
h i g h l i g h t s
� Fatigue tests were conducted on corroded prestressed concrete beams.� The 3D geometric models of corroded wires or rebars were obtained.� Fatigue failure mechanism of corroded prestressed concrete beams was revealed.� Longitudinal variation of the cross-sectional area had a significant influence on fatigue behavior of corroded beams.
a r t i c l e i n f o
Article history:Received 10 April 2015Received in revised form 17 November 2015Accepted 16 December 2015
Keywords:Prestressed concrete beamCorrosionFatigueFracture
a b s t r a c t
This paper presents the results of an experimental study on the fatigue behavior of pretensioned partiallyprestressed concrete beams with corroded prestressing wires or rebars. A three-dimensional laser scan-ning technique was employed to obtain the geometric models of corroded prestressing wires or rebars. Itwas observed that fatigue cracks initiated and propagated rapidly around corrosion pits under cyclicloading. The cyclic loading led to fatigue fracturing of the prestressing wires (rebars) at the minimumcross-section where the corrosion pits had formed. With the increased corrosion of the prestressingwires, the sooner fracture of the first wire and the shorter interval between the failures of the two wiresin the test beam were found, resulting in a shorter fatigue life of the beam. A higher partially prestressedratio or load range brought a larger stress level, stress range, and thus a shorter fatigue life of corrodedbeams. Compared with the uncorroded beam, it was also found that the corroded beams exhibited a fas-ter stiffness degradation and development of deflections and crack widths under cyclic loading.
� 2015 Elsevier Ltd. All rights reserved.
1. Introduction
Corrosion of prestressing steel is one of the primary reasons inthe deterioration of prestressed concrete structures. Prestressingsteel experiences a continuous applied stress level of about 55–65% of its ultimate tensile strength throughout its life [1,2], andcorrosion-initiated loss in cross-sectional area often results in localyielding and fracture. Fracture of prestressing steel may lead tobrittle failure of structural members and even catastrophic failureof entire bridges, as seen in the sudden collapse of the Ynys-y-Gwas Bridge [3]. Costly rehabilitation of such deteriorated struc-tures is necessary to prevent further damage. It has been reportedthat one in nine bridges in the United States are rated as struc-turally deficient, and an annual investment of 20.5 billion US dol-lars is needed to repair them [4].
Much research has been focused on the static flexural behaviorof prestressed concrete beams with corroded prestressing steel.Corroded prestressing steel always fails at the minimum cross-sectional area in tensile tests with significant degradation indeformability and load capacity [5–7]. Bond deterioration betweencorroded prestressing strands and concrete has also been found inpull-out tests [8]. Static test results have indicated a notable reduc-tion in deformation and load capacity, as well as a premature brit-tle failure mode of corroded prestressed concrete beams [9–14].Randomly distributed corrosion pits were found along the lengthof a steel bar, and the difference between the minimum and aver-age cross-sectional area were observed to increase with theincrease of corrosion [15]. Further observations determined thatcorroded prestressed concrete beams may fail at cross-sectionsthat have not been subjected to the maximum moment, causingthe failure probability in both strength and serviceability to beincreased [16].
Prestressed concrete bridges are also subjected to fatigue load-ing during their service life, and the cyclic variation in stress of thebottom prestressing steel in bridge girders is generated by traffic
W. Zhang et al. / Construction and Building Materials 106 (2016) 198–208 199
loading at a relatively high frequency. High-cycle tension fatiguetests of corroded rebars showed that fatigue behavior is more sen-sitive to corrosion than static tensile behavior, and that fatigue lifedecreases significantly due to corrosion [17]. Corroded bridgecables from both aged bridges and an accelerated corrosion processwere tested by high-cycle fatigue loading, fatigue cracks initiatedaround corrosion pits due to stress concentration and fatigue lifedecreased notably [18,19]. Corroded reinforced concrete beamsunder fatigue loading exhibited a brittle failure, and their flexuralstiffness and fatigue life decreased with the increase of corrosiondegree [20–22]. Prestressed concrete girders are widely used inbridges with a higher stress level, but few fatigue tests have beenconducted on corroded prestressed concrete beams.
This paper presents an experimental investigation on the fati-gue behavior of corroded prestressed concrete beams. Thirteenpretensioned partially prestressed concrete beams corrodedthrough the impressed current method were considered. Both sta-tic and fatigue tests were conducted with corroded and uncorrodedbeams. The effects of corrosion degree of prestressing wires orrebars, the partial prestressing ratio (PPR), and the load range onfatigue behavior of corroded beams were also analyzed and dis-cussed. After failure of the corroded beams under cyclic loading,the corroded prestressing wires or rebars were taken out fromthe beams, and scanned by a three-dimensional laser scanner.The 3D geometric models were obtained to analyze the influenceof longitudinal variation of the cross-sectional areas on fatiguebehavior of corroded beams. The scanning electron microscope(SEM) was used to perform a fractography analysis of the fracturedsurfaces.
2. Experimental program
2.1. Specimens design and fabrication
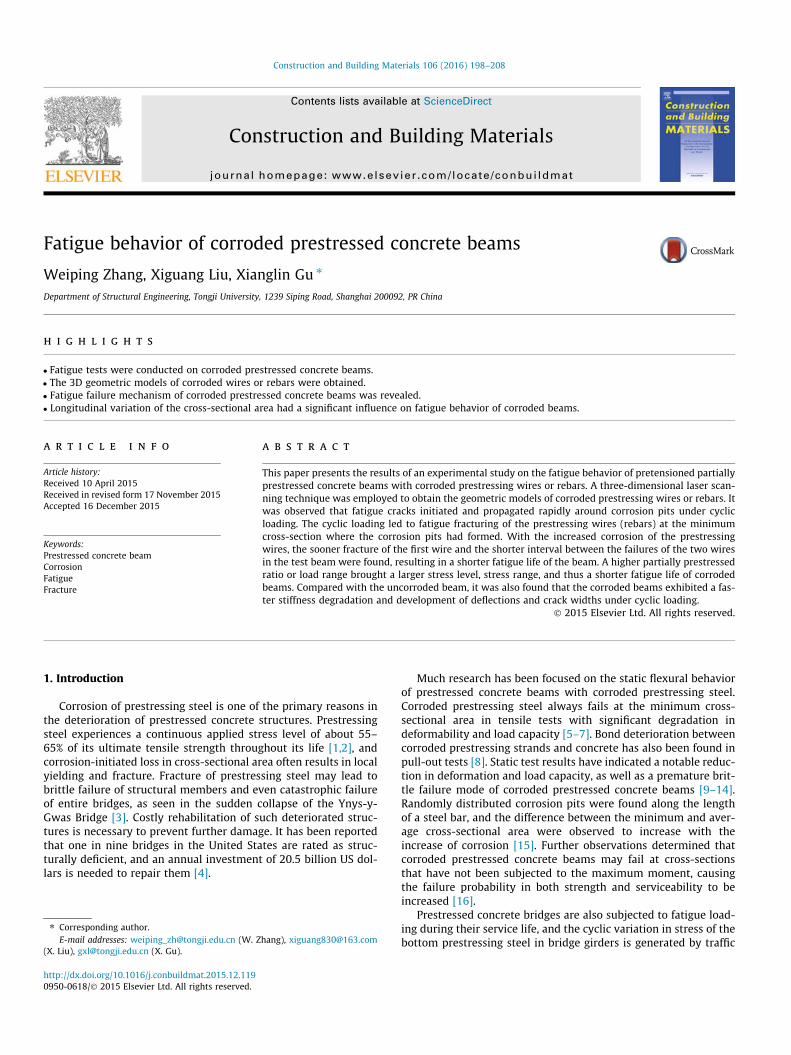
The experimental program consisted of testing 13 pretensioned partially pre-stressed concrete beams. All beams were of the same size with a cross section of150 � 300 mm and a length of 2700 mm. Beam dimensions and cross-sectiondetails are shown in Fig. 1. All beams were simply supported with a span of2400 mm and loaded at two symmetrical third-point loads.
Three uncorroded beams were tested under static loading to obtain the ultimateload capacity, which were used to determine the minimum and maximum loads offatigue tests. One uncorroded and nine corroded beams were tested under cyclicloading at a constant load range. The test variables included the corrosion degreeof prestressing wires or nonprestressed longitudinal rebars, PPR and load range.The PPR is defined as follows:
PPR ¼ ðMuÞpðMuÞpþs
ð1Þ
where ðMuÞp is the ultimate moment contributed by the prestressing wires andðMuÞpþs is the ultimate moment contributed by both prestressing wires and tensionrebars.
Fig. 1. Beam dimensions an
Gravimetric mass loss was used to quantify corrosion degrees for the conve-nience of engineering applications. Four target corrosion degrees of prestressingwires, three target corrosion degrees of nonprestressed tension rebars and threelevels of PPR were considered, as shown in Table 1. The load ranges were 30%,45% or 50% of the ultimate load capacity of the uncorroded control beams testedunder static loading, where the same minimum load was equal to 10% of the ulti-mate load capacity. Thus, the maximum loads were 40%, 55% or 60% of the ultimateload capacity, similar to service load in engineering practices.
Two 7-mm-diameter low-relaxation prestressing wires ran straight through allthe beams. The nonprestressed longitudinal rebars consisted of two hot rolledribbed bars with a nominal diameter of 12, 14, or 16 mm, respectively. Furthermore,two hot rolled ribbed bars with a diameter of 10 mm were used as compressionsteel. Bottom and side cover thickness was 25 mm. A diameter of 10 mm plain stir-rups spaced at 100 mm in the shear zone and 200 mm in the flexural zone wereused as shear reinforcement so that the beams were expected to fail in the flexuralmode. Additional chuck anchors for individual prestressing wires near the ends ofthe beams were placed to reduce the slip between prestressing wires and concrete.Confining reinforcements in the form of spirals were placed in the concrete directlybehind the anchors, as shown in Fig. 1. Mechanical properties of prestressing wiresand steel bars were tested, and the results are given in Table 2. The concrete wasdesigned for a 28-day nominal cubic compressive strength of 40 MPa. The cement,water, aggregate and sand proportions by weight were: 1:0.36:2.87:1.48.
Beams were made in several batches using a specially designed steel formwork,which can be used to pretension prestressing wires. Each prestressing wire was pre-tensioned individually up to 75% of its nominal ultimate tensile strength. Straingauges were used to monitor the variation of wire strains during the whole processof pretensioning and releasing. Approximately 24 h after pretensioning, the con-crete were cast. Cubic concrete blocks in 150 � 150 � 150 mm and prism concreteblocks in 150 � 150 � 300 mm were cast using the same concrete as that in thebeams. The cast beams and concrete blocks were wet-cured under the same condi-tion. Cubic concrete blocks were used to obtain the compressive strength of theconcrete at release and after 28 days for each set of beams. The compressivestrength and modulus of elasticity of concrete in each individual beam at the timeof testing were determined from the prism concrete blocks, as shown in Table 3.The pretensioned wires were released after the concrete strength had reached atleast 85% of its designed strength from cubic blocks tests. The release of the pre-stressing wires was accompanied by cutting the wires with an oxygen torch. Theeffective stress in the prestressing wires after releasing was around 57–72% ofthe nominal ultimate tensile strength, as shown in Table 1.
2.2. Accelerated corrosion process
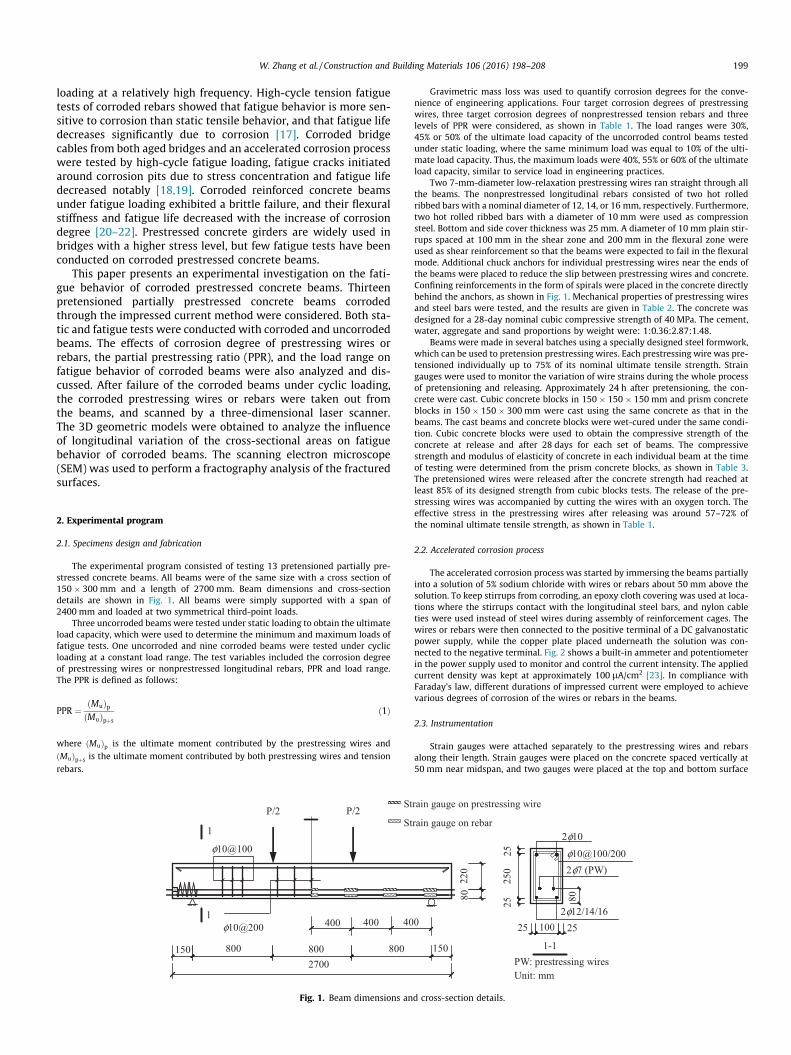
The accelerated corrosion process was started by immersing the beams partiallyinto a solution of 5% sodium chloride with wires or rebars about 50 mm above thesolution. To keep stirrups from corroding, an epoxy cloth covering was used at loca-tions where the stirrups contact with the longitudinal steel bars, and nylon cableties were used instead of steel wires during assembly of reinforcement cages. Thewires or rebars were then connected to the positive terminal of a DC galvanostaticpower supply, while the copper plate placed underneath the solution was con-nected to the negative terminal. Fig. 2 shows a built-in ammeter and potentiometerin the power supply used to monitor and control the current intensity. The appliedcurrent density was kept at approximately 100 lA/cm2 [23]. In compliance withFaraday’s law, different durations of impressed current were employed to achievevarious degrees of corrosion of the wires or rebars in the beams.
2.3. Instrumentation
Strain gauges were attached separately to the prestressing wires and rebarsalong their length. Strain gauges were placed on the concrete spaced vertically at50 mm near midspan, and two gauges were placed at the top and bottom surface
d cross-section details.
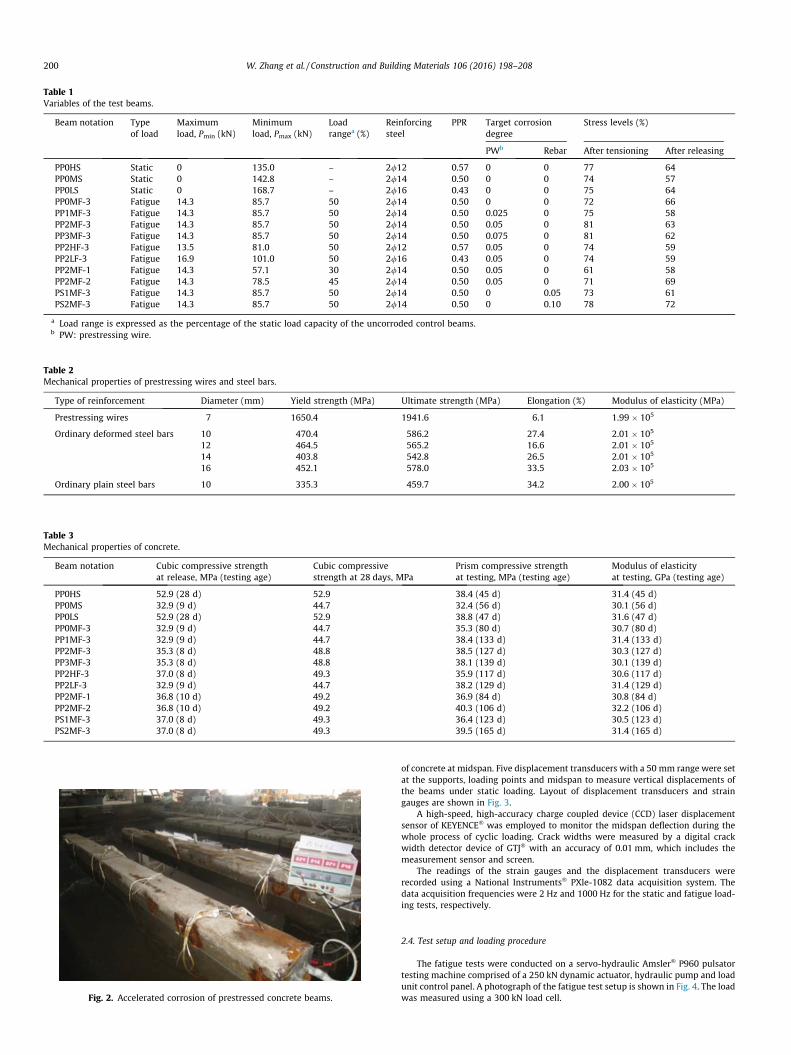
Table 1Variables of the test beams.
Beam notation Typeof load
Maximumload, Pmin (kN)
Minimumload, Pmax (kN)
Loadrangea (%)
Reinforcingsteel
PPR Target corrosiondegree
Stress levels (%)
PWb Rebar After tensioning After releasing
PP0HS Static 0 135.0 – 2/12 0.57 0 0 77 64PP0MS Static 0 142.8 – 2/14 0.50 0 0 74 57PP0LS Static 0 168.7 – 2/16 0.43 0 0 75 64PP0MF-3 Fatigue 14.3 85.7 50 2/14 0.50 0 0 72 66PP1MF-3 Fatigue 14.3 85.7 50 2/14 0.50 0.025 0 75 58PP2MF-3 Fatigue 14.3 85.7 50 2/14 0.50 0.05 0 81 63PP3MF-3 Fatigue 14.3 85.7 50 2/14 0.50 0.075 0 81 62PP2HF-3 Fatigue 13.5 81.0 50 2/12 0.57 0.05 0 74 59PP2LF-3 Fatigue 16.9 101.0 50 2/16 0.43 0.05 0 74 59PP2MF-1 Fatigue 14.3 57.1 30 2/14 0.50 0.05 0 61 58PP2MF-2 Fatigue 14.3 78.5 45 2/14 0.50 0.05 0 71 69PS1MF-3 Fatigue 14.3 85.7 50 2/14 0.50 0 0.05 73 61PS2MF-3 Fatigue 14.3 85.7 50 2/14 0.50 0 0.10 78 72
a Load range is expressed as the percentage of the static load capacity of the uncorroded control beams.b PW: prestressing wire.
Table 2Mechanical properties of prestressing wires and steel bars.
Type of reinforcement Diameter (mm) Yield strength (MPa) Ultimate strength (MPa) Elongation (%) Modulus of elasticity (MPa)
Prestressing wires 7 1650.4 1941.6 6.1 1.99 � 105
Ordinary deformed steel bars 10 470.4 586.2 27.4 2.01 � 105
12 464.5 565.2 16.6 2.01 � 105
14 403.8 542.8 26.5 2.01 � 105
16 452.1 578.0 33.5 2.03 � 105
Ordinary plain steel bars 10 335.3 459.7 34.2 2.00 � 105
Table 3Mechanical properties of concrete.
Beam notation Cubic compressive strengthat release, MPa (testing age)
Cubic compressivestrength at 28 days, MPa
Prism compressive strengthat testing, MPa (testing age)
Modulus of elasticityat testing, GPa (testing age)
PP0HS 52.9 (28 d) 52.9 38.4 (45 d) 31.4 (45 d)PP0MS 32.9 (9 d) 44.7 32.4 (56 d) 30.1 (56 d)PP0LS 52.9 (28 d) 52.9 38.8 (47 d) 31.6 (47 d)PP0MF-3 32.9 (9 d) 44.7 35.3 (80 d) 30.7 (80 d)PP1MF-3 32.9 (9 d) 44.7 38.4 (133 d) 31.4 (133 d)PP2MF-3 35.3 (8 d) 48.8 38.5 (127 d) 30.3 (127 d)PP3MF-3 35.3 (8 d) 48.8 38.1 (139 d) 30.1 (139 d)PP2HF-3 37.0 (8 d) 49.3 35.9 (117 d) 30.6 (117 d)PP2LF-3 32.9 (9 d) 44.7 38.2 (129 d) 31.4 (129 d)PP2MF-1 36.8 (10 d) 49.2 36.9 (84 d) 30.8 (84 d)PP2MF-2 36.8 (10 d) 49.2 40.3 (106 d) 32.2 (106 d)PS1MF-3 37.0 (8 d) 49.3 36.4 (123 d) 30.5 (123 d)PS2MF-3 37.0 (8 d) 49.3 39.5 (165 d) 31.4 (165 d)
Fig. 2. Accelerated corrosion of prestressed concrete beams.
200 W. Zhang et al. / Construction and Building Materials 106 (2016) 198–208
of concrete at midspan. Five displacement transducers with a 50 mm range were setat the supports, loading points and midspan to measure vertical displacements ofthe beams under static loading. Layout of displacement transducers and straingauges are shown in Fig. 3.
A high-speed, high-accuracy charge coupled device (CCD) laser displacementsensor of KEYENCE� was employed to monitor the midspan deflection during thewhole process of cyclic loading. Crack widths were measured by a digital crackwidth detector device of GTJ� with an accuracy of 0.01 mm, which includes themeasurement sensor and screen.
The readings of the strain gauges and the displacement transducers wererecorded using a National Instruments� PXle-1082 data acquisition system. Thedata acquisition frequencies were 2 Hz and 1000 Hz for the static and fatigue load-ing tests, respectively.
2.4. Test setup and loading procedure
The fatigue tests were conducted on a servo-hydraulic Amsler� P960 pulsatortesting machine comprised of a 250 kN dynamic actuator, hydraulic pump and loadunit control panel. A photograph of the fatigue test setup is shown in Fig. 4. The loadwas measured using a 300 kN load cell.
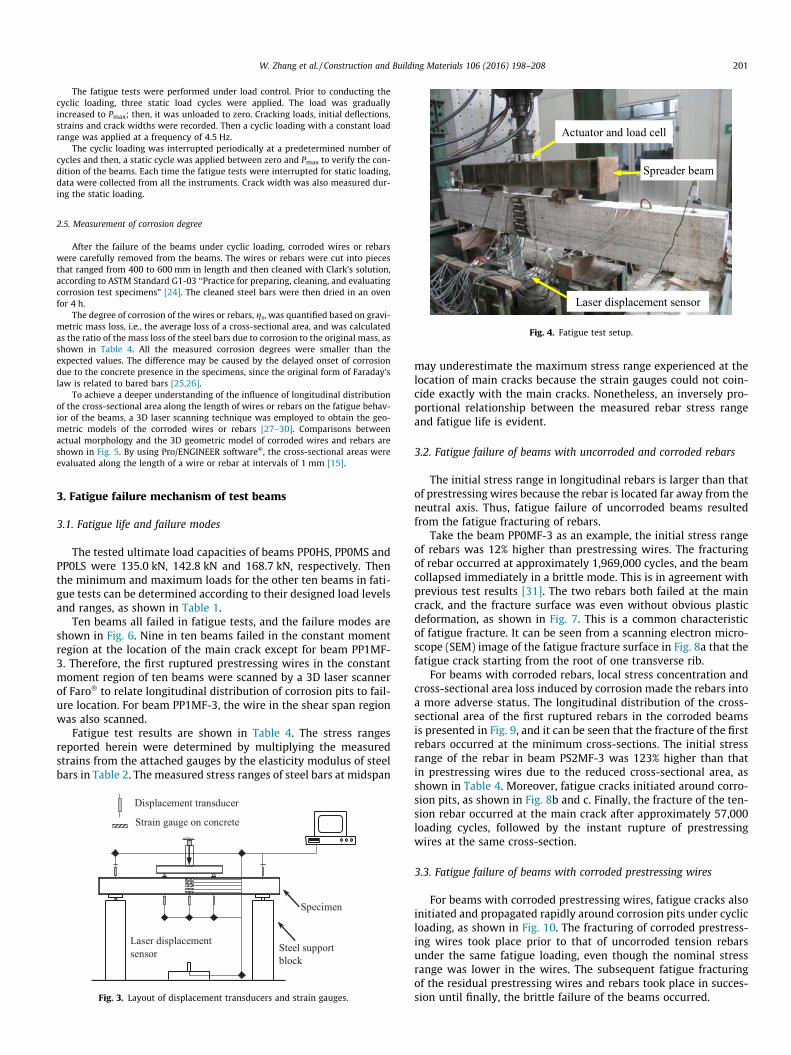
Fig. 4. Fatigue test setup.
W. Zhang et al. / Construction and Building Materials 106 (2016) 198–208 201
The fatigue tests were performed under load control. Prior to conducting thecyclic loading, three static load cycles were applied. The load was graduallyincreased to Pmax; then, it was unloaded to zero. Cracking loads, initial deflections,strains and crack widths were recorded. Then a cyclic loading with a constant loadrange was applied at a frequency of 4.5 Hz.
The cyclic loading was interrupted periodically at a predetermined number ofcycles and then, a static cycle was applied between zero and Pmax to verify the con-dition of the beams. Each time the fatigue tests were interrupted for static loading,data were collected from all the instruments. Crack width was also measured dur-ing the static loading.
2.5. Measurement of corrosion degree
After the failure of the beams under cyclic loading, corroded wires or rebarswere carefully removed from the beams. The wires or rebars were cut into piecesthat ranged from 400 to 600 mm in length and then cleaned with Clark’s solution,according to ASTM Standard G1-03 ‘‘Practice for preparing, cleaning, and evaluatingcorrosion test specimens” [24]. The cleaned steel bars were then dried in an ovenfor 4 h.
The degree of corrosion of the wires or rebars, gs, was quantified based on gravi-metric mass loss, i.e., the average loss of a cross-sectional area, and was calculatedas the ratio of the mass loss of the steel bars due to corrosion to the original mass, asshown in Table 4. All the measured corrosion degrees were smaller than theexpected values. The difference may be caused by the delayed onset of corrosiondue to the concrete presence in the specimens, since the original form of Faraday’slaw is related to bared bars [25,26].
To achieve a deeper understanding of the influence of longitudinal distributionof the cross-sectional area along the length of wires or rebars on the fatigue behav-ior of the beams, a 3D laser scanning technique was employed to obtain the geo-metric models of the corroded wires or rebars [27–30]. Comparisons betweenactual morphology and the 3D geometric model of corroded wires and rebars areshown in Fig. 5. By using Pro/ENGINEER software�, the cross-sectional areas wereevaluated along the length of a wire or rebar at intervals of 1 mm [15].
3. Fatigue failure mechanism of test beams
3.1. Fatigue life and failure modes
The tested ultimate load capacities of beams PP0HS, PP0MS andPP0LS were 135.0 kN, 142.8 kN and 168.7 kN, respectively. Thenthe minimum and maximum loads for the other ten beams in fati-gue tests can be determined according to their designed load levelsand ranges, as shown in Table 1.
Ten beams all failed in fatigue tests, and the failure modes areshown in Fig. 6. Nine in ten beams failed in the constant momentregion at the location of the main crack except for beam PP1MF-3. Therefore, the first ruptured prestressing wires in the constantmoment region of ten beams were scanned by a 3D laser scannerof Faro� to relate longitudinal distribution of corrosion pits to fail-ure location. For beam PP1MF-3, the wire in the shear span regionwas also scanned.
Fatigue test results are shown in Table 4. The stress rangesreported herein were determined by multiplying the measuredstrains from the attached gauges by the elasticity modulus of steelbars in Table 2. The measured stress ranges of steel bars at midspan
Fig. 3. Layout of displacement transducers and strain gauges.
may underestimate the maximum stress range experienced at thelocation of main cracks because the strain gauges could not coin-cide exactly with the main cracks. Nonetheless, an inversely pro-portional relationship between the measured rebar stress rangeand fatigue life is evident.
3.2. Fatigue failure of beams with uncorroded and corroded rebars
The initial stress range in longitudinal rebars is larger than thatof prestressing wires because the rebar is located far away from theneutral axis. Thus, fatigue failure of uncorroded beams resultedfrom the fatigue fracturing of rebars.
Take the beam PP0MF-3 as an example, the initial stress rangeof rebars was 12% higher than prestressing wires. The fracturingof rebar occurred at approximately 1,969,000 cycles, and the beamcollapsed immediately in a brittle mode. This is in agreement withprevious test results [31]. The two rebars both failed at the maincrack, and the fracture surface was even without obvious plasticdeformation, as shown in Fig. 7. This is a common characteristicof fatigue fracture. It can be seen from a scanning electron micro-scope (SEM) image of the fatigue fracture surface in Fig. 8a that thefatigue crack starting from the root of one transverse rib.
For beams with corroded rebars, local stress concentration andcross-sectional area loss induced by corrosion made the rebars intoa more adverse status. The longitudinal distribution of the cross-sectional area of the first ruptured rebars in the corroded beamsis presented in Fig. 9, and it can be seen that the fracture of the firstrebars occurred at the minimum cross-sections. The initial stressrange of the rebar in beam PS2MF-3 was 123% higher than thatin prestressing wires due to the reduced cross-sectional area, asshown in Table 4. Moreover, fatigue cracks initiated around corro-sion pits, as shown in Fig. 8b and c. Finally, the fracture of the ten-sion rebar occurred at the main crack after approximately 57,000loading cycles, followed by the instant rupture of prestressingwires at the same cross-section.
3.3. Fatigue failure of beams with corroded prestressing wires
For beams with corroded prestressing wires, fatigue cracks alsoinitiated and propagated rapidly around corrosion pits under cyclicloading, as shown in Fig. 10. The fracturing of corroded prestress-ing wires took place prior to that of uncorroded tension rebarsunder the same fatigue loading, even though the nominal stressrange was lower in the wires. The subsequent fatigue fracturingof the residual prestressing wires and rebars took place in succes-sion until finally, the brittle failure of the beams occurred.
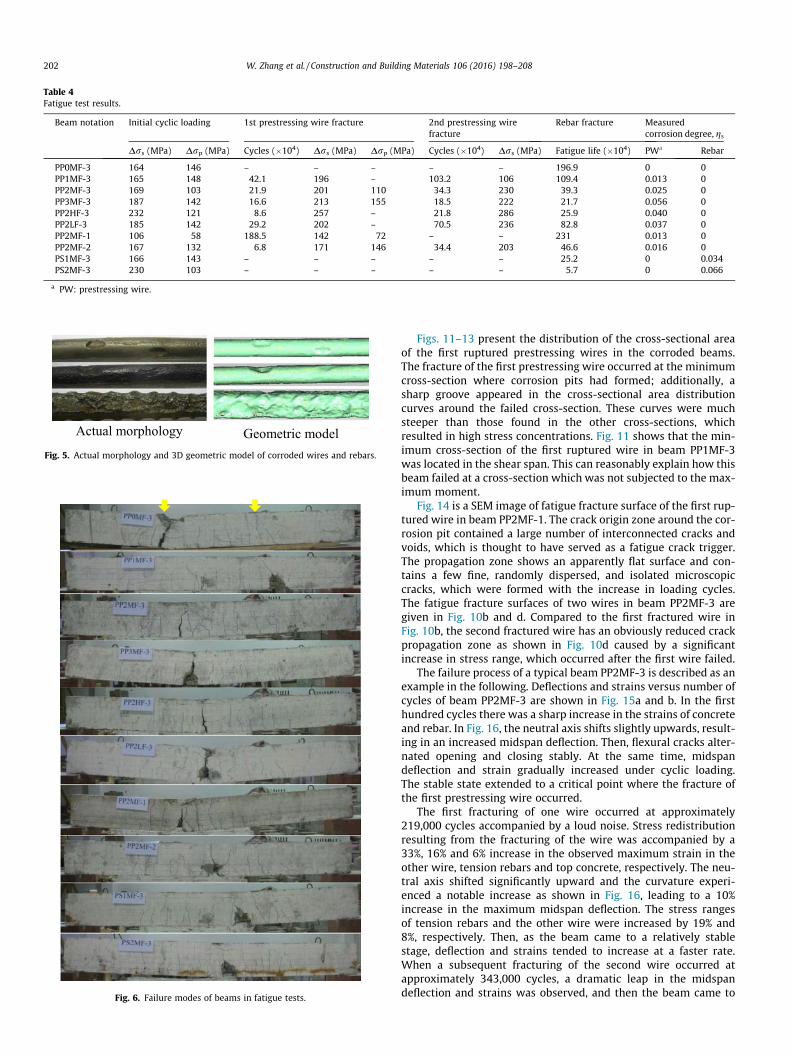
Table 4Fatigue test results.
Beam notation Initial cyclic loading 1st prestressing wire fracture 2nd prestressing wirefracture
Rebar fracture Measuredcorrosion degree, gs
Drs (MPa) Drp (MPa) Cycles (�104) Drs (MPa) Drp (MPa) Cycles (�104) Drs (MPa) Fatigue life (�104) PWa Rebar
PP0MF-3 164 146 – – – – – 196.9 0 0PP1MF-3 165 148 42.1 196 – 103.2 106 109.4 0.013 0PP2MF-3 169 103 21.9 201 110 34.3 230 39.3 0.025 0PP3MF-3 187 142 16.6 213 155 18.5 222 21.7 0.056 0PP2HF-3 232 121 8.6 257 – 21.8 286 25.9 0.040 0PP2LF-3 185 142 29.2 202 – 70.5 236 82.8 0.037 0PP2MF-1 106 58 188.5 142 72 – – 231 0.013 0PP2MF-2 167 132 6.8 171 146 34.4 203 46.6 0.016 0PS1MF-3 166 143 – – – – – 25.2 0 0.034PS2MF-3 230 103 – – – – – 5.7 0 0.066
a PW: prestressing wire.
Fig. 5. Actual morphology and 3D geometric model of corroded wires and rebars.
Fig. 6. Failure modes of beams in fatigue tests.
202 W. Zhang et al. / Construction and Building Materials 106 (2016) 198–208
Figs. 11–13 present the distribution of the cross-sectional areaof the first ruptured prestressing wires in the corroded beams.The fracture of the first prestressing wire occurred at the minimumcross-section where corrosion pits had formed; additionally, asharp groove appeared in the cross-sectional area distributioncurves around the failed cross-section. These curves were muchsteeper than those found in the other cross-sections, whichresulted in high stress concentrations. Fig. 11 shows that the min-imum cross-section of the first ruptured wire in beam PP1MF-3was located in the shear span. This can reasonably explain how thisbeam failed at a cross-section which was not subjected to the max-imum moment.
Fig. 14 is a SEM image of fatigue fracture surface of the first rup-tured wire in beam PP2MF-1. The crack origin zone around the cor-rosion pit contained a large number of interconnected cracks andvoids, which is thought to have served as a fatigue crack trigger.The propagation zone shows an apparently flat surface and con-tains a few fine, randomly dispersed, and isolated microscopiccracks, which were formed with the increase in loading cycles.The fatigue fracture surfaces of two wires in beam PP2MF-3 aregiven in Fig. 10b and d. Compared to the first fractured wire inFig. 10b, the second fractured wire has an obviously reduced crackpropagation zone as shown in Fig. 10d caused by a significantincrease in stress range, which occurred after the first wire failed.
The failure process of a typical beam PP2MF-3 is described as anexample in the following. Deflections and strains versus number ofcycles of beam PP2MF-3 are shown in Fig. 15a and b. In the firsthundred cycles there was a sharp increase in the strains of concreteand rebar. In Fig. 16, the neutral axis shifts slightly upwards, result-ing in an increased midspan deflection. Then, flexural cracks alter-nated opening and closing stably. At the same time, midspandeflection and strain gradually increased under cyclic loading.The stable state extended to a critical point where the fracture ofthe first prestressing wire occurred.
The first fracturing of one wire occurred at approximately219,000 cycles accompanied by a loud noise. Stress redistributionresulting from the fracturing of the wire was accompanied by a33%, 16% and 6% increase in the observed maximum strain in theother wire, tension rebars and top concrete, respectively. The neu-tral axis shifted significantly upward and the curvature experi-enced a notable increase as shown in Fig. 16, leading to a 10%increase in the maximum midspan deflection. The stress rangesof tension rebars and the other wire were increased by 19% and8%, respectively. Then, as the beam came to a relatively stablestage, deflection and strains tended to increase at a faster rate.When a subsequent fracturing of the second wire occurred atapproximately 343,000 cycles, a dramatic leap in the midspandeflection and strains was observed, and then the beam came to
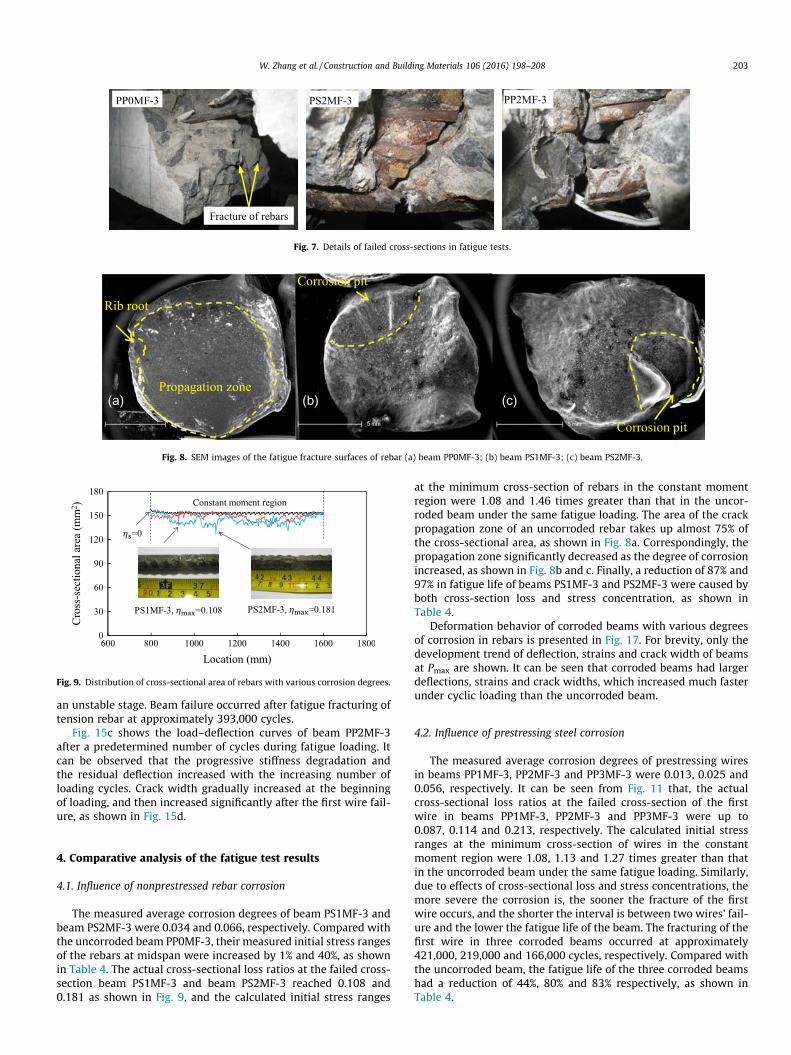
Fig. 7. Details of failed cross-sections in fatigue tests.
Fig. 8. SEM images of the fatigue fracture surfaces of rebar (a) beam PP0MF-3; (b) beam PS1MF-3; (c) beam PS2MF-3.
Fig. 9. Distribution of cross-sectional area of rebars with various corrosion degrees.
W. Zhang et al. / Construction and Building Materials 106 (2016) 198–208 203
an unstable stage. Beam failure occurred after fatigue fracturing oftension rebar at approximately 393,000 cycles.
Fig. 15c shows the load–deflection curves of beam PP2MF-3after a predetermined number of cycles during fatigue loading. Itcan be observed that the progressive stiffness degradation andthe residual deflection increased with the increasing number ofloading cycles. Crack width gradually increased at the beginningof loading, and then increased significantly after the first wire fail-ure, as shown in Fig. 15d.
4. Comparative analysis of the fatigue test results
4.1. Influence of nonprestressed rebar corrosion
The measured average corrosion degrees of beam PS1MF-3 andbeam PS2MF-3 were 0.034 and 0.066, respectively. Compared withthe uncorroded beam PP0MF-3, their measured initial stress rangesof the rebars at midspan were increased by 1% and 40%, as shownin Table 4. The actual cross-sectional loss ratios at the failed cross-section beam PS1MF-3 and beam PS2MF-3 reached 0.108 and0.181 as shown in Fig. 9, and the calculated initial stress ranges
at the minimum cross-section of rebars in the constant momentregion were 1.08 and 1.46 times greater than that in the uncor-roded beam under the same fatigue loading. The area of the crackpropagation zone of an uncorroded rebar takes up almost 75% ofthe cross-sectional area, as shown in Fig. 8a. Correspondingly, thepropagation zone significantly decreased as the degree of corrosionincreased, as shown in Fig. 8b and c. Finally, a reduction of 87% and97% in fatigue life of beams PS1MF-3 and PS2MF-3 were caused byboth cross-section loss and stress concentration, as shown inTable 4.
Deformation behavior of corroded beams with various degreesof corrosion in rebars is presented in Fig. 17. For brevity, only thedevelopment trend of deflection, strains and crack width of beamsat Pmax are shown. It can be seen that corroded beams had largerdeflections, strains and crack widths, which increased much fasterunder cyclic loading than the uncorroded beam.
4.2. Influence of prestressing steel corrosion
The measured average corrosion degrees of prestressing wiresin beams PP1MF-3, PP2MF-3 and PP3MF-3 were 0.013, 0.025 and0.056, respectively. It can be seen from Fig. 11 that, the actualcross-sectional loss ratios at the failed cross-section of the firstwire in beams PP1MF-3, PP2MF-3 and PP3MF-3 were up to0.087, 0.114 and 0.213, respectively. The calculated initial stressranges at the minimum cross-section of wires in the constantmoment region were 1.08, 1.13 and 1.27 times greater than thatin the uncorroded beam under the same fatigue loading. Similarly,due to effects of cross-sectional loss and stress concentrations, themore severe the corrosion is, the sooner the fracture of the firstwire occurs, and the shorter the interval is between two wires’ fail-ure and the lower the fatigue life of the beam. The fracturing of thefirst wire in three corroded beams occurred at approximately421,000, 219,000 and 166,000 cycles, respectively. Compared withthe uncorroded beam, the fatigue life of the three corroded beamshad a reduction of 44%, 80% and 83% respectively, as shown inTable 4.
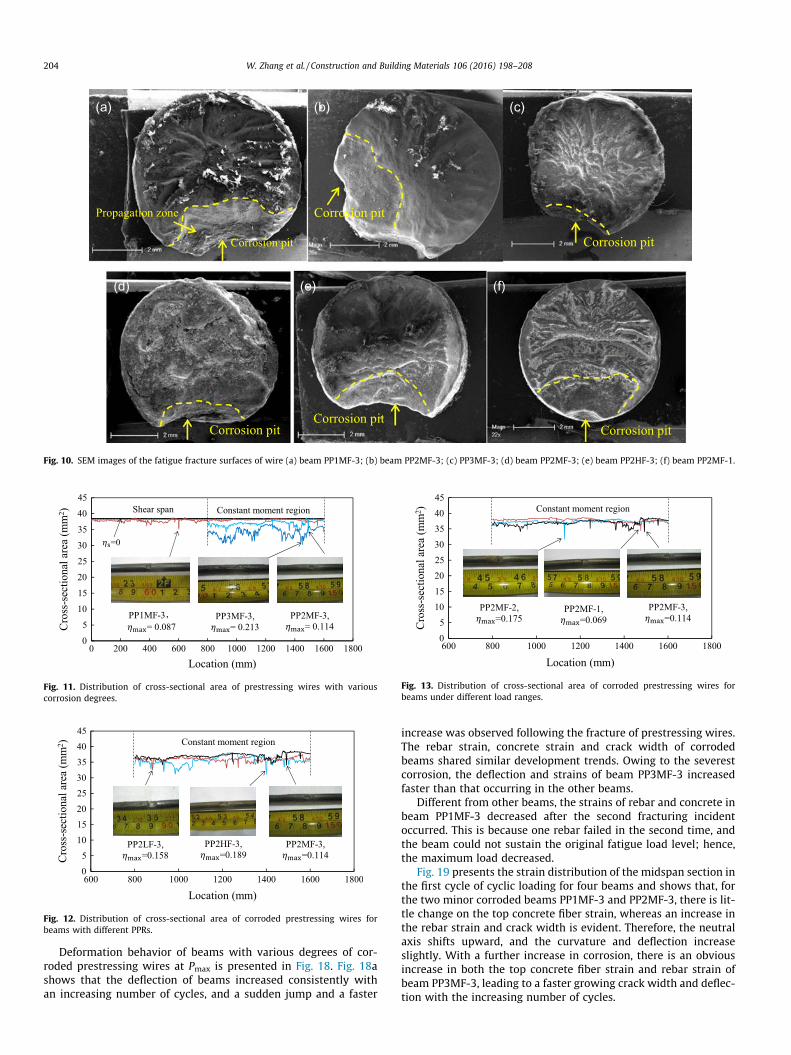
Fig. 10. SEM images of the fatigue fracture surfaces of wire (a) beam PP1MF-3; (b) beam PP2MF-3; (c) PP3MF-3; (d) beam PP2MF-3; (e) beam PP2HF-3; (f) beam PP2MF-1.
Fig. 11. Distribution of cross-sectional area of prestressing wires with variouscorrosion degrees.
Fig. 12. Distribution of cross-sectional area of corroded prestressing wires forbeams with different PPRs.
Fig. 13. Distribution of cross-sectional area of corroded prestressing wires forbeams under different load ranges.
204 W. Zhang et al. / Construction and Building Materials 106 (2016) 198–208
Deformation behavior of beams with various degrees of cor-roded prestressing wires at Pmax is presented in Fig. 18. Fig. 18ashows that the deflection of beams increased consistently withan increasing number of cycles, and a sudden jump and a faster
increase was observed following the fracture of prestressing wires.The rebar strain, concrete strain and crack width of corrodedbeams shared similar development trends. Owing to the severestcorrosion, the deflection and strains of beam PP3MF-3 increasedfaster than that occurring in the other beams.
Different from other beams, the strains of rebar and concrete inbeam PP1MF-3 decreased after the second fracturing incidentoccurred. This is because one rebar failed in the second time, andthe beam could not sustain the original fatigue load level; hence,the maximum load decreased.
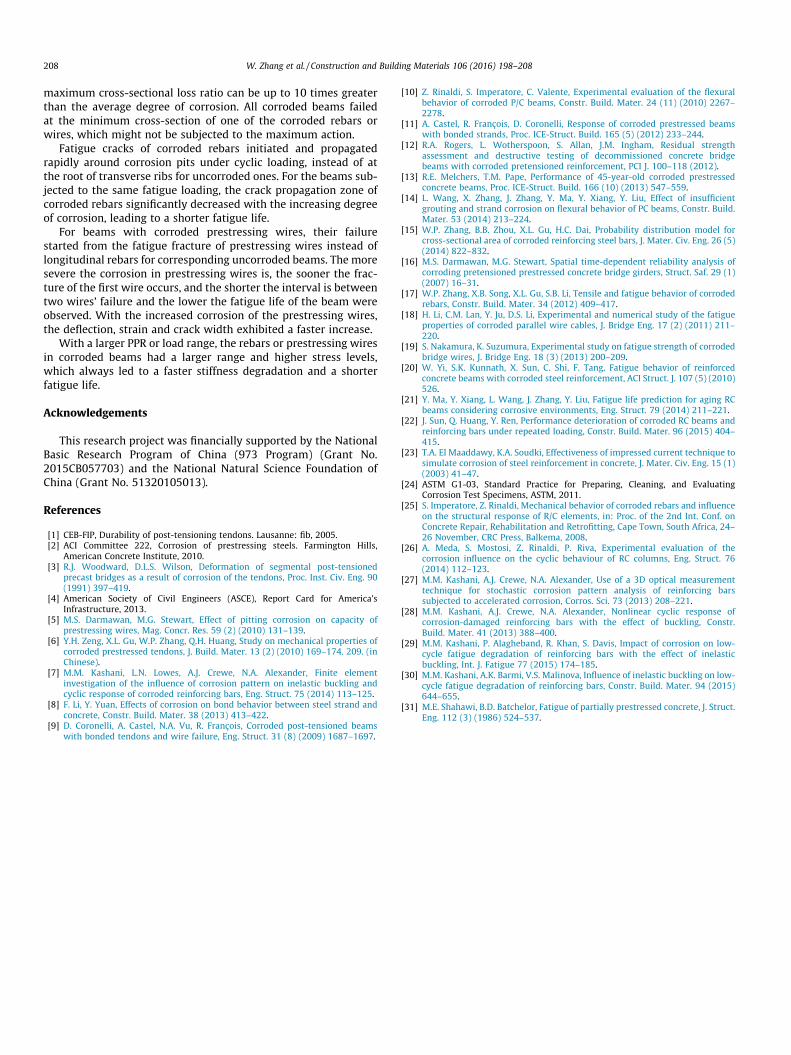
Fig. 19 presents the strain distribution of the midspan section inthe first cycle of cyclic loading for four beams and shows that, forthe two minor corroded beams PP1MF-3 and PP2MF-3, there is lit-tle change on the top concrete fiber strain, whereas an increase inthe rebar strain and crack width is evident. Therefore, the neutralaxis shifts upward, and the curvature and deflection increaseslightly. With a further increase in corrosion, there is an obviousincrease in both the top concrete fiber strain and rebar strain ofbeam PP3MF-3, leading to a faster growing crack width and deflec-tion with the increasing number of cycles.
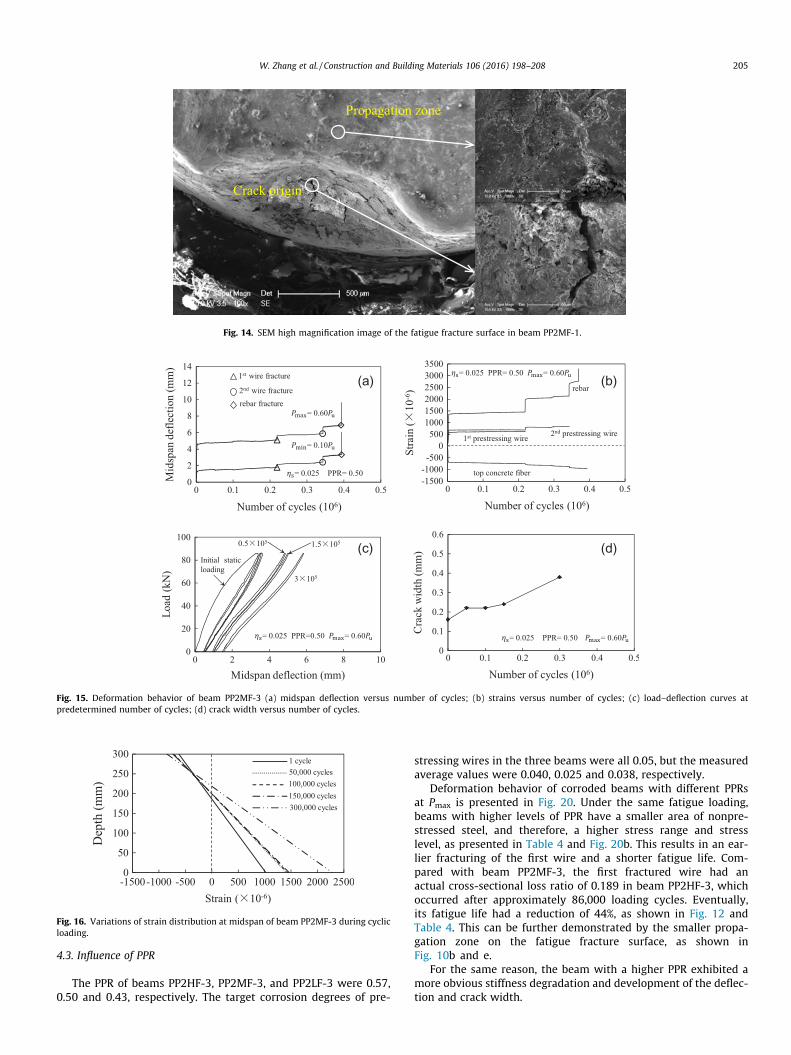
Fig. 14. SEM high magnification image of the fatigue fracture surface in beam PP2MF-1.
Fig. 15. Deformation behavior of beam PP2MF-3 (a) midspan deflection versus number of cycles; (b) strains versus number of cycles; (c) load–deflection curves atpredetermined number of cycles; (d) crack width versus number of cycles.
Fig. 16. Variations of strain distribution at midspan of beam PP2MF-3 during cyclicloading.
W. Zhang et al. / Construction and Building Materials 106 (2016) 198–208 205
4.3. Influence of PPR
The PPR of beams PP2HF-3, PP2MF-3, and PP2LF-3 were 0.57,0.50 and 0.43, respectively. The target corrosion degrees of pre-
stressing wires in the three beams were all 0.05, but the measuredaverage values were 0.040, 0.025 and 0.038, respectively.
Deformation behavior of corroded beams with different PPRsat Pmax is presented in Fig. 20. Under the same fatigue loading,beams with higher levels of PPR have a smaller area of nonpre-stressed steel, and therefore, a higher stress range and stresslevel, as presented in Table 4 and Fig. 20b. This results in an ear-lier fracturing of the first wire and a shorter fatigue life. Com-pared with beam PP2MF-3, the first fractured wire had anactual cross-sectional loss ratio of 0.189 in beam PP2HF-3, whichoccurred after approximately 86,000 loading cycles. Eventually,its fatigue life had a reduction of 44%, as shown in Fig. 12 andTable 4. This can be further demonstrated by the smaller propa-gation zone on the fatigue fracture surface, as shown inFig. 10b and e.
For the same reason, the beam with a higher PPR exhibited amore obvious stiffness degradation and development of the deflec-tion and crack width.
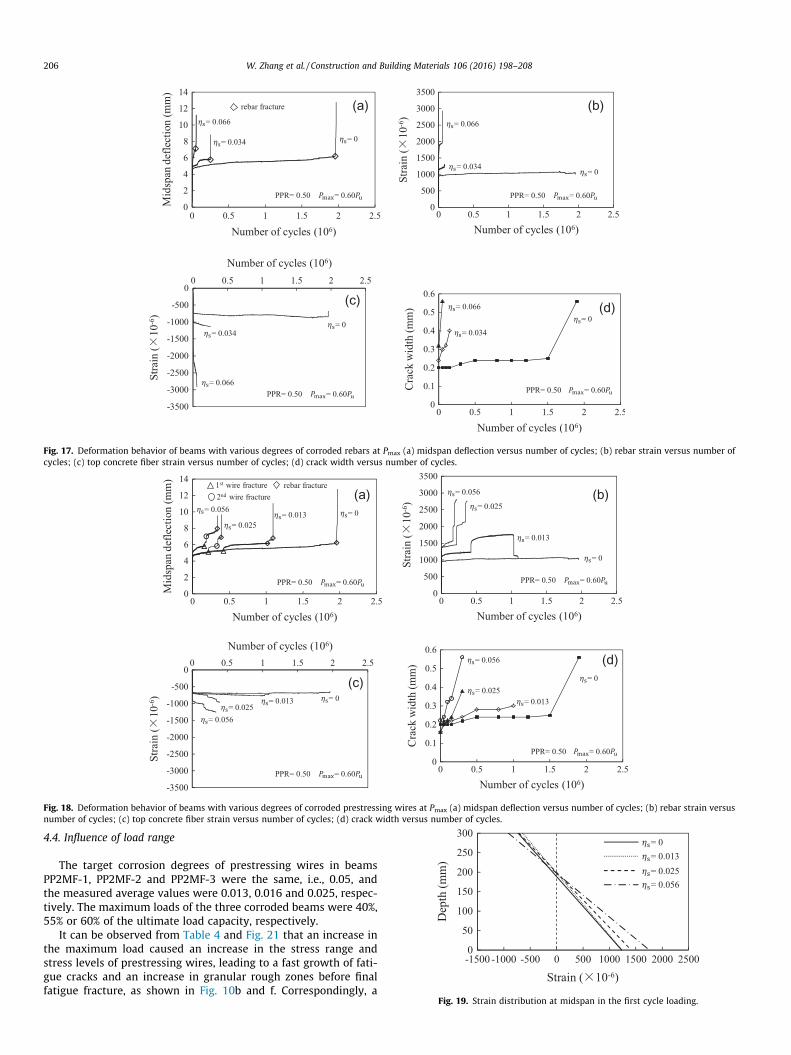
Fig. 17. Deformation behavior of beams with various degrees of corroded rebars at Pmax (a) midspan deflection versus number of cycles; (b) rebar strain versus number ofcycles; (c) top concrete fiber strain versus number of cycles; (d) crack width versus number of cycles.
Fig. 18. Deformation behavior of beams with various degrees of corroded prestressing wires at Pmax (a) midspan deflection versus number of cycles; (b) rebar strain versusnumber of cycles; (c) top concrete fiber strain versus number of cycles; (d) crack width versus number of cycles.
206 W. Zhang et al. / Construction and Building Materials 106 (2016) 198–208
4.4. Influence of load range
The target corrosion degrees of prestressing wires in beamsPP2MF-1, PP2MF-2 and PP2MF-3 were the same, i.e., 0.05, andthe measured average values were 0.013, 0.016 and 0.025, respec-tively. The maximum loads of the three corroded beams were 40%,55% or 60% of the ultimate load capacity, respectively.
It can be observed from Table 4 and Fig. 21 that an increase inthe maximum load caused an increase in the stress range andstress levels of prestressing wires, leading to a fast growth of fati-gue cracks and an increase in granular rough zones before finalfatigue fracture, as shown in Fig. 10b and f. Correspondingly, a
Fig. 19. Strain distribution at midspan in the first cycle loading.
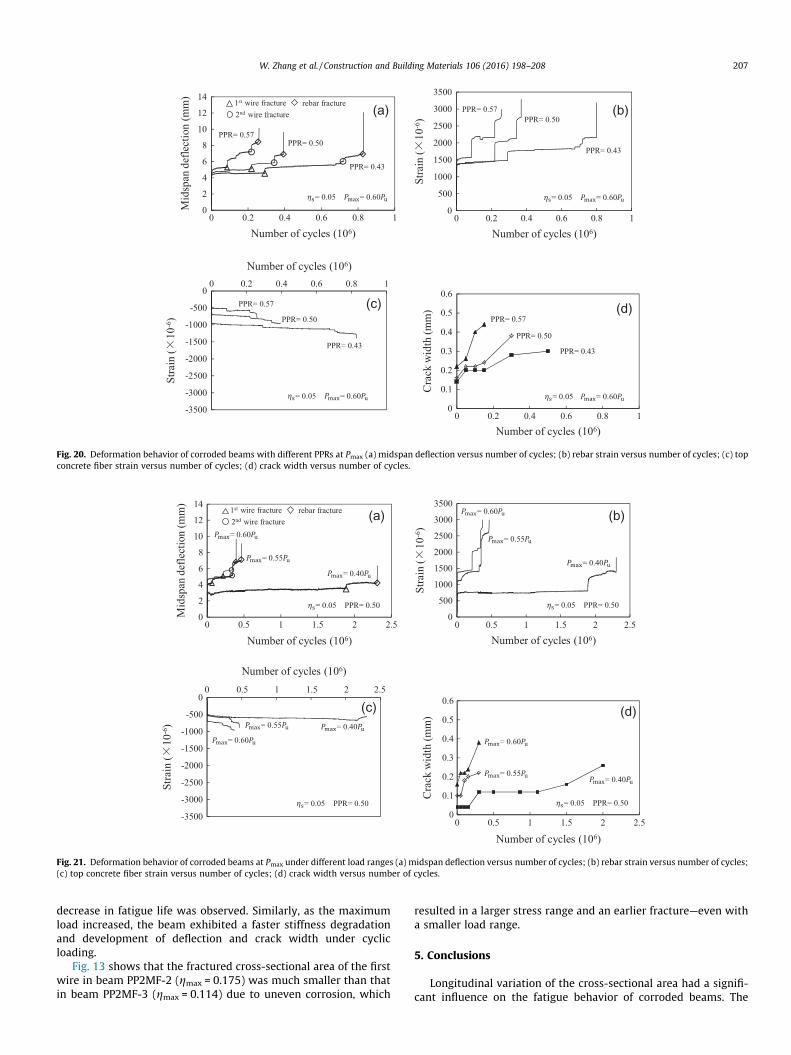
Fig. 20. Deformation behavior of corroded beams with different PPRs at Pmax (a) midspan deflection versus number of cycles; (b) rebar strain versus number of cycles; (c) topconcrete fiber strain versus number of cycles; (d) crack width versus number of cycles.
Fig. 21. Deformation behavior of corroded beams at Pmax under different load ranges (a) midspan deflection versus number of cycles; (b) rebar strain versus number of cycles;(c) top concrete fiber strain versus number of cycles; (d) crack width versus number of cycles.
W. Zhang et al. / Construction and Building Materials 106 (2016) 198–208 207
decrease in fatigue life was observed. Similarly, as the maximumload increased, the beam exhibited a faster stiffness degradationand development of deflection and crack width under cyclicloading.
Fig. 13 shows that the fractured cross-sectional area of the firstwire in beam PP2MF-2 (gmax = 0.175) was much smaller than thatin beam PP2MF-3 (gmax = 0.114) due to uneven corrosion, which
resulted in a larger stress range and an earlier fracture—even witha smaller load range.
5. Conclusions
Longitudinal variation of the cross-sectional area had a signifi-cant influence on the fatigue behavior of corroded beams. The
208 W. Zhang et al. / Construction and Building Materials 106 (2016) 198–208
maximum cross-sectional loss ratio can be up to 10 times greaterthan the average degree of corrosion. All corroded beams failedat the minimum cross-section of one of the corroded rebars orwires, which might not be subjected to the maximum action.
Fatigue cracks of corroded rebars initiated and propagatedrapidly around corrosion pits under cyclic loading, instead of atthe root of transverse ribs for uncorroded ones. For the beams sub-jected to the same fatigue loading, the crack propagation zone ofcorroded rebars significantly decreased with the increasing degreeof corrosion, leading to a shorter fatigue life.
For beams with corroded prestressing wires, their failurestarted from the fatigue fracture of prestressing wires instead oflongitudinal rebars for corresponding uncorroded beams. The moresevere the corrosion in prestressing wires is, the sooner the frac-ture of the first wire occurs, and the shorter the interval is betweentwo wires’ failure and the lower the fatigue life of the beam wereobserved. With the increased corrosion of the prestressing wires,the deflection, strain and crack width exhibited a faster increase.
With a larger PPR or load range, the rebars or prestressing wiresin corroded beams had a larger range and higher stress levels,which always led to a faster stiffness degradation and a shorterfatigue life.
Acknowledgements
This research project was financially supported by the NationalBasic Research Program of China (973 Program) (Grant No.2015CB057703) and the National Natural Science Foundation ofChina (Grant No. 51320105013).
References
[1] CEB-FIP, Durability of post-tensioning tendons. Lausanne: fib, 2005.[2] ACI Committee 222, Corrosion of prestressing steels. Farmington Hills,
American Concrete Institute, 2010.[3] R.J. Woodward, D.L.S. Wilson, Deformation of segmental post-tensioned
precast bridges as a result of corrosion of the tendons, Proc. Inst. Civ. Eng. 90(1991) 397–419.
[4] American Society of Civil Engineers (ASCE), Report Card for America’sInfrastructure, 2013.
[5] M.S. Darmawan, M.G. Stewart, Effect of pitting corrosion on capacity ofprestressing wires, Mag. Concr. Res. 59 (2) (2010) 131–139.
[6] Y.H. Zeng, X.L. Gu, W.P. Zhang, Q.H. Huang, Study on mechanical properties ofcorroded prestressed tendons, J. Build. Mater. 13 (2) (2010) 169–174. 209. (inChinese).
[7] M.M. Kashani, L.N. Lowes, A.J. Crewe, N.A. Alexander, Finite elementinvestigation of the influence of corrosion pattern on inelastic buckling andcyclic response of corroded reinforcing bars, Eng. Struct. 75 (2014) 113–125.
[8] F. Li, Y. Yuan, Effects of corrosion on bond behavior between steel strand andconcrete, Constr. Build. Mater. 38 (2013) 413–422.
[9] D. Coronelli, A. Castel, N.A. Vu, R. François, Corroded post-tensioned beamswith bonded tendons and wire failure, Eng. Struct. 31 (8) (2009) 1687–1697.
[10] Z. Rinaldi, S. Imperatore, C. Valente, Experimental evaluation of the flexuralbehavior of corroded P/C beams, Constr. Build. Mater. 24 (11) (2010) 2267–2278.
[11] A. Castel, R. François, D. Coronelli, Response of corroded prestressed beamswith bonded strands, Proc. ICE-Struct. Build. 165 (5) (2012) 233–244.
[12] R.A. Rogers, L. Wotherspoon, S. Allan, J.M. Ingham, Residual strengthassessment and destructive testing of decommissioned concrete bridgebeams with corroded pretensioned reinforcement, PCI J. 100–118 (2012).
[13] R.E. Melchers, T.M. Pape, Performance of 45-year-old corroded prestressedconcrete beams, Proc. ICE-Struct. Build. 166 (10) (2013) 547–559.
[14] L. Wang, X. Zhang, J. Zhang, Y. Ma, Y. Xiang, Y. Liu, Effect of insufficientgrouting and strand corrosion on flexural behavior of PC beams, Constr. Build.Mater. 53 (2014) 213–224.
[15] W.P. Zhang, B.B. Zhou, X.L. Gu, H.C. Dai, Probability distribution model forcross-sectional area of corroded reinforcing steel bars, J. Mater. Civ. Eng. 26 (5)(2014) 822–832.
[16] M.S. Darmawan, M.G. Stewart, Spatial time-dependent reliability analysis ofcorroding pretensioned prestressed concrete bridge girders, Struct. Saf. 29 (1)(2007) 16–31.
[17] W.P. Zhang, X.B. Song, X.L. Gu, S.B. Li, Tensile and fatigue behavior of corrodedrebars, Constr. Build. Mater. 34 (2012) 409–417.
[18] H. Li, C.M. Lan, Y. Ju, D.S. Li, Experimental and numerical study of the fatigueproperties of corroded parallel wire cables, J. Bridge Eng. 17 (2) (2011) 211–220.
[19] S. Nakamura, K. Suzumura, Experimental study on fatigue strength of corrodedbridge wires, J. Bridge Eng. 18 (3) (2013) 200–209.
[20] W. Yi, S.K. Kunnath, X. Sun, C. Shi, F. Tang, Fatigue behavior of reinforcedconcrete beams with corroded steel reinforcement, ACI Struct. J. 107 (5) (2010)526.
[21] Y. Ma, Y. Xiang, L. Wang, J. Zhang, Y. Liu, Fatigue life prediction for aging RCbeams considering corrosive environments, Eng. Struct. 79 (2014) 211–221.
[22] J. Sun, Q. Huang, Y. Ren, Performance deterioration of corroded RC beams andreinforcing bars under repeated loading, Constr. Build. Mater. 96 (2015) 404–415.
[23] T.A. El Maaddawy, K.A. Soudki, Effectiveness of impressed current technique tosimulate corrosion of steel reinforcement in concrete, J. Mater. Civ. Eng. 15 (1)(2003) 41–47.
[24] ASTM G1-03, Standard Practice for Preparing, Cleaning, and EvaluatingCorrosion Test Specimens, ASTM, 2011.
[25] S. Imperatore, Z. Rinaldi, Mechanical behavior of corroded rebars and influenceon the structural response of R/C elements, in: Proc. of the 2nd Int. Conf. onConcrete Repair, Rehabilitation and Retrofitting, Cape Town, South Africa, 24–26 November, CRC Press, Balkema, 2008.
[26] A. Meda, S. Mostosi, Z. Rinaldi, P. Riva, Experimental evaluation of thecorrosion influence on the cyclic behaviour of RC columns, Eng. Struct. 76(2014) 112–123.
[27] M.M. Kashani, A.J. Crewe, N.A. Alexander, Use of a 3D optical measurementtechnique for stochastic corrosion pattern analysis of reinforcing barssubjected to accelerated corrosion, Corros. Sci. 73 (2013) 208–221.
[28] M.M. Kashani, A.J. Crewe, N.A. Alexander, Nonlinear cyclic response ofcorrosion-damaged reinforcing bars with the effect of buckling, Constr.Build. Mater. 41 (2013) 388–400.
[29] M.M. Kashani, P. Alagheband, R. Khan, S. Davis, Impact of corrosion on low-cycle fatigue degradation of reinforcing bars with the effect of inelasticbuckling, Int. J. Fatigue 77 (2015) 174–185.
[30] M.M. Kashani, A.K. Barmi, V.S. Malinova, Influence of inelastic buckling on low-cycle fatigue degradation of reinforcing bars, Constr. Build. Mater. 94 (2015)644–655.
[31] M.E. Shahawi, B.D. Batchelor, Fatigue of partially prestressed concrete, J. Struct.Eng. 112 (3) (1986) 524–537.