
Fatigue Analysis of Rail-Head-to-Web Fillet at Bolted Rail...
7
FATIGUE ANALYSIS OF RAIL-HEAD-TO-WEB FILLET AT BOLTED RAIL JOINT UNDER VARIOUS IMPACT WHEEL LOAD FACTORS AND SUPPORT CONFIGURATIONS Kaijun Zhu, J. Riley Edwards, Yu Qian, and Bassem O. Andrawes University of Illinois at Urbana-Champaign Department of Civil and Environmental Engineering Rail Transportation and Engineering Center (RailTEC) 205 N Mathews Ave Urbana, IL, United States 61801 ABSTRACT As one of the weakest locations in the track superstructure, the rail joint encounters different types of defects and failures, including rail bolt-hole cracking, rail head-web cracking or separation, broken or missing bolts, and joint bar cracking. The defects and failures are mainly initiated by the discontinuities of both geometric and mechanical properties due to the rail joint, and the high impact loads induced by the discontinuities. Continuous welded rail (CWR) overcomes most disadvantages of the rail joints. However, a large number of rail joints still exist in North American Railroads for a variety of reasons, and bolted joints are especially prevalent in early-built rail transit systems. Cracks are often found to initiate in the area of the first bolt-hole and rail-head-to-web fillet (upper fillet) at the rail end among bolted rail joints, which might cause further defects, such as rail breaks or loss of rail running surface. Previous research conducted at the University of Illinois at Urbana- Champaign (UIUC) has established an elastic static Finite Element (FE) model to study the stress distribution of the bolted rail joint with particular emphasis on rail end bolt-hole and upper fillet areas. Based on the stress calculated from the FE models, this paper focuses on the fatigue performance of upper fillet under different impact wheel load factors and crosstie support configurations. Preliminary results show that the estimated fatigue life of rail end upper fillet decreases as impact factor increases, and that a supported joint performs better than a suspended joint on upper fillet fatigue life. INTRODUCTION Rail joints are used to connect two adjacent rails. Typically, a pair of joint bars are placed on each side of the two adjacent rail ends, fixed with at least four bolts. Two main categories are used to classify rail joints: insulated joints (IJs) and bolted joints. Bolted joints can be further categorized into compromise joints and standard joints. Compromise joints are used when two rails with dissimilar sections need to be connected, while standard joints are installed with two similar rail sections. Standard joints are mostly seen in bolted-joint rail (BJR) track, however, they can be observed in continuously welded rail (CWR) track as well, which are used as temporary joints to connect long CWR strings before welding [1]. In railroad track superstructure, the rail joint is treated as one of the weakest spots, mainly because of its discontinuities of both geometric and mechanical properties. Geometric discontinuity includes rail gap, height mismatch, and dip angle (Figure 1) [2]. The smaller section area and lower bending stiffness of joint bars, compared to the rail itself, leads to the discontinuity of mechanical properties (Figure 2) [3]. Those discontinuities can cause high wheel impact loads, which might lead to rail end batter, loosened bolts, deteriorated support condition, and excessive deflection. Such defects can potentially lead to the following failure modes: bolt-hole cracks, head-web separation, bent or broken bolts, and cracked or broken joint bars [4, 5]. Figure 1. Discontinuity of Geometry at Rail Joint [2] (a) Receiving rail Proceedings of the 2016 Joint Rail Conference JRC2016 April 12-15, 2016, Columbia, SC, USA JRC2016-5802 1 Copyright © 2016 by ASME Downloaded From: http://proceedings.asmedigitalcollection.asme.org/ on 06/21/2016 Terms of Use: http://www.asme.org/about-asme/terms-of-use
Transcript of Fatigue Analysis of Rail-Head-to-Web Fillet at Bolted Rail...

FATIGUE ANALYSIS OF RAIL-HEAD-TO-WEB FILLET AT BOLTED RAIL JOINT UNDER VARIOUS IMPACT WHEEL LOAD FACTORS AND SUPPORT CONFIGURATIONS
Kaijun Zhu, J. Riley Edwards, Yu Qian, and Bassem O. Andrawes
University of Illinois at Urbana-Champaign Department of Civil and Environmental Engineering
Rail Transportation and Engineering Center (RailTEC) 205 N Mathews Ave
Urbana, IL, United States 61801
ABSTRACT
As one of the weakest locations in the track superstructure,
the rail joint encounters different types of defects and failures,
including rail bolt-hole cracking, rail head-web cracking or
separation, broken or missing bolts, and joint bar cracking. The
defects and failures are mainly initiated by the discontinuities of
both geometric and mechanical properties due to the rail joint,
and the high impact loads induced by the discontinuities.
Continuous welded rail (CWR) overcomes most disadvantages
of the rail joints. However, a large number of rail joints still
exist in North American Railroads for a variety of reasons, and
bolted joints are especially prevalent in early-built rail transit
systems. Cracks are often found to initiate in the area of the
first bolt-hole and rail-head-to-web fillet (upper fillet) at the rail
end among bolted rail joints, which might cause further defects,
such as rail breaks or loss of rail running surface. Previous
research conducted at the University of Illinois at Urbana-
Champaign (UIUC) has established an elastic static Finite
Element (FE) model to study the stress distribution of the bolted
rail joint with particular emphasis on rail end bolt-hole and upper
fillet areas. Based on the stress calculated from the FE models,
this paper focuses on the fatigue performance of upper fillet
under different impact wheel load factors and crosstie support
configurations. Preliminary results show that the estimated
fatigue life of rail end upper fillet decreases as impact factor
increases, and that a supported joint performs better than a
suspended joint on upper fillet fatigue life.
INTRODUCTION
Rail joints are used to connect two adjacent rails.
Typically, a pair of joint bars are placed on each side of the two
adjacent rail ends, fixed with at least four bolts. Two main
categories are used to classify rail joints: insulated joints (IJs)
and bolted joints. Bolted joints can be further categorized into
compromise joints and standard joints. Compromise joints are
used when two rails with dissimilar sections need to be
connected, while standard joints are installed with two similar
rail sections. Standard joints are mostly seen in bolted-joint rail
(BJR) track, however, they can be observed in continuously
welded rail (CWR) track as well, which are used as temporary
joints to connect long CWR strings before welding [1].
In railroad track superstructure, the rail joint is treated as one
of the weakest spots, mainly because of its discontinuities of both
geometric and mechanical properties. Geometric discontinuity
includes rail gap, height mismatch, and dip angle (Figure 1) [2].
The smaller section area and lower bending stiffness of joint
bars, compared to the rail itself, leads to the discontinuity of
mechanical properties (Figure 2) [3]. Those discontinuities can
cause high wheel impact loads, which might lead to rail end
batter, loosened bolts, deteriorated support condition, and
excessive deflection. Such defects can potentially lead to the
following failure modes: bolt-hole cracks, head-web separation,
bent or broken bolts, and cracked or broken joint bars [4, 5].
Figure 1. Discontinuity of Geometry at Rail Joint [2]
(a)
1
Receiving rail
Proceedings of the 2016 Joint Rail Conference JRC2016
April 12-15, 2016, Columbia, SC, USA
JRC2016-5802
1 Copyright © 2016 by ASME
Downloaded From: http://proceedings.asmedigitalcollection.asme.org/ on 06/21/2016 Terms of Use: http://www.asme.org/about-asme/terms-of-use

Figure 2. Discontinuity of Mechanical Properties [3]
In the rail joint area, two of the most common defects are
rail bolt-hole cracks and head-web separations (Figures 3 and 4).
These defects can lead to rail breaks or loss of rail running
surface.
Figure 3. Typical Rail End Bolt-Hole Crack [2]
Bolt-hole crack typically originates at the very end bolt-hole
of the receiving rail, and at an angle that is approximately 45° to
the neutral axis of the rail [6-8] (Figure 3). Based on previous
research, in BJR track, the bolt-hole cracks are typically
generated by the positive shear stress around the bolt-hole.
Such shear stress increases with the wheel-rail impact load, and
the stress-concentration effect of the hole can cause further
amplification [9, 10]. In CWR track, on the other hand, the
primary cause for the bolt-hole cracks in temporary joints is the
thermal-induced longitudinal stresses [8, 11].
Figure 4. Typical Rail End Head-Web Separation [12]
Rail head-web separation is a progressive horizontal defect
initiating from the upper fillet area between rail head and web,
which may occur at rail joints (Figure 4). Typically at rail joint
areas, head-web separation initiates at the rail end, gradually
develops over bolt-holes, and finally reaches the rail running
surface. The primary originator for this defect is a fatigue
failure caused by high magnitude repeated vertical impact loads
and deflections, or the improper contact between rail and joint
bars due to low quality of installation [3].
In addition, the initial cracks at both rail end bolt-hole and
upper fillet areas are difficult to observe, because they are behind
joint bars such that the effectiveness of human (visual) or
machine-vision-based inspection methods is restricted.
Additionally, limited information has been found on ultrasonic
inspection of bolted rail joints. Accordingly, a better
understanding of material fatigue life at rail end bolt-hole and
upper fillet areas could possibly help improve the efficiency and
accuracy of crack detection and maintenance at rail joints.
Previous research in the Rail Transportation and
Engineering Center (RailTEC) at the University of Illinois at
Urbana-Champaign (UIUC) focused on FE-based parametric
analysis of the stress distribution around the rail end bolt-hole
and at the upper fillet area. This paper will follow one branch
of the previous work and study the fatigue performance of rail
end upper fillet under various impact wheel load factors and
crosstie support configurations. Preliminary results of
estimated fatigue life of the rail end upper fillet will be presented
based on findings from a fatigue parametric study. The fatigue
analysis for rail end bolt-hole area will be presented in a future
publication.
METHODOLOGY
A parametric study was carried out to investigate the fatigue
performance of standard bolted joint with respect to upper fillet
crack issues. All of the constants, variables, and outputs that
were considered in this fatigue parametric study are listed in
Table 1.
Table 1. Fatigue Parametric Study Matrix
Constants
Rail Section 115 RE
Crosstie Spacing 22.5 in
Track Modulus 4,000 psi for resilient plate
Bolt Preloading 22,000 psi per bolt
Static Wheel Load 16,500 lb per wheel
Wheel Load Position above rail end
Variables
Crosstie Support Configuration
(A) suspended
(B) supported
(C) broken plate
Impact Wheel Load Factor
1.33
2.0
3.0
Key Outputs
Estimated Fatigue Life at Rail End Upper Fillet
115 RE
115 RE Joint Bars
Area = 11.22 in.2
Ixx = 65.5 in.4
Area = 10.70 in.2
Ixx = 23.3 in.4
(for two bars)
1
Portions to
be removed
(Typ.)
1
2
Rail end
bolt-hole
cracks
1
Head-web
separation
(Upper fillet
crack)
2 Copyright © 2016 by ASME
Downloaded From: http://proceedings.asmedigitalcollection.asme.org/ on 06/21/2016 Terms of Use: http://www.asme.org/about-asme/terms-of-use

As shown in Table 1, the bolted rail joint adopted in this
study is installed in 115 RE rail track with track modulus of 4,000
psi and average crosstie spacing of 22.5 in. The rail section,
115 RE, is currently used for both freight railroad and rail transit
systems in North America. The track stiffness of 4,000 psi was
provided by New York City Transit Authority (NYCTA) from a
field test, and this value was acquired specifically from the
system with resilient plates between the rail and crossties. The
bolt preloading of 22,000 psi was selected according to Chapter
5, Section 5.5 of the American Railway Engineering and
Maintenance-of-way Association (AREMA) Manual for
Railway Engineering (hereafter referred to as the “AREMA
Manual”) [3]. The static wheel load of 16,500 lb per wheel was
provided by NYCTA as well. The wheel load position was
determined based on previous research conducted at UIUC,
which indicates that the rail end upper fillet stress reaches its
maximum value when the wheel is at the rail end [13].
The three types of crosstie support configurations are shown
in Figure 5. Case (A) “suspended” and (B) “supported” are two
of the most representative crosstie support configurations that
can be observed for rail joints in the field. Case (C) “broken
plate” is the worst-case scenario in this study, and was used to
provide an upper bound on the study of joint fatigue.
Figure 5. Three Cases of Crosstie Support Configurations
The minimum impact factor of 1.33 was suggested by
NYCTA, while the maximum impact factor of 3.0 was decided
based on the AREMA Manual, which suggests a 200% increase
over static vertical loads to estimate the dynamic effect of wheel
and rail irregularities [3].
The key output for this parametric study is the estimated
fatigue life at rail end upper fillet area. Details of the FE-based
parametric analysis and parameters listed in Table 1 have been
provided elsewhere [13].
Fatigue Analysis Procedures
The fatigue analysis procedure used in this study is
illustrated in Figure 6. First, the stresses calculated from the
FE-based parametric analysis [13] using Abaqus are required,
and they play a key role on obtaining rational estimated fatigue
life. Those stresses could then be read by another
commercially available software fe-safe to perform the fatigue
parametric study. In addition to the stress results, information
of loading history and material properties, as well as the selection
of the methods of fatigue algorithm and mean stress correction,
are of great importance during the fatigue analysis, and will be
introduced in detail in the following sections.
Figure 6. Fatigue Analysis Procedure
Loading History
Loading history defines the stresses that the structure
experiences during the fatigue analysis, which normally consists
of the stresses calculated from FE analysis with a load factor
function. The stresses applied in this fatigue parametric study
have been obtained from previous study [13] and can be input
directly into fe-safe. Those stresses would be utilized as the
base load, and could be factored using a load factor function. In
this analysis, the load factor function was set as a sinusoidal
function as plotted in Figure 7, with a magnitude varying from 0
to 1. Each cycle in this curve represents a pass of the wheel
over the rail joint, so that the stress among the joint components
would gradually increase to its maximum and then decrease to
zero within one cycle. The estimated fatigue life is the total
cycles of the loading that the system has experienced before
damage occurs, namely, the total number of wheels passing over
the rail joint before damage initiates.
Figure 7. Load Factor Function Applied in Fatigue Analysis
3 Copyright © 2016 by ASME
Downloaded From: http://proceedings.asmedigitalcollection.asme.org/ on 06/21/2016 Terms of Use: http://www.asme.org/about-asme/terms-of-use
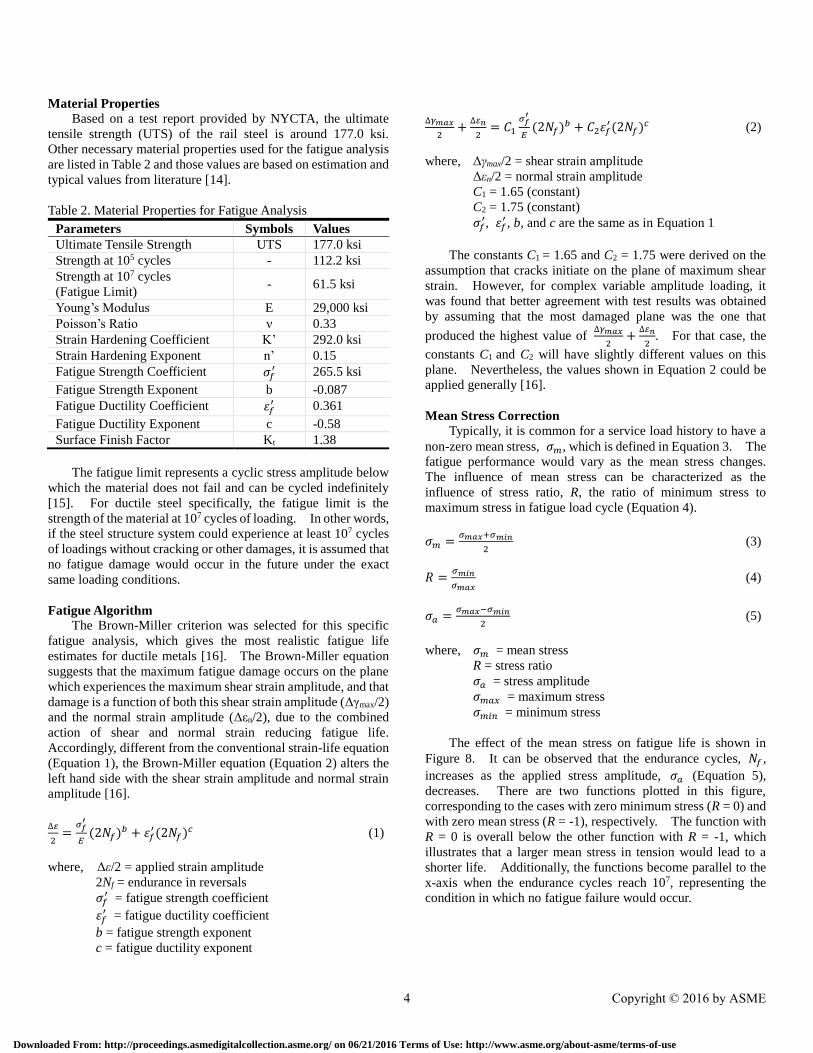
Material Properties
Based on a test report provided by NYCTA, the ultimate
tensile strength (UTS) of the rail steel is around 177.0 ksi.
Other necessary material properties used for the fatigue analysis
are listed in Table 2 and those values are based on estimation and
typical values from literature [14].
Table 2. Material Properties for Fatigue Analysis
Parameters Symbols Values
Ultimate Tensile Strength UTS 177.0 ksi
Strength at 105 cycles - 112.2 ksi
Strength at 107 cycles
(Fatigue Limit) - 61.5 ksi
Young’s Modulus E 29,000 ksi
Poisson’s Ratio ν 0.33
Strain Hardening Coefficient K’ 292.0 ksi
Strain Hardening Exponent n’ 0.15
Fatigue Strength Coefficient 𝜎𝑓′ 265.5 ksi
Fatigue Strength Exponent b -0.087
Fatigue Ductility Coefficient 𝜀𝑓′ 0.361
Fatigue Ductility Exponent c -0.58
Surface Finish Factor Kt 1.38
The fatigue limit represents a cyclic stress amplitude below
which the material does not fail and can be cycled indefinitely
[15]. For ductile steel specifically, the fatigue limit is the
strength of the material at 107 cycles of loading. In other words,
if the steel structure system could experience at least 107 cycles
of loadings without cracking or other damages, it is assumed that
no fatigue damage would occur in the future under the exact
same loading conditions.
Fatigue Algorithm
The Brown-Miller criterion was selected for this specific
fatigue analysis, which gives the most realistic fatigue life
estimates for ductile metals [16]. The Brown-Miller equation
suggests that the maximum fatigue damage occurs on the plane
which experiences the maximum shear strain amplitude, and that
damage is a function of both this shear strain amplitude (Δγmax/2)
and the normal strain amplitude (Δεn/2), due to the combined
action of shear and normal strain reducing fatigue life.
Accordingly, different from the conventional strain-life equation
(Equation 1), the Brown-Miller equation (Equation 2) alters the
left hand side with the shear strain amplitude and normal strain
amplitude [16].
∆𝜀
2=
𝜎𝑓′
𝐸(2𝑁𝑓)𝑏 + 𝜀𝑓
′ (2𝑁𝑓)𝑐 (1)
where, Δε/2 = applied strain amplitude
2Nf = endurance in reversals
𝜎𝑓′ = fatigue strength coefficient
𝜀𝑓′ = fatigue ductility coefficient
b = fatigue strength exponent
c = fatigue ductility exponent
∆𝛾𝑚𝑎𝑥
2+
∆𝜀𝑛
2= 𝐶1
𝜎𝑓′
𝐸(2𝑁𝑓)𝑏 + 𝐶2𝜀𝑓
′ (2𝑁𝑓)𝑐 (2)
where, Δγmax/2 = shear strain amplitude
Δεn/2 = normal strain amplitude
C1 = 1.65 (constant)
C2 = 1.75 (constant)
𝜎𝑓′, 𝜀𝑓
′ , b, and c are the same as in Equation 1
The constants C1 = 1.65 and C2 = 1.75 were derived on the
assumption that cracks initiate on the plane of maximum shear
strain. However, for complex variable amplitude loading, it
was found that better agreement with test results was obtained
by assuming that the most damaged plane was the one that
produced the highest value of ∆𝛾𝑚𝑎𝑥
2+
∆𝜀𝑛
2. For that case, the
constants C1 and C2 will have slightly different values on this
plane. Nevertheless, the values shown in Equation 2 could be
applied generally [16].
Mean Stress Correction
Typically, it is common for a service load history to have a
non-zero mean stress, 𝜎𝑚, which is defined in Equation 3. The
fatigue performance would vary as the mean stress changes.
The influence of mean stress can be characterized as the
influence of stress ratio, R, the ratio of minimum stress to
maximum stress in fatigue load cycle (Equation 4).
𝜎𝑚 =𝜎𝑚𝑎𝑥+𝜎𝑚𝑖𝑛
2 (3)
𝑅 =𝜎𝑚𝑖𝑛
𝜎𝑚𝑎𝑥 (4)
𝜎𝑎 =𝜎𝑚𝑎𝑥−𝜎𝑚𝑖𝑛
2 (5)
where, 𝜎𝑚 = mean stress
R = stress ratio
𝜎𝑎 = stress amplitude
𝜎𝑚𝑎𝑥 = maximum stress
𝜎𝑚𝑖𝑛 = minimum stress
The effect of the mean stress on fatigue life is shown in
Figure 8. It can be observed that the endurance cycles, 𝑁𝑓 ,
increases as the applied stress amplitude, 𝜎𝑎 (Equation 5),
decreases. There are two functions plotted in this figure,
corresponding to the cases with zero minimum stress (R = 0) and
with zero mean stress (R = -1), respectively. The function with
R = 0 is overall below the other function with R = -1, which
illustrates that a larger mean stress in tension would lead to a
shorter life. Additionally, the functions become parallel to the
x-axis when the endurance cycles reach 107, representing the
condition in which no fatigue failure would occur.
4 Copyright © 2016 by ASME
Downloaded From: http://proceedings.asmedigitalcollection.asme.org/ on 06/21/2016 Terms of Use: http://www.asme.org/about-asme/terms-of-use

Figure 8. Effect of the Mean Stress on Fatigue Life [16]
The Morrow mean stress correction is recommended for
Brown-Miller criterion [16]. After the Morrow mean stress
correction is applied, the Brown Miller equation (Equation 2)
becomes Equation 6, with a corrected elastic term by subtracting
the mean normal stress on the plane, 𝜎𝑛,𝑚.
∆𝛾𝑚𝑎𝑥
2+
∆𝜀𝑛
2= 1.65
(𝜎𝑓′ −𝜎𝑛,𝑚)
𝐸(2𝑁𝑓)𝑏 + 1.75𝜀𝑓
′ (2𝑁𝑓)𝑐 (6)
where, 𝜎𝑛,𝑚 = mean normal stress
Δγmax/2, Δε/2, 𝜎𝑓′, 𝜀𝑓
′ , b, and c are the same as those in
Equations 1 and 2.
PRELIMINARY RESULTS AND DISCUSSION
With the loading history, material properties, fatigue
algorithm, and mean stress correction method properly assigned,
the fatigue analyses were then performed. The results of this
parametric study were organized and presented as follows. The
estimated fatigue life at rail end upper fillet varies with different
impact wheel load factors and crosstie support configurations
(Figure 9).
Figure 9. Estimated Fatigue Life at Rail End Upper Fillet
The effect of various wheel load impact factors can be
observed in Figure 9. When the impact wheel load factor
increases, the estimated fatigue life at the rail end upper fillet
decreases for all three crosstie support configurations. This is
due to the increasing stress and deflection at the rail joint as
impact wheel load factors increase. More specifically, the
endurance cycles reach 107 cycles for all three crosstie support
configurations, indicating that no fatigue damage occurs at rail
end upper fillet when the impact wheel load factor is at 1.33.
When the impact wheel load factor reaches 3.0, the estimated
fatigue life at rail end upper fillet decreases and becomes lower
than 107 cycles, and fatigue damage is likely to occur at upper
fillet for all the three crosstie support configurations.
Crosstie support configuration also plays a significant role
as shown in Figure 9. Rail joints with “suspended” and
“supported” configurations would not be likely to have fatigue
failure at upper fillet area when the impact wheel load factor
remains less than 2.0, while it is likely for rail joint to experience
upper fillet damage with a broken plate configuration under the
impact wheel load factor of 2.0. A clearer comparison of the
three crosstie support configurations could be made when the
impact wheel load factor was set to be 3.0, where it can be seen
that the rail joint with “supported” configuration performs better
than the rail joint with “suspended” configuration with respect to
the fatigue life at upper fillet area, and the rail joint with “broken
plate” configuration has the shortest estimated upper fillet
fatigue life.
Palmgren-Miner Rule
The results shown previously are made under the
assumption that the impact wheel load factors are fixed at 1.33,
2.0, or 3.0, respectively. In the field, however, the impact
wheel load factor varies from wheel to wheel, which could
influence the prediction of fatigue life and needs to be considered
in this study by adopting the Palmgren-Miner rule [15]. The
Palgrem-Miner rule is a linear cumulative-damage theory as
shown in Equation 7. It suggests that the damage occurs when
the summation of all life fractions reaches unity. In this
research, three life fractions are considered, which are labeled
with the corresponding impact wheel load factors.
∑𝑛𝑖
𝑁𝑖=
𝑛1.33
𝑁1.33+
𝑛2.0
𝑁2.0+
𝑛3.0
𝑁3.0= 1 (Unity) (7)
where, Ni = fatigue life corresponding to impact factor i
ni = number of cycles carried out at impact factor i
ni/Ni = life fraction corresponding to impact factor i
Table 3. Example Results for Rail Joint with Broken Plate
Impact
Factor
Fatigue Life
(Cycles, Ni)
Elapsed Life
(Cycles, ni)
1.33 N1.33 = 1.0 × 10⁷
(No damage) n1.33
2.0 N2.0 = 2.53 × 10⁶ n2.0
3.0 N3.0 = 3.29 × 10⁴ n3.0
Note: When using Equation 7, N1.33 should be substituted in as infinity.
5 Copyright © 2016 by ASME
Downloaded From: http://proceedings.asmedigitalcollection.asme.org/ on 06/21/2016 Terms of Use: http://www.asme.org/about-asme/terms-of-use

Take the rail joint with broken plate configuration as an
example, the results of which are shown in Table 3. The fatigue
lives (Ni) are estimated using the methods described earlier.
With a certain number of passing trains, the elapsed lives (ni)
could be estimated if the probability distribution of impact wheel
load factors could be captured in field test. Equation 7 could
then be used to predict the number of trains that the rail joint can
hold before damage occurs at the rail end upper fillet. The
fatigue life corresponding to impact wheel load factor of 1.33
(N1.33) should be substituted in Equation 7 as infinity, and the first
portion of that equation would equal zero, such that the running
wheels with impact factor of 1.33 would cause no damage to the
upper fillet.
CONCLUSIONS
This paper focuses on the influence of impact wheel load
factor and crosstie support configuration on fatigue performance
at the rail end upper fillet area among bolted rail joints. A
parametric study was performed using a fatigue analysis
software, fe-safe, based on the stresses calculated in prior work.
According to the results from this fatigue parametric study, the
following conclusions can be drawn:
The estimated fatigue life of rail end upper fillet
decreases as the impact wheel load factor increases.
Under the fatigue analysis assumptions and criteria in
this study, fatigue damage would not be likely to occur
if the impact wheel load factor is below 1.33, even
under the worst case scenario with “broken plate”
configuration;
The “supported” rail joint configuration performs better
than the “suspended” rail joint configuration with
respect to the fatigue life at upper fillet area, and the rail
joint with “broken plate” configuration has the shortest
estimated upper fillet fatigue life among the three
crosstie support configurations.
The understanding of the probability distribution of
impact wheel load factors in the field could help predict
the fatigue life in terms of a number of passing trains.
The estimated fatigue life from this model will need to
be verified through experiments before these results can
be accurately applied into field practice.
ACKNOWLEDGMENTS
This research was supported by WSP | Parsons Brinckerhoff
and New York City Transit (NYCTA), and the National
University Rail (NURail) Center, and was based on background
information that was provided under a broader research program
for WSP | Parsons Brinckerhoff and NYCTA. The authors
would like to thank WSP | Parsons Brinckerhoff, NYCTA
Inspections and Testing, and NYCTA Track Engineering for
providing leadership and oversight for the broader work that this
paper was associated with. The authors would also like to
thank Prof. Don Uzarski and Michael Yang from the University
of Illinois at Urbana-Champaign (UIUC), and Michael Carolan
from Volpe National Transportation Center for their assistance
and advice. The opinions expressed in this article are solely
those of the authors and do not represent the opinions of the
funding agency. J. Riley Edwards has been supported in part
by grants to the UIUC Rail Transportation and Engineering
Center (RailTEC) from CN, and Hanson Professional Services.
REFERENCES
[1] Akhtar, M. N. and D. D. Davis. 2013. Load Environment
of Rail Joint Bars- Phase I: Effects of Track Parameters on
Rail Joint Stresses and Crack Growth. Final Report,
DOT/FRA/ORD-13/24.
[2] Wen, Z., X. Jin, and W. Zhang. 2005. Contact-Impact
Stress Analysis of Rail Joint Region Using the Dynamic
Finite Element Method. Wear, Volume 258, Issue 7, pp.
1301-1309.
[3] American Railway Engineering and Maintenance-of-Way
Association. Manual for Railway Engineering. 2015.
[4] Jeong, D.Y., R. Bruzek, and A. Tajaddini. 2014
Engineering Studies on Joint Bar Integrity, Part I: Field
Surveys and Obvsered Failure Modes. Proceedings of the
2014 Joint Rail Conference, JRC 2014-3706, April 2014,
Colorado Springs, CO.
[5] Carolan, M.E., D.Y. Jeong, and A.B. Perlman. 2014.
Engiheering Studies on Joint Bar Integrity, Part II: Finite
Element Analysis. Proceedings of the 2014 Joint Rail
Conference, JRC 2014-3708, April 2014, Colorado
Springs, CO.
[6] Orringer, O., J.M. Morris, and R.K. Steele. 1984. Applied
Research on Rail Fatigue and Fracture in the United States.
Theoretical and Applied Fracture Mechanics, Volume 1,
Issue 1, pp. 23-49.
[7] Jeong, D. Y. 2001. Progress in Rail Integrity Research.
Final Report, DOT/FRA/ORD-01/18.
[8] Mayville, R. A. and P. D. Hilton. 1984. Fracture Mechanics
Analysis of a Rail-End Bolt-Hole Crack. Theoretical and
Applied Fracture Mechanics, Volume 1, Issue 1, pp. 51-60.
[9] Mayville, R. A. and R. G. Stringfellow. 1993. Development
and Application of Rail Defect Fracture Models to Assess
Remedial Actions. Final Report, DOT/FRA/ORD-93/33.
[10] Mayville, R. A. and R. G. Stringfellow. 1995. Numerical
Analysis of a Railroad Bolt-Hole Fracture Problem.
Theoretical and Applied Fracture Mechanics, Volume 24,
Issue 1, pp. 1-12.
[11] Sih, G.C. and D.Y. Tzou. 1985. Rail-End Bolt-Hole Fatigue
Crack in Three Dimensions. Theoretical and Applied
Fracture Mechanics, Volume 3, Issue 2, pp. 97-111.
[12] Federal Railroad Administration. Track Inspector Rail
Defect Reference Manual. 2015.
[13] Zhu, K., R. Edwards, Y. Qian, and B. Andrawes. 2016.
Finite Element Analysis of the Effects of Bolt Condition on
Bolted Rail Joints Stresses. Transportation Research
Record: Journal of the Transportation Research Board
(Accepted)
6 Copyright © 2016 by ASME
Downloaded From: http://proceedings.asmedigitalcollection.asme.org/ on 06/21/2016 Terms of Use: http://www.asme.org/about-asme/terms-of-use

[14] Fe-safe. 2014. Material Database. Safe Technology
Limited.
[15] Meyers, M. A., and K. K. Chawla. 2009. Mechanical
behavior of materials. Volume 2. Cambridge University
Press.
[16] Fe-safe. 2002. Fatigue Theory Reference Manual. Volume
2. Safe Technology Limited.
7 Copyright © 2016 by ASME
Downloaded From: http://proceedings.asmedigitalcollection.asme.org/ on 06/21/2016 Terms of Use: http://www.asme.org/about-asme/terms-of-use


![of recycled rail...BS EN 13674-1:2011 [4] verifies that one of the tests for rail steel is high cycle fatigue testing. The recycled rail should meet the fatigue test qualifying criteria](https://static.fdocuments.in/doc/165x107/610f289438a9be32bf6248d5/of-recycled-rail-bs-en-13674-12011-4-verifies-that-one-of-the-tests-for-rail.jpg)