Fatigue analysis of box-girder webs subjected to in-plane shear and transverse bending induced by...
14
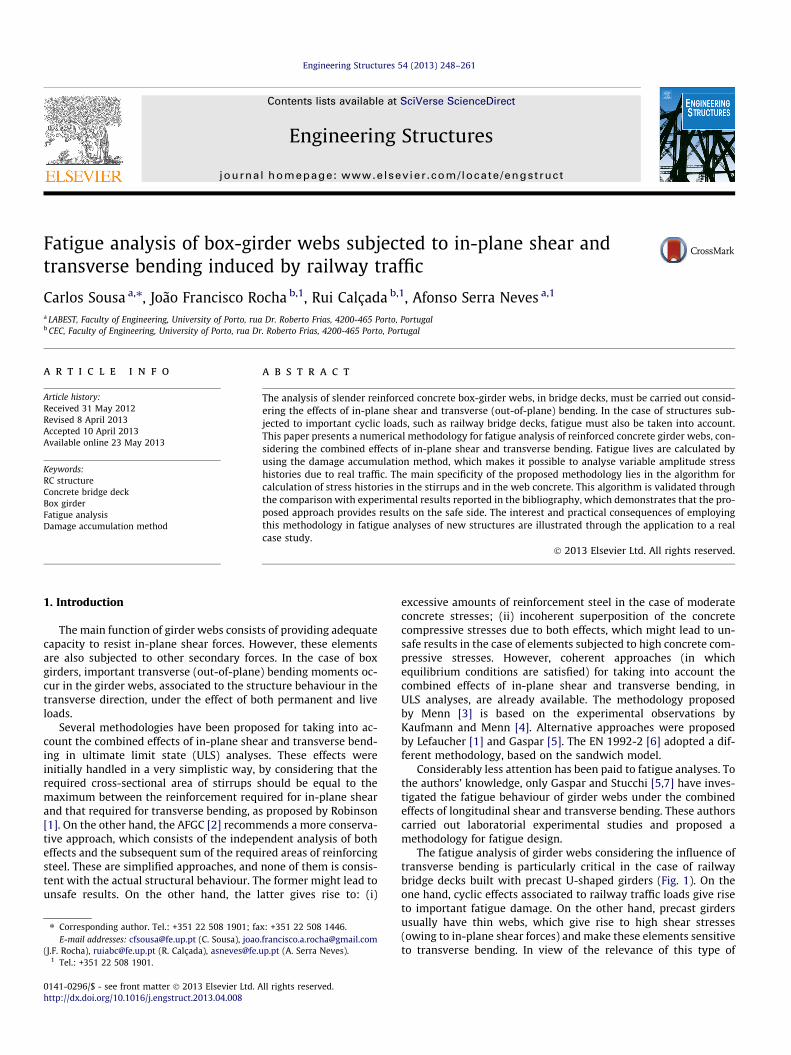
Fatigue analysis of box-girder webs subjected to in-plane shear and transverse bending induced by railway traffic Carlos Sousa a,⇑ , João Francisco Rocha b,1 , Rui Calçada b,1 , Afonso Serra Neves a,1 a LABEST, Faculty of Engineering, University of Porto, rua Dr. Roberto Frias, 4200-465 Porto, Portugal b CEC, Faculty of Engineering, University of Porto, rua Dr. Roberto Frias, 4200-465 Porto, Portugal article info Article history: Received 31 May 2012 Revised 8 April 2013 Accepted 10 April 2013 Available online 23 May 2013 Keywords: RC structure Concrete bridge deck Box girder Fatigue analysis Damage accumulation method abstract The analysis of slender reinforced concrete box-girder webs, in bridge decks, must be carried out consid- ering the effects of in-plane shear and transverse (out-of-plane) bending. In the case of structures sub- jected to important cyclic loads, such as railway bridge decks, fatigue must also be taken into account. This paper presents a numerical methodology for fatigue analysis of reinforced concrete girder webs, con- sidering the combined effects of in-plane shear and transverse bending. Fatigue lives are calculated by using the damage accumulation method, which makes it possible to analyse variable amplitude stress histories due to real traffic. The main specificity of the proposed methodology lies in the algorithm for calculation of stress histories in the stirrups and in the web concrete. This algorithm is validated through the comparison with experimental results reported in the bibliography, which demonstrates that the pro- posed approach provides results on the safe side. The interest and practical consequences of employing this methodology in fatigue analyses of new structures are illustrated through the application to a real case study. Ó 2013 Elsevier Ltd. All rights reserved. 1. Introduction The main function of girder webs consists of providing adequate capacity to resist in-plane shear forces. However, these elements are also subjected to other secondary forces. In the case of box girders, important transverse (out-of-plane) bending moments oc- cur in the girder webs, associated to the structure behaviour in the transverse direction, under the effect of both permanent and live loads. Several methodologies have been proposed for taking into ac- count the combined effects of in-plane shear and transverse bend- ing in ultimate limit state (ULS) analyses. These effects were initially handled in a very simplistic way, by considering that the required cross-sectional area of stirrups should be equal to the maximum between the reinforcement required for in-plane shear and that required for transverse bending, as proposed by Robinson [1]. On the other hand, the AFGC [2] recommends a more conserva- tive approach, which consists of the independent analysis of both effects and the subsequent sum of the required areas of reinforcing steel. These are simplified approaches, and none of them is consis- tent with the actual structural behaviour. The former might lead to unsafe results. On the other hand, the latter gives rise to: (i) excessive amounts of reinforcement steel in the case of moderate concrete stresses; (ii) incoherent superposition of the concrete compressive stresses due to both effects, which might lead to un- safe results in the case of elements subjected to high concrete com- pressive stresses. However, coherent approaches (in which equilibrium conditions are satisfied) for taking into account the combined effects of in-plane shear and transverse bending, in ULS analyses, are already available. The methodology proposed by Menn [3] is based on the experimental observations by Kaufmann and Menn [4]. Alternative approaches were proposed by Lefaucher [1] and Gaspar [5]. The EN 1992-2 [6] adopted a dif- ferent methodology, based on the sandwich model. Considerably less attention has been paid to fatigue analyses. To the authors’ knowledge, only Gaspar and Stucchi [5,7] have inves- tigated the fatigue behaviour of girder webs under the combined effects of longitudinal shear and transverse bending. These authors carried out laboratorial experimental studies and proposed a methodology for fatigue design. The fatigue analysis of girder webs considering the influence of transverse bending is particularly critical in the case of railway bridge decks built with precast U-shaped girders (Fig. 1). On the one hand, cyclic effects associated to railway traffic loads give rise to important fatigue damage. On the other hand, precast girders usually have thin webs, which give rise to high shear stresses (owing to in-plane shear forces) and make these elements sensitive to transverse bending. In view of the relevance of this type of 0141-0296/$ - see front matter Ó 2013 Elsevier Ltd. All rights reserved. http://dx.doi.org/10.1016/j.engstruct.2013.04.008 ⇑ Corresponding author. Tel.: +351 22 508 1901; fax: +351 22 508 1446. E-mail addresses: [email protected] (C. Sousa), [email protected] (J.F. Rocha), [email protected] (R. Calçada), [email protected] (A. Serra Neves). 1 Tel.: +351 22 508 1901. Engineering Structures 54 (2013) 248–261 Contents lists available at SciVerse ScienceDirect Engineering Structures journal homepage: www.elsevier.com/locate/engstruct
Transcript of Fatigue analysis of box-girder webs subjected to in-plane shear and transverse bending induced by...
Engineering Structures 54 (2013) 248–261
Contents lists available at SciVerse ScienceDirect
Engineering Structures
journal homepage: www.elsevier .com/locate /engstruct
Fatigue analysis of box-girder webs subjected to in-plane shear andtransverse bending induced by railway traffic
0141-0296/$ - see front matter � 2013 Elsevier Ltd. All rights reserved.http://dx.doi.org/10.1016/j.engstruct.2013.04.008
⇑ Corresponding author. Tel.: +351 22 508 1901; fax: +351 22 508 1446.E-mail addresses: [email protected] (C. Sousa), [email protected]
(J.F. Rocha), [email protected] (R. Calçada), [email protected] (A. Serra Neves).1 Tel.: +351 22 508 1901.
Carlos Sousa a,⇑, João Francisco Rocha b,1, Rui Calçada b,1, Afonso Serra Neves a,1
a LABEST, Faculty of Engineering, University of Porto, rua Dr. Roberto Frias, 4200-465 Porto, Portugalb CEC, Faculty of Engineering, University of Porto, rua Dr. Roberto Frias, 4200-465 Porto, Portugal
a r t i c l e i n f o a b s t r a c t
Article history:Received 31 May 2012Revised 8 April 2013Accepted 10 April 2013Available online 23 May 2013
Keywords:RC structureConcrete bridge deckBox girderFatigue analysisDamage accumulation method
The analysis of slender reinforced concrete box-girder webs, in bridge decks, must be carried out consid-ering the effects of in-plane shear and transverse (out-of-plane) bending. In the case of structures sub-jected to important cyclic loads, such as railway bridge decks, fatigue must also be taken into account.This paper presents a numerical methodology for fatigue analysis of reinforced concrete girder webs, con-sidering the combined effects of in-plane shear and transverse bending. Fatigue lives are calculated byusing the damage accumulation method, which makes it possible to analyse variable amplitude stresshistories due to real traffic. The main specificity of the proposed methodology lies in the algorithm forcalculation of stress histories in the stirrups and in the web concrete. This algorithm is validated throughthe comparison with experimental results reported in the bibliography, which demonstrates that the pro-posed approach provides results on the safe side. The interest and practical consequences of employingthis methodology in fatigue analyses of new structures are illustrated through the application to a realcase study.
� 2013 Elsevier Ltd. All rights reserved.
1. Introduction
The main function of girder webs consists of providing adequatecapacity to resist in-plane shear forces. However, these elementsare also subjected to other secondary forces. In the case of boxgirders, important transverse (out-of-plane) bending moments oc-cur in the girder webs, associated to the structure behaviour in thetransverse direction, under the effect of both permanent and liveloads.
Several methodologies have been proposed for taking into ac-count the combined effects of in-plane shear and transverse bend-ing in ultimate limit state (ULS) analyses. These effects wereinitially handled in a very simplistic way, by considering that therequired cross-sectional area of stirrups should be equal to themaximum between the reinforcement required for in-plane shearand that required for transverse bending, as proposed by Robinson[1]. On the other hand, the AFGC [2] recommends a more conserva-tive approach, which consists of the independent analysis of botheffects and the subsequent sum of the required areas of reinforcingsteel. These are simplified approaches, and none of them is consis-tent with the actual structural behaviour. The former might lead tounsafe results. On the other hand, the latter gives rise to: (i)
excessive amounts of reinforcement steel in the case of moderateconcrete stresses; (ii) incoherent superposition of the concretecompressive stresses due to both effects, which might lead to un-safe results in the case of elements subjected to high concrete com-pressive stresses. However, coherent approaches (in whichequilibrium conditions are satisfied) for taking into account thecombined effects of in-plane shear and transverse bending, inULS analyses, are already available. The methodology proposedby Menn [3] is based on the experimental observations byKaufmann and Menn [4]. Alternative approaches were proposedby Lefaucher [1] and Gaspar [5]. The EN 1992-2 [6] adopted a dif-ferent methodology, based on the sandwich model.
Considerably less attention has been paid to fatigue analyses. Tothe authors’ knowledge, only Gaspar and Stucchi [5,7] have inves-tigated the fatigue behaviour of girder webs under the combinedeffects of longitudinal shear and transverse bending. These authorscarried out laboratorial experimental studies and proposed amethodology for fatigue design.
The fatigue analysis of girder webs considering the influence oftransverse bending is particularly critical in the case of railwaybridge decks built with precast U-shaped girders (Fig. 1). On theone hand, cyclic effects associated to railway traffic loads give riseto important fatigue damage. On the other hand, precast girdersusually have thin webs, which give rise to high shear stresses(owing to in-plane shear forces) and make these elements sensitiveto transverse bending. In view of the relevance of this type of

Fig. 1. Typical cross section of a railway bridge deck built with precast U-shapedgirders.
C. Sousa et al. / Engineering Structures 54 (2013) 248–261 249
structure in the construction of modern railway infrastructure, amethodology for fatigue analysis of girder webs in railway bridgedecks was developed. This methodology was implemented in aWindows based application and was validated through the com-parison with experimental results obtained by Gaspar [5].
The proposed methodology is based on the damage accumula-tion method (DAM). Therefore, it is suitable for the calculation ofthe fatigue damage induced by variable time histories of shearforces and bending moments, owing to the passage of real trains.The calculation of internal forces is carried out by means of lineardynamic analyses, so that dynamic effects can be taken into ac-count. The main specificity of this methodology, which is dealtwith in this work, lies in the calculation of stress histories in thestirrups and in the web concrete.
The actual structural response of girder webs subjected to in-plane shear and transverse bending is complex and involves sev-eral non-linear mechanisms, associated to the non-linear cyclicbehaviour of the concrete, the cracks, and the interaction betweensteel and concrete. Instead of explicitly handling all these non-linear mechanisms, the approach adopted in this work consists ofusing a simplified algorithm for stress calculations, which isvalidated through the comparison with experimental results. Thesimplicity of the developed algorithm makes it suitable to be usedin the design practice, for calculation of stresses due to variablehistories of internal forces, which in turn can be determinedthrough linear dynamic analyses. The algorithm is based on equi-librium conditions and simplifying assumptions for the definitionof concrete stresses’ distribution (which, in turn, are based onthe experimental observations of Gaspar [5]).
The organisation of the text is as follows. Firstly, the proposedmethodology for fatigue analyses is described. Special emphasisis given to the algorithm for stress calculations. Then, the mainconclusions drawn from the validation through the comparisonwith experimental results are presented. Finally, the practical con-sequences of employing this methodology in the fatigue analysis ofnew structures are shown through the application to a real casestudy.
2. Proposed methodology for fatigue analysis
The DAM is a general procedure for fatigue analysis of struc-tures subjected to variable-amplitude cyclic loading. It is employedin this work and involves the following analysis steps [8]:
� definition of the traffic scenario (train types, frequent operatingspeeds and annual traffic volume);� calculation of the history of in-plane shear forces and transverse
bending moments, including dynamic enhancement (dynamicanalyses shall be carried out in the case of high-speed railwaytraffic, and proper models shall be used for the distribution ofthe axle forces through the rails, sleepers and ballast [9,10]);� calculation of stress histories for both the stirrups and the con-
crete, considering the combined effect of in-plane shear andtransverse bending (a specific algorithm for this purpose is pre-sented below);
� calculation of stress histograms, representing the distribution ofstress ranges versus the corresponding number of cycles, byusing a cycle counting algorithm, e.g. the rain-flow algorithm[11];� adoption of suitable S–N curves to describe the fatigue resis-
tance of the materials; in this work, the curves proposed bythe EN 1992-1-1 [12] (for steel) and by the EN 1992-2 [6] (forconcrete) are employed; the strength reduction factor m, whichaccounts for the influence of transverse tension in terms of fati-gue strength of the compression struts, is taken as 0.7;� computation of the fatigue damage, by using a linear damage
accumulation model, as proposed by Miner [13], according towhich the damage factor, D, is given by:
D ¼X
i
ni
Nið1Þ
where ni is the number of applied load cycles for a given stressrange and Ni denotes the number of resisting load cycles for thesame stress range. Fatigue failure is reached for D = 1.
� the fatigue life, in years, is given by the inverse of the damagefactor for 1 year of traffic.
In the case of reinforced concrete (RC) structures, the accumu-lated fatigue damage is typically negligible if cracking does not oc-cur under service load levels, owing to the reduced amplitude ofthe applied stress ranges. Therefore, the fatigue analysis of the gir-der webs is to be conducted only if the maximum applied concretestress (for service load levels) exceeds the tensile strength.
2.1. Stress calculations
The proposed methodology for stress calculations involves atruss model for taking into account the effects of in-plane shearand an algorithm for calculation of the additional stresses due totransverse bending.
2.1.1. Sole effect of in-plane shearThe possible types of shear fatigue failure in beams with shear
reinforcement were identified by the RILEM Committee 36 RDL[14] and correspond to concrete fatigue failures (either in the com-pression chord or in the web) and steel fatigue failures (either inthe stirrups or in the longitudinal tension reinforcement). The mostfrequently observed failure mode in fatigue tests is the fatigue fail-ure of the stirrups. Therefore, this mode has received more atten-tion. This failure mode strongly depends on the fatigueproperties of the reinforcement. However, the application of the fa-tigue test results for straight bars tested in the air to shear rein-forcement is more complex that the application of such testresults to bending reinforcement, because: (i) the actual stress his-tory in the stirrups can be very complicated, even in the case ofconstant amplitude loading; (ii) fatigue failures might occur atthe stirrup bents, which might contribute to reduced fatiguestrength; (iii) shear cracks usually cross the stirrups at skew angles,which gives rise to additional stresses due to dowelling and othereffects that might impair the fatigue strength. Consequently, thecalculation of realistic stress levels acting in shear reinforcementis more complex than analogous calculations for bending tensilereinforcement. However, it has been shown that the stress distri-bution in shear reinforcements becomes more uniform (amongthe various stirrups) as the number of load cycles increases andthe cracking pattern stabilizes. Moreover, it has also been shownthat the shear fatigue strength is not impaired by the reducedfatigue strength at the stirrup bents, i.e., shear fatigue strength isgoverned by the characteristics of the straight portion of the
250 C. Sousa et al. / Engineering Structures 54 (2013) 248–261
stirrups [15–18], because the maximum stirrup stresses do not oc-cur at the bent.
Despite the complexity of the structural behaviour under the ef-fect of cyclic shear forces, stress calculations for fatigue verifica-tions are usually based on variable-inclination truss models [8].This procedure was recommended by Frey [17] and was adoptedby the MC90 [19], by the Eurocodes [6,12] and by the UIC [20].According to this model, the stresses in the compression struts,rcw, and in the stirrups, rsw, are determined from equilibrium con-siderations and take the following values:
rcw ¼V
bw � z � sin h � cos hð2Þ
rsw ¼V
Asws � z � cot h
ð3Þ
where V is the shear force, bw is the web thickness, z is the internallever arm for longitudinal bending, h is the inclination of the com-pression struts and Asw/s is the cross-sectional area of stirrups perunit length. The tensile force in the stirrups is balanced by the com-pression force in the web concrete, in the direction of the stirrups,per unit length, C:
C ¼ Vz � cot h
ð4Þ
The compression force in the struts, acting in the direction h, perunit length is given by:
Fcw;unit ¼V
z � sin h � cos hð5Þ
The inclination of the compression struts to be used in fatigueanalyses, hfat, depends on the minimum admissible inclination forULS verifications, hULS [12,19,20]:
tanðhfatÞ ¼ffiffiffiffiffiffiffiffiffiffiffiffiffiffiffiffiffiffiffitanðhULSÞ
p6 1 ð6Þ
This condition reflects the fact that the stress calculations forservice load levels must be carried out considering concrete strutsmore vertically oriented in comparison with the inclination consid-ered in ULS calculations.
2.1.2. Combined effects of in-plane shear and transverse bendingIf a girder web is subjected to transverse bending moments, in
addition to in-plane shear forces, the transverse bending momentresistance will be essentially provided by two mechanisms:
� the eccentricity of the compression strut (part of the transversebending moment can be resisted through a lateral shift of thecompression strut, without modification of the stirrup stresses,as shown by Kaufmann and Menn [4] and by Gaspar [5]);� pure transverse bending of the web, with increasing tensile
stresses in the stirrup leg on the flexural tensile side, decreasingtensile stresses in the stirrup leg on the flexural compressionside and increasing compression stresses on the flexural com-pression side.
As mentioned before, the calculation of applied stresses shouldideally be based on non-linear analyses with a proper descriptionof the constitutive behaviours under cyclic loading. However, thatapproach would not be feasible for the design of new structures.Also note that detailed analysis procedures for calculation of theredistribution of concrete stresses in beams subjected to axialforces and bending moments have already been developed[21,22]. However, such procedures have not been applied to prob-lems of in-plane shear and transverse bending yet. Therefore, asimplified approach for stress calculations was developed, consid-ering as premises that it should be as simple as possible, but, at the
same time, it should provide a realistic description of the appliedstresses and observe the common assumptions adopted in serviceanalyses of concrete structures: compression stresses vary linearlyover the web thickness, and tensile stresses in the concrete are notadmitted.
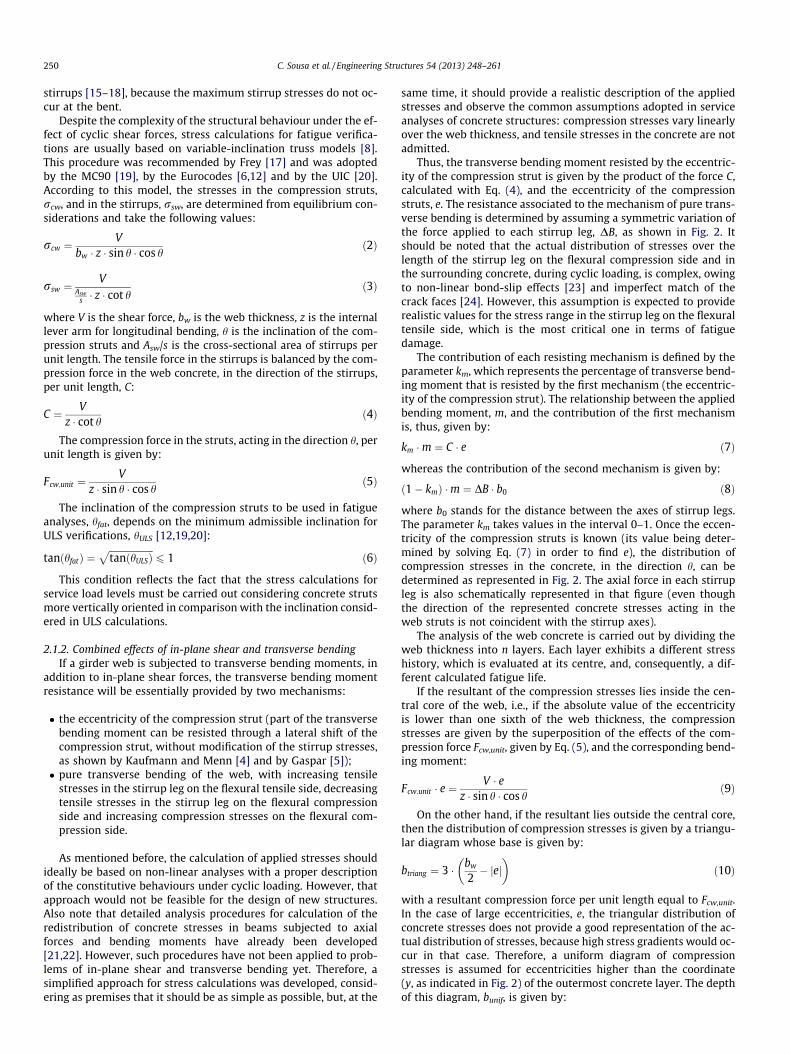
Thus, the transverse bending moment resisted by the eccentric-ity of the compression strut is given by the product of the force C,calculated with Eq. (4), and the eccentricity of the compressionstruts, e. The resistance associated to the mechanism of pure trans-verse bending is determined by assuming a symmetric variation ofthe force applied to each stirrup leg, DB, as shown in Fig. 2. Itshould be noted that the actual distribution of stresses over thelength of the stirrup leg on the flexural compression side and inthe surrounding concrete, during cyclic loading, is complex, owingto non-linear bond-slip effects [23] and imperfect match of thecrack faces [24]. However, this assumption is expected to providerealistic values for the stress range in the stirrup leg on the flexuraltensile side, which is the most critical one in terms of fatiguedamage.
The contribution of each resisting mechanism is defined by theparameter km, which represents the percentage of transverse bend-ing moment that is resisted by the first mechanism (the eccentric-ity of the compression strut). The relationship between the appliedbending moment, m, and the contribution of the first mechanismis, thus, given by:
km �m ¼ C � e ð7Þ
whereas the contribution of the second mechanism is given by:
ð1� kmÞ �m ¼ DB � b0 ð8Þ
where b0 stands for the distance between the axes of stirrup legs.The parameter km takes values in the interval 0–1. Once the eccen-tricity of the compression struts is known (its value being deter-mined by solving Eq. (7) in order to find e), the distribution ofcompression stresses in the concrete, in the direction h, can bedetermined as represented in Fig. 2. The axial force in each stirrupleg is also schematically represented in that figure (even thoughthe direction of the represented concrete stresses acting in theweb struts is not coincident with the stirrup axes).
The analysis of the web concrete is carried out by dividing theweb thickness into n layers. Each layer exhibits a different stresshistory, which is evaluated at its centre, and, consequently, a dif-ferent calculated fatigue life.
If the resultant of the compression stresses lies inside the cen-tral core of the web, i.e., if the absolute value of the eccentricityis lower than one sixth of the web thickness, the compressionstresses are given by the superposition of the effects of the com-pression force Fcw,unit, given by Eq. (5), and the corresponding bend-ing moment:
Fcw;unit � e ¼V � e
z � sin h � cos hð9Þ
On the other hand, if the resultant lies outside the central core,then the distribution of compression stresses is given by a triangu-lar diagram whose base is given by:
btriang ¼ 3 � bw
2� jej
� �ð10Þ
with a resultant compression force per unit length equal to Fcw,unit.In the case of large eccentricities, e, the triangular distribution ofconcrete stresses does not provide a good representation of the ac-tual distribution of stresses, because high stress gradients would oc-cur in that case. Therefore, a uniform diagram of compressionstresses is assumed for eccentricities higher than the coordinate(y, as indicated in Fig. 2) of the outermost concrete layer. The depthof this diagram, bunif, is given by:
Fig. 2. Schematic representation of the distribution of compression stresses in the web struts and forces in the stirrup legs.
C. Sousa et al. / Engineering Structures 54 (2013) 248–261 251
bunif ¼ bw � 2 � jej ð11Þ
If the depth of the compression diagram is inferior to half thewidth of the concrete layer, the stress at the point where the stres-ses are evaluated (the centre of the layer), becomes zero. In thatcase, the stress considered in fatigue calculations for the outermostconcrete layer is not zero, but the calculated uniform stress.
The main difficulty in the application of the proposed method-ology lies in the fact that the actual value of the parameter km is notknown. Note that, in the case of ULS analyses, the limit stress re-sisted by the concrete is known in advance, and consequently,the applied stresses in the concrete and in the stirrups can bedetermined by equilibrium conditions, as shown by Menn [3]. Onthe contrary, in the case of fatigue analyses (which are carriedout for service load levels), the concrete stress is not known before-hand and, consequently, a closed form solution to calculate the rel-ative contribution of the mechanism of eccentricity of thecompression struts could not be obtained. Therefore, fatigue lifecalculations are carried out for different km values, so that conser-vative results are obtained. As explained before, this parametercorresponds to the percentage of the transverse bending momentthat can be resisted through the eccentricity of the compressionstruts. Therefore, this parameter cannot assume values whichwould give rise to inadmissible eccentricities of the compressionstruts (resultant of the compression struts outside the cross sec-tion, or eccentricities which correspond to inadmissibly small com-pression strut widths).
It is also important to take into consideration the conclusionsdrawn by Gaspar [5], who carried out fatigue tests in beams
subjected to in-plane shear and transverse bending. This authorfound that the percentage of transverse bending that is equili-brated by the eccentricity of the compression struts depends onthe capacity of the web struts to withstand bending. In otherwords, it can be said that if a given km value would give rise to veryhigh concrete compression stresses, than that km value is not plau-sible, i.e., the real contribution of the mechanism of eccentricity ofthe compression struts will most likely be defined by a lower km
value.It is also important to note that the lower the km value, the more
conservative the calculations of steel fatigue lives, and the less con-servative the estimated concrete fatigue lives are.
Thus, the criterion for a conservative definition of the range ofkm values to be considered in fatigue analyses is as follows.
Extreme values of the interval 0–1 are initially not considered,because they correspond to the absence of one of the resistancemechanisms. This criterion is consistent with the experimentalobservations of Gaspar [5], who found that some variation of thestirrup stresses always occurs, even for small values of appliedtransverse bending moments. A minimum contribution of 20%from each of the resistance mechanisms is assumed. Thus, the con-crete and the steel fatigue lives are calculated for values of km rang-ing from 0.2 to 0.8 with steps of 0.2, i.e., 0.2, 0.4, 0.6 and 0.8.
Values of km which give rise to an eccentricity of the compres-sion struts greater than the one corresponding to a uniform distri-bution of compressive stresses along the width bw,req/c are notadmitted. The parameter bw,req represents the minimum web thick-ness for ULS verifications, and the reduction factor c is introduced,so that the compression strut’s width for fatigue analyses can
252 C. Sousa et al. / Engineering Structures 54 (2013) 248–261
conservatively be lower than the value required for ULS verifica-tions. That reduction factor shall be greater than the unit, taking,in this work, a value of 1.5. The upper bound limit for the eccentric-ity of the compression struts, emax,fat, is, thus, given by:
emax;fat ¼bw
2� bw;req
2 � c ð12Þ
In the case of girders subjected to reduced in-plane shear forces,this criterion controls the upper bound limit, km,max, for the param-eter km. If km,max is lower than 0.2, then the fatigue analysis must becarried out for a single km value, km = 0. That means that transversebending is resisted through a mechanism of simple bending withan internal lever arm equal to b0.
Otherwise, the fatigue lives of both the steel and the concretemust be checked for all the admissible km values in the range of0.2–0.8, the following exceptions being admitted: (i) km = 0.2 needsnot to be considered if adequate concrete fatigue strength exists forkm values up to 0.8, i.e., if the web concrete has a large capacity toresist transverse bending; (ii) km = 0.8 needs not to be considered ifa safe amount of stirrups exists, i.e., if adequate steel fatiguestrength exists for km values as low as 0.2.
In this way, the fatigue strength of both steel and concrete isconservatively checked for a wide range of admissible km values:values ranging from 0.2 to 0.6 (or km,max, whichever is the mini-mum) or in the interval of 0.4–0.8, depending on whether or notthe mechanism of eccentricity of the compression struts is ableto withstand a large percentage of the applied bending moments.In this way, this criterion is coherent with the conclusions drawnby Gaspar [5], who found that the percentage of transverse bend-ing that is equilibrated by the eccentricity of the compressionstruts does depend on the capacity of the web struts to withstandbending.
3. Validation through the comparison with experimental results
In this section, the validity of the simplifying assumptionsadopted in stress calculations is evaluated and discussed by com-paring numerical predictions and experimental results reportedin the bibliography.
3.1. Structures subjected to the sole effect of in-plane shear
The adequacy of variable-inclination truss models for stress cal-culations (within the scope of fatigue analyses) was evaluatedthrough the comparison with experimental results for RC and pre-stressed concrete (PC) beams subjected to in-plane cyclic shearforces, reported in the bibliography. The experimental results ob-tained by Ruhnau [25], Frey et al. [17,26], Higgins et al.[15,16,27], Price and Edwards [28] and Kreger et al. [18] were usedfor this purpose. A complete description of this comparative anal-ysis can be found elsewhere [29]. It cannot be presented in detail inthis work which is mainly devoted to the combined effects of in-plane shear and transverse bending.
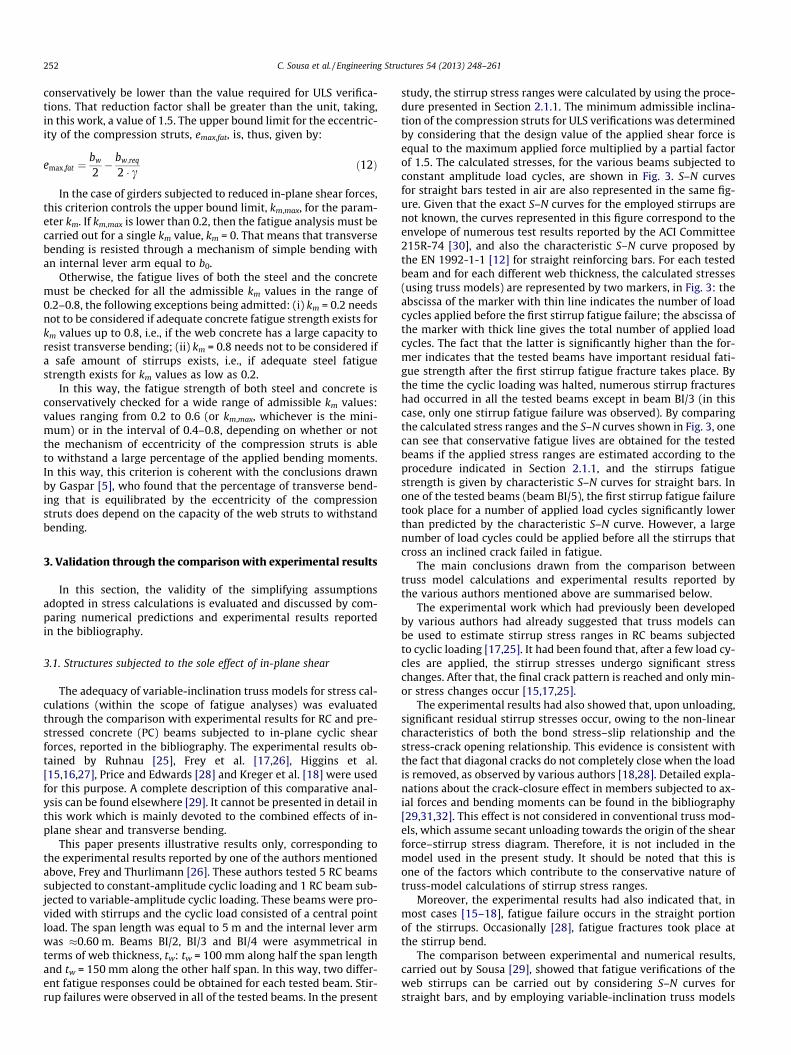
This paper presents illustrative results only, corresponding tothe experimental results reported by one of the authors mentionedabove, Frey and Thurlimann [26]. These authors tested 5 RC beamssubjected to constant-amplitude cyclic loading and 1 RC beam sub-jected to variable-amplitude cyclic loading. These beams were pro-vided with stirrups and the cyclic load consisted of a central pointload. The span length was equal to 5 m and the internal lever armwas �0.60 m. Beams BI/2, BI/3 and BI/4 were asymmetrical interms of web thickness, tw: tw = 100 mm along half the span lengthand tw = 150 mm along the other half span. In this way, two differ-ent fatigue responses could be obtained for each tested beam. Stir-rup failures were observed in all of the tested beams. In the present
study, the stirrup stress ranges were calculated by using the proce-dure presented in Section 2.1.1. The minimum admissible inclina-tion of the compression struts for ULS verifications was determinedby considering that the design value of the applied shear force isequal to the maximum applied force multiplied by a partial factorof 1.5. The calculated stresses, for the various beams subjected toconstant amplitude load cycles, are shown in Fig. 3. S–N curvesfor straight bars tested in air are also represented in the same fig-ure. Given that the exact S–N curves for the employed stirrups arenot known, the curves represented in this figure correspond to theenvelope of numerous test results reported by the ACI Committee215R-74 [30], and also the characteristic S–N curve proposed bythe EN 1992-1-1 [12] for straight reinforcing bars. For each testedbeam and for each different web thickness, the calculated stresses(using truss models) are represented by two markers, in Fig. 3: theabscissa of the marker with thin line indicates the number of loadcycles applied before the first stirrup fatigue failure; the abscissa ofthe marker with thick line gives the total number of applied loadcycles. The fact that the latter is significantly higher than the for-mer indicates that the tested beams have important residual fati-gue strength after the first stirrup fatigue fracture takes place. Bythe time the cyclic loading was halted, numerous stirrup fractureshad occurred in all the tested beams except in beam BI/3 (in thiscase, only one stirrup fatigue failure was observed). By comparingthe calculated stress ranges and the S–N curves shown in Fig. 3, onecan see that conservative fatigue lives are obtained for the testedbeams if the applied stress ranges are estimated according to theprocedure indicated in Section 2.1.1, and the stirrups fatiguestrength is given by characteristic S–N curves for straight bars. Inone of the tested beams (beam BI/5), the first stirrup fatigue failuretook place for a number of applied load cycles significantly lowerthan predicted by the characteristic S–N curve. However, a largenumber of load cycles could be applied before all the stirrups thatcross an inclined crack failed in fatigue.
The main conclusions drawn from the comparison betweentruss model calculations and experimental results reported bythe various authors mentioned above are summarised below.
The experimental work which had previously been developedby various authors had already suggested that truss models canbe used to estimate stirrup stress ranges in RC beams subjectedto cyclic loading [17,25]. It had been found that, after a few load cy-cles are applied, the stirrup stresses undergo significant stresschanges. After that, the final crack pattern is reached and only min-or stress changes occur [15,17,25].
The experimental results had also showed that, upon unloading,significant residual stirrup stresses occur, owing to the non-linearcharacteristics of both the bond stress–slip relationship and thestress-crack opening relationship. This evidence is consistent withthe fact that diagonal cracks do not completely close when the loadis removed, as observed by various authors [18,28]. Detailed expla-nations about the crack-closure effect in members subjected to ax-ial forces and bending moments can be found in the bibliography[29,31,32]. This effect is not considered in conventional truss mod-els, which assume secant unloading towards the origin of the shearforce–stirrup stress diagram. Therefore, it is not included in themodel used in the present study. It should be noted that this isone of the factors which contribute to the conservative nature oftruss-model calculations of stirrup stress ranges.
Moreover, the experimental results had also indicated that, inmost cases [15–18], fatigue failure occurs in the straight portionof the stirrups. Occasionally [28], fatigue fractures took place atthe stirrup bend.
The comparison between experimental and numerical results,carried out by Sousa [29], showed that fatigue verifications of theweb stirrups can be carried out by considering S–N curves forstraight bars, and by employing variable-inclination truss models
Fig. 3. Comparison between stress calculations based on variable inclination truss models and experimental results by Frey and Thurlimann [26] (the markers with thin lineindicate the number of applied load cycles up to the first stirrup fatigue failure, whereas the markers with thick line indicate the total number of applied load cycles).
C. Sousa et al. / Engineering Structures 54 (2013) 248–261 253
for stress calculations, the inclination of the compression struts,hfat, being given by Eq. (6). The adoption of S–N curves for straightbars is justifiable, because even in the cases in which fatigue frac-tures were observed at the stirrup bends [28], fatigue analysesbased on S–N curves for the straight portion of the stirrups (i.e.,without any decrease of the fatigue strength owing to the influenceof bends) led to conservative results. The use of truss models isacceptable because:
� In the case of PC elements, such models provide conservativepredictions for both the observed stress ranges, and the exper-imental fatigue lives.� In the case of non-prestressed members, truss model calcula-
tions considering the inclination hfat given by Eq. (6) did notalways lead to conservative predictions of the measured stressranges. Nevertheless, such calculations provide reasonable esti-mates for the real fatigue lives of the tested beams. In fact, theexperimental fatigue life was lower than the value calculatedconsidering plausible average S–N curves for one of the beamstested by Higgins et al. [15] only. The results obtained for thisbeam do not impair the viability of the adopted analysis meth-odology because the phenomenon under analysis is associatedto an important variability, and calculations based on character-istic S–N curves always provided results on the safe side.
Moreover, it was concluded that the detrimental effects of fret-ting and bending moments installed in the stirrups, owing to rela-tive shear displacements between the crack faces, need not to beexplicitly taken into account, because truss model calculations, inwhich those effects are not explicitly simulated, proved to be safe.
Finally, it is important to note that the analysis procedures pre-sented in the present work were primarily devised for applicationin the design of new structures. This situation must be distinguishedfrom the safety examination of existing constructions which fail tocomply with conservative analysis procedures. While conservativeapproaches (such as the one proposed in the present study) are ade-quate for the design of new structures, more refined assessmentmethodologies are required for the evaluation of existing ones[33]. Stepwise procedures for detailed fatigue examination of criti-cal existing constructions can be found elsewhere [33,34].
3.2. Structures subjected to combined in-plane shear and transversebending
In this section, the results provided by the developed methodol-ogy for stress calculations considering the combined effects of
in-plane shear and transverse bending are compared with theexperimental results reported by Gaspar [5]. This author testedfour I-shaped simply-supported beams. Two of the beams weresubjected to monotonically increasing loads, and the remainingones (beams #3 and #4, whose results are considered here) weresubjected to constant in-plane shear and cyclic transverse bending.The test layout and relevant beams characteristics are shown inFig. 4. Shear is induced by a central point load P, and transversebending is applied by means of eccentric forces F1 and F2, eachforce being distributed over a length of 1 m through steel spreaderbeams.
The fatigue strength of the stirrups was determined through in-air fatigue tests. The fatigue test results are represented by dots inFigs. 5 and 6. The bi-linear S–N curve in double-logarithmic scale,which minimises the squared error with respect to the test results,is also represented in the figure, this being the curve considered inthe calculations.
The tests were conducted as follows. Firstly, a point load P wasapplied at mid-span in order to induce diagonal cracking in thewebs. Then, this load was removed, and different load stages wereapplied. In each stage, the force P was kept constant, and trans-verse bending moments were applied by means of the forces F1and F2, represented in Fig. 4. F2 is a constant amplitude cyclic load,whereas F1 is a constant force, equal to the average of the lowerand upper bound values of F2. The shear forces and transversebending moments applied to the beam web, in each stage, are indi-cated in Table 1. The number of cycles applied in each stage is alsogiven in the same table. The applied transverse bending momentsare calculated by diving the total applied moment by the lengthover which this bending moment is assumed to be evenly distrib-uted, bm. Given the incertitude associated to the quantification ofbm, a parametric analysis is carried out considering two differentvalues, equal to half the beam length (1.90 m) and two thirds ofthe beam length (2.53 m). These are thought to be plausible values,in view of the beam geometry and the load application scheme.
ULS analyses of the tested beams revealed that the compressionstruts are subjected to low compression stress levels. Therefore,the inclination hULS took the minimum admissible value as recom-mended by the EN 1992-1-1 [12] (�22�). The corresponding incli-nation for fatigue analyses, hfat, is given by Eq. (6) and takes a valueof 32.4�.
As explained before, fatigue analyses must be carried out for aset of admissible values for the parameter km. The upper boundlimit for this parameter is determined by the condition that theeccentricity of the compression struts should not exceed the upperlimit imposed by Eq. (12). If Eq. (7) is solved in order to calculate
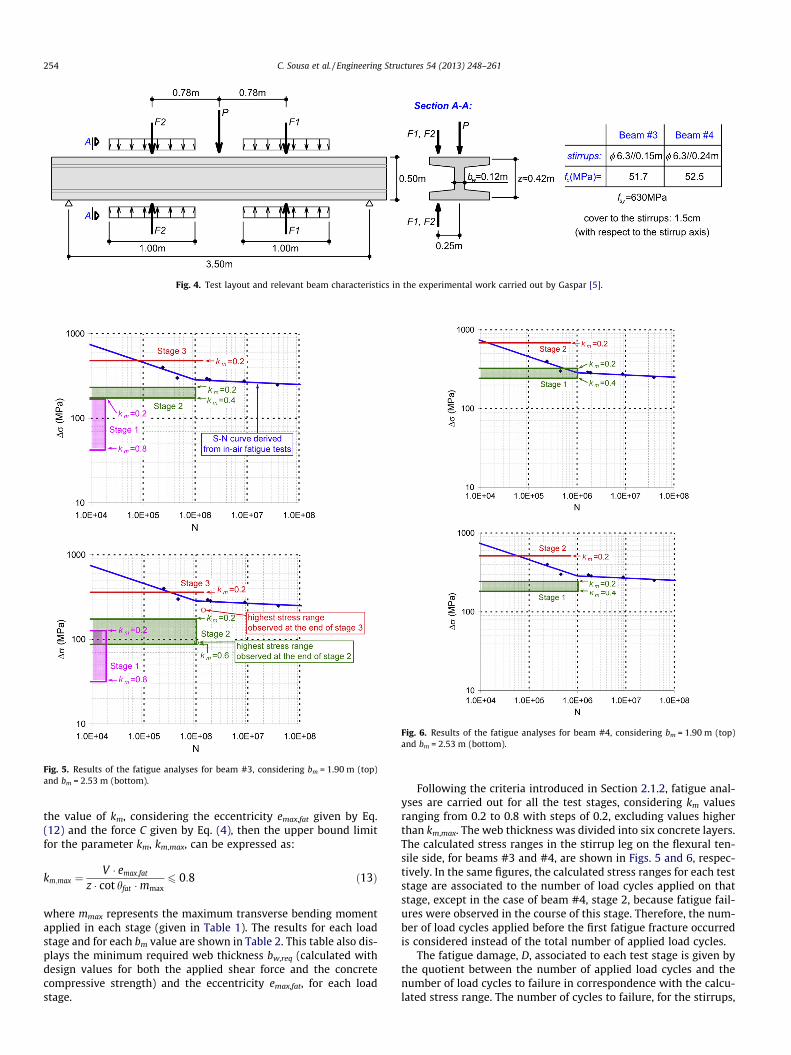
Fig. 4. Test layout and relevant beam characteristics in the experimental work carried out by Gaspar [5].
Fig. 5. Results of the fatigue analyses for beam #3, considering bm = 1.90 m (top)and bm = 2.53 m (bottom).
Fig. 6. Results of the fatigue analyses for beam #4, considering bm = 1.90 m (top)and bm = 2.53 m (bottom).
254 C. Sousa et al. / Engineering Structures 54 (2013) 248–261
the value of km, considering the eccentricity emax,fat given by Eq.(12) and the force C given by Eq. (4), then the upper bound limitfor the parameter km, km,max, can be expressed as:
km;max ¼V � emax;fat
z � cot hfat �mmax6 0:8 ð13Þ
where mmax represents the maximum transverse bending momentapplied in each stage (given in Table 1). The results for each loadstage and for each bm value are shown in Table 2. This table also dis-plays the minimum required web thickness bw,req (calculated withdesign values for both the applied shear force and the concretecompressive strength) and the eccentricity emax,fat, for each loadstage.
Following the criteria introduced in Section 2.1.2, fatigue anal-yses are carried out for all the test stages, considering km valuesranging from 0.2 to 0.8 with steps of 0.2, excluding values higherthan km,max. The web thickness was divided into six concrete layers.The calculated stress ranges in the stirrup leg on the flexural ten-sile side, for beams #3 and #4, are shown in Figs. 5 and 6, respec-tively. In the same figures, the calculated stress ranges for each teststage are associated to the number of load cycles applied on thatstage, except in the case of beam #4, stage 2, because fatigue fail-ures were observed in the course of this stage. Therefore, the num-ber of load cycles applied before the first fatigue fracture occurredis considered instead of the total number of applied load cycles.
The fatigue damage, D, associated to each test stage is given bythe quotient between the number of applied load cycles and thenumber of load cycles to failure in correspondence with the calcu-lated stress range. The number of cycles to failure, for the stirrups,

Table 1Internal forces and number of cycles applied in each test stage.
Stage Number of cycles In-plane shear force (kN) Transverse bending moment due to cyclic load F2 (kN m/m)(assuming bm = 1.90 m) (assuming bm = 2.53 m)Minimum Maximum Minimum Maximum
Beam #31 18,671 103.0 0.66 4.61 0.50 3.462 1,021,395 39.0 0.40 5.82 0.30 4.373 1,400,000 39.4 1.18 12.42 0.89 9.33
Beam #41 1,028,000 26.0 0.53 5.26 0.40 3.952a 1,598,667b 26.0 0.53 10.53 0.40 7.91
a F1 was equal to zero in this stage.b Several stirrup fatigue fractures were observed during stage 2. The first three fractures were detected after 724,800, 757,697 and 1,176,575 cycles, respectively. Fatigue
fractures always took place in the straight portion of the stirrups, far from the bends.
C. Sousa et al. / Engineering Structures 54 (2013) 248–261 255
is given by the S–N curve derived from in-air fatigue tests (for rein-forcing bars identical to the ones used as stirrups in the testedbeams), which is also represented in Figs. 5 and 6. The S–N curvefor concrete corresponds to the one proposed by the EN 1992-2[6], as indicated in Section 2. For the comparison between calcula-tions and test results, the concrete compressive strength is taken asthe average result of cylinder tests. No material safety factor is con-sidered (apart from the strength reduction factor m indicated inSection 2). As mentioned before, fatigue failures are assumed forD P 1.
As regards beam #3, Fig. 5 shows that stages 1 and 2 cause neg-ligible fatigue damage. On the other hand, the calculated fatiguedamage at the end of stage 3 is greater than the unit, no matterwhich value is taken by the parameter bm. Given that no fatiguefailure was detected during the experiments, the calculation meth-od provides conservative estimates for the fatigue life of the testedbeam.
The highest stress ranges observed at the end of stages 2 and 3(measured strain ranges times the measured steel modulus of elas-ticity), which are plotted in Fig. 5, also indicate that the proposednumerical methodology provides conservative predictions of thestress ranges. The observed stress range at the end of stage 3 islower than the calculated values. The model also provides conser-vative results, in terms of stress ranges, for stage 2, since the high-est observed stress range is close to the lowest calculated value (forthe different scenarios in terms of km and bm values). However, it isimportant to note that the strain gages were not located at theintersection with the cracks, and consequently, the actual higheststress ranges might be higher than the measured values. For thatreason, the fact that no fatigue failure took place in beam #3 is amore robust indicator than the measured stress ranges.
Fig. 6 shows that the proposed analysis methodology also pro-vides conservative estimates for the fatigue life of beam #4, be-cause the estimated fatigue life during stage 2 is clearly lowerthan the number of applied load cycles before the first fatigue frac-ture occurred, no matter which value is adopted for the length overwhich the bending moment is assumed to be evenly distributed(1.90 m or 2.53 m). Obviously, the estimated fatigue life decreasesas bm decreases.
It is important to note that the calculated steel stress under theeffect of the maximum bending moment, in stage 2, reaches valueshigher than the yield stress of the employed steel: 871 MPa forbm = 1.90 m and 692 MPa for bm = 2.53 m. These results also con-firm that the proposed analysis methodology overestimates the ac-tual stress ranges (thus providing conservative results). This isbecause the employed S–N curve is based on laboratorial testswithin the elastic domain, and consequently, lower fatigue liveswould occur if the applied stresses actually exceeded the yieldstress of the stirrups.
In the case of beam #4, the incertitude associated to the quan-tification of the stress range in the stirrups is quite reduced (a sin-gle km value is admitted in stage 2, and two values are admitted inthe case of stage 1), because the eccentricity of the compressionstrut can only withstand a small fraction of the applied bendingmoment.
In the case of beam #3, the upper bound limit for the eccentric-ity of the compression struts also plays an important role in reduc-ing the range of admissible km values. This criterion controls theupper bound limit for km in stages 2 and 3.
This comparison between numerical and experimental resultsshowed that the proposed analysis methodology provides safe esti-mates for the fatigue life of the stirrups. These experimental resultscould not be used to confirm the adequacy of the procedure forevaluation of the web concrete fatigue strength, because no con-crete fatigue failure was detected in the tests. The calculated con-crete fatigue damage was also negligible, because reduced concretecompressive stress levels were obtained (note that reduced per-centages of transverse reinforcement were employed in the testedbeams, as shown in Fig. 4). The highest calculated concrete stressin the direction of the compression struts occurs in the outermostlayer of beam #4, stage 2, for bm = 1.90 m. This stress amounts to10.7 MPa, whereas the concrete cylinder compressive strength isequal to 52.5 MPa.
4. Analysis of a real case study
In this section, the developed numerical model for fatigue anal-yses considering the combined effects of in-plane shear and trans-verse bending is applied to the analysis of a real precast railwaybridge deck. The area of transverse reinforcement required for fati-gue verifications is compared with the area required in ULS calcu-lations, so that the most critical condition (ULS or fatigue) can beidentified.
The structure under analysis is composed of four continuousspans, with interior spans and end spans of 33.5 m and 26.5 m,respectively. This structure carries a single railway ballasted track,dedicated to freight traffic, with a gauge length of 1.668 m. Thestructure cross section is composed of a 2.10 m deep U-shaped pre-cast girder and a 8.96 m wide cast-in-place slab, forming a box-gir-der deck as depicted in Fig. 7. The girders are prestressed by meansof straight pre-tensioning strands, which are partially debonded inthe extremities. The deck slab, which is 0.30 m thick, is made with0.06 m thick precast planks, so that the use of formworks and scaf-folding is avoided. These precast planks are monolithically con-nected to the cast-in-place concrete by means of steel latticegirders. The employed materials are identified in Fig. 7 throughthe characteristic strengths for concrete and reinforcing steels.
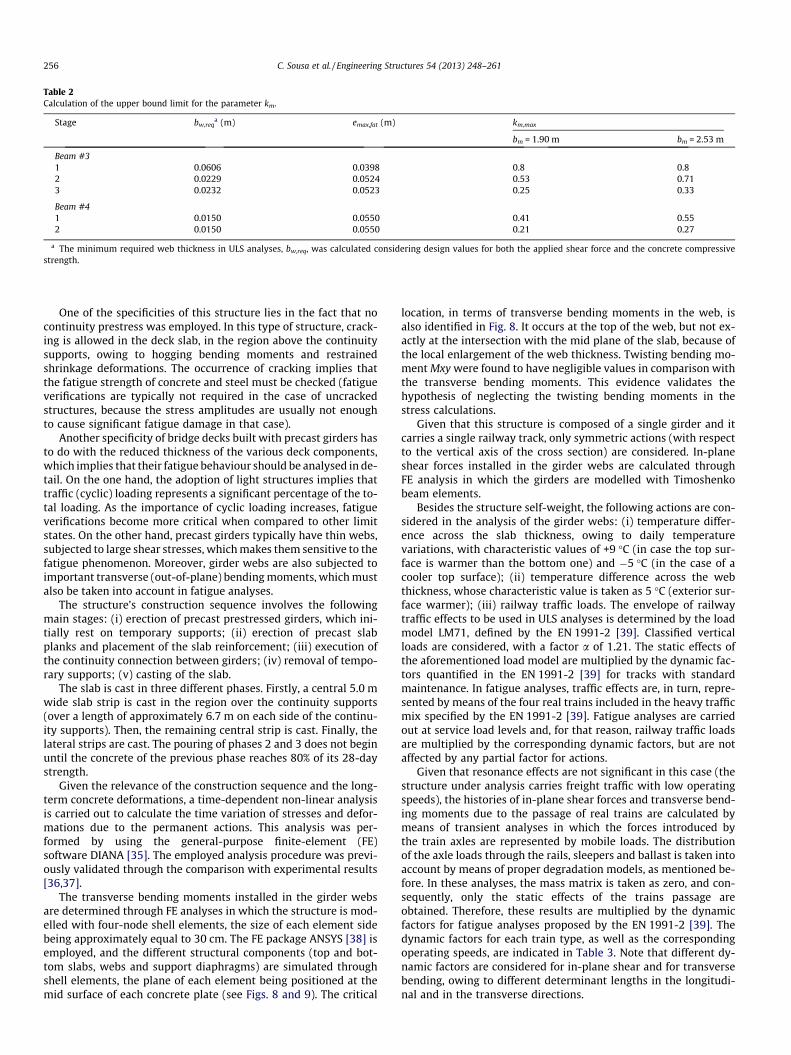
Table 2Calculation of the upper bound limit for the parameter km.
Stage bw,reqa (m) emax,fat (m) km,max
bm = 1.90 m bm = 2.53 m
Beam #31 0.0606 0.0398 0.8 0.82 0.0229 0.0524 0.53 0.713 0.0232 0.0523 0.25 0.33
Beam #41 0.0150 0.0550 0.41 0.552 0.0150 0.0550 0.21 0.27
a The minimum required web thickness in ULS analyses, bw,req, was calculated considering design values for both the applied shear force and the concrete compressivestrength.
256 C. Sousa et al. / Engineering Structures 54 (2013) 248–261
One of the specificities of this structure lies in the fact that nocontinuity prestress was employed. In this type of structure, crack-ing is allowed in the deck slab, in the region above the continuitysupports, owing to hogging bending moments and restrainedshrinkage deformations. The occurrence of cracking implies thatthe fatigue strength of concrete and steel must be checked (fatigueverifications are typically not required in the case of uncrackedstructures, because the stress amplitudes are usually not enoughto cause significant fatigue damage in that case).
Another specificity of bridge decks built with precast girders hasto do with the reduced thickness of the various deck components,which implies that their fatigue behaviour should be analysed in de-tail. On the one hand, the adoption of light structures implies thattraffic (cyclic) loading represents a significant percentage of the to-tal loading. As the importance of cyclic loading increases, fatigueverifications become more critical when compared to other limitstates. On the other hand, precast girders typically have thin webs,subjected to large shear stresses, which makes them sensitive to thefatigue phenomenon. Moreover, girder webs are also subjected toimportant transverse (out-of-plane) bending moments, which mustalso be taken into account in fatigue analyses.
The structure’s construction sequence involves the followingmain stages: (i) erection of precast prestressed girders, which ini-tially rest on temporary supports; (ii) erection of precast slabplanks and placement of the slab reinforcement; (iii) execution ofthe continuity connection between girders; (iv) removal of tempo-rary supports; (v) casting of the slab.
The slab is cast in three different phases. Firstly, a central 5.0 mwide slab strip is cast in the region over the continuity supports(over a length of approximately 6.7 m on each side of the continu-ity supports). Then, the remaining central strip is cast. Finally, thelateral strips are cast. The pouring of phases 2 and 3 does not beginuntil the concrete of the previous phase reaches 80% of its 28-daystrength.
Given the relevance of the construction sequence and the long-term concrete deformations, a time-dependent non-linear analysisis carried out to calculate the time variation of stresses and defor-mations due to the permanent actions. This analysis was per-formed by using the general-purpose finite-element (FE)software DIANA [35]. The employed analysis procedure was previ-ously validated through the comparison with experimental results[36,37].
The transverse bending moments installed in the girder websare determined through FE analyses in which the structure is mod-elled with four-node shell elements, the size of each element sidebeing approximately equal to 30 cm. The FE package ANSYS [38] isemployed, and the different structural components (top and bot-tom slabs, webs and support diaphragms) are simulated throughshell elements, the plane of each element being positioned at themid surface of each concrete plate (see Figs. 8 and 9). The critical
location, in terms of transverse bending moments in the web, isalso identified in Fig. 8. It occurs at the top of the web, but not ex-actly at the intersection with the mid plane of the slab, because ofthe local enlargement of the web thickness. Twisting bending mo-ment Mxy were found to have negligible values in comparison withthe transverse bending moments. This evidence validates thehypothesis of neglecting the twisting bending moments in thestress calculations.
Given that this structure is composed of a single girder and itcarries a single railway track, only symmetric actions (with respectto the vertical axis of the cross section) are considered. In-planeshear forces installed in the girder webs are calculated throughFE analysis in which the girders are modelled with Timoshenkobeam elements.
Besides the structure self-weight, the following actions are con-sidered in the analysis of the girder webs: (i) temperature differ-ence across the slab thickness, owing to daily temperaturevariations, with characteristic values of +9 �C (in case the top sur-face is warmer than the bottom one) and �5 �C (in the case of acooler top surface); (ii) temperature difference across the webthickness, whose characteristic value is taken as 5 �C (exterior sur-face warmer); (iii) railway traffic loads. The envelope of railwaytraffic effects to be used in ULS analyses is determined by the loadmodel LM71, defined by the EN 1991-2 [39]. Classified verticalloads are considered, with a factor a of 1.21. The static effects ofthe aforementioned load model are multiplied by the dynamic fac-tors quantified in the EN 1991-2 [39] for tracks with standardmaintenance. In fatigue analyses, traffic effects are, in turn, repre-sented by means of the four real trains included in the heavy trafficmix specified by the EN 1991-2 [39]. Fatigue analyses are carriedout at service load levels and, for that reason, railway traffic loadsare multiplied by the corresponding dynamic factors, but are notaffected by any partial factor for actions.
Given that resonance effects are not significant in this case (thestructure under analysis carries freight traffic with low operatingspeeds), the histories of in-plane shear forces and transverse bend-ing moments due to the passage of real trains are calculated bymeans of transient analyses in which the forces introduced bythe train axles are represented by mobile loads. The distributionof the axle loads through the rails, sleepers and ballast is taken intoaccount by means of proper degradation models, as mentioned be-fore. In these analyses, the mass matrix is taken as zero, and con-sequently, only the static effects of the trains passage areobtained. Therefore, these results are multiplied by the dynamicfactors for fatigue analyses proposed by the EN 1991-2 [39]. Thedynamic factors for each train type, as well as the correspondingoperating speeds, are indicated in Table 3. Note that different dy-namic factors are considered for in-plane shear and for transversebending, owing to different determinant lengths in the longitudi-nal and in the transverse directions.
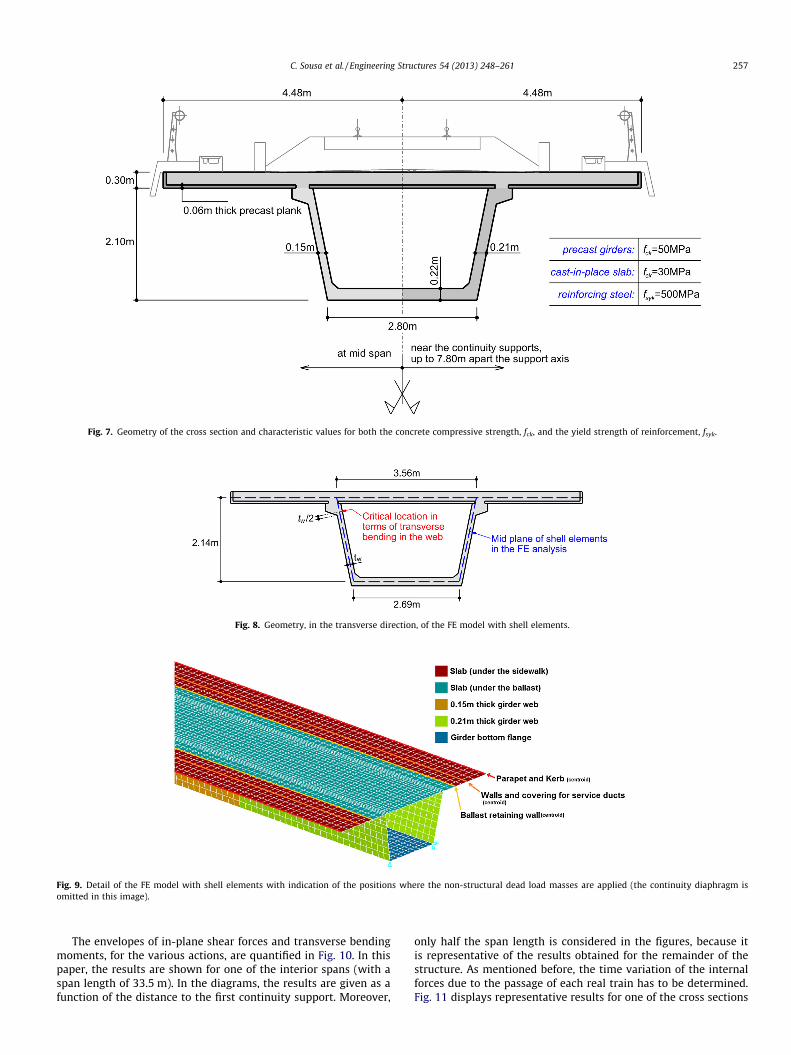
Fig. 7. Geometry of the cross section and characteristic values for both the concrete compressive strength, fck, and the yield strength of reinforcement, fsyk.
Fig. 8. Geometry, in the transverse direction, of the FE model with shell elements.
Fig. 9. Detail of the FE model with shell elements with indication of the positions where the non-structural dead load masses are applied (the continuity diaphragm isomitted in this image).
C. Sousa et al. / Engineering Structures 54 (2013) 248–261 257
The envelopes of in-plane shear forces and transverse bendingmoments, for the various actions, are quantified in Fig. 10. In thispaper, the results are shown for one of the interior spans (with aspan length of 33.5 m). In the diagrams, the results are given as afunction of the distance to the first continuity support. Moreover,
only half the span length is considered in the figures, because itis representative of the results obtained for the remainder of thestructure. As mentioned before, the time variation of the internalforces due to the passage of each real train has to be determined.Fig. 11 displays representative results for one of the cross sections
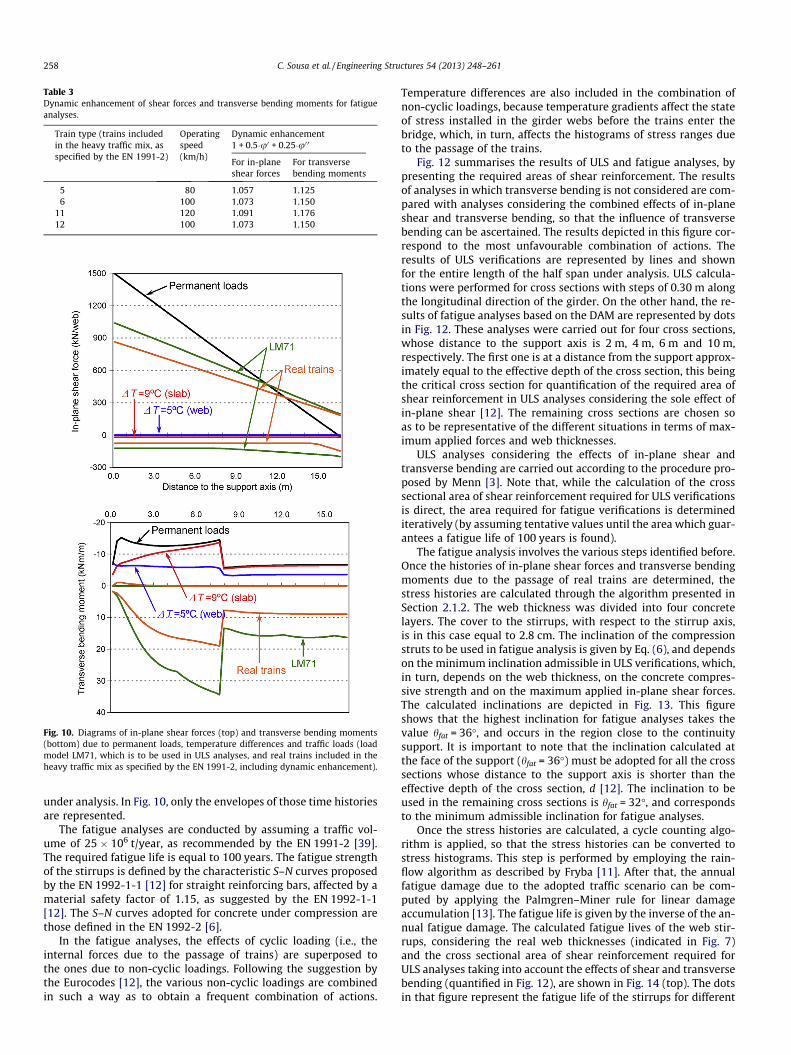
Table 3Dynamic enhancement of shear forces and transverse bending moments for fatigueanalyses.
Train type (trains includedin the heavy traffic mix, asspecified by the EN 1991-2)
Operatingspeed(km/h)
Dynamic enhancement1 + 0.5�u0 + 0.25�u0 0
For in-planeshear forces
For transversebending moments
5 80 1.057 1.1256 100 1.073 1.150
11 120 1.091 1.17612 100 1.073 1.150
Fig. 10. Diagrams of in-plane shear forces (top) and transverse bending moments(bottom) due to permanent loads, temperature differences and traffic loads (loadmodel LM71, which is to be used in ULS analyses, and real trains included in theheavy traffic mix as specified by the EN 1991-2, including dynamic enhancement).
258 C. Sousa et al. / Engineering Structures 54 (2013) 248–261
under analysis. In Fig. 10, only the envelopes of those time historiesare represented.
The fatigue analyses are conducted by assuming a traffic vol-ume of 25 � 106 t/year, as recommended by the EN 1991-2 [39].The required fatigue life is equal to 100 years. The fatigue strengthof the stirrups is defined by the characteristic S–N curves proposedby the EN 1992-1-1 [12] for straight reinforcing bars, affected by amaterial safety factor of 1.15, as suggested by the EN 1992-1-1[12]. The S–N curves adopted for concrete under compression arethose defined in the EN 1992-2 [6].
In the fatigue analyses, the effects of cyclic loading (i.e., theinternal forces due to the passage of trains) are superposed tothe ones due to non-cyclic loadings. Following the suggestion bythe Eurocodes [12], the various non-cyclic loadings are combinedin such a way as to obtain a frequent combination of actions.
Temperature differences are also included in the combination ofnon-cyclic loadings, because temperature gradients affect the stateof stress installed in the girder webs before the trains enter thebridge, which, in turn, affects the histograms of stress ranges dueto the passage of the trains.
Fig. 12 summarises the results of ULS and fatigue analyses, bypresenting the required areas of shear reinforcement. The resultsof analyses in which transverse bending is not considered are com-pared with analyses considering the combined effects of in-planeshear and transverse bending, so that the influence of transversebending can be ascertained. The results depicted in this figure cor-respond to the most unfavourable combination of actions. Theresults of ULS verifications are represented by lines and shownfor the entire length of the half span under analysis. ULS calcula-tions were performed for cross sections with steps of 0.30 m alongthe longitudinal direction of the girder. On the other hand, the re-sults of fatigue analyses based on the DAM are represented by dotsin Fig. 12. These analyses were carried out for four cross sections,whose distance to the support axis is 2 m, 4 m, 6 m and 10 m,respectively. The first one is at a distance from the support approx-imately equal to the effective depth of the cross section, this beingthe critical cross section for quantification of the required area ofshear reinforcement in ULS analyses considering the sole effect ofin-plane shear [12]. The remaining cross sections are chosen soas to be representative of the different situations in terms of max-imum applied forces and web thicknesses.
ULS analyses considering the effects of in-plane shear andtransverse bending are carried out according to the procedure pro-posed by Menn [3]. Note that, while the calculation of the crosssectional area of shear reinforcement required for ULS verificationsis direct, the area required for fatigue verifications is determinediteratively (by assuming tentative values until the area which guar-antees a fatigue life of 100 years is found).
The fatigue analysis involves the various steps identified before.Once the histories of in-plane shear forces and transverse bendingmoments due to the passage of real trains are determined, thestress histories are calculated through the algorithm presented inSection 2.1.2. The web thickness was divided into four concretelayers. The cover to the stirrups, with respect to the stirrup axis,is in this case equal to 2.8 cm. The inclination of the compressionstruts to be used in fatigue analysis is given by Eq. (6), and dependson the minimum inclination admissible in ULS verifications, which,in turn, depends on the web thickness, on the concrete compres-sive strength and on the maximum applied in-plane shear forces.The calculated inclinations are depicted in Fig. 13. This figureshows that the highest inclination for fatigue analyses takes thevalue hfat = 36�, and occurs in the region close to the continuitysupport. It is important to note that the inclination calculated atthe face of the support (hfat = 36�) must be adopted for all the crosssections whose distance to the support axis is shorter than theeffective depth of the cross section, d [12]. The inclination to beused in the remaining cross sections is hfat = 32�, and correspondsto the minimum admissible inclination for fatigue analyses.
Once the stress histories are calculated, a cycle counting algo-rithm is applied, so that the stress histories can be converted tostress histograms. This step is performed by employing the rain-flow algorithm as described by Fryba [11]. After that, the annualfatigue damage due to the adopted traffic scenario can be com-puted by applying the Palmgren–Miner rule for linear damageaccumulation [13]. The fatigue life is given by the inverse of the an-nual fatigue damage. The calculated fatigue lives of the web stir-rups, considering the real web thicknesses (indicated in Fig. 7)and the cross sectional area of shear reinforcement required forULS analyses taking into account the effects of shear and transversebending (quantified in Fig. 12), are shown in Fig. 14 (top). The dotsin that figure represent the fatigue life of the stirrups for different

Fig. 11. Histories of shear forces and transverse bending moments (at the critical location in the web), at the cross section 6 m apart from the support axis, not including thedynamic enhancement.
Fig. 12. Required area of shear reinforcement for ULS and fatigue analyses.Comparison between analyses in which transverse bending is not considered andanalyses considering the effects of in-plane shear and transverse bending.
Fig. 13. Minimum admissible inclination of the compression struts in ULSverifications and corresponding inclination to be used in fatigue analyses.
C. Sousa et al. / Engineering Structures 54 (2013) 248–261 259
km values in the range of 0.2–0.8. The adopted symbology identifiesthe cases in which the calculated fatigue life of concrete is lowerthan 100 years. If a given km value is not admissible in a specificcross section (for the reason that the upper bound limit for theeccentricity of the compression struts is exceeded), the fatigue lifeof the stirrups is not quantified for that km value. Therefore, by ana-lysing this graphical representation and taking into account the cri-teria for definition of the critical km value presented inSection 2.1.2, one can evaluate whether the adopted web thicknessand cross sectional area of stirrups guarantee that the intended fa-tigue life (100 years) is reached. The results shown in Fig. 14 (top)indicate that, in three of the cross sections under analysis, km val-ues higher than 0.4 are not admissible (otherwise, the eccentricity
emax,fat would be exceeded). The same figure, which refers to calcu-lations in which the area of shear reinforcement is taken as thearea required for ULS verifications, also shows that the fatigue lifeof the stirrups is lower than 100 years. As regards the fatiguestrength of the web concrete, the figure also shows that theadopted web thickness (indicated in Fig. 7) is not sufficient in thecase of the cross section at a distance d from the support. There-fore, the area of transverse reinforcement required for fatigue ver-ifications was quantified by considering an increased webthickness in this cross section (a 10% increase with respect to theweb thickness indicated in Fig. 7 was found to be largely suffi-cient). The required areas of shear reinforcement are displayed inFig. 12, and the calculated fatigue lives of the stirrups for the var-ious admissible km values are shown in Fig. 14 (bottom).
The results presented in Fig. 12 show that transverse bendingcannot be ignored in the design of this type of structure, because

Fig. 14. Fatigue lives of the stirrups for different km values, under the effect of theheavy traffic mix [39]. Results considering the area of transverse reinforcementrequired for ULS verifications (top) and considering the area which guarantees afatigue life of 100 years (bottom).
260 C. Sousa et al. / Engineering Structures 54 (2013) 248–261
the required areas of transverse reinforcements are considerablylarger when this effect is taken into account, by comparison withcalculations considering the sole effect of in-plane shear. This con-clusion is valid for both ULS and fatigue verifications. This figurealso shows that fatigue plays an important role in this kind ofstructure, because fatigue verifications are, in general, more detri-mental than ULS analyses. Only one exception to this rule was de-tected in the cross sections under analysis. That exception tookplace in calculations in which the influence of transverse bendingwas disregarded.
Fig. 12 also shows that the area of shear reinforcement requiredfor fatigue verifications is not considerably higher than the valuedetermined by ULS analyses. Therefore, fatigue effects have notsignificant implications in terms of construction costs. This casestudy reveals that the proposed methodology is an effective toolfor taking into account the influence of fatigue effects and trans-verse bending in the design of the webs of this type of structure.
5. Conclusions
This work presents an innovative procedure for fatigue analysisof bridge girder webs considering the effects of in-plane shear andtransverse bending, based on the Damage Accumulation Method.The proposed methodology makes possible the calculation of thefatigue life for both the web concrete and the stirrups. The simplic-ity of the algorithm for stress calculations makes it suitable for thenumerical evaluation of stress histories due to the passage oftrains, if the histories of internal forces (in-plane shear and trans-verse bending) are calculated by means of dynamic FE analyses.
Given the complexity of the cyclic behaviour of cracked girderwebs subjected to in-plane shear and transverse bending, the cal-culated stresses on both the steel stirrups and the web concrete de-pend on a parameter, km, which defines the relative contribution oftwo resisting mechanisms. Conservative fatigue analyses are ob-tained if the fatigue strength is verified, not for a single km value,but for the admissible range of km values. The procedure for deter-mination of this range was also indicated in this paper.
The proposed analysis methodology was validated through thecomparison with experimental results reported in the bibliogra-phy. The comparison between the outcome of variable-inclinationtruss models and experimental results for beams subjected toin-plane shear forces revealed that safe estimates for the stirrupfatigue lives were obtained when the stirrup stress ranges wereestimated considering the inclination of the compression strutsgiven by Eq. (6), and characteristic S–N curves for the straightportion of the stirrups were employed. Truss models proved tobe particularly conservative in the case of prestressed elements,because alternative resistant mechanisms play a significant rolein that case. The comparison between numerical and experimentalresults for beams subjected to in-plane shear and transverse bend-ing revealed that the proposed analysis methodology providesconservative estimates for the fatigue life of the tested beams.
The developed methodology for fatigue analysis considering theeffects of in-plane shear and transverse bending was applied in thestudy of a real structure, which consists of a continuous railwaybridge deck made with precast U-shaped girders. ULS analyseswere also carried out, by using available methodologies for takinginto account the combined effects of shear and out-of-planebending.
It was shown that fatigue verifications are, in general, more det-rimental than ULS calculations. Moreover, it was demonstratedthat transverse bending cannot be ignored in the design of thistype of structure, because the required areas of transverse rein-forcements are considerably larger when this effect is taken intoaccount, when compared to calculations considering the sole effectof in-plane shear. The proposed methodology proved to be aneffective tool for taking into account the influence of fatigue effectsand transverse bending in the design of slender webs of box-girderbridge decks.
It is important to remark that the analysis procedures presentedin this work were primarily devised for application in the design ofnew structures. The comparison between numerical and experi-mental results revealed that the proposed analysis approach sys-tematically provides results on the safe side. This conservatism isacceptable for the design of new structures, namely because theproblem under analysis in this work has not been the object ofextensive research to date. Future research into the fatigue behav-iour of girder webs subjected to in-plane shear and transversebending should focus on the development of improved proceduresfor computation of less conservative estimates of the accumulatedfatigue damage.
Acknowledgements
Support from the Portuguese Foundation for Science and Tech-nology, through the research project entitled Continuous precastbridge decks for railway bridges: numerical and experimental assess-ment (PTDC/ECM/68430/2006), and from the Portuguese agencyAgência de Inovação, through the research project Innovative pre-cast solutions for high speed railway lines (SIPAV), which is beingdeveloped in cooperation with the precast company MEBEP, isgratefully acknowledged. Support from the Spanish precast manu-facturer Prefabricados Castelo, in the definition of the case study, isalso gratefully acknowledged.
C. Sousa et al. / Engineering Structures 54 (2013) 248–261 261
References
[1] Lefaucher D. Cumul des aciers de cisaillement et des aciers de flexion.Ouvrages d’Art 2002;41:18–29.
[2] AFGC. Guide des ponts poussés: Presses de l’Ecole Nationale des Ponts etChaussées; 1999.
[3] Menn C. Prestressed concrete bridges. Springer-Verlag; 1986.[4] Kaufmann J, Menn C. Versuche uber Schub bei Querbiegung (Investigations of
shear and transverse bending). Institute fur Baustatik und Konstruktion ETHZurich; 1976 [in German].
[5] Gaspar R. Dimensionamento das almas de pontes celulares. PhD thesis. SãoPaulo; 2003.
[6] CEN. EN 1992-2 – Eurocode 2: design of concrete structures – concrete bridges– design and detailing rules. Brussels; 2005.
[7] Gaspar R, Stucchi FR. Dimensionamento das almas de pontes celulares. RevistaPortuguesa de Engenharia de Estruturas 2009;Série II:39–46.
[8] ERRI D216. ERRI D216/RP1 – fatigue of railway bridges. State of the art report.Ultrecht: European Rail Research Institute; 2002.
[9] UIC. UIC Leaflet 774-2 – distribution of axle-loads on ballasted railway bridges– 2nd ed. Union Internationale des Chemins de Fer; 1994.
[10] ERRI D183. ERRI D183/DT346 – fatigue design of concrete railway bridges –loading, resistance, verification formulae for ENV 1992-2. Ultrecht: EuropeanRail Research Institute; 1997.
[11] Fryba L. Dynamics of railway bridges. London: Thomas Telford; 1996.[12] CEN. EN 1992-1-1 – eurocode 2: Design of concrete structures – Part 1-1:
General rules and rules for buildings. Brussels; 2004.[13] Miner MA. Cumulative damage in fatigue. J Appl Mech 1945;12. A159–64.[14] RILEM Committee 36 RDL. Long term random dynamic loading of concrete
structures. Mater Struct 1984;17:1–28.[15] Higgins C, Lee A-Y, Potisuk T, Forrest R. High-cycle fatigue of
diagonally cracked RC bridge girders: laboratory tests. J Bridge Eng2007;12:226–36.
[16] Higgins C, Miller R, Rosowsky DV, Yim S, Potisuk T, Daniels T, et al. Assessmentmethodology for diagonally cracked reinforced concrete – final report – SPR350 – SR 500-091. Oregon Department of Transportation and Federal HighwayAdministration; 2004.
[17] Frey RP. Fatigue design concept considering the indefinite state of stress in thereinforcement of RC-beams. Fatigue of Steel and Concrete Structures – IABSE.Lausanne: IABSE; 1982.
[18] Kreger ME, Bachman PM, Breen JE. An exploratory study of shear fatiguebehavior of prestressed concrete girders. PCI J 1989;1989:104–25.
[19] CEB. CEB-FIP Model Code 1990. London: Thomas Telford; 1993.[20] UIC. UIC Leaflet 774-1 – recommendations for the fatigue design of railway
bridges in reinforced and prestressed-concrete. 3rd ed. Union Internationaledes Chemins de Fer; 2005.
[21] Zanuy C, Fuente P, Albajar L. Effect of fatigue degradation of the compressionzone of concrete in reinforced concrete sections. Eng Struct 2007;29:2908–20.
[22] Zanuy C, Albajar L, Fuente P. Sectional analysis of concrete structures underfatigue loading. ACI Struct J 2009;106:667–77.
[23] Balázs GL. Bond under repeated loading. ACI Special Publication SP180-06;1998.
[24] Hordijk DA. Local approach to fatigue of concrete. PhD thesis, Delft Universityof Technology, The Netherlands; 1991.
[25] Ruhnau J. Influence of repeated loading on the stirrup stress of reinforcedconcrete beams, vol. 42. ACI Special Publication; 1974. p. 169–82.
[26] Frey RP, Thurlimann B. Ermudungsversuche an Stahlbeton-balken mit undohne Schubbewehrung. Stuttgart: Institut fur Baustatik und Konstruktion ETHZurich; 1983.
[27] Higgins C, Ill W, Nicholas B, Potisuk T. High-cycle fatigue of diagonally crackedreinforced concrete bridge girders: field tests. J Bridge Eng 2006;11:699–706.
[28] Price KM, Edwards AD. Fatigue strength in shear of prestressed concrete I-beams. ACI J 1971;1971:282–92.
[29] Sousa CF. Analysis of cyclic and long-term effects in continuous precastrailway bridge decks. PhD thesis, Faculty of Engineering of the University ofPorto, Porto: Portugal; 2012.
[30] ACI Committee 215. ACI 215R-74 – considerations for design of concretestructures subjected to fatigue loading (Revised 1992/Reapproved 1997). ACI;1997.
[31] Zanuy C, Albajar L, Fuente P. On the cracking behaviour of the reinforcedconcrete tension chord under repeated loading. Mater Struct 2010;43:611–32.
[32] Laurencet P, Jaccoud J-P, Favre R. Fissuration des structures en bétonprécontraint: modélisation, validation et interpretation. Mater Struct1999;32:360–9.
[33] Schlaffi M, Bruhwiler E. Fatigue of existing reinforced concrete bridge deckslabs. Eng Struct 1998;20:991–8.
[34] Herwig A. Reinforced concrete bridges under increased railway traffic loads –fatigue behaviour and safety measures. PhD thesis, École PolytechniqueFédérale de Lausanne; 2008.
[35] TNO DIANA BV. Diana user’s manual – release 9.2. Delft, The Netherlands;2007.
[36] Sousa CF, Sousa H, Serra Neves A, Figueiras JA. Numerical evaluation of thelong-term behavior of precast continuous bridge decks. J Bridge Eng2012;17:89–96.
[37] Sousa H, Sousa CF, Serra Neves A, Bento J, Figueiras JA. Long-term monitoringand assessment of a precast continuous viaduct. Struct Infrastruct Eng2013;9:777–93.
[38] ANSYS. Structural analysis guide – ANSYS user manual – release 12.0.Canonsburg: Ansys, Inc.; 2009.
[39] CEN. EN 1991-2 – Eurocode 1: actions on structures – Part 2: Traffic loads onbridges. Brussels; 2003.