Fate of chemicals in the sewage treatment plantsesss04.setac.eu/embed/sesss04/Antonio_Franco.pdfFate...
27
Fate of chemicals in the sewage treatment plant Opportunities and limitations with SimpleTreat Antonio Franco, Oliver Price, Jaap Struijs, Dik van de Meent
Transcript of Fate of chemicals in the sewage treatment plantsesss04.setac.eu/embed/sesss04/Antonio_Franco.pdfFate...

Fate of chemicals in the sewage treatment plant Opportunities and limitations with SimpleTreat
Antonio Franco, Oliver Price, Jaap Struijs, Dik van de Meent

Importance of STP
Sewage Treatment Plant (STP): barrier between down-the-drain home and personal care (HPC) products and the aquatic ecosystem
Intro
Presentation outlook 1. Overview of STP model SimpleTreat 2. Validation study with selected chemicals 3. Research priorities

Objectives Intro
STP modelling to support risk assessment by:
Understanding key processes and parameters controlling chemical removal
Refining predicted environmental concentrations (PECs):
- screening level (base datasets)
- higher tier probabilistic assessment
Integrating assessments: simulation studies + monitoring
Predicting future trends (increasing infrastructure)

SimpleTreat: model concept
Modelled processes: Advection: water, sludge and air flows Diffusion: water-solids (sorption) and water-air (volatilization + stripping) Degradation: (primary) biodegradation in aeration tank
Physical
Biological
Input: • Chemical properties (MW, H, KOW, KOC) • STP scenario discharge • First order biodegradation rates (k)
Output: • CEFFLUENT • CSLUDGE • Relative emissions
SimpleTreat
SimpleTreat simulates the fate of trace organic xenobiotics (parent structure) in the treatment plant
SimpleTreat

SimpleTreat: model structure
9-box representation of a conventional activated-sludge sewage treatment plant with primary sedimentation (p.s) and secondary clarifier (s.c).
Mass balance system of 9 linear equations solved at steady-state (dC/dt=0)
∑∑ ⋅+⋅+−=⋅ ijiijiiiii
i CDiffCAdvVCkdt
dCV ,,
Diffusion Advection Biodegradation
air
water p.s.
susp. solids susp. solids
prim. sludge
water s.c
water aer.
susp. solids
sec. sludge
SimpleTreat

SimpleTreat: model assumptions
Applicability
Organic chemicals with basic physicochemical properties and biodegradability profile
Key assumptions:
Non-equilibrium, Steady-state (level III)
Homogeneous, well mixed compartments (CSTR)
First order biodegradation in aeration tank (low concentrations)
Modelled scenario does not consider:
Chemical treatment units
Abiotic degradation
Biodegradation in settlers
Parent compound formation / degradation products
Other?
SimpleTreat

Tier 1 Input: from ready biodegr. tests (OECD 301)
SimpleTreat processes: biodegradation
Tier 2 Input: biodegradation rates derived from continuously-stirred activated sludge simulation study (OECD 303A)
Assumption: First order biodegradation, only in water phase Limitations: unrealistic high concentrations
OECD 301 Result rate* (h-1)
Ready biodegr (fulfilling 10 d window)
kW = 1
Ready biodegr, not fulfiling kW = 0.3
Inherently biodegr. kW = 0.1
Non biodegr. kW = 0
* Values assigned based on a reasonable worst-case scenario (EUSES)
Assumption: First order biodegradation in water and solid phase
Limitations: Expensive, strict criteria (realistic, representative conditions must be met)
SimpleTreat
SimpleTreat processes: sorption
Primary settler
Primary sludge
effluent
Aeration tank
Excess sludge
Secondary clarifier
Net sludge growth/degradation
1200
90 30
60
6
19
5
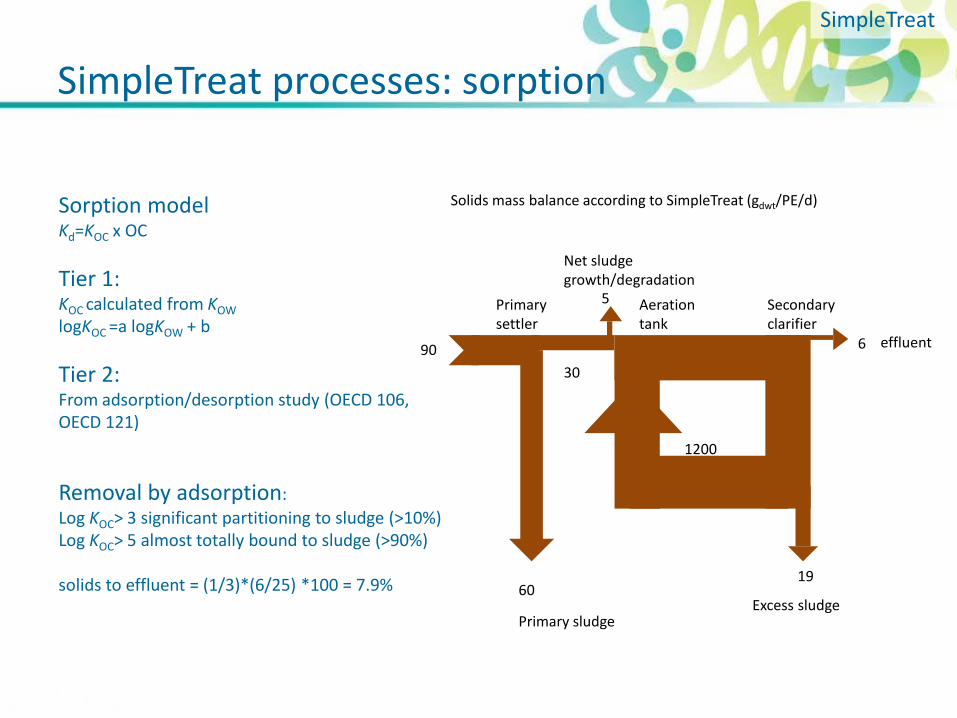
Solids mass balance according to SimpleTreat (gdwt/PE/d) Sorption model Kd=KOC x OC Tier 1: KOC calculated from KOW logKOC =a logKOW + b Tier 2: From adsorption/desorption study (OECD 106, OECD 121) Removal by adsorption: Log KOC> 3 significant partitioning to sludge (>10%) Log KOC> 5 almost totally bound to sludge (>90%) solids to effluent = (1/3)*(6/25) *100 = 7.9%
SimpleTreat

SimpleTreat processes: volatilization SimpleTreat
Aeration tank
Two films model f (Henry’s Law constant, molecular permeability in air and water)
Primary settler and secondary clarifier
Empirical equations f (oxygen requirement, Henry’s Law constant, hydraulic retention time)
Surface aeration
Bubble aeration
Relative emissions to effluent and sludge
% to
slud
ge
% to
effl
uent
H = 1
H = 10
H = 100
H = 1
H = 10
H = 100
log KOW
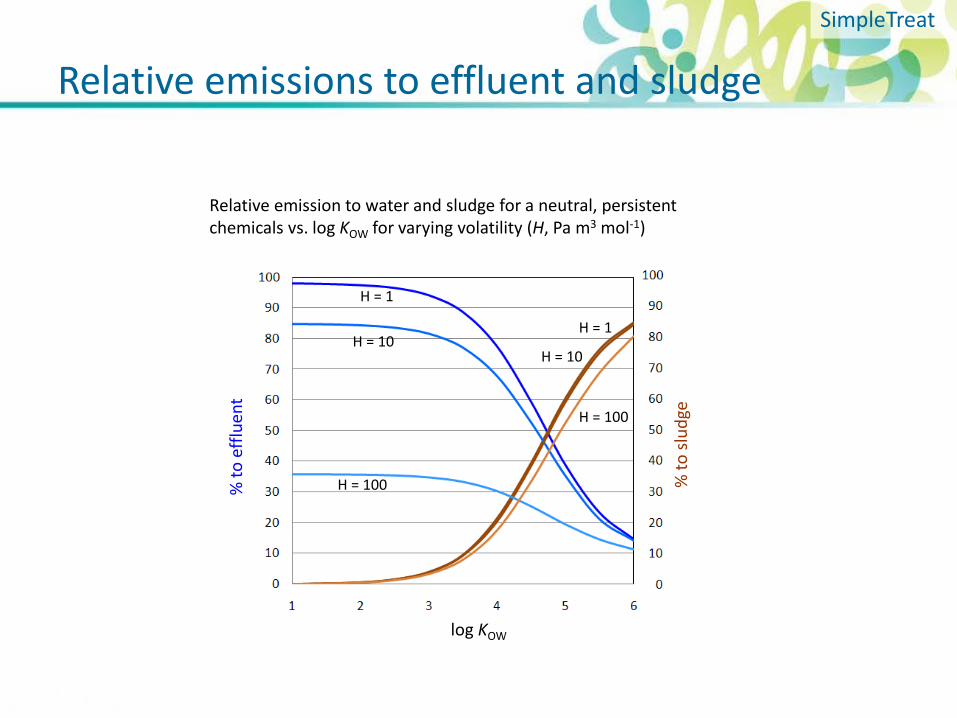
Relative emission to water and sludge for a neutral, persistent chemicals vs. log KOW for varying volatility (H, Pa m3 mol-1)
SimpleTreat

SimpleTreat: default parameterisation (EUSES)
Treatment unit Parameters values
Raw sewage composition T, TSSIN, BOD, OCSLUDGE Typical range
Primary settler geometrical-hydraulic parameters and efficiency
Typical range
Activated sludge system Volume and HRT aerator, BOD removal, excess sludge
Based on Sludge Loading Rate SLR = 0.15 kgBOD/Kgdwt/d
OC, VSS Typical range
Secondary settler and effluent
Geometry, HRT typical range
TSSEFFLUENT TSSEFFLUENT =30 mg/L (EU legal limit)
Model Scenario Default scenario
With/without primary sedimentation 9-boxes (with primary sedimentation)
Surface/bubble aeration Surface aeration
Input data Default input
Biodegradation rate Assigned based on readily biodeg. test
Sludge-water sorption coefficient Calculated from Kow
SimpleTreat

SimpleTreat: limitations
One scenario – one parameterisation:. For example, is the modelled scenario (9-box system activated sludge) representative of existing infrastructure? Are parameters representative of activated sludge secondary treatment systems?
Input data: do they represent real conditions in the system (e.g. tests at low concentrations)
Phase partitioning concept: is the KOC =f(KOW) approach applicable to ionisable chemicals, surfactants, organic ligands? Are soil/sediment KOC data useful for sludge?
Abiotic degradation: overlooked removal processes (chemicals treatment, UV/light)?
Validation study
Model evaluation: simulation results vs. measured data for 6 HPC ingredients
Identify research priorities
SimpleTreat

Validation study: test chemicals
Chemical Structure pKa H Pa m3 mol-1
Log KOW,n Log KOC Ready biodeg.
Galaxolide (HHCB)
- 36.9 5.3 3.82 No
Permethrin (PMT)
- 0.19 6.10 4.00 Yes, not fulfilling 10 d window
Decamethyl- cyclopentasiloxane (D5)
- 3.34 x 10⁶ 8.03 5.17 No
Triclosan (TCS)
8.1 (acid) 2.27x 10⁻³ 4.76 4.67 No
Benzalkonium chloride (BAC)
base 5.03 x 10⁻⁷ - 4.12 Yes, fulfilling 10 d window
Zinc pyrithione (ZPT)
4.7 (acid) 5.29 x 10⁻⁹
0.97 3.55 No
Input properties of test chemicals
Validation study
Validation study: model results
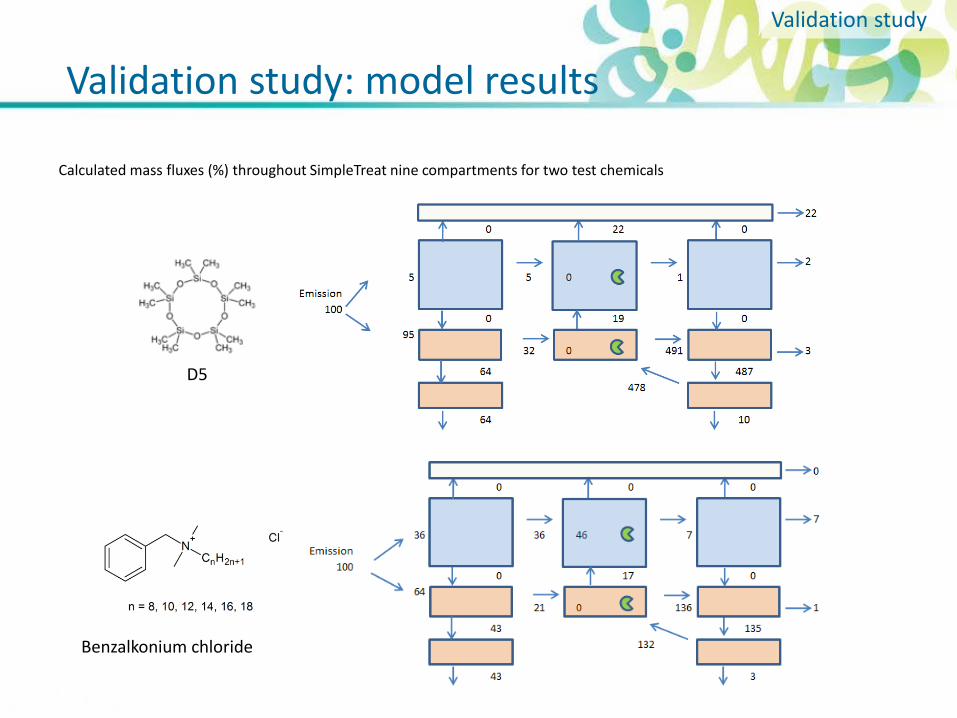
D5
Benzalkonium chloride
Validation study
Calculated mass fluxes (%) throughout SimpleTreat nine compartments for two test chemicals

Mass flows measured in STPs
Chemical Min
Effluent Avg
Max
Sludge Degraded n STP Reference
Galaxolide 40 1.5 15
54 12.2 22.5 18 63 47
68 23 30
70
3 2 1 1 1 1
Artola-Garicano 2003 Horii et al 2007 Carballa et al 2004 Kupper et al 2006 Bester 2004 Lee et al 2010
Permethrin 11 10
23 20 7
12 6
35 30
43
30
2 1 1
Santos et al 2010 Abram et al 1980 Kupper et al 2006 Gomez et al 2007 Plagellat 2004
D5 1.78 1 Sparham et al 2011
Triclosan 1 10 45 37.5 52.5 36 Bock et al 2010
Benzalkonium chloride
1 9 Clara et al 2007
Zinc pyrithione
Mass balance of test chemicals measured in activated sludge STP (% of influent load)
Validation study

Comparison with measured data
Key results: Reasonable agreement with measurements, consistent with the model conservative parameterisation
Measured KOC necessary for organic ions (BAC)
Speciation of organic ligands overlooked
Tier 2 biodeg data can refine assessments (TCS)
Cannot represent large variability in measured data
Validation study
Comparison of mass fluxes (%) estimated by SimpleTreat (left bars) with average (and min-max range ) values measured in STPs (right bars)

Research priorities Research priorities
Applicability domain
Does SimpleTreat capture the chemistry of organic ions (sorption), surfactants (interface enrichment), ligands (speciation)?
SimpleTreat model refinement
Investigate the impact of abiotic processes (flotation, photolysis)
Probabilistic parameterisation of a conventional STP (activated sludge) for high tier exposure assessment
Fate of degradation products
Scenario uncertainty
Other types of STPs (e.g. trickling filters)
Advantages of other existing models (water industry)

Applicability domain: organic ions Model domain
Organic Acids and Bases: SimpleTreat 3.0: KOC,ion = 0 SimpleTreat 3.1: see poster
Regression tested against 34 sludge KOC values for 14 monovalent organic acids
Wick et al 2011 (pH 6.8) Horsing et al 2011 (pH 7)
Ternes et al 2004 (pH 7.5) Urase, Kikuta 2005 (pH 4.4 – 6.7)
Correlation of apparent octanol water partition coefficient (DOW) with KOC for 43 monovalent bases
QACs pH 7.3 (Ismail et al 2010 ) Pharmaceuticals pH 7 (Horsing et al 2011)
Biocides pH 6.8 (Wick et al 2011)

Surfactants
Homogeneous distribution is assumed throughout the system.
Concentrations typically << critical micelle concentrations.
Surface active molecules may be enriched at the surface when specific interface area is high (during flotation/aeration).
Interface enrichment depends on air/water KIW and on the specific surface area.
Applicability domain: surfactants Model domain
Test calculation with SimpleTreat for BAC assuming KIW = 10-5 m (10 μm) Vbubble,aer = 0.4%, dbubble = 3mm (Gresch et al. 2011) Fraction adsorbed to bubbles <0.1% Fraction transported to the surface <1% (3.8% assuming no degradation, 10% assuming KOC = 0)

Applicability domain: organic ligands Model domain
Organic ligands
Undergo transchelation by metal ions. Speciation depends on:
Binding constant
Metal concentrations
pH, ionic strength, DOC
1.E-07
1.E-06
1.E-05
1.E-04
1.E-03
1.E-02
1.E-01
1.E+00
log
X i
Example: ZPT The 1:2 complex with iron is likely the dominating species in STP
Estimated speciation of pyrithione in freshwater
Model limitations:
Species-specific modelling hindered by lack of data
Single-species simulation valid only if input data were generated in a media that well represents STP. (e.g. log KOC = 3.55 in soil)
Rapidly photodegraded t1/2,photo = 15 min

Higher tier assessment
Tier 1 – Ready biodegradability – SimpleTreat default – conservative, possibly unrealistic
Tier 2 – Simulation study - ?
Problem: The use of higher tier biodegradation data (OECD 303A CAS study) in exposure assessments is debated because the representativeness of these studies is unknown. Can a realistic endpoint replace a conservative estimate?
Worst case point estimate How can STP modelling support higher tier exposure assessments? A case study with triclosan 1. Derive degradation rates in activated sludge from the mass
balance of an OECD 303A study (e.g. 6-box SimpleTreat of a CAS system).
2. Define probability density distributions for SimpleTreat inputs and model parameters.
3. Run probabilistic simulations with SimpleTreat. 4. Probabilistic exposure assessment and uncertainty analysis.
Probabilistic exposure assessment

SimpleTreat: probabilistic parameterisation
Substance inputs unit SimpleTreat
default Type of
distribution min (T)
location (L) likeliest (T) mean (N, L)
max (T) st. dev. (N, L)
95%-ile (N, L)
pKa N 8 0.1 log KOC,n N 4.67 0.2 log KOC,a N 2.06 0.5 kbiodeg h-1 0 L 0.02* 0.11* 0.36*
STP parameters** Inflow L/PE/d 200 L 90 153 58 Sludge loading rate kgBOD/kgdwt/d 0.15 T 0.04 0.15 0.6 T water °C 15 N 15 25 Solids inflow g/PE/d 90 L 50 90 150 OC raw sewage g/g 0.3 N 0.4 0.03 BOD raw sewage gBOD/PE/d 54 L 45 60 82 pH 7 N 7.5 0.35 depth ps m 4 T 3 4 4.9 depth aer m 3 T 2 3 6 depth sc m 3 T 2.5 3 4.5 OC sc g/g 0.37 N 0.37 0.03 C solids effluent mg/L 30 T 3 9 30 TSS rem primary 0.66 N 0.55 0.07 O2 in aerator mg/L 2 T 1 2 2.5
* Measured range calculated from Federle et al. 2002 – CAS study at different (low) concentrations, T = 22 °C ** STP parameters and variability based on Tchobanoglous et al. 2004 – Wastewater Engineering – Treatment and Reuse
Test substance: triclosan

Probabilistic exposure assessment
Uncertainty analysis: Identification of most important (uncertain) parameters.
STP Measured
Bock 2011 model SimpleTreat
default 21.4 5 %-ile 1 7 0.5
50 %-ile 6 11 4.4 95 %-ile 40.9 18 16.0
Triclosan probabilistic STP modelling: Comparison of modelled estimated fraction released to effluent with measured (n = 23, activated sludge) and model results from Bock et al. 2010.
Contribution to variance of most sensitive parameters on the fraction released to effluent
k biodeg.
Sludge loading rate
log Koc,n
Sewage flow
T water
pH
BOD raw sewage
TSS removed p.s.
C solids eff. o
–
Conclusions
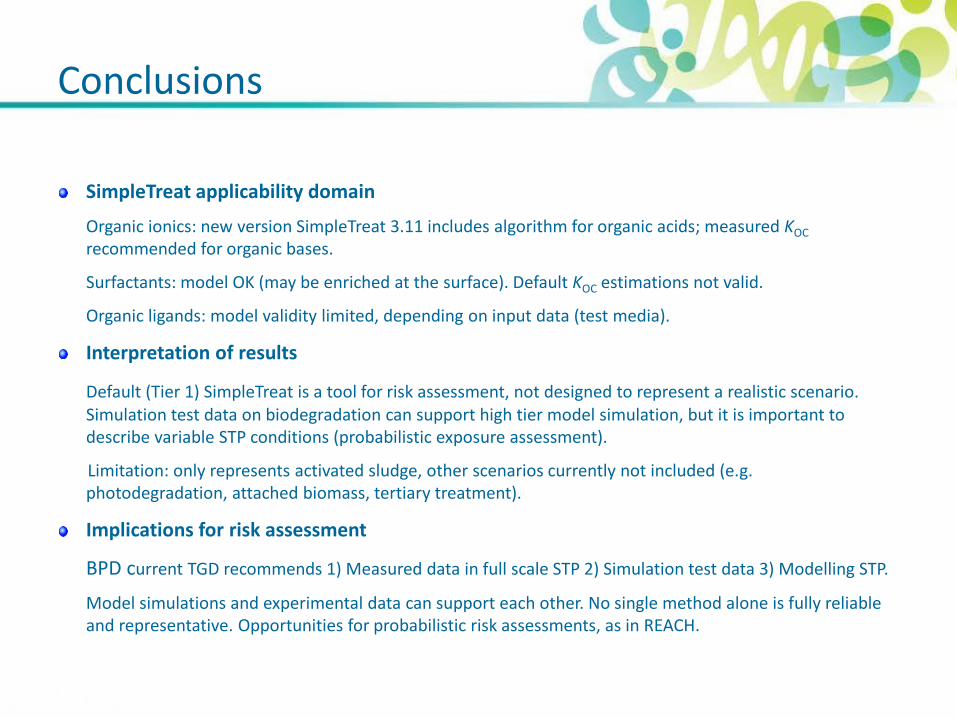
SimpleTreat applicability domain
Organic ionics: new version SimpleTreat 3.11 includes algorithm for organic acids; measured KOC recommended for organic bases.
Surfactants: model OK (may be enriched at the surface). Default KOC estimations not valid.
Organic ligands: model validity limited, depending on input data (test media).
Interpretation of results
Default (Tier 1) SimpleTreat is a tool for risk assessment, not designed to represent a realistic scenario. Simulation test data on biodegradation can support high tier model simulation, but it is important to describe variable STP conditions (probabilistic exposure assessment).
Limitation: only represents activated sludge, other scenarios currently not included (e.g. photodegradation, attached biomass, tertiary treatment).
Implications for risk assessment
BPD current TGD recommends 1) Measured data in full scale STP 2) Simulation test data 3) Modelling STP.
Model simulations and experimental data can support each other. No single method alone is fully reliable and representative. Opportunities for probabilistic risk assessments, as in REACH.

Thanks
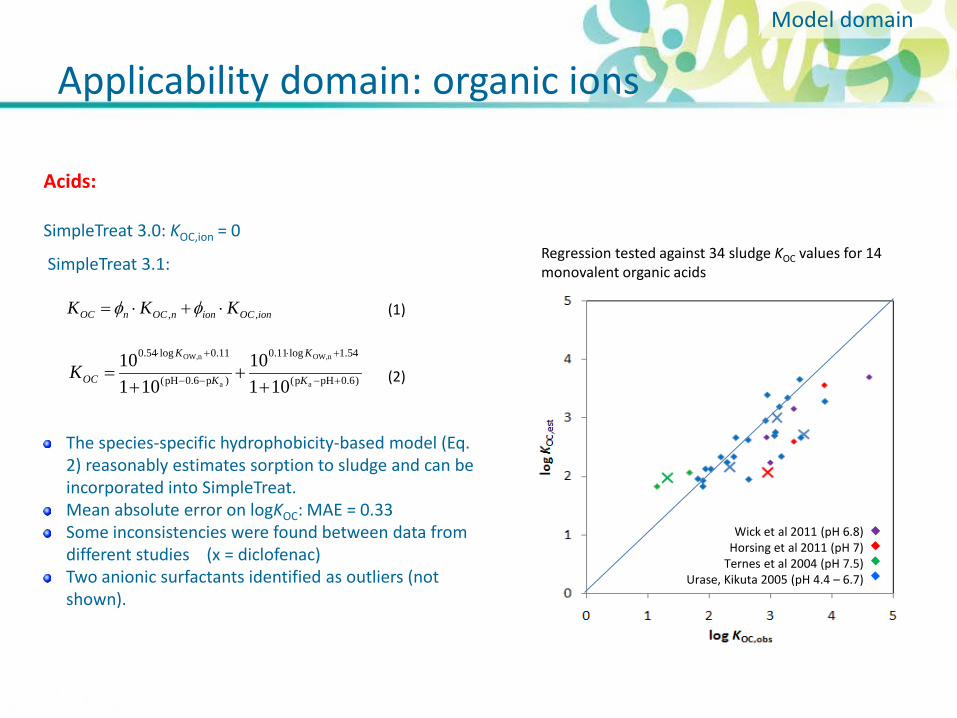
Applicability domain: organic ions Model domain
Regression tested against 34 sludge KOC values for 14 monovalent organic acids
ionOCionnOCnOC KKK ,, ⋅+⋅= φφ
Wick et al 2011 (pH 6.8) Horsing et al 2011 (pH 7)
Ternes et al 2004 (pH 7.5) Urase, Kikuta 2005 (pH 4.4 – 6.7)
)6.0pHp(
54.1log11.0
)p6.0pH(
11.0log54.0
a
nOW,
a
nOW,
10110
10110
+−
+⋅
−−
+⋅
++
+= K
K
K
K
OCK
Acids: SimpleTreat 3.0: KOC,ion = 0
SimpleTreat 3.1: (1) (2)
The species-specific hydrophobicity-based model (Eq. 2) reasonably estimates sorption to sludge and can be incorporated into SimpleTreat. Mean absolute error on logKOC: MAE = 0.33 Some inconsistencies were found between data from different studies (x = diclofenac) Two anionic surfactants identified as outliers (not shown).

Applicability domain: organic ions
Correlation of apparent octanol water partition coefficient (DOW) with KOC for 43 monovalent bases
Bases: SimpleTreat 3.0: KOC,ion = 0
SimpleTreat 3.1:
Sorption is generally high, even at low DOW. At equal DOW, logKOC (QACs) > logKOC (pharmaceutical, pKa 7-10) > logKOC (biocides, pKa 3-5). Correlation of sorption with hydrophobicity is significant but other factors influence adsorption. The correlation with logDOW improves when pKa and calculated logDOW values are checked for quality assurance.
QACs pH 7.3 (Ismail et al 2010 ) Pharmaceuticals pH 7 (Horsing et al 2011)
Biocides pH 6.8 (Wick et al 2011)
Model domain