Fastener Tech '19 - 190605 - Mid-West Fastener Association · -5.0-4.0-3.0-2.0-1.0 0.0 1.0 2.0 1990...
55
Economic Outlook William Strauss Senior Economist and Economic Advisor Federal Reserve Bank of Chicago Fastener Tech ‘19 Rosemont, IL June 5, 2019
Transcript of Fastener Tech '19 - 190605 - Mid-West Fastener Association · -5.0-4.0-3.0-2.0-1.0 0.0 1.0 2.0 1990...

Economic Outlook
William Strauss
Senior Economist
and Economic Advisor
Federal Reserve Bank of Chicago
Fastener Tech ‘19
Rosemont, IL
June 5, 2019

GDP expanded by 3.2% over the past year
-10
-8
-6
-4
-2
0
2
4
6
8
1990 '92 '94 '96 '98 '00 '02 '04 '06 '08 '10 '12 '14 '16 '18
Real gross domestic product
percent
Quarterly change (saar)
Percent change from a year earlier
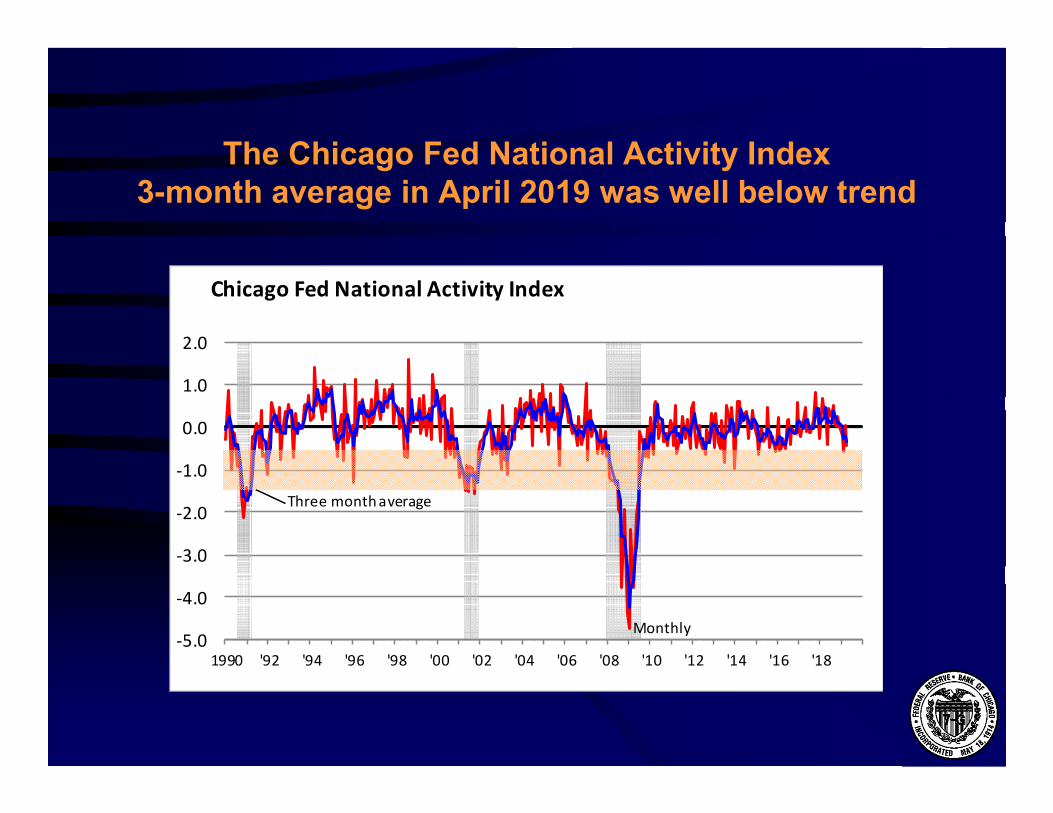
-5.0
-4.0
-3.0
-2.0
-1.0
0.0
1.0
2.0
1990 '92 '94 '96 '98 '00 '02 '04 '06 '08 '10 '12 '14 '16 '18
Monthly
Chicago Fed National Activity Index
Three month average
The Chicago Fed National Activity Index
3-month average in April 2019 was well below trend
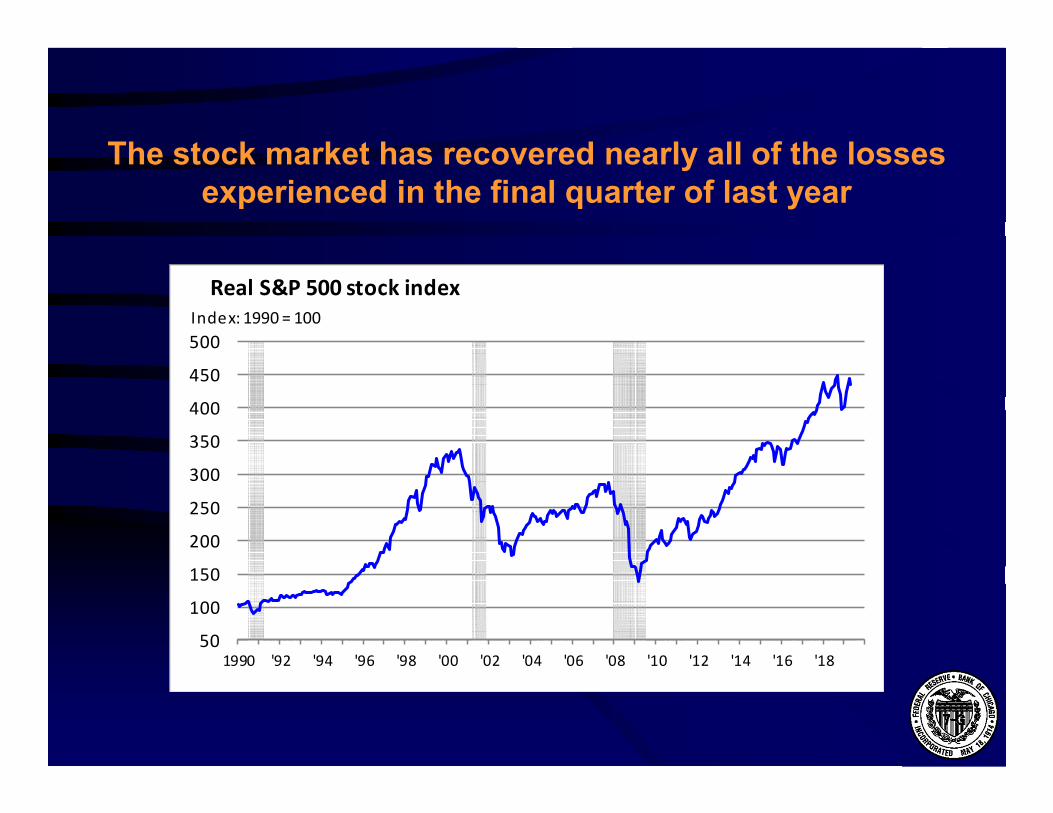
The stock market has recovered nearly all of the losses
experienced in the final quarter of last year
50
100
150
200
250
300
350
400
450
500
1990 '92 '94 '96 '98 '00 '02 '04 '06 '08 '10 '12 '14 '16 '18
Real S&P 500 stock index
Index: 1990 = 100

The Federal Open Market Committee (FOMC) expects
GDP to grow just above trend in 2019;
and around trend in 2020 and 2021
-5
-4
-3
-2
-1
0
1
2
3
4
5
6
1990 '92 '94 '96 '98 '00 '02 '04 '06 '08 '10 '12 '14 '16 '18 '20
Real gross domestic product
percent change from a year earlier
FOMC
FOMC Central Tendency (March 2019)
2019 1.9 – 2.2
2020 1.8 – 2.0
2021 1.7 – 2.0
Longer run 1.8 – 2.0
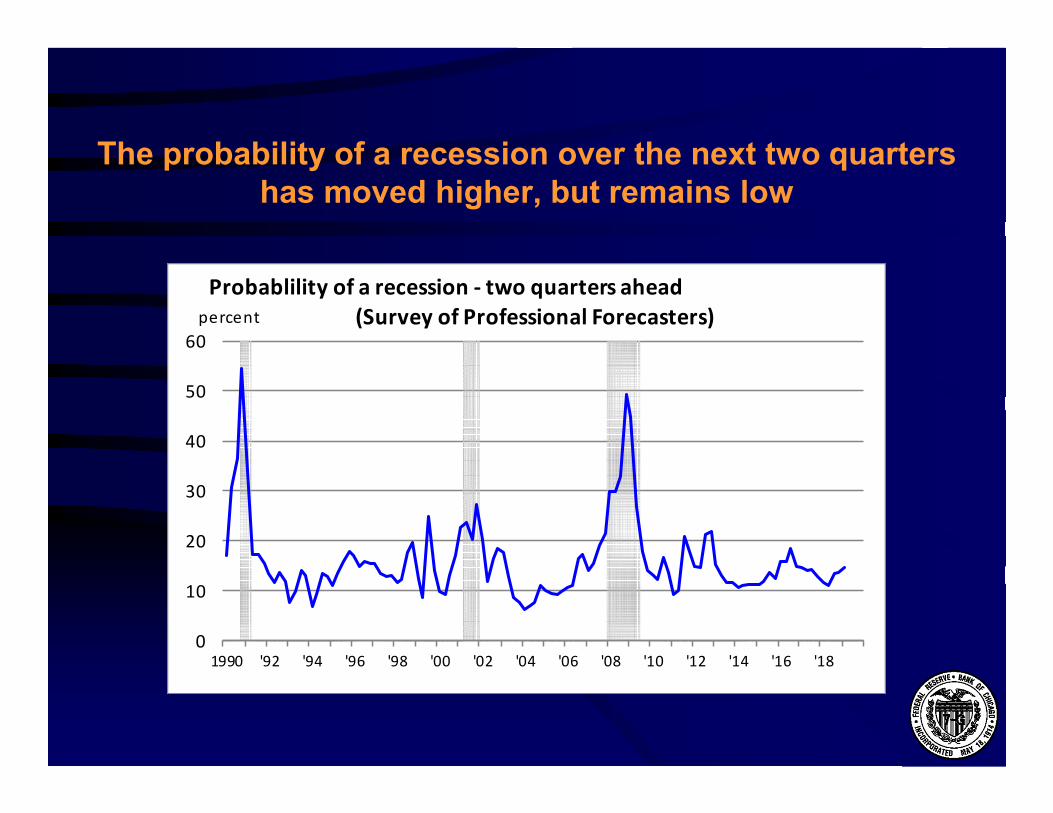
The probability of a recession over the next two quarters
has moved higher, but remains low
0
10
20
30
40
50
60
1990 '92 '94 '96 '98 '00 '02 '04 '06 '08 '10 '12 '14 '16 '18
Probablility of a recession - two quarters ahead
(Survey of Professional Forecasters)percent
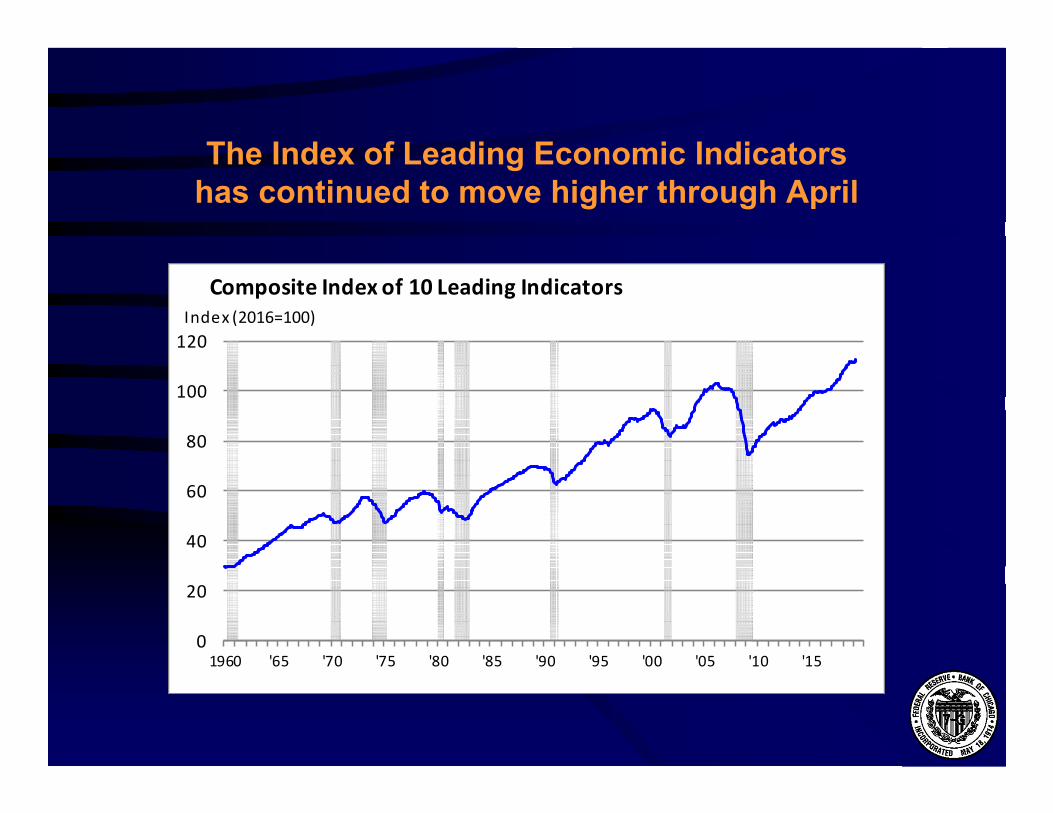
The Index of Leading Economic Indicators
has continued to move higher through April
0
20
40
60
80
100
120
1960 '65 '70 '75 '80 '85 '90 '95 '00 '05 '10 '15
Composite Index of 10 Leading Indicators
Index (2016=100)

Employment increased by over 2.6 million jobs
over the past 12 months
-8
-6
-4
-2
0
2
4
6
1990 '92 '94 '96 '98 '00 '02 '04 '06 '08 '10 '12 '14 '16 '18
Total employment
percent
Monthly change (saar)
Percent change from a year earlier

3
4
5
6
7
8
9
10
11
1990 '92 '94 '96 '98 '00 '02 '04 '06 '08 '10 '12 '14 '16 '18
Unemployment rate
percent
The unemployment rate fell to a very low 3.6% in April,
the lowest reading since 1969

3
4
5
6
7
8
9
10
11
1990 '92 '94 '96 '98 '00 '02 '04 '06 '08 '10 '12 '14 '16 '18 '20
Unemployment rate
percent
FOMC
The FOMC forecasts that the unemployment rate
will be below the natural rate through 2021
FOMC Central Tendency (March 2019)
2019 3.6 – 3.8
2020 3.6 – 3.9
2021 3.7 – 4.1
Longer run 4.1 – 4.5

Wages and benefit costs continue to increase
at a moderate rate,
although it may finally be picking up some its pace
0
1
2
3
4
5
6
7
8
1990 '92 '94 '96 '98 '00 '02 '04 '06 '08 '10 '12 '14 '16 '18
Employment cost index
percent change from year ago
benefit costs
wages and salaries
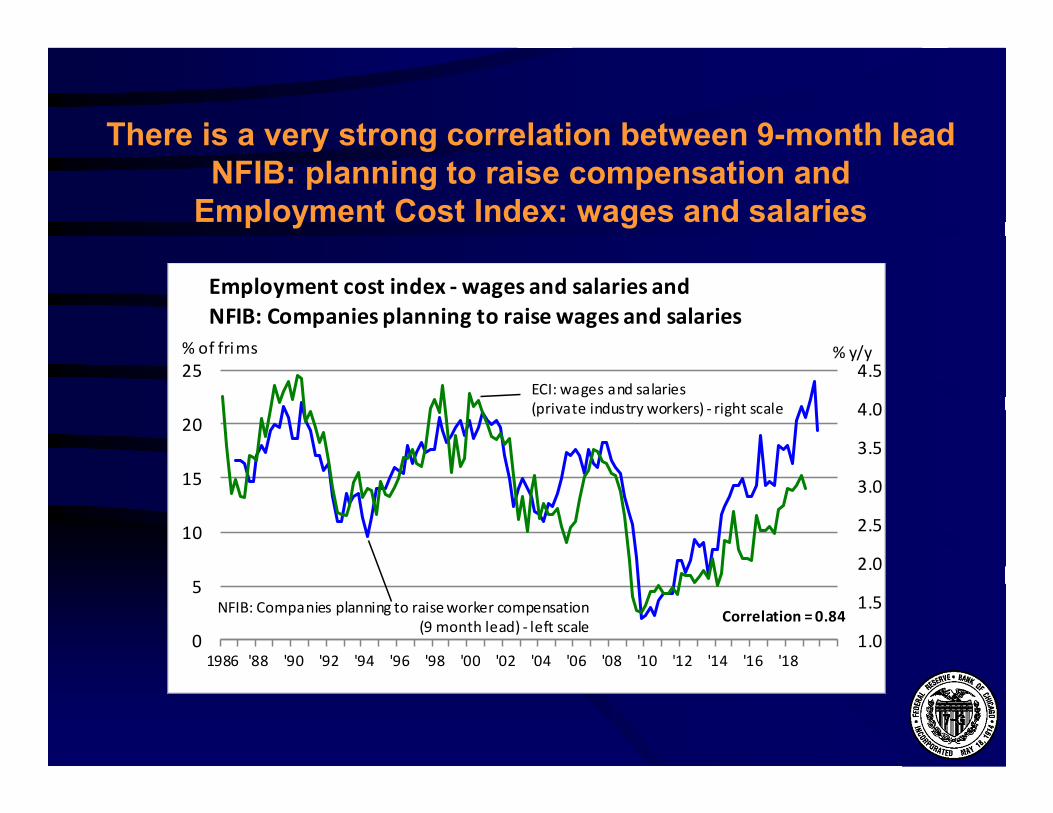
There is a very strong correlation between 9-month lead
NFIB: planning to raise compensation and
Employment Cost Index: wages and salaries
1.0
1.5
2.0
2.5
3.0
3.5
4.0
4.5
0
5
10
15
20
25
1986 '88 '90 '92 '94 '96 '98 '00 '02 '04 '06 '08 '10 '12 '14 '16 '18
Employment cost index - wages and salaries and
NFIB: Companies planning to raise wages and salaries
% of frims
ECI: wages and salaries
(private industry workers) - right scale
NFIB: Companies planning to raise worker compensation
(9 month lead) - left scale
% y/y
Correlation = 0.84

Slow productivity growth over the past nine years
helps explain why relatively strong employment growth
has not translated into higher wages
-1
0
1
2
3
4
5
1950 '55 '60 '65 '70 '75 '80 '85 '90 '95 '00 '05 '10 '15
Productivity
percent change (20-qtr rate)

A large part of the weakness in productivity growth
has been the weak pace of investment,
although it has been increasing at a strong pace
beginning in 2017
-30
-20
-10
0
10
20
1990 '92 '94 '96 '98 '00 '02 '04 '06 '08 '10 '12 '14 '16 '18
Real private nonresidential fixed investment
percent
Quarterly change (saar)
Percent change from a year earlier

This may help explain the productivity
growth improvement over the past couple of years
-3
-2
-1
0
1
2
3
4
5
6
7
8
1950 '55 '60 '65 '70 '75 '80 '85 '90 '95 '00 '05 '10 '15
Productivity
percent change from a year earlier

-15
-10
-5
0
5
10
15
20
1950 '55 '60 '65 '70 '75 '80 '85 '90 '95 '00 '05 '10 '15
Unit labor cost
percent
Quarterly change (saar)
Percent change from a year earlier
Improving productivity growth is helping to keep
unit labor cost growth down even with compensation rising

-100
-50
0
50
100
150
200
1990 '92 '94 '96 '98 '00 '02 '04 '06 '08 '10 '12 '14 '16 '18
Nonfinancial corporate profits
percent
Quarterly change (saar)
Percent change from a year earlier
Corporate profits continue to improve

-2
-1
0
1
2
3
4
5
6
1990 '92 '94 '96 '98 '00 '02 '04 '06 '08 '10 '12 '14 '16 '18
Personal consumption expenditure - chain price index
percent change from a year earlier
Inflation is below the Fed target of 2%

0
20
40
60
80
100
120
140
160
1970 '75 '80 '85 '90 '95 '00 '05 '10 '15
Real West Texas Intermediate oil price
dol lars per barrel, 2018 dollars
In large part inflation has been following
the pattern of energy prices

3
4
5
6
7
8
9
10
1960 '65 '70 '75 '80 '85 '90 '95 '00 '05 '10 '15
Energy goods and services expenditures as a share of
total consumptionpercent
Expenditures on energy remain
well below the historical average
3
4
5
6
7
8
9
10
1960 '65 '70 '75 '80 '85 '90 '95 '00 '05 '10 '15
Energy goods and services expenditures as a share of
total consumptionpercent
60s
70s
80s
90s 00s
1960-2018
10s

0
1
2
3
4
5
1990 '92 '94 '96 '98 '00 '02 '04 '06 '08 '10 '12 '14 '16 '18
Personal consumption expenditure - less food and energy -
chain price indexpercent change from a year earlier
Removing the volatile food and energy
components from the PCE,
“core” inflation is below 2%

The FOMC anticipates that PCE inflation will be around
its two percent target through 2021
-2
-1
0
1
2
3
4
5
6
1990 '92 '94 '96 '98 '00 '02 '04 '06 '08 '10 '12 '14 '16 '18 '20
Personal consumption expenditure - chain price index
percent change from a year earlier
FOMC
FOMC Central Tendency (March 2019)
2019 1.8 – 1.9
2020 2.0 – 2.1
2021 2.0 – 2.1
Longer run 2.0

0
1
2
3
4
5
1990 '92 '94 '96 '98 '00 '02 '04 '06 '08 '10 '12 '14 '16 '18 '20
Personal consumption expenditure - less food and energy -
chain price indexpercent change from a year earlier
FOMC
The FOMC anticipates that “core” PCE inflation
will also remain around two percent through 2021
FOMC Central Tendency (March 2019)
2019 1.9 – 2.0
2020 2.0 – 2.1
2021 2.0 – 2.1

Inflation Exchange Rate
Real GDP % change Against Interest Rates
% change Annual US Dollar 3-Month
Annual Consumer Prices End of Year End of Year
2018 2019 2020 2018 2019 2020 2019 2020 2019 2020
United States 2.9 2.6 1.9 2.4 1.9 2.2 - - 2.42 2.39
Canada 1.8 1.6 1.7 2.3 1.9 2.0 1.31 1.30 1.92 2.11
Mexico 2.0 1.6 1.8 4.9 3.9 3.7 19.90 20.15 8.09 7.64
Japan 0.8 0.7 0.5 1.0 0.9 1.2 109.1 107.9 -0.03 -0.01
South Korea 2.7 2.3 2.4 1.5 1.1 1.7 1,125 1,104 1.94 2.11
United Kingdom 1.4 1.2 1.4 2.5 2.0 2.0 1.34 1.39 0.93 1.20
Germany 1.5 0.9 1.4 1.9 1.6 1.7 1.16 1.21 -0.24 -0.07
France 1.6 1.3 1.4 2.1 1.3 1.5 1.16 1.21 -0.24 -0.07
Euro Zone 1.8 1.2 1.4 1.8 1.4 1.5 1.16 1.21 -0.24 -0.07
Brazil 1.1 1.9 2.5 3.7 3.9 4.0 3.84 3.79 6.26 6.79
Russia 2.3 1.5 1.7 2.9 4.9 4.0 66.01 64.71 7.40 7.05
China 6.6 6.3 6.1 2.1 2.3 2.4 6.73 6.69 2.91 2.99
India 7.4 7.1 7.2 3.9 4.2 4.7 70.19 69.92 6.63 6.64
Blue Chip Economic Indicators Forecast May 10, 2019
Blue Chip International Consensus Forecasts

Jun-18 Jul-18 Aug-18 Sep-18 Oct-18 Nov-18 Dec-18 Jan-19 Feb-19 Mar-19 Apr-19 May-19
Globa l 53.0 52.8 52.6 53.2 52.0 52.0 51.5 50.8 50.6 50.6 50.4 49.8
United Sta tes 55.4 55.3 54.7 55.6 55.7 55.3 53.8 54.9 53.0 52.4 52.6 50.5
Canada 57.1 56.9 56.8 54.8 53.9 54.9 53.6 53.0 52.6 50.5 49.7 50.0
Mexico 52.1 52.1 50.7 51.7 50.7 49.7 49.7 50.9 52.6 49.8 50.1 50.1
Eurozone 54.9 55.1 54.6 53.2 52.0 51.8 51.4 50.5 49.3 47.5 47.9 47.7
Germany 55.9 56.9 55.9 53.7 52.2 51.8 51.5 49.7 47.6 44.1 44.4 44.3
France 52.5 53.3 53.5 52.5 51.2 50.8 49.7 51.2 51.5 49.7 50.0 50.6
Ita ly 53.3 51.5 50.1 50.0 49.2 48.6 49.2 47.8 47.7 47.4 49.1 49.7
Spa in 53.4 52.9 53.0 51.4 51.8 52.6 51.1 52.4 49.9 50.9 51.8 50.1
UK 54.4 53.8 53.0 53.6 51.1 53.6 54.2 52.8 52.1 55.1 53.1 49.4
Russia 49.5 48.1 48.9 50.0 51.3 52.6 51.7 50.9 50.1 52.8 51.8 49.8
Japan 53.0 52.3 52.5 52.5 52.9 52.2 52.6 50.3 48.9 49.2 50.2 49.8
China 51.0 50.8 50.6 50.0 50.1 50.2 49.7 48.3 49.9 50.8 50.2 50.2
India 53.1 52.3 51.7 52.2 53.1 54.0 53.2 53.9 54.3 52.6 51.8 52.7
Brazil 49.8 50.5 51.1 50.9 51.1 52.7 52.6 52.7 53.4 52.8 51.5 50.2
Manufacturers’ Purchasing Managers Indexes

More open countries have had better growth

U.S. tariffs used to be much higher

Tariffs: U.S. versus other countries

Tariffs: U.S. versus other countries

Tariffs: Recent tariffs have now pushed the U.S. much higher

Tariffs: U.S. trade with Mexico is mainly intra-company trade

Tariffs: Significant amount of U.S. exports consists of
imports from other countries, especially for the auto industry

Tariffs: The auto industry dominates the import story

The Blue Chip forecast projects a continuing
deterioration in the balance of trade
-1200
-1000
-800
-600
-400
-200
0
2000 '01 '02 '03 '04 '05 '06 '07 '08 '09 '10 '11 '12 '13 '14 '15 '16 '17 '18 '19 '20
Net exports
bi l lions of chained 2012 dollars (saar)
Q1-2019
Blue Chip Forecast

0
500
1,000
1,500
2,000
2,500
1980 '85 '90 '95 '00 '05 '10 '15 '20
Housing starts
thousands
Blue Chip Housing Starts
Forecast (thousands)
Actual Forecast
2018 2019 2020
1,249 1,234 1,261
The Blue Chip Forecast calls for a continuation
of the very gradual recovery in housing

Manufacturing output growth has slowed to zero
-40
-30
-20
-10
0
10
20
30
40
1990 '92 '94 '96 '98 '00 '02 '04 '06 '08 '10 '12 '14 '16 '18
Industrial production - manufacturing
percent
Monthly change (saar) Percent change from a year earlier

62
64
66
68
70
72
74
76
78
80
82
84
86
1990 '92 '94 '96 '98 '00 '02 '04 '06 '08 '10 '12 '14 '16 '18
Capacity utilization - manufacturing
percent
Capacity utilization has been falling

Manufacturing employment increased by
204,000 workers over the past 12 months
-25
-20
-15
-10
-5
0
5
10
15
1990 '92 '94 '96 '98 '00 '02 '04 '06 '08 '10 '12 '14 '16 '18
Manufacturing employment
percent
Monthly change (saar)
Percent change from a year earlier

Year-to-date light vehicle sales are 16.8 million units in 2019,
1.7% below the comparable period from a year earlier
89
10111213141516171819202122
1990 '92 '94 '96 '98 '00 '02 '04 '06 '08 '10 '12 '14 '16 '18
Light vehicle sales
mil lions of units (saar)

Year-to-date 2019 light truck sales were 1.6% higher,
while year-to-date 2019 passenger car sales were 8.8% lower
3
4
5
6
7
8
9
10
11
12
13
1990 '92 '94 '96 '98 '00 '02 '04 '06 '08 '10 '12 '14 '16 '18
Passenger car and light truck sales
mil lions of units (saar)
light trucks
passenger cars

Light truck market share is at a record high
30
35
40
45
50
55
60
65
70
75
1990 '92 '94 '96 '98 '00 '02 '04 '06 '08 '10 '12 '14 '16 '18
Light truck share of light vehicle market sales
percent

Alternative powered vehicles (including hybrids)
are a very small fraction of total vehicle sales
0
10
20
30
40
50
60
70
80
90
100
1990 '92 '94 '96 '98 '00 '02 '04 '06 '08 '10 '12 '14 '16 '18
Power-Type
percent of total sales
Alternative
Gasoline and Diesel

Alternative powered vehicles (including hybrids)
market share remains below 5%
0
1
2
3
4
5
6
1990 '92 '94 '96 '98 '00 '02 '04 '06 '08 '10 '12 '14 '16 '18
Alternative Powered Vehicles
percent of total sales

Blue Chip forecasts vehicle sales to
move lower this year and in 2020
10
11
12
13
14
15
16
17
18
1980 '85 '90 '95 '00 '05 '10 '15 '20
Vehicle sales
mil lions of units
Blue Chip Light-Vehicle
Sales Forecast
Actual Forecast
2018 2019 2020
17.2 16.7 16.4

The industrial sector’s output growth
had been solid during 2018
Manufacturing Industries Activity ChartGrowth (3-month moving average)
compared with the most recent 5-year trend
Current 3 Month Moving Average Growth is:Above Trend and Accerating
Above T rend and DeceleratingBelow Trend and AcceleratingBelow T rend and Decelerating
Contracting but ImprovingContracting and Deteriorating
5-year Trend 2014 2015 2016 2017 2018 2019Manufacturing 0.7%Wood Products 3.0%Nonmetallic Minera l Products 2.1%Primary Metals -1.1%Fabricated Metal Products 0.1%Machinery -1.2%Computer and Electronic Components 2.9%Electrica l Eqpt, Appliances & Components -0.2%Motor Vehicles and Parts 1.8%Aerospace & Misc. T ransport Equip -0.3%Furniture and Related Products 0.9%Miscellaneous Durable Goods 0.8%Food, Beverages, and Tobacco 1.3%Textile and Product Mills -1.1%Apparel and Leather Goods -6.3%Paper -1.5%Printing and Related Support Activities -1.1%Chemicals 1.3%Petroleum and Coal Products 0.5%Plastics and Rubber Products 1.2%

The supply managers’ composite index
has been moving lower
30
35
40
45
50
55
60
65
1990 '92 '94 '96 '98 '00 '02 '04 '06 '08 '10 '12 '14 '16 '18
Purchasing managers' index - composite
net percent reporting increases

-25
-20
-15
-10
-5
0
5
10
2000 '01 '02 '03 '04 '05 '06 '07 '08 '09 '10 '11 '12 '13 '14 '15 '16 '17 '18 '19 '20
Total industrial production
percent
Quarterly change (saar)
Percent change from a year earlier
Q1-2019
Blue Chip CPI Forecast
Actual Forecast
2018 2019 2020
4.0 1.2 1.5
Industrial production is forecast to rise
at a slower pace this year and in 2020

Credit spreads between Corporate High Yield securities
and Corporate Aaa securities increased
towards the end of last year,
although it has pulled back this year

The yield curve has flattened
-1
0
1
2
3
4
1990 '92 '94 '96 '98 '00 '02 '04 '06 '08 '10 '12 '14 '16 '18
Yield curve - 10-year Treasury note yield minus
3-month Treasury bill yieldpercent

-1
0
1
2
3
4
2000 '01 '02 '03 '04 '05 '06 '07 '08 '09 '10 '11 '12 '13 '14 '15 '16 '17 '18 '19 '20
10-year T-Note to 3-month T-Bill spread
percent
Q1 -2019
percent
Blue Chip Forecast
Blue Chip does not expect the yield curve to invert

0
1
2
3
4
5
6
7
8
9
1990 '92 '94 '96 '98 '00 '02 '04 '06 '08 '10 '12 '14 '16 '18
Fed Funds rate
percent
The Federal Reserve increased the
Federal Funds rate by 2.25% since December 2015

0
1
2
3
4
5
6
7
8
9
1990 '92 '94 '96 '98 '00 '02 '04 '06 '08 '10 '12 '14 '16 '18 '20
Target Federal Funds Rate
percent
FOMC
The Federal Funds Rate is expected to be
just below the neutral range in 2019
and at the bottom end of the neutral range in 2020 and 2021
FOMC Central Tendency (March 2019)
2019 2.4 – 2.6
2020 2.4 – 2.9
2021 2.4 – 2.9
Longer run 2.5 – 3.0

0
500
1,000
1,500
2,000
2,500
3,000
3,500
4,000
4,500
Assets of the Federal Reserve
Bi l lions of dollars
Term Auction Credit
Securities Held Outright
Central Bank Swaps
Maiden Lane II & III
Commercial Paper Facility
2007 '08 '09
Term Asset-Backed Securities
Loan Facility
AIG Support
Maiden Lane
'10 '11 '12 '13 '14 '15 '16 '17 '18
The Fed’s balance sheet has been falling since October 2017
and will end the balance sheet reduction in September 2019

•The outlook is for the U.S. economy to expand at a pace
just above trend in 2019 and close to trend in 2020 and 2021
Summary
•Employment is expected to rise moderately with the
unemployment rate remaining very low
•Inflation is forecast be at the Fed’s Inflation target through 2021
•Vehicle sales are anticipated to edge lower this year and in 2020
•Manufacturing output is expected to increase at a somewhat
slower pace in 2019 and 2020
•Housing is predicted to improve at a modest pace

www.chicagofed.org
www.federalreserve.gov