Fast temperature changes for polymerase chain...
55
BSc Report Fast temperature changes for polymerase chain reaction (PCR) on a lab-on-a-chip (LoaC) L.M.J. Nijsten FACULTY OF SCIENCE AND TECHNOLOGY Mesoscale Chemical Systems Examination Committee: Prof. dr. ir. H.J.M. ter Brake Energy, Materials & Systems Prof. dr. J.G.E. Gardeniers Mesoscale Chemical Systems Dr. ir. R.M. Tiggelaar Mesoscale Chemical Systems B. B. Bruijns MSc Mesoscale Chemical Systems Enschede, January 2013
Transcript of Fast temperature changes for polymerase chain...

BSc Report
Fast temperature
changes for
polymerase chain
reaction (PCR) on a
lab-on-a-chip (LoaC)
L.M.J. Nijsten FACULTY OF SCIENCE AND TECHNOLOGY Mesoscale Chemical Systems
Examination Committee: Prof. dr. ir. H.J.M. ter Brake Energy, Materials & Systems Prof. dr. J.G.E. Gardeniers Mesoscale Chemical Systems Dr. ir. R.M. Tiggelaar Mesoscale Chemical Systems B. B. Bruijns MSc Mesoscale Chemical Systems
Enschede, January 2013

1 L.M.J. Nijsten BSc Report University of Twente Mesoscale Chemical Systems January 2013

2 L.M.J. Nijsten BSc Report University of Twente Mesoscale Chemical Systems January 2013
Table of Contents
Summary ................................................................................................................................................. 4
1 Introduction ..................................................................................................................................... 5
2 Literature research .......................................................................................................................... 6
2.1 Polymerase Chain Reaction ..................................................................................................... 6
2.1.1 General ............................................................................................................................ 6
2.1.2 PCR methods ................................................................................................................... 7
2.1.3 PCR speed ........................................................................................................................ 7
2.2 PCR in microfluidic systems ..................................................................................................... 9
2.2.1 Chip designs ..................................................................................................................... 9
2.2.2 Materials ........................................................................................................................ 11
2.2.3 Cooling ........................................................................................................................... 13
2.2.4 Heating .......................................................................................................................... 15
2.3 Discussion .............................................................................................................................. 17
2.4 Conclusions ............................................................................................................................ 18
3 Experimental research ................................................................................................................... 19
3.1 Configuration of the PCR chip ............................................................................................... 19
3.2 Analytical calculations ........................................................................................................... 21
3.2.1 Heating block temperatures .......................................................................................... 21
3.2.2 Heating/cooling length .................................................................................................. 22
3.2.3 Conclusions .................................................................................................................... 25
3.3 Numerical calculations .......................................................................................................... 25
3.3.1 Validation....................................................................................................................... 25
3.3.2 Configuration and assumptions..................................................................................... 25
3.3.3 Methods ........................................................................................................................ 27
3.3.4 Results and discussion ................................................................................................... 28
3.3.5 Conclusions .................................................................................................................... 32
3.4 Experiments ........................................................................................................................... 33
3.4.1 Materials and Methods ................................................................................................. 33
3.4.2 Temperature control ..................................................................................................... 34
3.4.3 Temperature measurements in chip ............................................................................. 35
3.4.4 Results and discussion .................................................................................................. 37
3.4.5 Conclusions .................................................................................................................... 39

3 L.M.J. Nijsten BSc Report University of Twente Mesoscale Chemical Systems January 2013
4 Conclusions .................................................................................................................................... 40
4.1 Main conclusions ................................................................................................................... 40
4.2 Recommendations................................................................................................................. 40
5 References ..................................................................................................................................... 41
Appendices ............................................................................................................................................ 47
I. Analytical Calculations ............................................................................................................... 47
Deriving Taverage .............................................................................................................................. 47
Insulation assumption ................................................................................................................... 47
II. Simulations ................................................................................................................................ 48
Validation of: ................................................................................................................................. 48
III. Assignment ............................................................................................................................ 52

4 L.M.J. Nijsten BSc Report University of Twente Mesoscale Chemical Systems January 2013
Summary To obtain a DNA profile from a sample found on a crime scene, there are several steps that need to
be executed. First the DNA has to be extracted from the sample, then the DNA has to be duplicated
several times to get enough material to analyse, and finally the DNA profile has to be made. This
research focuses on the DNA multiplication step.
The goal of this research is to find a chip design optimised for thermal cycling to perform the PCR
reaction as fast and efficient as possible. This research is divided into two parts.
First, a literature study is done in search for an optimised chip design. Secondly, experimental
research is performed to investigate the influence of adding a cooling element to the chip on the
thermal cycle. Analytical and numerical calculations were made and an experimental setup was used
to verify model results.
From the literature research a chip design is proposed for the fastest amplification time: a
continuous droplet flow chip with an optimised length of the extension zone (i.e. adjusted to the
velocity of the fluid, the cycle number, the speed of the polymerase and the length of the amplicon).
The materials of which this chip is composed should have low thermal conductivity, to make well
separated temperature zones possible. As heating method thin element heaters in/near the fluid
channel should be used, to localise the heat close to the fluid (for efficient heating with minimised
losses).
Simulations showed that adding a cooling element between the denaturation and elongation zones
improves the thermal cycling. For all simulated velocities in a channel with a cross section of 200 x
200 µm, the cooling element ensures a 20% decrease of the combined heating and cooling time (per
cycle). Both smaller channels and the use of narrower denaturation heaters might be possibilities of
further reducing the cycling time.
From simulations in combination with experiments (with PDMS/glass chips with external
heating/cooling) it is concluded that the cooling element indeed reduces the temperature transition
time between the denaturation and extension zone, thus making faster temperature transitions
possible.

5 L.M.J. Nijsten BSc Report University of Twente Mesoscale Chemical Systems January 2013
1 Introduction The deoxyribonucleic acid (DNA) of every human is unique, except for identical twins [1]. Therefore it
can be very useful to use in forensic investigations to identify suspects or victims. The first time DNA
evidence used to identify an offender was in the late eighties of last century [2].
Since then, there obviously have been a lot of developments in the use of DNA as forensic evidence.
But what lies ahead? A futuristic image would be a handheld device that, within minutes, could
obtain a DNA profile from a sample and compare this with a database of DNA profiles to find
suspects of the crime. Such a device combines several apparatus, used in a laboratory on one chip; a
lab-on-a-chip.
A first step in the direction of such a system, which compares DNA profiles with a database, would be
a handheld device that could indicate if there is human DNA present is a sample: a presumptive test.
If human DNA is indeed found, the sample can be investigated further in the forensic laboratory,
thereby reducing the number of samples to be investigated in detail, which saves costly time.
To obtain a DNA profile from a sample found on a crime scene, there are several steps that need to
be executed. First the DNA has to be extracted from the sample, then the DNA has to be duplicated
several times to get enough material to analyse, and finally the DNA profile has to be made.
This research focuses on the DNA multiplication step. To increase the amount of DNA from the
sample, needed to obtain a DNA profile, the polymerase chain reaction (PCR) is used to duplicate
specific parts of the DNA. The PCR reaction will be discussed in more detail in section 2.1. For now it
is sufficient to know that for this reaction to take place, the sample needs to go through a
temperature cycle several times.
The speed of the PCR reaction depends on several factors. One of them is the speed of an enzyme
used to copy the DNA. Another factor is the speed and accuracy at which the different temperatures
are reached. Not only the speed of the reaction increases with faster temperature rates, but also the
specificity (the correct part of the DNA multiplied) and the efficiency (the yield of the PCR cycle) of
the reaction is favoured by fast and accurate temperature changes [3-5].
Therefore, the goal of this research is to find a chip design optimised for thermal cycling to perform
the PCR reaction as fast and efficient as possible. This research is divided into two parts.
First, a literature study is done in search for an optimised chip design. In this section the PCR reaction
is treated in more detail including the theoretical limit of the PCR. Next an overview is given of chip
design types, materials and cooling and heating methods mentioned in literature, leading to the
design conclusion for the fastest chip.
Secondly, experimental research has been done to investigate the influence of adding a cooling
element to the chip on the thermal cycle. Before actually fabricating the chip and doing practical
experiments in the lab, analytical and numerical calculations are made. The analytical calculations are
used to estimate the dimensions needed in the simulations. The numerical modelling will be
compared to these calculations and will give an impression what the influence of the cooling element
will be. Practical experiments will confirm whether a cooling element might decrease the time
needed from sample to DNA detection.

6 L.M.J. Nijsten BSc Report University of Twente Mesoscale Chemical Systems January 2013
2 Literature research
2.1 Polymerase Chain Reaction
2.1.1 General
The Polymerase Chain Reaction (PCR) is a reaction with which parts of DNA are duplicated by an
enzyme called polymerase. The reaction can be divided in three main steps, denaturation, annealing
and extension/elongation. These three steps have different optimal reaction temperatures. The
temperature ranges commonly used for denaturation, annealing and extension are 90-95 °C, 50-70
°C and 70-75 °C, respectively [6-8] (see Figure 1).
Figure 1 PCR reaction steps. Edited from [5]
DNA consists of two bonded polymer strands: double stranded DNA (dsDNA). During the
denaturation step the dsDNA template splits into single stranded DNA (ssDNA). After the
temperature is lowered to the annealing temperature the ssDNA reacts with primers.
The primers are nucleotide sequences which form the starting point of a particular fragment of the
DNA that will be amplified; the amplicon. By modifying the nucleotide sequence of the primer, the
amplicon can be chosen to be human specific [9, 10]. It is critical not to undershoot the annealing
temperature to prevent false annealing of the primers. This would decrease the specificity of the PCR
[7, 11].
When the primers are attached, an enzyme called polymerase reacts with the DNA-primer complex
and starts the extension of the primers by adding nucleotides to the ssDNA. By increasing the
temperature, the annealing is diminished and the extension is favoured.
Finally the temperature is raised to the denaturation temperature again to denaturise all double
stranded DNA followed by the next cycle of annealing and extension.
After every successful cycle the amount of target DNA sequence is doubled [12]. With this
exponential increase, typically 20-40 cycles are needed to get a detectable amount of DNA resulting
in a detection time varying from couple of hours for commercial PCR machines [7] to several minutes
for lab-on-a-chip devices [13, 14].

7 L.M.J. Nijsten BSc Report University of Twente Mesoscale Chemical Systems January 2013
Typical detection methods include fluorescence-based DNA detection and capillary electrophoresis
[15]. With fluorescence-based detection the amount of DNA can be monitored in real time.
Intercalator dyes, such as SYBR Green, bind to the DNA and the fluorescence signals from the
interaction between the dye and the increasing amount DNA can be optically detected [15].
2.1.2 PCR methods
There are several ways of performing the PCR reaction. The conventional way is the three steps PCR.
The three main steps are performed at their optimal temperatures. Alternatively, the three steps can
be combined into an isothermal reaction or divided into two temperature regimes. Limiting the
temperature regimes reduces the complexity of chips for PCR, since less thermal cycling is needed.
However, performing steps at non-optimal temperatures can result in lower product yield, speed or
specificity.
Isothermal PCR has been investigated in the MCS group [10], but although it would dramatically
decrease the complexity of the chip, it is not specific enough for forensic purposes and/or need very
complex enzymes [16]. Besides the complex enzymes, the amplification times of different isothermal
techniques are in the range of 20 minutes [17] to more than an hour [13]; not even close to the fast
amplification times that will be mentioned in 2.1.3.3.
The two step PCR reaction combines the annealing and extension step. The temperature at which the
combination of these steps is performed is critical for the results because a lower temperature is
favourable for annealing, while higher temperature benefits the extension. It has been shown that
the product yield does not differ much from the three step reaction when the extension temperature
is below 70 °C [7]. By using the two step PCR reaction, the efficiency of the available primers and the
specificity of the reaction can even increase (compared to the three step reaction), because false
priming occurs less when the annealing is done at higher temperatures [7, 11].
Overall, the two step reaction is proven to be time saving per cycle and it uses less reagents
compared to the conventional three step reaction [18].
2.1.3 PCR speed
There are two definitions that one should pay attention to. First the cycle time: the time needed to
complete one cycle. The second is the amplification or detection time: the time needed until a
detectable amount of DNA is formed. A short cycle time could lead to a longer amplification time
when the efficiency of the cycle is lower than a somewhat longer cycle time (and thus, more cycles
are needed). So, besides the cycle time, the efficiency of the cycle should also be taken into account.
2.1.3.1 Cycle time limit
The different steps of the PCR cycle have different time limits. The denaturation and annealing occur
much faster than the time needed for elongation [4, 19]. The time for denaturation and annealing
has been claimed to occur instantaneously when the correct temperatures is reached [20], while the
elongation depends on the length of the required product [2], polymerase speed and the diffusion
time of primers and polymerase [14].
By using small volumes, for example nano litre droplets, the diffusion times are negligible compared
to the time needed for the polymerase to extend the amplicon [4, 14, 21]. The most commonly used
human specific polymerase is the Thermus Aquaticus (Tag) polymerase. The extension rate of Taq is

8 L.M.J. Nijsten BSc Report University of Twente Mesoscale Chemical Systems January 2013
temperature dependent. At 55 °C the extension rate is 24 nucleotides per second and at optimum
temperature of 72 °C it is around 60-100 nucleotides per second [22]. A faster polymerase found in
literature is the Thermococcus Kodakaraensis (KOD) polymerase with an extension rate of 100-130
nucleotides per second at an optimum temperature of 75 °C [23, 24]. Theoretically for a 200 base
pair (bp) amplicon (a typical length needed to identify human DNA [25]) this would result in a
minimum elongation time of two seconds.
2.1.3.2 Cycle times in practice
Although the denaturation and annealing times are stated previously as negligible, there are
experiments done were the denaturation needs to take at least 2 seconds and the annealing time has
a minimum of about 5 seconds, to maintain significant yield [3, 26].
Also reports have been made on varying the elongation time with the cycle number to increase the
yield [3, 27]. This is explained by the fact that in the beginning the amount of primer and polymerase
is excessive compared to the amplicons, while after a couple of cycles this ratio is lowered and the
elongation time has to be extended [12, 27]. Another reason can be the inhibition effect of the
materials surrounding the reaction mixture. It has been shown [28] that surface adsorption of Taq
polymerase (rather than DNA) is responsible for the inhibition.
There have been attempts to approach the theoretical limit of the PCR. Cycle times as short as 5.2
seconds for a 500 bp amplicon using Taq polymerase have been reported with a continuous flow
device [7]. Assuming the speed of Taq polymerase to be 100 nucleotides per second, this is very close
to the theoretical limit.
2.1.3.3 Shortest amplification time
The fastest PCR chip has a cycle time of 4.5 seconds [8], resulting in an amplification time of just 90
seconds. This was achieved for an amplicon of 176 bp, so it did not approach the Taq polymerase
limit of 1.8 seconds per cycle.
The PCR reaction approaching the theoretical limit of the polymerase, as mentioned above, was just
a little slower with an amplification time of 1.7 minutes for 20 cycles [7].
Compared to commercial thermal cyclers (with detection times in the order of hours as mentioned in
2.1.1) the efficiency of is latter PCR chip was significantly lower: with a fluid velocity of 1 mm s-1 the
efficiency was only 25% [7]. This efficiency decreased even further with increasing velocity. Reasons
for this low efficiency could be inhibition of the Taq polymerase because of the high surface-to-
volume ratio and/or the non-optimised duration in the different temperature zones [7].

9 L.M.J. Nijsten BSc Report University of Twente Mesoscale Chemical Systems January 2013
Input Output
2.2 PCR in microfluidic systems
In search for the fastest PCR reaction on chip the main requirement for the design is fast and precise
temperature cycling. The chip types, materials and heating and cooling methods can all be selected
based on this requirement.
Secondary requirements that can be taken into account for a handheld DNA-profile producing
device, are compatibility with pre- and post-processes, small footprint (size of device) and low power
consumption. At the end of each section a table is given which summarises the section with values
ranging from ‘- -‘, via ‘-‘, ‘+/-‘, ‘+’ to ‘++’. These values are rather subjectively chosen, however, it is
just intended to give a clear overview of the possibilities.
2.2.1 Chip designs
There are several chip designs reported for DNA multiplication. Roughly the designs can be divided
into ‘chamber based’ and ‘continuous flow’.
2.2.1.1 Chamber based
In a chamber or well based design, the PCR solution stays in a reaction chamber (no flow/ static)
while the temperature is cycled [29] (Figure 2). This design allows small reaction volumes to be
cycled rapidly through the different temperature because of the small thermal mass of the mixture.
Besides small reaction volumes, fast temperature changes can be accomplished with materials of
high thermal conductivity and low thermal capacity: they can be heated and cooled fast.
In combination with thin film heaters (see section 2.2.4.1) a heating rate of 175 °C s-1 and a cooling
rate of 125 °C s-1 of a 100 nL sample was realised [3]. This resulted in a cycle time for an amplicon of
82 base pairs of 8,5 seconds [3].
Disadvantages of this design include the absence of high throughput possibilities and risk of cross
contamination between experiments [30, 31].
Figure 2 Simplified chamber based chip
2.2.1.2 Continuous flow
The fastest cycle and amplification times are, as mentioned in section 2.1.3, 2.1.3.2, achieved with
continuous flow designs.
The sample in a continuous flow PCR device is moved through fixed temperature zones (indicated
with different colours in Figure 3). Not the complete reaction chamber has to be heated and cooled
repeatedly, but only the reaction mixture has to change temperature. Compared to a chamber based
chip this provides simplified temperature control, low energy consumption and it greatly decreases
thermal transition times which on its turn reduces the cycling time [7, 14, 26, 27, 31, 32].
To ensure that the different temperature zones are well insulated, materials with low thermal
conductivity [7] or air gaps [33] can be used [30]. In case of materials with low thermal conductivity,
it is easier to establish different fixed temperature zones in parallel in comparison with high thermal
conductivity materials. For example, the use of silicon with different temperature zones leads to a
Reaction chamber

10 L.M.J. Nijsten BSc Report University of Twente Mesoscale Chemical Systems January 2013
high power consumption device with hard to separate temperature zones, leading to low PCR yield
[34]. This latter is due to the fact that heat from the heated denaturation zone easily flows to the
cooling zone, resulting in a cooler denaturation zone and a hotter cooling zone.
The continuous flow design can be subdivided into designs with fixed and adjustable cycle numbers.
With a fixed-loop (Figure 3A) design the number of cycles is determined the design of the chip [15,
32], while with closed-loop (Figure 3B) and oscillatory devices (Figure 3C) the cycle number is
adjustable [35, 36].
Figure 3 Representation of A: a fixed-loop continuous flow chip, B: a closed-loop continuous flow chip, C: an oscillatory chip. The colours representing three different temperature zones for denaturation (red), annealing or cooling (yellow)
and extension (blue).
Adjustable cycle numbers are convenient when the amount of DNA per sample differs. Extra cycles
can be added for lower concentrations of DNA in a sample. The complexity of (fabrication and
control of) the device however will increase compared to a fixed-loop design.
2.2.1.3 Virtual reaction chamber
For both chamber based and continuous flow devices a way to increase the rate of change of
temperature is by reducing the thermal mass of the sample.
A decreased sample volume will increase the surface-to-volume ratio. Thus, more sample is in
contact with the surrounding material, which is preferable for faster temperature changes. However,
a higher surface to volume ratio also increases the inhibition effect (as mentioned in section 2.1.3.2)
by the surrounding materials on the PCR [15, 28, 37, 38]. To prevent contact between the sample and
the surrounding material, oil can be used to form virtual reaction chambers; nano litre droplets of
sample in oil.
The use of droplets of sample in oil adds an advantage for fast temperature changes. Oil has a lower
thermal mass than water and thus can respond more rapidly to the surrounding temperature and
thus will reach the operating temperatures more quickly [26].
Besides the prevention of inhibition and increasing temperature rates, droplet-based systems also
avoid cross contamination and diffusional dilution while running many PCR assays simultaneously
[26, 37, 39].

11 L.M.J. Nijsten BSc Report University of Twente Mesoscale Chemical Systems January 2013
Finally, droplets in a continuous flow chip enable fast mixing because the droplets experience a
dipolar, circulating flow, as can be seen in Figure 4. Fast mixing of the PCR sample (DNA, polymerase
and primers) enables more efficient PCR.
Figure 4 Mixing due to a dipolar, circulating flow experienced by droplets in a micro channel [40]
2.2.1.4 Summarising table
Table 1 Overview of chip designs
Chip designs Temperature
cycling
Pre/post
compatibility
Device
footprint
Ease of
fabrication
Chamber
(no flow) ++ - + -
Continuous flow fixed
loop + + + +
Continuous flow
closed loop + - +/- -
Droplet flow ++ +/- +/- +/-
2.2.2 Materials
In literature there are several materials mentioned to be used for a microfluidic lab-on-a-chip device.
Roughly the materials can be divided in conventional materials and polymers. Depending on the chip
design the best suitable material or combination of materials can be chosen.
2.2.2.1 Conventional materials
The conventional materials are glass and silicon. Most of the PCR micro chambers/channels
mentioned in literature are made of silicon [30]. There are several reasons for using silicon. First, the
techniques to fabricate complex chip structures are well known [41]. Secondly silicon has a high
(temperature dependent) thermal conductivity [42] which is favourable for fast temperature ramping
in a chamber based chip. Thirdly the mechanical strength ensures robust designs [3].
Disadvantages include the silicon surface properties: it has to be covered with a coating to make PCR
possible, since Si and SiO2 inhibit the PCR [30, 43]. There is also a downside to the high thermal
conductivity: silicon requires thermal insulation to prevent heat loss (and thus high energy

12 L.M.J. Nijsten BSc Report University of Twente Mesoscale Chemical Systems January 2013
consumption) resulting in more complex designs [15]. Furthermore silicon cannot be easily used in
combination with optical detection techniques (like the fluorescence-based DNA detection
mentioned in section 2.1.1) because of its opacity [15].
The use of glass circumvents this opacity problem because of its superior optical transparency [30].
Other properties are the well-defined surface chemistries (which allows coating methods to prevent
inhibition) [30] and the lower thermal conductivity of glass in comparison to silicon. The latter
ensures that no additional insulation is required on chip [30], but does not perform as well as silicon
in a chamber based design.
2.2.2.2 Polymers
A promising alternative for the conventional materials are polymers. There is a wide range of
polymers used for PCR chips, including polydimethylsiloxane (PDMS), polymethylmethacrylate
(PMMA) and polycarbonate (PC) [15, 28]. Overall these materials are cheaper than glass and silicon,
and have lower thermal conductivities, which is favourable in combination with steady state
temperature zones.
PDMS is one of the most commonly used polymers because of its optical transparency, flexibility,
ease of fabrication and biocompatibility [15, 38, 44, 45]. Disadvantages include possible loss of
sample because of the high permeability [15, 38, 46].
Another example of an inexpensive and versatile polymer is PMMA. PCR chips of this material can be
fabricated in minutes using a CO2 laser for ablation (removal of material from the surface) [47]. It can
be used in combination with optical detection techniques [15] because of relatively low amounts of
auto fluorescence [48]. Combined with low adsorption interaction of single-stranded DNA with
PMMA [48] it seems a good material to use. The relatively low glass transition temperature (Tg),
however, might cause problems when used as material for a PCR chip, although no deformation was
observed in earlier research for short (<40 min) application [49].
A polymer that does not have the disadvantage of low glass transition temperature is polycarbonate.
This material can withstand the high temperatures of a PCR cycle [15]. Besides high Tg , the low
thermal capacitance makes polycarbonate chips less sensitive to thermal disturbances when used in
steady state [50].
A disadvantage of the use of polycarbonate can be the significant amount of auto fluorescence that it
generates. When fluorescence readout techniques are used, this could lower the detection limit [51].
This effect can be enhanced by the large levels of nonspecific adsorption to the PC [52].
The properties of polyimide [53] make this material also suitable for use in a DNA multiplication chip.
It has a high Tg (350°C) and optical transmission in range in which IR mediated thermo cycling (see
section 2.2.4.2) can be done [53].
2.2.2.3 Other materials
Besides silicon, glass and the polymers mentioned above, there are several other materials used for
PCR devices. Among them are ceramics, aluminium, 317 stainless steel, LiNbO3 and some special
polymers like perfluoroalkoxy-modified polytetrafluoroethylene (PFA) and cyclic olefin copolymer
(COC). Because their properties are not as favourable compared to the materials mentioned in

13 L.M.J. Nijsten BSc Report University of Twente Mesoscale Chemical Systems January 2013
section 2.2.2.1 and 2.2.2.2, they are not widely used [30] and will not be taken into account in this
work.
2.2.2.4 Coating
Almost every material that is used for PCR devices has to be coated to prevent inhibition of the
reaction and improve the signal-to-noise ratio [38]. The inhibition effect can be weakened by treating
the surface with dichlorodimethylsilane (DCDMS) or bovine serum albumin (BSA), thereby improving
the PCR efficiency [28, 38].
The improved results come to a cost of extra fabrication of modification steps. The BSA treatment is
faster and easier to perform compared to treatment with DCDMS, but the results show large
variation and the BSA may interact problematic with a fluorescent dye, used for temperature sensing
[15].
2.2.2.5 Summarising table
Table 2 Overview of materials used for PCR chips
Materials Thermal
conductivity
Optical
Transparancy
PCR
compatibilty
(inhibition)
Ease of
fabrication Costs
Glass - ++ - - +/-
Silicon ++ -- - +/- --
PDMS -- + +/- ++ +
2.2.3 Cooling
Between the denaturation and annealing step, the temperature of the PCR mixture has to drop 30-40
°C, depending on which PCR technique is used. This temperature decrease can be accomplished
either actively or passively.
2.2.3.1 Passive cooling
Passive cooling can be done by using a chip design with a high surface to volume ratio. In this way
heat is dissipated by convection to the surroundings, which is quite effective [3, 7, 41]. To improve
this dissipation, polycarbonate can be used to form a fin [50] or a copper block can be attached to
dissipate heat from the micro-channel to the surroundings. When the chip uses small reaction
volumes, this cooling method is sufficient to achieve fast cycling [3].

14 L.M.J. Nijsten BSc Report University of Twente Mesoscale Chemical Systems January 2013
2.2.3.2 Active cooling
To increase the cooling rates, active cooling can be used. Active cooling is not widely used though.
Most active cooling systems increase the size of the chip, the device consumes more power, and it
complicates the design [6, 7, 41].
To make PCR cycling faster for somewhat larger reaction volumes (μL instead of nL) or high fluid
velocities in a continuous flow chip [7], active cooling seems necessary [7]. To increase cooling rates
there are several options.
First, compressed air or nitrogen gas can be blown over the chip to actively increase the dissipation
of heat [6, 54].
Secondly, endothermic processes, like the evaporation of acetone, can be used in a heat exchanger
to cool a micro channel [54]. Parallel to the channel containing the PCR fluid, a channel can be made
to flow through acetone. By varying the flow rate, the evaporation of acetone can be influenced and
thus the cooling effect can be adjusted. The power consumption is very low as an exception to most
active cooling techniques because vacuum is used as the driving force [54]. In case of using gas-
permeable PDMS the cooling effect is strengthened because the acetone vaporises through the
material, and temperature ramps of about 1 °C s-1 were obtained [54]. Besides these low
temperature rates, the possible leakage of a chip, caused by PDMS dissolving and swelling in acetone
[55], needs to be taken into account. A simpler solution could be to use water as the fluid for the
heat exchanger.
Thirdly, thermoelectric elements are able to generate a heat difference between the two sides of the
device based on the Peltier Effect [56], as can be seen in Figure 5. By switching the polarity the
elements can both be used for cooling and heating [46, 57]. A cooling rate of 1 °C s-1 was obtained in
previous work using a single chamber PDMS chip [9]. Peltier coolers have the advantage of a compact
and robust construction, because of the lack of mechanically moving parts [58, 59] and (at the cost of
power consumption) can generate high cooling capacities.
Figure 5 Cross section of a typical thermo electric cooler [25]

15 L.M.J. Nijsten BSc Report University of Twente Mesoscale Chemical Systems January 2013
2.2.3.3 Summarising table
Table 3 Overview of cooling techniques used for PCR chips
Cooling method Cooling capacity Ease of
fabrication Device footprint
Power
consumption
Compressed air +/- + - +/-
Heat exchangers +/- +/- - +/-
Thermoelectric
cooler (Peltier) + + +/- -
Passively - + + ++
2.2.4 Heating
The heating methods mentioned in literature can be divided into contact and non-contact heating
methods.
2.2.4.1 Contact heating methods
One aspect that contact heating methods have in common is that they add a certain amount of
thermal mass to the chip. This reduces the thermal response of the chip when a chamber design is
used [15].
The simplest form of contact heating uses metallic heating blocks, heated by resistors. The “large”
thermal mass results in lower temperature ramping rates and high power consumption [30].
Nevertheless, it is especially a reliable technique for precise thermal cycling performance [30, 60].
When used in combination with a continuous flow PCR chip with steady state temperature zones,
this can be very effective.
A method that complicates the chip design a bit more is heating with thin film heating elements [61].
The heaters are built in the chip located in/near the micro channels, thus in close contact with the
PCR mixture. On the one hand, with a more complex design the fabrication methods are costly and
reconfiguring the design is not easy [31, 62]. On the other hand , the heating rates, as mentioned in
2.2.1.1, can be very high because of the direct contact with the PCR mixture and the low thermal
mass of the heaters [3, 15]. An example of a material used for thin film heaters is indium-tin-oxide
(ITO). ITO heaters can be integrated in silicon and/or glass [44] and because it is a transparent
material fluorescent monitoring of the DNA multiplication can be used [44].
By adding metallic powder to a PDRM pre-polymer, the PDMS chip itself can be used for heating [45].
This unconventional technique has the advantages that it is cheap and it makes rapid prototyping

16 L.M.J. Nijsten BSc Report University of Twente Mesoscale Chemical Systems January 2013
possible. Due to the fact that the PDMS micro heater gradually degrades in time, especially at high
temperatures, it seems only of value when fixed temperature zones are used [45].
2.2.4.2 Non-contact heating methods
Non-contact heating methods do not add additional thermal mass to the chip and can be used for
disposable chips because the heating system is separate from the actual chip.
One way to heat the PCR mixture without direct contact is by using infrared (IR) light. A tungsten
lamp can be used to create the IR waves [6]. For a more focused beam, with better power and
wavelength control, a laser can be used [30, 63]. The IR heating can be divided into direct and
indirect heating of the PCR mixture.
Direct heating means that the IR beam specifically heats the liquid and not the surroundings. By
selecting the correct wavelength (in the range of 1-4 µm [64]) the excitation of vibrational bands
heats the water. Heating and cooling rates of a 160 nL sample of 65 °C s-1 and 20 °C s-1, respectively,
have been reported [64].
A wavelength of 1,460 μm is used [39, 63] for the heating of stationary water droplets in oil. With
this wavelength mainly the water and not the oil is heated, resulting in a low power consuming
device [63].
The direct IR heating technique has also been used in continuous flow devices [65], but for lower
temperatures than required for PCR.
With indirect heating the IR beam heats an absorbing target above the reaction channel. This
technique has been used in a continuous flow design [66]. The indirect heating method is preferable
when chip materials are used that are not optical transparent for the chosen wavelength.
Other non-contact heating methods include hot air/water cycling, which increases the footprint of
the chip, and induction and microwave based heating. Induction based heating has the advantages of
low power consumption and it is not necessary to position the PCR mixture very accurate with
respect to the heat source [67]. Finally, microwave heating is promising because the PCR efficiency
reached almost 70% of conventional PCR while the temperature ramping was shortened and uniform
field densities can be delivered by modern microwave cavities [68].

17 L.M.J. Nijsten BSc Report University of Twente Mesoscale Chemical Systems January 2013
2.2.4.3 Summarising table
Table 4 Overview of heating techniques used for PCR chips
Heating method Heating capacity Ease of
fabrication Device footprint Power efficiency
IR laser ++ - - ++
Hot air - - - --
External heater + ++ - --
Thin film ++ - ++ +
Microwave ++ +/- ? +
2.3 Discussion
The most efficient way of heating the PCR sample seems to be the non-contact IR technique, because
only the sample and not the surrounding material is heated. However, in recent literature the
heating and cooling rates were not impressive: 7 °C s-1 and 2 °C s-1 respectively [6], and even the
shortest cycling time mentioned in a recent review [13] was 12 seconds per cycle for a 500 bp
amplicon with a total amplification time for 15 cycles of just under four minutes [53].
The chamber based design has impressive heating and cooling rates [3], but the cycle time of 8.5
seconds and an amplification time of 5 minutes and 40 seconds is not even close to the fastest design
found in literature: continuous flow with a rather complicated configuration of thin film heaters,
insulating air pockets and passive cooling [7]. This design resulted, as mentioned before, in a cycle
time 5.2 seconds for a 500 bp amplicon, approaching the kinetic limit of Taq polymerase. Because of
the limiting speed of the polymerase the cycle time cannot be shortened by much. A way to get
detectable amounts of DNA faster, is by increasing the efficiency of the PCR to get the same yield in
fewer cycles.
To be able to detect even the smallest amount of DNA, it would be ideal to have adjustable cycle
numbers with real time DNA detection. The cycling can be stopped when DNA is detected or the
number of cycles can be increased when there is no DNA detected. However, a close loop design
does have the disadvantages of more complex fabrication and control.

18 L.M.J. Nijsten BSc Report University of Twente Mesoscale Chemical Systems January 2013
2.4 Conclusions
The fastest design seems to be a continuous flow chip with an optimised length of the extension zone
(i.e. adjusted to the velocity of the fluid, the cycle number, the speed of the polymerase and the
length of the amplicon). On top of that a droplet based design should be used to prevent inhibition
and increase the reaction speed of the sample to temperature changes.
The materials should have low thermal conductivity, or insulating materials or air gaps should be
used, to make well separated temperature zones possible. Therefore glass or polymers like PDMS are
favourable over silicon.
For the heating method thin element heaters in/near the channel should be used to localise the heat
as close to the fluid as possible: making efficient heating possible (with minimised losses). This is
especially the case for the denaturation zone, where only a small heating zone is required. The
extension zone could be heated with an easier to fabricate heating element.
In this work, the focus will be on a PDMS fixed-loop continuous droplet flow chip (on a glass slide),
due to ease of fabrication. Heating will be done with thick film heaters and cooling with Peltier
elements, as will be discussed in the next section.

19 L.M.J. Nijsten BSc Report University of Twente Mesoscale Chemical Systems January 2013
3 Experimental research As mentioned in the introduction, the heating and cooling of the PCR mixture has great influence on
the efficiency and specificity of the product. For efficient PCR the denaturation and
annealing/extension temperatures have to be reached fast, because transition times after
denaturation do not contribute to higher yield [4]. The specificity can be increased by cooling rapidly
after denaturation. Then the primer annealing will start instead of formation of non-specific by-
products. However, undershooting the annealing temperature could nullify this increased specificity
because of false annealing of the primers at lower temperatures (as mentioned in section 2.1.1).
The hypothesis is that by adding an active cooling element the temperature transition from the
denaturation to the annealing/extension could go faster thereby increasing the efficiency. In this case
‘cooling’ means the addition of a temperature zone below the temperature of the
annealing/extension zone (not necessarily below room temperature).
In this experimental research the effect of adding an active cooling element to a continuous flow chip
is investigated. The goal is to increase the cooling rate to increase the efficiency of the PCR with a
cycle time towards the kinetic limit of the polymerase.
3.1 Configuration of the PCR chip
The design used in this research is a PDMS/glass hybrid continuous flow chip. The cooling and
heating is done using a Peltier element and resistor heaters, respectively.
PDMS is chosen because of the ease of manufacturing, low costs and low thermal conductivity. The
latter also holds for glass which is used to support the PDMS. PDMS/glass is proven to maintain a
more uniform temperature than pure PDMS chips [69].
The Peltier element and resistor heaters are attached to aluminium blocks placed on the glass side of
the chip. With this configuration uniform temperature zones can be established with precise
temperature control as well as ease of manufacturing.
The cross section, side and top view of the chip can be seen in Figure 6. The channel width and height
are 200 µm. The channel length is adjusted to ensure a duration time of approximately two seconds
at the extension temperature when a maximum flow speed (see for more information section 3.3.3)
of 5 mm s-1 is used. With the denaturation heater and cooling element width of 2.5 mm (ease of
fabrication), this results in a 1:1:2 ratio of denaturation, cooling and extension.
20 L.M.J. Nijsten BSc Report University of Twente Mesoscale Chemical Systems January 2013
Figure 6 Chip configuration. A: Cross section of part of the test design configuration (not to scale). Dotted lines represent lines of symmetry. B: side view (not to scale). C: top view (drawn to scale)

21 L.M.J. Nijsten BSc Report University of Twente Mesoscale Chemical Systems January 2013
3.2 Analytical calculations
3.2.1 Heating block temperatures
For heating of the channel, resistive heaters in combination with aluminium blocks are used. To
estimate the temperature of the aluminium block, needed to heat the middle of the channel up to
the denaturation (or extension) temperature, a first approximation is used based on steady state
conduction in 1D (only heat transfer in the x direction) through a composite wall of glass, mineral oil
and PDMS.
With similar densities of mineral oil (0.8 g cm-3 [70]) and the PCR mixture (approximately 1 g cm-3),
the aqueous phase droplets will flow in the middle of the channel. Because of the large surface to
volume ratio of the droplets (6·104 and 1.2·105 for droplets with a diameter of 100 and 50 µm
respectively) they will respond very quickly to temperature changes of the oil [26]. Therefore the
temperature in the middle of the channel calculated with only one oil phase, will be approximately
the same as the droplet temperature.
The solution to this problem can be found using an example from chapter 3 of the book
‘Fundamentals of heat transfer’ by Frank P. Incropera [71]. In this example, an equivalent thermal
circuit for the steady state conduction through a composite wall is used. In this approximation the
liquid is assumed to be stationary and the contact resistances between the surfaces are not taken
into account. Also, in the x direction the temperatures of the neighbouring temperature zones are
not taken into account.
The one dimensional heat transfer (qz in Watt) may be expressed as
(1)
For the configuration as can be seen in Figure 7 this results in:
(
) (
) (
) (
)
(2)
The heat transfer coefficient can also be expressed over each element of the wall as folows:
(
)
(
)
(
)
(
)
(
)
(3)
Because of the linear temperature variaton in the elements of the wall, the temperature in the
middle of the channel is:
(4)

22 L.M.J. Nijsten BSc Report University of Twente Mesoscale Chemical Systems January 2013
By combining these equations the temperature in the middle of the aluminium block (=T1 ) can be
calculated. The middle of the aluminium block is taken, because in the practical experiments the
thermocouple will be placed here.
Using the values listed in Table 5 and Tchannel = 94 °C for the denaturation temperature, and 25 °C for
the surrounding air (T∞), T1 is 94.8 °C. This is only slightly above Tchannel because of the thin glass plate
and the insulating capacity of the PDMS layer. For the combined annealing and extension zone a
temperature of Tchannel = 65 °C, T1 shoulde be about 65.5 °C.
Table 5 composite wall characteristics [26, 29, 72-74]
Section material L: thickness of the layer (µm) k: thermal conductivity (W m−1 K −1)
h: heat transfer coefficient (W m-2 K-1)
a aluminium 2500 200 -
b glass 500 0.75 -
c mineral oil 200 0.17 -
d PDMS 3000 0.21 -
e air - - 10 [72, 73]
Figure 7 Composite wall conduction
3.2.2 Heating/cooling length
To estimate the length needed to heat the middle of the channel from 65 °C to 94 °C (and cool the
other way around) an analytical solution is applied, using the simplifcations that i) all the heat from
the heater goes through the glass into the liquid and ii) assuming the channel is insulated because of
the thick layer of PDMS with low thermal conductivity. This latter assumption is justified (see
verification in appendix I).
Derived from the equation used in chapter 8 of the book ‘Fundamentals of heat transfer’ by Frank P.
Incropera [71], the heat transfer from the glass sheet to the oil can be expressed as

23 L.M.J. Nijsten BSc Report University of Twente Mesoscale Chemical Systems January 2013
(5)
where h is the heat transfer coefficient of the channel, w the width of the channel, x the distance
traveled through the channel, Tw the wall temperature on the bottom of the channel, Taverage the
average oil temperature in the channel as a function of x, ṁ the mass flow in kg s-1 (calculated using
ṁ=Avρ, A being the channel cross section, v the mean oil velocity and ρ the density of the oil) and cp
the specific heat of the used mineral oil.
Equation 5 can be solved for Toil (derivation can be found in appendix I):
(6)
Figure 8 Simplified channel used for the analytical calculation of the length needed for heating/cooling
Table 6 variables used in the calculation
expression value unit
ρ density - 916 Kg m-3
Nu Nusselt number - 2.98 [75] -
k thermal conductivity - 0.17 W m−1 K −1
cp specific heat - 2000 J kg-1 K-1
w width/height of the channel - 200·10-6 m
v average fluid velocity - 5·10-3 m/s
P wetted perimeter 4w - m
A channel cross section w·w - m2
Dh hydraulic diameter 4A/P - m
h heat transfer coefficient
Nu·k/Dh - W m-2 K-1
ṁ mass flow v·A·ρ - Kg s-1

24 L.M.J. Nijsten BSc Report University of Twente Mesoscale Chemical Systems January 2013
Plotting this latter equation with Tw = 94 °C and Tin = 65 °C and variables as listed in Table 6, results in
the blue dotted line in Figure 9. After 3.2 mm 99.9% of Tw (in Kelvin) is reached. For 99.99% of Tw the
oil has to travel 4.8 mm. These same values hold for the case Tw = 65 °C and Tin = 94 °C (not shown).
When equation 6 is rewritten in
(
)
(7)
it can be seen that the length needed to reach the desired temperature is proportional to ṁ and thus
to the velocity of the fluid (equation 8).
(8)
Thus the time needed to heat or cool is proportional to the channel cross section (when the height
and width are equal):
(9)
With all other values constant and as listed in Table 6, the heating and cooling time is 0.97 seconds.
The average temperature rate is calculated by dividing Tw-Tin by the time needed to reach 99.99% of
Tw. For this approximation this results in a temperature gradient of 30 °C s-1 for both cooling and
heating.
Reducing the channel cross section will reduce the time (and length) needed to reach the set
temperature, as can be seen from equation 9. When a channel width and height of 100 µm are used
this results in a temperature gradient of four times that of a 200 x 200 µm channel: 120 °C s-1. This is
comparable to the high heating and cooling rates mentioned in section 2.2.1.1 for a chamber based
chip.
Figure 9 Plot of the analytically calculated Taverage along the channel with an inlet and wall temperature of 65 °C and 94 °C, respectively.

25 L.M.J. Nijsten BSc Report University of Twente Mesoscale Chemical Systems January 2013
3.2.3 Conclusions
From these analytical approximations it can be concluded that the temperature of the heating block
should be only slightly higher than the desired temperature (for the middle of the channel) and the
time needed to heat from 65 °C to 94 °C is proportional to the channel cross section.
3.3 Numerical calculations
To calculate the temperatures in the final chip more precisely, the chip geometry, as shown in Figure
6, has to be modelled numerically. The simulations have been done with finite element analysis (FEA)
software. The influence of adding a cooling block to the chip is investigated and will be compared to
the experimental results in section 0. Based on the simulations a chip design can be made with (near)
optimal channel lengths to let the fluid just the desired denaturation temperature and keep it for
sufficient time (two seconds as mentioned in 2.1.3.1) at the extension temperature and eventually
make the PCR cycle as fast and efficient as possible.
3.3.1 Validation
To validate the results of the FEA simulations, four elements used in the simulation are separately compared to examples that can be analytically calculated, as can be seen in in appendix II .
1. Steady state conduction 2. Convective heating/cooling 3. Pressure drop 4. Symmetry boundary condition
From these validations can be concluded that the results of the FEA simulations are in close agreement with the analytical calculations. Therefore it is assumed a combination of these elements will also result in representative results.
3.3.2 Configuration and assumptions
The geometry used in the simulations is represented in Figure 10 and Figure 11. The dimensions of
the chip are stated in Table 8 and are mainly chosen for ease of fabrication in the experimental
section.
Table 7 Geometry dimensions used in the simulation
Geometry Value Unit
Aluminium height 5 mm
Annealing/extension zone width (a) 5.5 (2x) mm
Cooler width (b) 2.5 mm
Denaturation zone width (c) 4.5 mm
Distance between aluminium blocks 0.5 mm
Glass height 0.5 mm
PDMS height 3 mm
Channel height 200 µm
Channel width 200 µm
To reduce the computational power needed for the simulation, several assumptions and
simplifications were made. First of all only a single cycle in the middle of the chip, as indicated on the

26 L.M.J. Nijsten BSc Report University of Twente Mesoscale Chemical Systems January 2013
right of Figure 10, is simulated and simplified to a straight channel, as can be seen on the left side of
Figure 10.
The second simplification is the line symmetry with respect to the dotted lines in Figure 11 (one
through the middle of the channel and one on the left side of the geometry). Because of these
symmetries the temperature gradient at these boundaries is zero.
For the liquid flowing through the channel laminar flow was assumed, with no slip conditions at the
channel boundaries as in previous simulations mentioned in literature [7, 26].
Other boundary conditions include the temperature on the bottom of the aluminium blocks and the
convective cooling at the sides of the aluminium blocks and the top of the PDMS layer (these values
can be found in the next section; Table 9).
Figure 10 Left: Side view of the geometry used in the simulation representing one cycle as in the dotted area in the right figure. Right: top view of simplified chip. Arrows indication flow direction. Colours represent, denaturation zone (red),
cooling element (yellow), annealing/extension zone (orange).
Figure 11 Cross section of the simulated geometry. The dotted line represents a line of symmetry. On the top and bottom the temperature boundary conditions are applied.

27 L.M.J. Nijsten BSc Report University of Twente Mesoscale Chemical Systems January 2013
3.3.3 Methods
The FEA program used is called COMSOL Multiphysics ® version 4.3.1.115. Two sets of so-called “physics” were used: the “Laminar flow” and “heat transfer” (in solids and fluids) physics. The results from the “Laminar flow” simulations were used in the heat transfer simulations. By keeping these physics separate, computational time was reduced dramatically compared to the combined physics called “Conjugate Heat Transfer”. Because of the assumption of constant fluid properties (independent of temperature), the results from the combined physics did not differ from the separated physics. The mesh used for the simulations was a so called “extra fine physics-controlled mesh” with almost 38.000 elements, with a minimal element size of 29 µm. The plot of the mesh can be seen in Figure 12.
Figure 12 Extra fine physics-controlled mesh used in the simulations with on the right a close up of the channel
The simulations were made using the material properties listed in Table 8. The temperatures set as
boundary conditions at the bottom of the aluminium blocks (for the annealing/extension,
denaturation and cooling zones) are listed in Table 9. The temperature of the air is set to 25 °C with a
heat transfer coefficient of 10 W m-2 K-1; the same as in the analytical calculations.
The droplets moving in the middle of the channel will have approximately the velocity of the fluid in
the middle of the channel (vcenter). The residence time of the droplets in the different temperature
zones should be calculated using this center velocity. That is why vcenter is given, instead of vaverage
(over the channel cross section) or the flow rate in µL min-1 (as indicated on syringe pumps available
in the MCS laboratory).
Table 8 Material properties [26, 29, 72-74] used in simulations
Specific Heat (J kg−1 K−1)
Thermal conductivity (W m−1 K −1)
Density (kg m-3)
PDMS 1500 0,21 970
Glass 835 0,75 2500
Mineral oil 2000 0.17 916
28 L.M.J. Nijsten BSc Report University of Twente Mesoscale Chemical Systems January 2013
Table 9 Velocities and temperatures used in simulations
vcenter (mm s-1) Tdenaturation (°C) Tcool (°C) Tannealing/extension (°C)
5 97.0 60 65.5
13 97.8 60 65.6
23 99.7 58 65.6
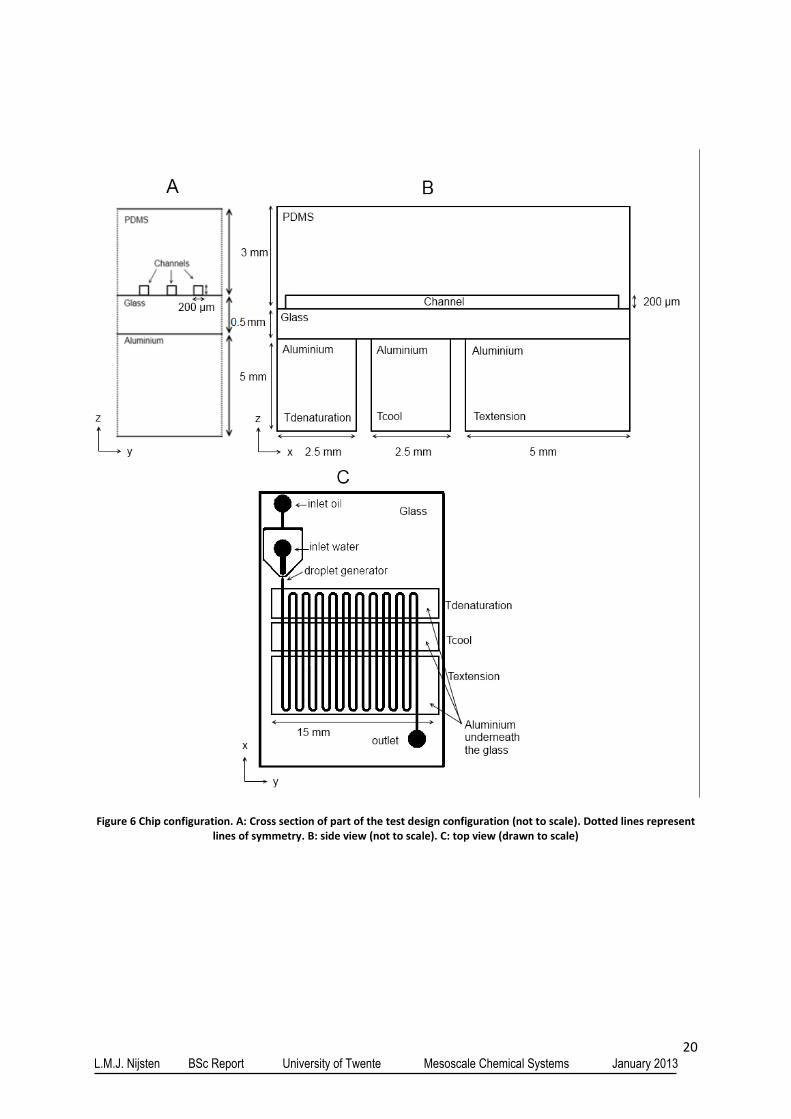
3.3.4 Results and discussion
In Figure 13 the simulated temperatures in the middle of the channel are shown for a 200 x 200 µm
channel for three different fluid velocities with and without a cooling element. The cooling rates of
the cooled chip (solid lines) are higher than a chip without active cooling (dotted lines). If the
temperature of the cooler is set at 60 °C 1, the fluid “undershoots” the extension temperature at low
velocities at both the transition from the extension to the denaturation zone (indicated with ① in
Figure 13) and from the denaturation to the extension zone (indicated with ② in Figure 13) . With
increasing velocity this ‘dip’ reduces at ②, but still visible at ① even at higher velocities because of
the smaller temperature difference between Textension and Tcool than between Tdenaturation and Tcool.
For the lower flow speeds (vcenter 5 and 13 mm s-1) the Tcool has to be increased to reduce the
“undershoot” of the extension temperature. In Figure 14 the temperature versus time is plotted with
Tcool of 64, 62 and 58 °C for vcenter of 5, 13 and 23 mm s-1, respectively.
The average heating (①) and cooling (②) rates for different velocities are listed in Table 10. These
values differ quite a bit from the heating and cooling rate of 30 °C s-1 calculated in section 3.2.2. The
difference can be explained by the fact that the transition from 94 °C to 65 °C (or the other way
around) is not instantaneously (as assumed in the analytical calculation). The conductivity of the glass
results in a gradual temperature gradient. At low velocities the liquid can adjust to this wall
temperature, resulting in a lower heating (and cooling) rate.
Besides a more gradual change of wall temperature, the maximum wall temperature in the
simulations is higher than 94 °C (as used in the analytical calculation) to ensure the temperature in
the middle of the channel reaches 94 °C. This results in higher heating rates for higher velocities.
A final difference is that in the simulation the temperature in the middle of the channel is calculated
instead of the average liquid temperature.
Table 10 Average heating and cooling rates for different fluid velocities in a 200 x 200 µm channel
Active/passive cooling
vcenter
(mm s-1) Heating rate (°C s-1)
Cooling rate (°C s-1)
Active (64 °C) 5 22 29
Passive 5 20 20
Active (62 °C) 13 48 72
Passive 13 46 46
Active (58 °C) 23 80 123
Passive 23 85 73
1 Simulations with the cooling elements passively cooled were made; the passively cooled elements reached a
temperature of about 70 °C. So active cooling is needed to reach 60 °C.

29 L.M.J. Nijsten BSc Report University of Twente Mesoscale Chemical Systems January 2013
Figure 13 Temperature of the middle of the channel versus distance. a, b, and c indicate the positions of the aluminium blocks at Tannealing/extension, Tcool and Tdenaturation (as listed in Table 9) , respectively. The channel dimensions are 200 x 200
µm.
In Figure 15 a close up of Figure 14 is shown for vcenter = 23 mm s-1. As indicated by the black dotted
lines the time at the extension temperature is different for a chip with or without active cooling. The
addition of an active cooling element decreases the transition time from Tdenaturation to Textension by
about 3x (x being 0.05 seconds), while at the heating side the residence time at Textension is shortened
by 1x. This gives a time reduction of about 2x = 0.1 seconds for one cycle.
For lower flow speeds this time reduction increases, as can be seen in Table 11. However, the relative
time reduction, i.e. when expressed as percentage of the time that a droplet is not at the extension
temperature (0.5, 1 and 2.5 seconds for 5, 13 and 23 mm s-1, respectively), is 20% for all simulated
velocities.

30 L.M.J. Nijsten BSc Report University of Twente Mesoscale Chemical Systems January 2013
Figure 14 Temperature versus time for a vcenter of 5, 13 and 23 mm s-1
in a 200 x 200 µm channel. Tcool is set at 64, 62 and 58 °C, respectively.
Figure 15 Close up of Figure 14 for a vcenter of 23 mm s-1
in a 200 x 200 µm channel. The black dotted lines indicate the difference in time at the extension temperature.

31 L.M.J. Nijsten BSc Report University of Twente Mesoscale Chemical Systems January 2013
Table 11 Time savings by addition of a cooling element for different fluid velocities in a 200 x 200 µm channel
Active/passive cooling
vcenter
(mm s-1) Heating time (s)
Cooling time (s)
Time savings (s)
Active (64 °C) 5 1.3 1.0 0.7
Passive 5 1.5 1.5
Active (62 °C) 13 0.6 0.4 0.2
Passive 13 0.6 0.6
Active (58 °C) 23 0.4 0.2 0.1
Passive 23 0.3 0.4
The analytical calculations show that the transition times (from extension to denaturation and the
other way around) are proportional to the channel cross section. Therefore simulations are made
with a channel of 100 x 100 µm to compare this to the 200 x 200 µm channel. The results of both
channel dimensions are plotted in Figure 16.
Because of the smaller dimensions and the lower thermal mass (smaller volume) in case of a 100 x
100 µm channel, the response of the channel temperature is faster to the changing wall temperature
compared to the 200 x 200 µm channel. The transition times for both heating and cooling are shorter
and (especially at higher velocities) the dip between Textension and Tdenaturation is reduced. This latter is
possible because of the higher Tcool (64 °C for all velocities).
Figure 16 Temperature versus time for a vcenter of 5, 13 and 23 mm s-1
in a 100 x 100 µm (Tcool = 64 °C for all velocities) and 200 x 200 µm channel (Tcool is set at 64, 62 and 58 °C, respectively).
Although the transition times are shorter for the 100 x 100 µm channel, they are not a quarter of the
heating and cooling times of 200 x 200 µm channel (as expected from equation 9 in section 3.2.2). A

32 L.M.J. Nijsten BSc Report University of Twente Mesoscale Chemical Systems January 2013
possible explanation for this is the gradual temperature gradient of the walls of the channel. To verify
this, simulations with a smaller heater were made. The temperatures of a configuration with a
smaller heater width (2.5 instead of 4.5 mm) for the denaturation zone are shown in Figure 17. The
figure shows that time for denaturation can be (further) reduced by narrowing the heater.
Figure 17 Temperature versus time for a vcenter of 5, 13 and 23 mm s-1
in a 100 x 100 µm (Tcool = 64 °C for all velocities) for a denaturation heating element size of 2.5 and 4.5 mm.
Two final remarks about the temperature cycles simulated in this section: i) the Textension used in the
simulation is 65 °C while the optimal temperature for the Taq or KOD polymerase is higher (72 and
75 °C, respectively). However, the effect of the cooling element at higher temperatures (not shown)
is the same. ii) The undershoot at ② in Figure 13, might (especially when a higher Textension is used)
increase the efficiency of the PCR cycle, because at lower temperature the annealing is favoured. By
doing experiments with PCR samples the effect of this dip could be investigated: will it improve the
annealing and efficiency or just increase the false annealing?
3.3.5 Conclusions
Adding a cooling element improves the thermal cycling. At the cost of a temperature dip at the end of the extension zone, the transition of denaturation to extension is faster. For all simulated velocities in a 200 x 200 µm channel, the cooling element ensures a 20% decrease of the combined heating and cooling time (per cycle). Furthermore, both smaller channels and the use of narrower denaturation heaters show possibilities of shorter cycling times. In conclusion, the cycle time can be reduced by using smaller channels, with higher fluid velocities and a cooling element.

33 L.M.J. Nijsten BSc Report University of Twente Mesoscale Chemical Systems January 2013
3.4 Experiments
3.4.1 Materials and Methods
3.4.1.1 The chip
The chip design can be seen in Figure 18. It is almost the same as described in section 3.1, except for
the addition of three side channels of 100 x 100 µm. These channels are used as inserts for the
thermocouples.
Figure 18 Chip design made in CleWin. The green areas indicate the positions of the heating and cooling blocks. The three grey lines on the right indicate the channels for the thermocouples
3.4.1.2 PDMS and glass
The PDMS was with the PDMS base silicone (Dow Corning Sylgard® 184 Base silicone elastomer) and
the curing agent (Dow Corning Sylgard® 184 curing agent silicone elastomer) in a 1:10 ratio. After
mixing the two components and degassing the mixture in a vacuum chamber, the PDMS was poured
over the SU-8 mold with the pattern as can be seen in Figure 18. The PDMS was cured at 80 °C for
four hours. Finally the PDMS was cut out and paced on a glass slide and bonded at 40 °C overnight.
The 0.5 mm glass slides were not available in time. Instead, a 1 mm thick microscope slide was used.
3.4.1.3 Heaters and cooler
The heaters for both the denaturation and extension zone were made by attaching thick film heaters
(CGS MPC55R0J) to aluminium blocks (2.5 x 5 x 15 mm and 5 x 5 x 15 mm for denaturation and
extension, respectively).
The cooling element was made of an aluminium block of 2.5 x 5 x 20 mm (somewhat larger than the
heating blocks) to leave space for the Peltier elements (Global Component Sourcing ET-007-06-11) as
can be seen in Figure 19. To improve the cooling capacity of the Peltier elements aluminium fins

34 L.M.J. Nijsten BSc Report University of Twente Mesoscale Chemical Systems January 2013
(mounted on a copper block) were attached to the heat sink. The power supply for the Peltier
elements was from Agilent (E3633A DC Power Supply).
All connections (between the aluminium, heaters, Peltier elements and fins) were made with (blue)
thermally conductive adhesive (Fischer Elektronik WLK 5). The configuration was assembled on a
microscope slide for stability (Figure 20). The heater for the extension zone was covered with a thin
layer of the thermal conductive glue to ensure a flat surface for the chip.
Figure 19 Close up of the Peltier elements attached to the aluminium cooling block
Figure 20 Heating and cooling configuration.
3.4.2 Temperature control
To control the temperatures of the heating blocks, 1 mm thermocouples (Omega Pt 100) were
inserted in the centre of both aluminium blocks. The thermocouples and the heating elements were

35 L.M.J. Nijsten BSc Report University of Twente Mesoscale Chemical Systems January 2013
connected to two home built temperature controllers (Pinotech). These temperature controllers
have an accuracy of about +/- 0.2 °C around the setpoint.
In het middle of the cooling block there was also a 1 mm thermocouple mounted. The read out of
this thermocouple was done with a thermometer (Yu Ching Technology Co., Ltd. YCT-747D Data
Logger Thermometer). The temperature could be adjusted manually by altering the current and/or
voltage of the power supply.
3.4.3 Temperature measurements in chip
The channel width and height of 200 µm were chosen to be large enough to insert the
thermocouples for temperature measurement in the channel. The inserts for the thermocouples
(grey lines on the right of Figure 18), with a width and height of 100 µm, were made to locate
thermocouples (with a wire diameter of 25 µm; OMEGA® fine-diameter thermocouple CHAL-001) in
the channel. Such inserts were positioned in the denaturation zone, the middle of the cooling zone
and the extension zone.
However, mounting the thermocouples in the channel was difficult. First of all the thermocouples
were very fragile. During assembly of the chip they were easily destroyed. Secondly, the
thermocouple did not fit in the 100 µm wide insert channel, because the tip spaced both 25 µm wires
(Figure 21).
Figure 21 Thermocouple (wire diameter of 25 µm) in the channel
One chip (with a thermocouple inside the channel) suffered from leakage due to bonding problems
of the PDMS to the glass with a thermocouple in between (Figure 22). Moreover, the thermocouple
was broken while connecting it to the thermometer.

36 L.M.J. Nijsten BSc Report University of Twente Mesoscale Chemical Systems January 2013
Figure 22 Bonding problems with thermocouple between glass and PDMS
Because of these difficulties a new approach was chosen. Only one thermocouple was put on a blank
glass slide (Figure 23) (thus, no PDMS fluidic structure on glass). Subsequently. the heating/cooling
unit was moved with respect to the thermocouple in such way that the tip was positioned at each of
the three locations, indicated in Figure 24. Measurements were taken approximately 50 µm above
the glass, with the thermocouple surrounded by air, immersed in a droplet of water or a droplet of
mineral oil (Sigma-Aldrich® M5904). A thermal conductive gel (Dow Corning DC4) was put between
the heating and cooling element and the glass slide to ensure good thermal contact.
Figure 23 Thermocouple on glass slide

37 L.M.J. Nijsten BSc Report University of Twente Mesoscale Chemical Systems January 2013
Figure 24 Positions of temperature measurements
3.4.4 Results and discussion
The following temperatures (Table 12 and Table 13) were measured with the thermocouples at
positions ①, ② and ③, with/without cooling and for various surrounding media (now flow/static).
Table 12 Measurements without active cooling (passive)
Measurement I.D.
Setpoints [°C] Position thermocouple
Medium on tip thermocouple
Measured temperature [°C]
1
Tdenat = 94.0 ± 0.2
Air 83.0 ± 0.3
Text = 65.0 ± 0.2 H2O 71.5 ± 0.5
Tcool = 66.4 ± 0.4 Oil 87.1 ± 0.3
2
Tdenat = 102.0 ± 0.2
Air 88.2 ± 0.3
Text = 65.0 ± 0.2 H2O 72.5 ± 0.5
Tcool = 68.7 ± 0.2 Oil 91.7 ± 0.5
3
Tdenat = 104.0 ± 0.2
Air 89.0 ± 0.3
Text = 65.0 ± 0.2 H2O 81.3 ± 0.4
Tcool = 70.2 ± 0.5 Oil 94.3 ± 0.2
4
Tdenat = 94.0 ± 0.2
Air 64.5 ± 0.3
Text = 65.0 ± 0.2 H2O 60.2 ± 0.4
Tcool = 66.0 ± 0.3 Oil 66.2 ± 0.4
5
Tdenat = 94.0 ± 0.2
Air 61.3 ± 0.5
Text = 65.0 ± 0.2 H2O 55.5 ± 0.5
Tcool = 67.5± 0.3 Oil 63.2 ± 0.5
6
Tdenat = 94.0 ± 0.2
Air 62.8 ± 0.7
Text = 67.0 ± 0.2 H2O 57.5 ± 0.5
Tcool = 67.3 ± 0.3 Oil 64.8 ± 0.5

38 L.M.J. Nijsten BSc Report University of Twente Mesoscale Chemical Systems January 2013
Power to the Peltier elements: 0.13 W for all measurements below.
Table 13 Measurements with active cooling: 0.13 W
Measurement I.D.
Setpoints [°C] Position thermocouple
Medium on tip thermocouple
Measured temperature [°C]
7
Tdenat = 94.0 ± 0.2
Air 83.5 ± 0.9
Text = 65.0 ± 0.2 H2O 55.5 ± 0.5
Tcool = 61.0 ± 0.2 Oil 63.2 ± 0.5
8
Tdenat = 104.0 ± 0.2
Air 85.8 ± 0.6
Text = 65.0 ± 0.2 H2O 80.0 ± 1
Tcool = 65.2 ± 0.1 Oil 94.7 ± 0.8
9
Tdenat = 94.0 ± 0.2
Air 63.5 ± 0.5
Text = 65.0 ± 0.2 H2O 57.0 ± 0.4
Tcool = 62.7 ± 0.2 Oil 63.9 ± 0.3
10
Tdenat = 94.0 ± 0.2
Air 60.5 ± 0.5
Text = 65.0 ± 0.2 H2O 56.4 ± 0.4
Tcool = 60.9 ± 0.5 Oil 61.5 ± 0.3
The temperatures measured for all positions show a better heat transfer (i.e. higher temperature)
when mineral oil was added on the surface. The addition of water resulted in lower temperatures
because of the evaporation of the water.
By comparing measurements 4 and 9 it can be seen that with this configuration it is possible to cool
the glass slide between the denaturation and extension zone in static conditions. This (combined
with the simulations) indicates the possibility of faster temperature transitions when a liquid flow is
used.
From the results of measurements 3 and 8 it can be seen that in order to reach a temperature of 94
°C of mineral oil, the heating block needs to be set at 104 °C. This is quite higher than the 94.8 °C
calculated in 3.2.1 and simulated in 3.3.4, which is explained by the thicker glass used in the
experiments and the absence of insulating PDMS. However, when taken into acoount the thicker
glass and the absence of PDMS, the analytical calculation gives 95.4 °C and the simulation 99.5 °C
(not shown) as the temperature for the heating block. An explanation might be the non-perfect
thermal contact between the heating block and the glass slide, as well as heat loss to the glass slide
at the bottom of the heating/cooling configuration. The same arguments hold for the extension zone
(measured 67 °C (measurement 6), calculated: 65.5 °C).
To improve the bonding between the glass and PDMS, larger inserts for the thermocouples could be
used. After mounting the thermocouples in the correct position, some PDMS could be added from
the outside of the chip to seal the insert channels. Another possibility is to fix the thermocouples to
the glass and then spin coat a thin layer of PDMS before attaching the PDMS chip. The heat transfer
to the fluidic channel is reduced because of the use of extra low conductive PDMS, but there will be
less chance of leakage of fluids.
When thermocouples could be mounted in the PDMS chip, the heating and cooling elements could
be attached directly to the glass slide, ensuring good thermal contact. With the configuration used, it
is not easy to ensure a flat surface and good contact between the heating and cooling elements and

39 L.M.J. Nijsten BSc Report University of Twente Mesoscale Chemical Systems January 2013
the glass slide. The electrical compound might have caused a direct thermal path between heating
and cooling blocks (rather than via the glass slide) which makes the separation of the temperature
zones less well defined.
Based on the difficulties with the small (25 µm) thermocouples, it seems reasonable to use larger
thermocouples (and larger channels). However, larger thermocouples have a larger thermal mass
that influences the measurements (less accurate).
Other temperature measurement techniques were considered. For example temperature
measurements using a thermal camera (not available, or too low resolution at < 100 °C) or
temperature dependent fluorescence of Rhodamine (or Rhodamine dextran), as investigated earlier
in the MCS group [76]. However, this latter technique was not used, because initial tests showed that
images(not shown) made through the PDMS (needed to estimate the temperature in the channel)
were blurry. This could be solved by taking images through the glass with the heating/cooling
configuration on the PDMS side. However, during the simulations there was also a design tested with
a cooling element embedded in the PDMS instead of beneath the glass, but this did not (even close)
work as efficient as a cooler on the glass side. PDMS has an even lower thermal conductivity than
glass and the distance between the cooling element and the channel will be larger when PDMS
instead of glass is used.
3.4.5 Conclusions
From the experiments it can be concluded that i) the setpoint temperature of the heating blocks
should be higher than analytically and numerically calculated, ii) the temperature measurement
technique and/or the fabrication process should be reconsidered to get temperature measurements
inside a channel with flowing liquid, and most important, iii) the cooling element does reduce the
temperature between the denaturation and extension zone, making faster temperature transitions
possible.

40 L.M.J. Nijsten BSc Report University of Twente Mesoscale Chemical Systems January 2013
4 Conclusions
4.1 Main conclusions
From the literature research a chip design is proposed for the fastest amplification time: a
continuous droplet flow chip with an optimised length of the extension zone (i.e. adjusted to the
velocity of the fluid, the cycle number, the speed of the polymerase and the length of the amplicon).
The materials of which this chip is composed should have low thermal conductivity, to make well
separated temperature zones possible. As heating method thin element heaters in/near the fluid
channel should be used, to localise the heat close to the fluid (for efficient heating with minimised
losses).
Simulations showed that adding a cooling element between the denaturation and elongation zones
improves the thermal cycling. For all simulated velocities in a channel with a cross section of 200 x
200 µm, the cooling element ensures a 20% decrease of the combined heating and cooling time (per
cycle). Both smaller channels and the use of narrower denaturation heaters might be possibilities of
further reducing the cycling time.
Experiments with PDMS/glass chips with external heating/cooling showed that the cooling element
indeed reduces the temperature between the denaturation and extension zone. In combination with
the simulations, it can be concluded that the temperature transition time between the denaturation
and extension zone will be reduced by addition of a cooling element, thus making faster temperature
transitions possible.
4.2 Recommendations
i) To verify the influence of the cooling element on the temperatures in flowing liquid, a chip design
should be used with larger insertion channels for the thermocouples. Alternatively, a different
temperature measurement technique could be used. For example, the fluorescence temperature
measurement technique could be used when transparent ITO thin film heaters are implemented in
the channel, instead of external aluminium heating blocks. The images can then be taken from the
glass side. Another alternative is the use of the ITO thin films as thermocouple inside the channel.
ii) The experimental research shows that faster temperature transitions are possible by adding a
cooling element. To investigate the effect of the faster transitions on the PCR reaction, experiments
with a PCR mixture in droplets should be done. Does the cooling element indeed increase the
efficiency and reduce the cycling time of the PCR?
iii) In section 2.2.4.2 it is mentioned that a direct IR heating technique has been used in continuous flow devices, but for lower temperatures than required for PCR. Further research into to the possibilities of this technique for PCR is recommended. It seems a promising technique when only the droplet could be heated by a laser and the oil is at a steady temperature of 65-70 °C. The droplets cool rapidly in the oil: no active cooler needed. Overall this might result in a fast and low power consuming device.

41 L.M.J. Nijsten BSc Report University of Twente Mesoscale Chemical Systems January 2013
5 References 1. DNA Technology in Forensic Science1992: The National Academies Press.
2. Bowyer, V.L., E.A.M. Graham, and G.N. Rutty, 9649 Forensic web watch - DNA in forensic science. Journal of Clinical Forensic Medicine, 2004. 11(5): p. 271-273.
3. Neuzil, P., Zhang, C., Pipper, J., Oh, S., Zhuo, L., Ultra fast miniaturized real-time PCR: 40 cycles in less than six minutes. Nucleic Acids Research, 2006: p. e77.
4. Wittwer, C.T., G.C. Fillmore, and D.J. Garling, Minimizing the time required for DNA amplification by efficient heat transfer to small samples. Analytical Biochemistry, 1990. 186(2): p. 328-331.
5. Fuchiwaki, Y., Nagai, H., Saito, M., Tamiya, E., Ultra-rapid flow-through polymerase chain reaction microfluidics using vapor pressure. Biosensors and Bioelectronics, 2011. 27(1): p. 88-94.
6. Yingjie Yu, B.L., Christopher A. Baker, Xinyu Zhang, and Michael G. Roper, Quantitative Polymerase Chain Reaction Using Infrared Heating on a Microfluidic Chip. Analytical Chemistry, 2012: p. 2825−2829.
7. Hashimoto, M., Chen, P. C., Mitchell, M. W., Nikitopoulos, D. E., Soper, S. A., Murphy, M. C., Rapid PCR in a continuous flow device. Lab on a Chip, 2004. 4(6): p. 638-645.
8. Kopp, M.U., A.J. De Mello, and A. Manz, Chemical amplification: Continuous-flow PCR on a chip. Science, 1998. 280(5366): p. 1046-1048.
9. Nelson, D.L., Ledbetter, S A, Corbo, L, Victoria, M F, Ramírez-Solis, R, Webster, T D, Ledbetter, D H , Caskey, C T, Alu polymerase chain reaction: a method for rapid isolation of human-specific sequences from complex DNA sources. Proceedings of the National Academy of Sciences, 1989. 86(17): p. 6686-6690.
10. Bork, A., Primer design for a presumptive human specific DNA-test, 2012, Saxion University of Applied Sciences: Enschede.
11. Wittwer, C.T., Herrmann, Mark G., Gundry, Cameron N., Elenitoba-Johnson, Kojo S. J., Real-Time Multiplex PCR Assays. Methods, 2001. 25(4): p. 430-442.
12. Dijksman, J.F. and A. Pierik, Mathematical analysis of the real time array PCR (RTA PCR) process. Chemical Engineering Science, 2012. 71(0): p. 496-506.
13. Ahmad, F. and S.A. Hashsham, Miniaturized nucleic acid amplification systems for rapid and point-of-care diagnostics: A review. Analytica Chimica Acta, 2012. 733: p. 1-15.
14. Schneegass, R. Brautigam, and J.M. Kohler, Miniaturized flow-through PCR with different template types in a silicon chip thermocycler. Lab on a Chip, 2001. 1(1): p. 42-49.
15. Zhang, C. and D. Xing, Miniaturized PCR chips for nucleic acid amplification and analysis: latest advances and future trends. Nucleic Acids Research, 2007. 35(13): p. 4223–4237.
16. Lam, L., Sakakihara, S., Ishizuka, K., Takeuchi, S., Arata, H., Fujita, H., Noji, H., Loop-mediated isothermal amplification of a single DNA molecule in polyacrylamide gel-based microchamber. Biomedical Microdevices, 2008. 10(4): p. 539-546.

42 L.M.J. Nijsten BSc Report University of Twente Mesoscale Chemical Systems January 2013
17. Piepenburg, O., Williams, C. H., Stemple, D. L., Armes, N. A., DNA Detection Using Recombination Proteins. PLoS Biol, 2006. 4(7): p. e204.
18. Chang-Qin Jing, L.W., Tian-Yun Wang, Jun-He Zhang, Wei-Hua Dong and Xiu-Hua Zhang, Amplification of deoxyribonucleic acid (DNA) fragment using two-step polymerase chain reaction (PCR). African Journal of Biotechnology, 2011. 10(15): p. 2838-2843.
19. Wittwer, C.T. and D.J. Garling, Rapid cycle DNA amplification: Time and temperature optimization. BioTechniques, 1991. 10(1): p. 76-78+80-83.
20. Saiki, R.K., The design and optimization of the PCR. In PCR Technology: Principles and Applications for DNA Amplification, 1989, Stockton Press: New York. p. 7-16.
21. Mamedov, T.G., Pienaar, E., Whitney, S. E., Ter Maat, J. R., Carvill, G., Goliath, R., Subramanian, A., Viljoen, H. J., A fundamental study of the PCR amplification of GC-rich DNA templates. Computational Biology and Chemistry, 2008. 32(6): p. 452-457.
22. Innis, M.A., Myambo, K. B., Gelfand, D. H., Brow, M. A. D., DNA sequencing with Thermus aquaticus DNA polymerase and direct sequencing of polymerase chain reaction-amplified DNA. Proceedings of the National Academy of Sciences of the United States of America, 1988. 85(24): p. 9436-9440.
23. Maltezos, G., Johnston, M., Taganov, K., Srichantaratsamee, C.,Gorman, J., Baltimore, D., Chantratita, W., Scherer, A., Exploring the limits of ultrafast polymerase chain reaction using liquid for thermal heat exchange: A proof of principle. Applied Physics Letters, 2010. 97(26): p. 264101-264101-3.
24. Takagi, M., Nishioka, M., Kakihara, H., Kitabayashi, M., Inoue, H., Kawakami, B., Oka, M., Imanaka, T., Characterization of DNA polymerase from Pyrococcus sp. strain KOD1 and its application to PCR. Applied and Environmental Microbiology, 1997. 63(11): p. 4504-4510.
25. Bruijns, B.B., Internal Report, 2012.
26. Mohr, S., Zhang, Y. H., Macaskill, A., Day, P., Barber, R., Goddard, N., Emerson, D., Fielden, P., Numerical and experimental study of a droplet-based PCR chip. Microfluidics and Nanofluidics, 2007. 3(5): p. 611-621.
27. Hua, Z., Rouse, Jeremy L., Eckhardt, Allen E. ,Srinivasan, Vijay ,Pamula, Vamsee K., Schell, Wiley A., Benton, Jonathan L., Mitchell, Thomas G., Pollack, Michael G., Multiplexed Real-Time Polymerase Chain Reaction on a Digital Microfluidic Platform. Analytical Chemistry, 2010. 82(6): p. 2310-2316.
28. T B Christensen, C.M.P., K G Gröndahl, T G Jensen, A Sekulovic, D D Bang and A Wolff, PCR biocompatibility of lab-on-a-chip and MEMS materials. JOURNAL OF MICROMECHANICS AND MICROENGINEERING, 2007: p. 1527–1532.
29. Zhi Qiang Niu, W.Y.C., Shi Yi Shao, Xiao Yu Jia and Wei Ping Zhang, DNA amplification on a PDMS–glass hybrid microchip. Journal of Micromechanics and Microengineering, 2006. 16(2): p. 425–433.
30. Zhang, C., Xu, Jinliang, Ma, Wenli, Zheng, Wenling, PCR microfluidic devices for DNA amplification. Biotechnology Advances, 2006. 24(3): p. 243-284.

43 L.M.J. Nijsten BSc Report University of Twente Mesoscale Chemical Systems January 2013
31. Samuel K. Njoroge, H.-W.C., Małgorzata A. Witek and Steven A. Soper, Integrated Microfluidic Systems for DNA Analysis, in Topics in Current Chemistry2011. p. 203-260.
32. Chen, J., Wabuyele, M., Chen, H., Patterson, D., Hupert, M., Shadpour, H., Nikitopoulos, D., Soper, S. A., Electrokinetically synchronized polymerase chain reaction microchip fabricated in polycarbonate. Analytical Chemistry, 2005. 77(2): p. 658-666.
33. Chou, C.F., Changrani, R., Roberts, P., Sadler, D., Burdon, J., Zenhausern, F., Lin, S., Mulholland, A., Swami, N., Terbrueggen, R., A miniaturized cyclic PCR device - Modeling and experiments. Microelectronic Engineering, 2002. 61-62: p. 921-925.
34. Kim, J.A., Lee, Ji Youn, seong, Shimyoung, Cha, Seung Hwan, Lee, Seung Hwan, Kim, Jae Jeong , Park, Tai Hyun, Fabrication and characterization of a PDMS–glass hybrid continuous-flow PCR chip. Biochemical Engineering Journal, 2006. 29(1–2): p. 91-97.
35. Sun, Y., Y.C. Kwok, and N.T. Nguyen, A circular ferrofluid driven microchip for rapid polymerase chain reaction. Lab on a Chip - Miniaturisation for Chemistry and Biology, 2007. 7(8): p. 1012-1017.
36. Wang, W., Li, Z. X., Luo, R., Lü, S. H., Xu, A. D., Yang, Y. J., Droplet-based micro oscillating-flow PCR chip. JOURNAL OF MICROMECHANICS AND MICROENGINEERING, 2005. 15(8): p. 1369-1377.
37. Markey, A.L., S. Mohr, and P.J.R. Day, High-throughput droplet PCR. Methods, 2010. 50(4): p. 277-281.
38. H. John Crabtree, J.L., Yuen C. Morrissey, Brian J. Taylor, Tina Liang, Robert W. Johnstone, Alexander J. Stickel, Dammika P. Manage, Alexey Atrazhev, Christopher J. Backhouse, Linda M. Pilarski, Inhibition of on-chip PCR using PDMS–glass hybrid microfluidic chips. Microfluid Nanofluid, 2012.
39. Hettiarachchi, K., H. Kim, and G.W. Faris, Optical manipulation and control of real-time PCR in cell encapsulating microdroplets by IR laser. Microfluidics and Nanofluidics, 2012: p. 1-9.
40. Song, H., Bringer, M. R., Tice, J. D., Gerdts, C. J., Ismagilov, R. F., Experimental test of scaling of mixing by chaotic advection in droplets moving through microfluidic channels. Applied Physics Letters, 2003. 83(22): p. 4664-4666.
41. Neuzil, P., J. Pipper, and T.M. Hsieh, Disposable real-time microPCR device: lab-on-a-chip at a low cost. Molecular BioSystems, 2006. 2(6-7): p. 292-298.
42. Jin Fang, Y.H., Christopher M. Lew, Yushan Yan, Laurent Pilon, Temperature dependent thermal conductivity of pure silica MEL and MFI zeolite thin films. JOURNAL OF APPLIED PHYSICS, 2012. 111.
43. Kodzius, R., Xiao, K., Wu, J., Yi, X. , Gong, X., Foulds, I. G., Wen, W., Inhibitory effect of common microfluidic materials on PCR outcome. Sens Actuators B Chem, 2012. 161(1): p. 10-10.
44. Seung-Ryong, J., Jaewan, Kim, Choi, Y. J. , Kang, C. J., Yong-Sang, Kim. ITO-coated glass/polydimethylsiloxane continuous-flow PCR chip. in Nano/Micro Engineered and Molecular Systems, 2007. NEMS '07. 2nd IEEE International Conference on. 2007.

44 L.M.J. Nijsten BSc Report University of Twente Mesoscale Chemical Systems January 2013
45. Han-Sheng Chuang, S.W., Design, fabrication and characterization of a conducting PDMS for microheaters and temperature sensors. JOURNAL OF MICROMECHANICS AND MICROENGINEERING, 2009.
46. Maturos, T., Pogfay, T. , Mongpraneet, S., Wisitsoraat, A. , Lomas, T., Tuantranont, A. . Temperature cycle and surface treatment study of thermoelectric based micro PCR. 2010.
47. Yao, L., Liu, Baoan , Chen, Tao, Liu, Shibing , Zuo, Tiechuan, Micro Flow-through PCR in a PMMA Chip Fabricated by KrF Excimer Laser. Biomedical Microdevices, 2005. 7(3): p. 253-257.
48. Hashimoto, M., Hupert, Mateusz L., Murphy, Michael C. , Soper, Steven A., Cheng, Yu-Wei, Barany, Francis, Ligase Detection Reaction/Hybridization Assays Using Three-Dimensional Microfluidic Networks for the Detection of Low-Abundant DNA Point Mutations. Analytical Chemistry, 2005. 77(10): p. 3243-3255.
49. Cheng, J.-Y., Hsieh, Chien-Ju, Chuang, Yung-Chuan, Hsieh, Jing-Ru, Performing microchannel temperature cycling reactions using reciprocating reagent shuttling along a radial temperature gradient. Analyst, 2005. 130(6): p. 931-940.
50. Hashimoto, M., Chen, P. C., Mitchell, M. W., Nikitopoulos, D. E., Soper, S. A., Murphy, M. C., Rapid PCR in a continuous flow device. Lab on a Chip, 2004. 4(6): p. 638-645.
51. Wabuyele, M.B., Ford, Sean M., Stryjewski, Wieslaw, Barrow, James, Soper, Steven A., Single molecule detection of double-stranded DNA in poly(methylmethacrylate) and polycarbonate microfluidic devices. Electrophoresis, 2001. 22(18): p. 3939-3948.
52. Xu, Y., Vaidya, Bikas, Patel, Ami B., Ford, Sean M., McCarley, Robin L., Soper, Steven A., Solid-Phase Reversible Immobilization in Microfluidic Chips for the Purification of Dye-Labeled DNA Sequencing Fragments. Analytical Chemistry, 2003. 75(13): p. 2975-2984.
53. Giordano, B.C., Ferrance, J., Swedberg, S., Hühmer, A. F. R., Landers, J. P., Polymerase Chain Reaction in Polymeric Microchips: DNA Amplification in Less Than 240 Seconds. Analytical Biochemistry, 2001. 291(1): p. 124-132.
54. Rosanne M. Guijt, A.D., Gijs W. K. van Dedem, Nico F. de Rooij and Elisabeth Verpoorte, Chemical and physical processes for integrated temperature control in microfluidic devices. Lab on a Chip, 2003: p. 1-4.
55. Lee, J.N., C. Park, and G.M. Whitesides, Solvent Compatibility of Poly(dimethylsiloxane)-Based Microfluidic Devices. Analytical Chemistry, 2003. 75(23): p. 6544-6554.
56. Godfrey, S. An introduction to thermoelectric coolers. 1996 08-10-2012]; Available from: http://www.electronics-cooling.com/1996/09/an-introduction-to-thermoelectric-coolers/.
57. Khandurina, J., McKnight, Timothy E., Jacobson, Stephen C., Waters, Larry C., Foote, Robert S., Ramsey, J. Michael, Integrated System for Rapid PCR-Based DNA Analysis in Microfluidic Devices. Analytical Chemistry, 2000. 72(13): p. 2995-3000.
58. Dr. Hanno Hermann, D.C. Knippschild, and A. Berka, Ultrafast DNA amplification with a rapid PCR system. BTi, 2004.

45 L.M.J. Nijsten BSc Report University of Twente Mesoscale Chemical Systems January 2013
59. Müller, E., S. Walczak, and W. Seifert, Optimization strategies for segmented Peltier coolers. physica status solidi (a), 2006. 203(8): p. 2128-2141.
60. Estes, M.D., Yang, Jianing, Duane, Brett, Smith, Stan, Brooks, Carla, Nordquist, Alan, Zenhausern, Frederic, Optimization of multiplexed PCR on an integrated microfluidic forensic platform for rapid DNA analysis. Analyst, 2012.
61. Xiang, Q., Xu, B., Fu, R., Li, D., Real time PCR on disposable PDMS chip with a miniaturized thermal cycler. Biomedical Microdevices, 2005. 7(4): p. 273-279.
62. Michael G. Roper, C.J.E., and James P. Landers, Advances in Polymerase Chain Reaction on Microfluidic Chips. Analytical Chemistry, 2005. 77: p. 3887-3894.
63. Hanyoup Kim, S.D., Christopher J. Green, and Gregory W. Faris, Nanodroplet real-time PCR system with laser assisted heating. OPTICS EXPRESS, 2008: p. 218-227.
64. Hühmer, A.F.R. and J.P. Landers, Noncontact Infrared-Mediated Thermocycling for Effective Polymerase Chain Reaction Amplification of DNA in Nanoliter Volumes. Analytical Chemistry, 2000. 72(21): p. 5507-5512.
65. Slyadnev, M.N., Tanaka, Yuki, Tokeshi, Manabu, Kitamori, Takehiko, Photothermal Temperature Control of a Chemical Reaction on a Microchip Using an Infrared Diode Laser. Analytical Chemistry, 2001. 73(16): p. 4037-4044.
66. Tanaka, Y., Slyadnev, Maxim N., Hibara, Akihide, Tokeshi, Manabu, Kitamori, Takehiko, Non-contact photothermal control of enzyme reactions on a microchip by using a compact diode laser. Journal of Chromatography A, 2000. 894(1–2): p. 45-51.
67. Pal, D. and V. Venkataraman, A portable battery-operated chip thermocycler based on induction heating. Sensors and Actuators A: Physical, 2002. 102(1–2): p. 151-156.
68. Fermér, C., P. Nilsson, and M. Larhed, Microwave-assisted high-speed PCR. European Journal of Pharmaceutical Sciences, 2003. 18(2): p. 129-132.
69. Erickson, D., D. Sinton, and D. Li, Joule heating and heat transfer in poly(dimethylsiloxane) microfluidic systems. Lab on a Chip, 2003. 3(3): p. 141-149.
70. Bettin, S.L.P.H. Densities. Kaye and Laby Tables of Physical and Chemical Constants 36-01-2013].
71. Incropera, F.P. and D.P. De Witt, Fundamentals of heat transfer1981, New York: Wiley
72. Erickson, D. and D. Li, Numerical simulations of a low power microchannel thermal cycling reactor. International Journal of Heat and Mass Transfer, 2002. 45(18): p. 3759-3770.
73. Chen, P.-C., Fan, Wei, Hoo, Tun-Kai, Chan, Leon Cong Zhi, Wang, Zhiping, Simulation guided-design of a microfluidic thermal reactor for polymerase chain reaction. Chemical Engineering Research and Design, 2012. 90(5): p. 591-599.
74. Gui, L. and C.L. Ren, Analytical and numerical study of joule heating effects on electrokinetically pumped continuous flow PCR chips. Langmuir, 2008. 24(6): p. 2938-2946.

46 L.M.J. Nijsten BSc Report University of Twente Mesoscale Chemical Systems January 2013
75. Akker, H.E.A.v.d. and R.F. Mudde, Fysische Transportverschijnselen 11998, Delft: Delft University Press.
76. Blom, J., Temperature control in a microdevice, lab-on-a-chip for forensics, 2012, Saxion University of Applied Sciences: Enschede.
77. Etemad, S.G. and S. Sanati, The effect of geometric configuration on hydrodynamic characteristics through wavy cross-sectional channels. Scientia Iranica, 2002. 9(1): p. 105-108.

47 L.M.J. Nijsten BSc Report University of Twente Mesoscale Chemical Systems January 2013
Appendices
I. Analytical Calculations
Deriving Taverage
( )
i.
( )
ii.
∫
∫
( )
iii.
(
)
iv.
v.
Insulation assumption
To verify if the assumption of an insulated channel is justified, the heat transfer through the PDMS is
now included. It adds a thermal resistance and a temperature difference to equation 5 on page 23:
(
( )
(
)( )
)
vi.
with L being the height and kPDMS the thermal conductivity of the PDMS layer.
Solving this for Taverage (x) results in
(
(
) (
))
vii.
Using the values for the PDMS as can be found in Table 5, there is no significant difference compared
to the insulation assumption, as can be seen in Figure 25.

48 L.M.J. Nijsten BSc Report University of Twente Mesoscale Chemical Systems January 2013
Figure 25 Analytical calculation of Taverage along the channel. With ‘analytical’being the result of the insulation assumption and ‘analytical 2’ the result of adding the PDMS layer for a 100 x 100 µm channel.
II. Simulations
Validation of:
Steady state conduction
As mentioned in section 3.2.1, the temperatures in a composite wall for steady state conduction can
be calculated using an equivalent thermal circuit. The analytical calculations exactly match
(difference smaller than 1·10-5 °C ) the simulation results from the FEA software, as can been seen in
Figure 26. Thus the steady state conduction of the simulation can be assumed to be correct.

49 L.M.J. Nijsten BSc Report University of Twente Mesoscale Chemical Systems January 2013
Figure 26 verification steady state conduction trough a composite wall. The coloured dot represent the analytically calculated temperatures on the boundaries of the different layers
Convective heating/cooling
For the convection part of the simulation, the analytical result of section 3.2.2 can be used. The
results of the simulation are shown in Figure 27. There is a slight difference between the analytical
and the simulated values. With the values of the simulation it takes 1.55 mm instead of 1.2 mm to
reach 99.999% of Tw in a 100 x 100 µm channel.
Figure 27 Analytical calculation of temperature along a 100 x 100 µm channel

50 L.M.J. Nijsten BSc Report University of Twente Mesoscale Chemical Systems January 2013
Pressure drop
The pressure drop is calculated with the Fanning friction factor and the derived Fanning pressure
drop equation (equation 2) [75]
⟨ ⟩ viii.
with p the pressure in Pa, f the Fanning friction factor, L the length of the channel in m, Dh the
hydraulic diameter of the channel in m, ρ the density in kg/m3 and <v> the mean velocity of the liquid
in m/s.
The hydraulic diameter is defined [71, 75] as
ix.
with A the cross sectional area of flow and S the wetted perimeter of the channel. For cylindrical
channels Dh is equal to the diameter.
For laminar flow in a cylindrical channel f=16/Re in [75], with Re the Reynolds number
⟨ ⟩
x.
with µ the dynamic viscosity in kg/(m·s).
Combining equation viii, ix and x with the ‘f’ for laminar flow results in
⟨ ⟩
xi.
For a cylindrical channel with a diameter of 100 µm and a length of 1 cm with a flow of liquid with a
viscosity of 1 mPa s and mean velocity of 5 mm/s the pressure drop is 160 Pa. This is within 1% of the
pressure drop calculated with the FEA software.
Symmetry
The symmetry boundary for the flow is used in the simulation in the middle of the channel. This
reduces the number of degrees of freedom and thus the computation time.
The symmetry boundary for the flow in the channel does not affect the outcome of the pressure
drop calculation as given above. This was checked using a square channel with width and height 100
µm and a length of 1 cm and the same channel cut in half with added symmetry boundary as can be
seen in Figure 28 Pressure drop symmetry geometries Figure 28 . For square channels f≈14,2/Re [77]
resulting in a pressure drop of 142 Pa which is in agreement with the simulations.

51 L.M.J. Nijsten BSc Report University of Twente Mesoscale Chemical Systems January 2013
Figure 28 Pressure drop symmetry geometries

52 L.M.J. Nijsten BSc Report University of Twente Mesoscale Chemical Systems January 2013
III. Assignment
Assignment Lab-on-a-chip for forensics
Assignment E: Fast temperature cycling for PCR-based DNS amplification - Physics / Physical
Chemistry
Introduction:
The number and variety of forensic traces found at a crime scene is enormous. The term forensic
science is therefore very broad and can be divided in several expertise areas, such as DNA profiling,
blood spatter analysis, explosives and illicit drugs. It is a clear desire of forensic investigators that
analyses should be simple, fast, robust, cheap and have high sensitivity and selectivity. Devices with
these specifications can be used directly at the crime scene and are especially useful as they can
provide immediate information to the police investigators. Most ideal would be a mobile forensic lab
for collecting, screening and analysis of the evidence. So-called 'lab-on-a-chip' (LOC) systems can
speed up the analysis, are compact, can easily be integrated, limit the risk of contamination and can
be used by people who are not technically trained.
However, micro-devices for forensic investigation hardly exist [1]. Experts in LOC technology and/or
nanotechnology do not have experience and knowledge about forensic science. On the other hand,
forensic experts are in general not familiar with LOC devices. The two disciplines have not yet been
combined often in order to obtain an LOC device for forensic research. Combining both disciplines is
a goal of this assignment.
Theory:
Several advantages of lab-on-a-chip devices are the fast analysis time, high throughput, minimal
amount of analyte material needed, less waste and compactness [2]. Exactly these benefits are the
desires of forensic scientists. Other advantages of LOC are limitation of (cross-)
contamination, improved chain of custody and possibility of direct analysis at the crime scene, which
are the most important issues within forensic science. Obtaining an on-chip DNA-profile is complex
as DNA extraction, PCR amplification and STR fragment separation have to be integrated on chip, as
can be seen in the figure below [3,4]. Moreover, the 12-72 hour analysis of conventional techniques
has to be beaten [4,5]. Fast results are required as a suspect can be held in custody for only 6 hours
[5]. For the analysis of human biological samples micro-devices are developed for extraction,
purification, amplification, separation and detection.
Trace sampling
Sample work-up
Amplification reaction
Detection Secure storage

53 L.M.J. Nijsten BSc Report University of Twente Mesoscale Chemical Systems January 2013
Assignment E: Fast temperature cycling for PCR-based DNS amplification - Physics / Physical
Chemistry
One of the aspects of DNA-analysis is PCR (Polymerase Chain Reaction). In this reaction, DNA is
replicated by an enzyme, polymerase. The process consists of 3 main steps, denaturation, extension,
and annealing (see Figure below), which are carried out at different temperatures in a cyclic process.
Typically 30 or more cycles are needed to obtain enough DNA for further analysis.
PCR reaction scheme. Denaturation occurs at ca. 95oC, extension at ca. 70oC, and annealing at ca.
60oC. From [6].
For the forensic application, it is required to have an as fast as possible amplification of DNA, which
means that the cycle time has to be made as short as possible. From literature it has become clear
that the intrinsic kinetics of the chemical reactions and phase transformations involved in PCR are in
the millisecond range, or faster. This implies that the rate limiting steps in the cyclic process most
likely are mass and heat transport. Mass transport has to occur in the PCR solution in order to bring
reactants together for the reaction, and by using microfluidics, this mass transport becomes fast,
because of the shorter distances for diffusion. Furthermore, since the PCR reaction was chosen to be
performed in micro-droplets in a microfluidic channel, in which internal flows are present which
enhance diffusion, mass transport is not the limiting factor.
What is left is the heat transport: to cycle the temperature, heat has to be transported to and from
the microfluidic droplets. Especially the cooling step is considered to be critical, because the heating
step can typically be made faster by putting in more heating power (however, care has to be taken
that no overshoot in temperature will occur, since this may decompose the DNA), while the cooling
step normally will be performed by heat diffusion to a cold reservoir.
The aim of this assignment is to:
a. Estimate the theoretical limit for the thermal cycling time in PCR
b. Design a number of chips which apply an optimized thermal cycling concept
c. Experimentally test these chips (if time allows)

54 L.M.J. Nijsten BSc Report University of Twente Mesoscale Chemical Systems January 2013
A literature study has to be carried out prior to design chips for forensic DNA-analysis.
Literature study
o Thermal cycling for PCR in a microfluidic format: Make an inventory of the existing
microfluidics/lab-on-a-chip technology for thermal cycling of reactants, with a focus
on PCR. Which chip designs and heating/cooling concepts have been used, which
materials (e.g. glass, PDMS, plastics or silicon) are suitable?
o Estimations/calculations: Based on literature, evaluate the critical phenomena
involved in fast thermal cycling of PCR, and estimate/calculate the theoretical limits.
Experimental setup and experiments on chip
o Chip design: Based on the calculations and the literature study, propose a number of
chip designs with optimized temperature cycling capabilities. Also, in close
collaboration with group members, design a fabrication process for these chips and
draw the photolithographic masks, and build a set-up for testing the chips.
o Experimental testing of chips: If time allows, perform functional tests of the chips,
using a fluorescent dye (which has a temperature-dependent fluorescence intensity)
to monitor the temperature inside the microchannels, preferably also with a droplet
which is present in a microchannel. This requires working with a microscope and a
camera and with the software to evaluate the images.
Finishing of the report and preparations for the final presentation
References [1] B.B. Bruijns. Forensic applications of nanotechnology, Literature survey on the use of nanotechnology and
lab-on-a-chip devices for forensic investigations. October 2010.
[2] P.J. Obeid and T.K. Christopoulos. Continuous-flow DNA and RNA amplification chip combined with laser-
induced fluorescence detection. Analytica Chimica Acta, 2003.
[3] P. Liu, S.H.I. Yeung, K.A. Crenshaw, C.A. Crouse, J.R.Scherer, and R.A. Mathies. Real-time forensic DNA
analysis at a crime scene using a portable microchip analyzer. Forensic Science International: Genetics, 2008.
[4] K.M. Horsman, J.M. Bienvenue, K.R. Blasier, and J.P. Landers. Forensic DNA analysis on microfluidic devices:
A review. Journal of Forensic Sciences, 2007.
[5] A.J. Hopwood, C. Hurth, J. Yang, Z. Cai, N. Moran, J.G.Lee-Edghill, A. Nordquist, R. Lenigk, M.D. Estes, J.P.
Haley, et al. Integrated microfluidic system for rapid forensic DNA analysis: Sample collection to DNA profile.
Analytical Chemistry, 2010.
[6] Y. Fuchiwaki et al., Ultra-rapid flow-through polymerase chain reaction microfluidics using vapor pressure,
Biosensors and Bioelectronics, 2011, vol. 27, pp. 88-94.