Fast Forward: Queens Bus Network Redesign
10
Fast Forward: Queens Bus Network Redesign April 15, 2019
Transcript of Fast Forward: Queens Bus Network Redesign

Page 1
Fast Forward:Queens Bus Network Redesign
April 15, 2019
Page 2Page 2
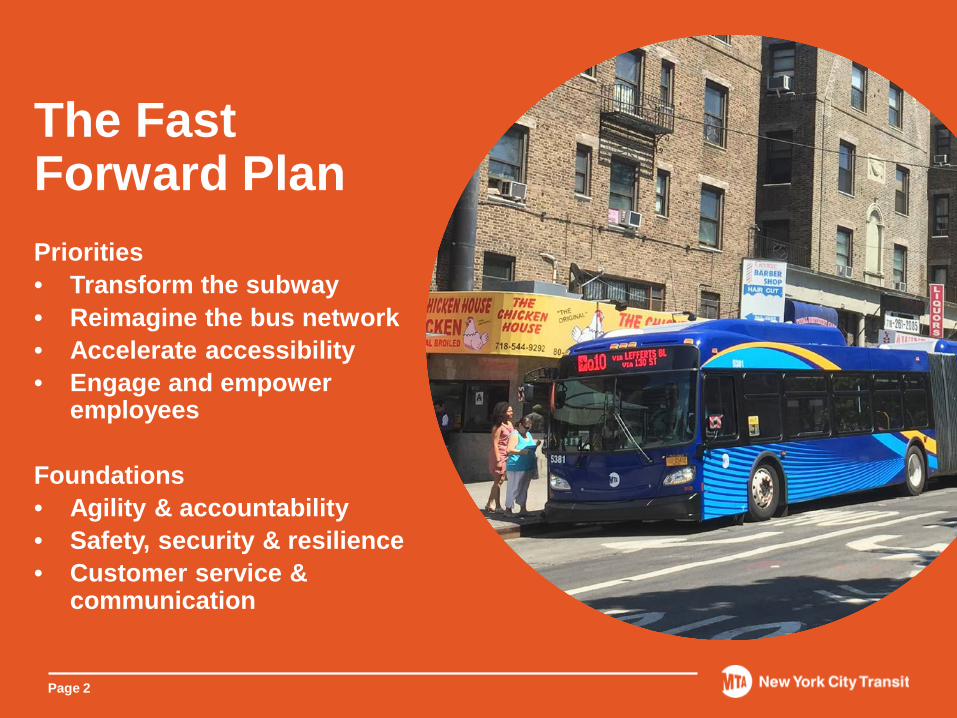
The Fast Forward PlanPriorities• Transform the subway• Reimagine the bus network• Accelerate accessibility• Engage and empower
employees
Foundations• Agility & accountability• Safety, security & resilience• Customer service &
communication
Page 3Page 3
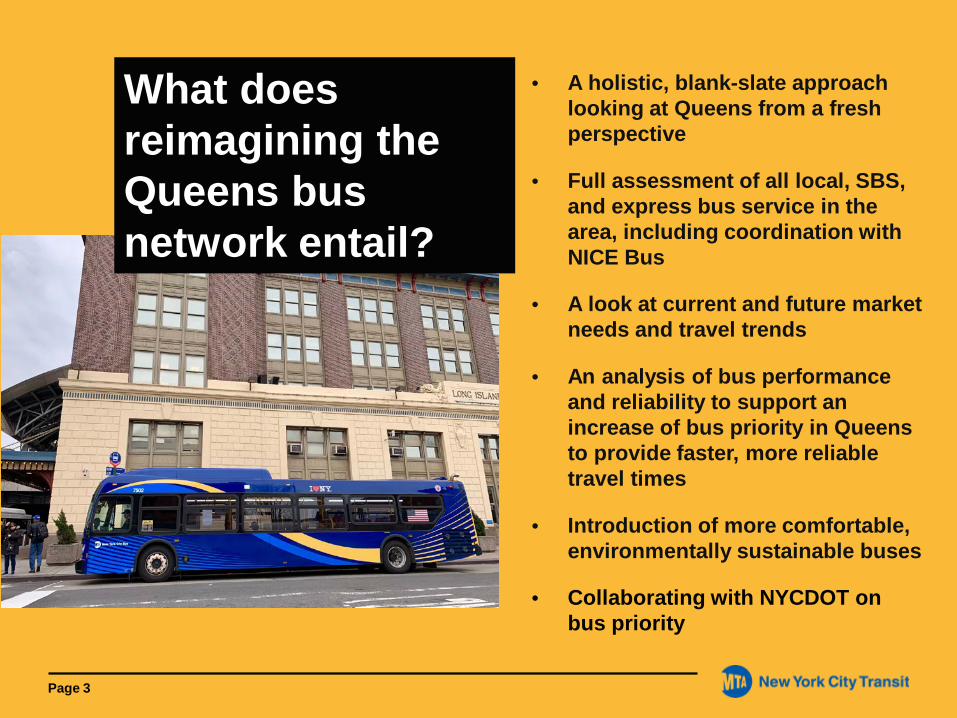
• A holistic, blank-slate approach looking at Queens from a fresh perspective
• Full assessment of all local, SBS, and express bus service in the area, including coordination with NICE Bus
• A look at current and future market needs and travel trends
• An analysis of bus performance and reliability to support an increase of bus priority in Queens to provide faster, more reliable travel times
• Introduction of more comfortable, environmentally sustainable buses
• Collaborating with NYCDOT on bus priority
What does reimagining the Queens bus network entail?

Page 4
• The Queens bus network has not substantially changed in decades; many follow old trolley routes
• As our customers’ needs change, we must change with them
• Queens continues to see major changes in all sectors – residential, commercial, institutional, with Jamaica, Flushing, and Long Island City booming
• Bus ridership in Queens and across New York City has been decreasing
• Bus speeds have slowed as congestion has worsened
• Job growth in Queens is accelerating, many at venues located farther away from the subway (i.e. universities, hospitals, and airports)
Why are we reimagining the Queens bus network?

Page 5Page 5
Snapshot of the Queens bus network
• 77 local bus routes with ~700,000 average weekday customers
• 30 express bus routes with ~14,000 average weekday customers
• Queens local bus ridership has declined 2.5% between 2016 and 2017
• Queens express bus ridership is down 1% between 2016 and 2017
• Bus speeds continue to decline – 3% slower since 2015 at 8.9 mph

Page 6Page 6
How do we get there?
• All recommendations will focus on improving the customer experience, with attention given to:
• Expanding bus priority improvements in collaboration with NYCDOT
• Providing high frequency, high capacity bus service on major corridors
• Improving bus stop spacing to speed up customers’ commute times
• Modifying bus routes that are low-performing and circuitous
• Reducing route redundancy and subway competition
• Improving off-peak service frequency and coverage

Page 7Page 7
Public Workshops:
• 6 were held at various locations in September and October 2018
In-person intercept surveys:
• Canvassed 12 key locations
• Nearly 2,000 completed surveys
Online survey:
• Open September – December 2018
• Nearly 750 completed surveys
Open Houses:
• Upcoming opportunity to provide feedback on draft plan and final plan
Community Board meetings
Public Outreach –Bronx Bus Redesign

Page 8Page 8
Primary sources of information Quantitative
• MetroCard data provides information on which routes customers are boarding by time of day
• GPS data feeds through BusTime provide information on bus performance which help identify where customers are boarding
• Other External Data includes NYCDOT travel data, NYCDCP demographic and development information, FHV data
Qualitative
• Observation supports qualitative data and also validates automatically collected data
• Survey Research provides insight on questions that cannot be answered by existing data sources or are qualitative in nature
• Public Feedback: Workshops, written feedback, web-based comments, and informal outreach at bus stops, on buses, at key transfer points, etc.
Page 9
Page 10
Thank younew.mta.info/queensbusredesign#queensbusredesign#fastforwardNYC