Fast Facts & Figures...Fast Facts & Figures About Social Security, 2013 Social Security...
43
Fast Facts & Figures About Social Security, 2013 Social Security Administration Office of Retirement and Disability Policy Office of Research, Evaluation, and Statistics 500 E Street, SW, 8th Floor Washington, DC 20254 SSA Publication No. 13-11785 Released: August 2013
Transcript of Fast Facts & Figures...Fast Facts & Figures About Social Security, 2013 Social Security...
Fast Facts & Figures About Social Security, 2013
Social Security AdministrationOffice of Retirement and Disability PolicyOffice of Research, Evaluation, and Statistics500 E Street, SW, 8th FloorWashington, DC 20254
SSA Publication No. 13-11785Released: August 2013
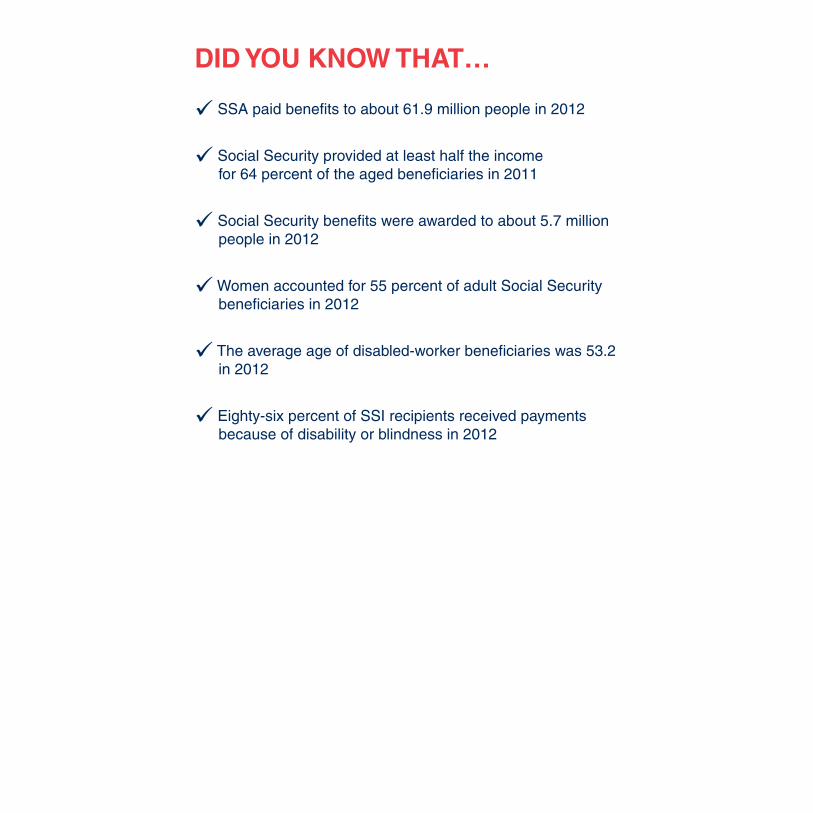
DID YOU KNOW THAT…
ü SSA paid benefits to about 61.9 million people in 2012
ü Social Security provided at least half the income for 64 percent of the aged beneficiaries in 2011
ü Social Security benefits were awarded to about 5.7 million people in 2012
ü Women accounted for 55 percent of adult Social Security beneficiaries in 2012
ü The average age of disabled-worker beneficiaries was 53.2 in 2012
ü Eighty-six percent of SSI recipients received payments because of disability or blindness in 2012
Preface
Fast Facts & Figures About Social Security, 2013 ♦ iii
Fast Facts & Figures answers the most frequently asked questions about the programs SSA administers. It highlights basic program data for the Social Security (retirement, survivors, and disability) and Supplemental Security Income programs. Most of the data come from the Annual Statistical Supplement to the Social Security Bulletin, which contains more than 240 detailed tables. The information on the income of the aged is from the data series Income of the Population 55 or Older. Data on trust fund operations are from the 2013 Trustees Report.
The tables and charts illustrate the range of program beneficiaries, from the country’s oldest to its youngest citizens. In all, about 61.9 million people receive some type of benefit or assis-tance.
Shirley Turpin prepared this chartbook. Staff of the Office of Information Resources edited the chartbook and prepared the print and web versions for publication.
Your suggestions and comments on this chartbook are welcome. Any suggestions, comments, or questions about the charts should be directed to Shirley Turpin at 410-965-0090 or [email protected]. For additional copies or to be removed from our print mailing list, please e-mail [email protected]. This Chartbook, the Supplement, and Income of the Population 55 or Older are available on our website at http://www.socialsecurity.gov/policy.
Manuel de la Puente Associate Commissioner for Research, Evaluation, and Statistics
August 2013
Ab
bre
viat
ion
s
iv ♦ Fast Facts & Figures About Social Security, 2013
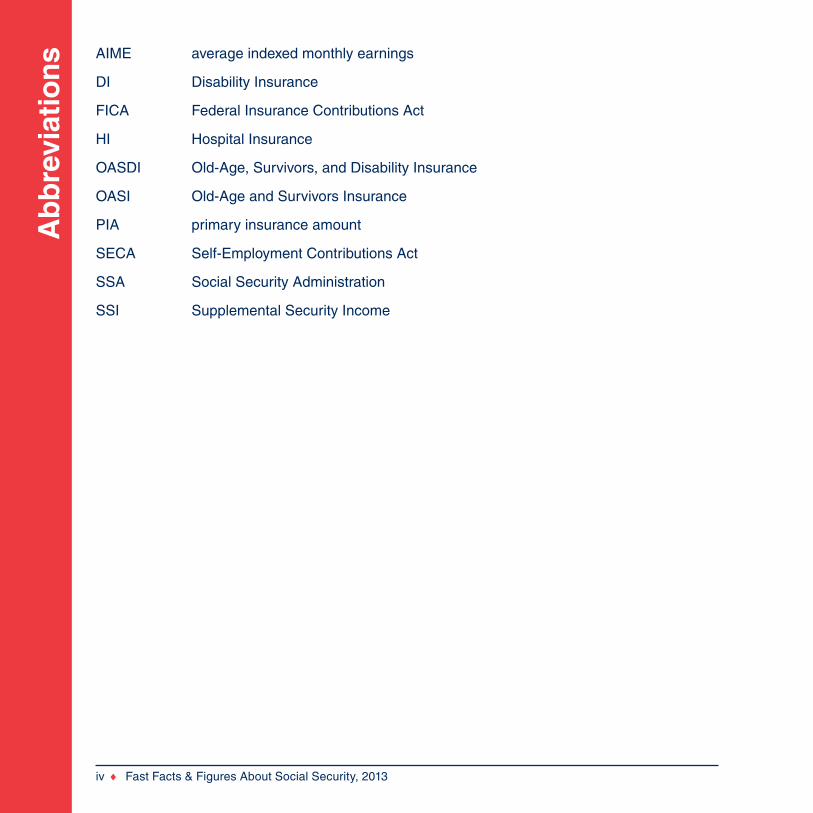
AIME average indexed monthly earnings
DI Disability Insurance
FICA Federal Insurance Contributions Act
HI Hospital Insurance
OASDI Old-Age, Survivors, and Disability Insurance
OASI Old-Age and Survivors Insurance
PIA primary insurance amount
SECA Self-Employment Contributions Act
SSA Social Security Administration
SSI Supplemental Security Income

Co
nten
ts
Fast Facts & Figures About Social Security, 2013 ♦ v
2013 General Information I I I I I I I I I I I I I I I I I I I I I I I I I I I I I I I I I I I I I I I I I I I I I I I I I I I 1
Income of the Aged Population
Size of Income I I I I I I I I I I I I I I I I I I I I I I I I I I I I I I I I I I I I I I I I I I I I I I I I I I I I I I I I I I I I I I 5
Receipt of Income I I I I I I I I I I I I I I I I I I I I I I I I I I I I I I I I I I I I I I I I I I I I I I I I I I I I I I I I I I I 6
Shares of Aggregate Income I I I I I I I I I I I I I I I I I I I I I I I I I I I I I I I I I I I I I I I I I I I I I I I I I I 7
Relative Importance of Social Security I I I I I I I I I I I I I I I I I I I I I I I I I I I I I I I I I I I I I I I I I I 8
Poverty Status Based on Family Income I I I I I I I I I I I I I I I I I I I I I I I I I I I I I I I I I I I I I I I I 9
Old-Age, Survivors, and Disability Insurance Program
Earnings in Covered Employment I I I I I I I I I I I I I I I I I I I I I I I I I I I I I I I I I I I I I I I I I I I I I 10
Insured Status I I I I I I I I I I I I I I I I I I I I I I I I I I I I I I I I I I I I I I I I I I I I I I I I I I I I I I I I I I I I I 11
Insured Status, by Sex I I I I I I I I I I I I I I I I I I I I I I I I I I I I I I I I I I I I I I I I I I I I I I I I I I I I I I 12
New Benefit Awards I I I I I I I I I I I I I I I I I I I I I I I I I I I I I I I I I I I I I I I I I I I I I I I I I I I I I I I I 13
New Awards to Workers I I I I I I I I I I I I I I I I I I I I I I I I I I I I I I I I I I I I I I I I I I I I I I I I I I I I I 14
Beneficiaries in Current-Payment Status I I I I I I I I I I I I I I I I I I I I I I I I I I I I I I I I I I I I I I I 15
Average Benefit Amounts I I I I I I I I I I I I I I I I I I I I I I I I I I I I I I I I I I I I I I I I I I I I I I I I I I I I 16
Beneficiaries, by Age I I I I I I I I I I I I I I I I I I I I I I I I I I I I I I I I I I I I I I I I I I I I I I I I I I I I I I I 17
Disabled and Retired Workers, by Age I I I I I I I I I I I I I I I I I I I I I I I I I I I I I I I I I I I I I I I I I 18
Beneficiaries, by Sex I I I I I I I I I I I I I I I I I I I I I I I I I I I I I I I I I I I I I I I I I I I I I I I I I I I I I I I I 19
Average Monthly Benefit, by Sex I I I I I I I I I I I I I I I I I I I I I I I I I I I I I I I I I I I I I I I I I I I I I I 20
Women Beneficiaries I I I I I I I I I I I I I I I I I I I I I I I I I I I I I I I I I I I I I I I I I I I I I I I I I I I I I I I I 21
Women with Dual Entitlement I I I I I I I I I I I I I I I I I I I I I I I I I I I I I I I I I I I I I I I I I I I I I I I I 22
Child Beneficiaries I I I I I I I I I I I I I I I I I I I I I I I I I I I I I I I I I I I I I I I I I I I I I I I I I I I I I I I I I 23
Co
nte
nts
vi ♦ Fast Facts & Figures About Social Security, 2013
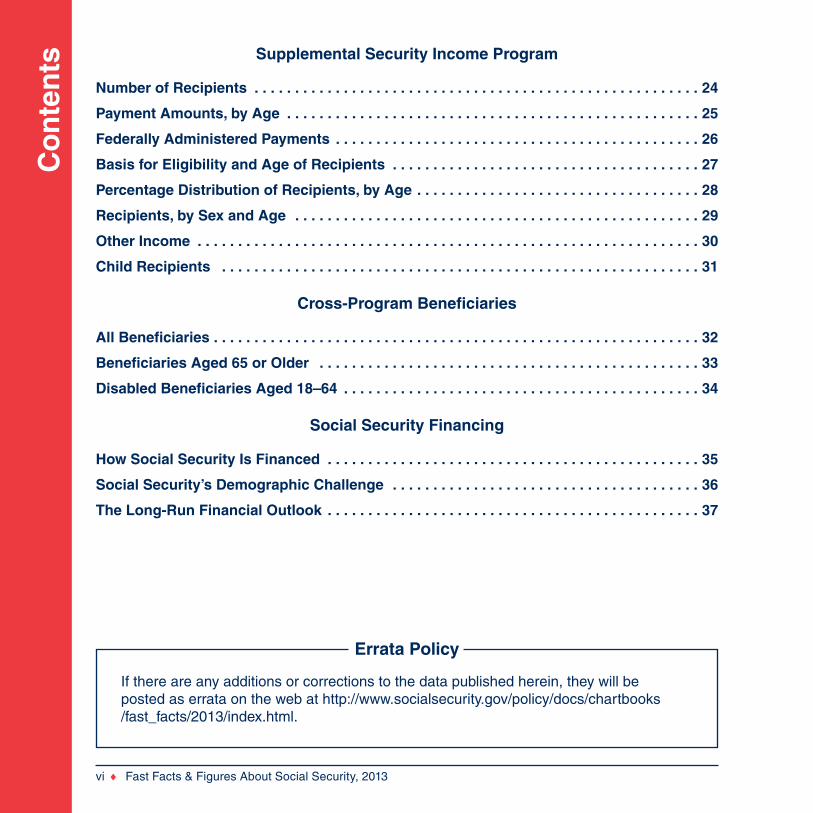
Supplemental Security Income Program
Number of Recipients I I I I I I I I I I I I I I I I I I I I I I I I I I I I I I I I I I I I I I I I I I I I I I I I I I I I I I I 24
Payment Amounts, by Age I I I I I I I I I I I I I I I I I I I I I I I I I I I I I I I I I I I I I I I I I I I I I I I I I I I 25
Federally Administered Payments I I I I I I I I I I I I I I I I I I I I I I I I I I I I I I I I I I I I I I I I I I I I I 26
Basis for Eligibility and Age of Recipients I I I I I I I I I I I I I I I I I I I I I I I I I I I I I I I I I I I I I I 27
Percentage Distribution of Recipients, by Age I I I I I I I I I I I I I I I I I I I I I I I I I I I I I I I I I I I 28
Recipients, by Sex and Age I I I I I I I I I I I I I I I I I I I I I I I I I I I I I I I I I I I I I I I I I I I I I I I I I I 29
Other Income I I I I I I I I I I I I I I I I I I I I I I I I I I I I I I I I I I I I I I I I I I I I I I I I I I I I I I I I I I I I I I 30
Child Recipients I I I I I I I I I I I I I I I I I I I I I I I I I I I I I I I I I I I I I I I I I I I I I I I I I I I I I I I I I I I 31
Cross-Program Beneficiaries
All Beneficiaries I I I I I I I I I I I I I I I I I I I I I I I I I I I I I I I I I I I I I I I I I I I I I I I I I I I I I I I I I I I I 32
Beneficiaries Aged 65 or Older I I I I I I I I I I I I I I I I I I I I I I I I I I I I I I I I I I I I I I I I I I I I I I I 33
Disabled Beneficiaries Aged 18–64 I I I I I I I I I I I I I I I I I I I I I I I I I I I I I I I I I I I I I I I I I I I I 34
Social Security Financing
How Social Security Is Financed I I I I I I I I I I I I I I I I I I I I I I I I I I I I I I I I I I I I I I I I I I I I I I 35
Social Security’s Demographic Challenge I I I I I I I I I I I I I I I I I I I I I I I I I I I I I I I I I I I I I I 36
The Long-Run Financial Outlook I I I I I I I I I I I I I I I I I I I I I I I I I I I I I I I I I I I I I I I I I I I I I I 37
Errata Policy
If there are any additions or corrections to the data published herein, they will be posted as errata on the web at http://www.socialsecurity.gov/policy/docs/chartbooks /fast_facts/2013/index.html.
2013 Gen
eral Info
rmatio
n
Fast Facts & Figures About Social Security, 2013 ♦ 1
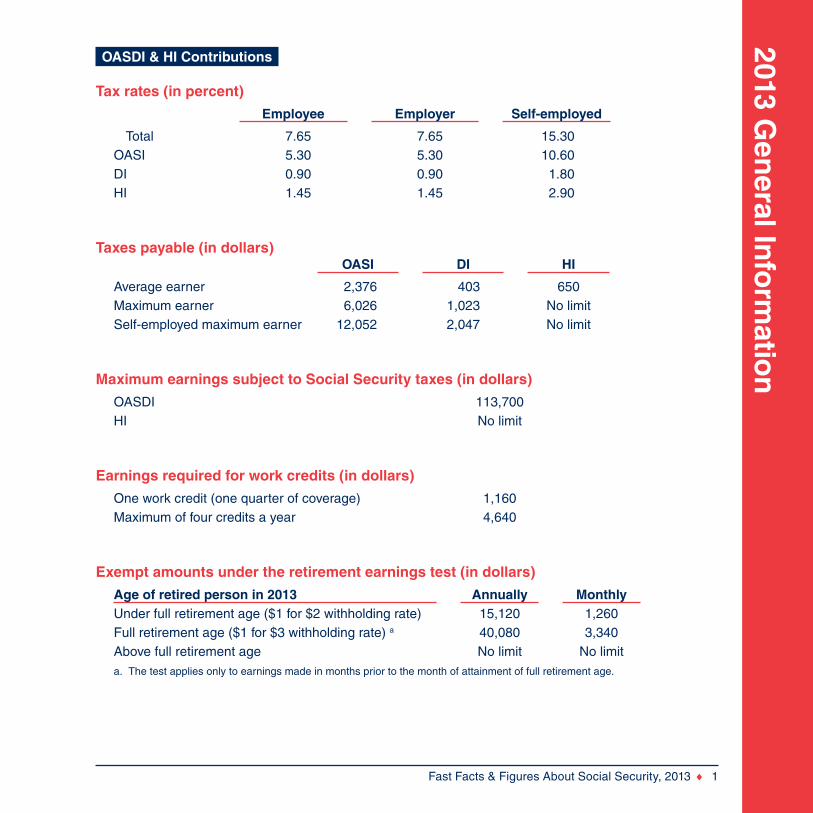
OASDI & HI Contributions
Tax rates (in percent)
Employee Employer Self-employed
Total 7.65 7.65 15.30OASI 5.30 5.30 10.60DI 0.90 0.90 1.80HI 1.45 1.45 2.90
Taxes payable (in dollars)OASI DI HI
Average earner 2,376 403 650Maximum earner 6,026 1,023 No limitSelf-employed maximum earner 12,052 2,047 No limit
Maximum earnings subject to Social Security taxes (in dollars)
OASDI 113,700HI No limit
Earnings required for work credits (in dollars)
One work credit (one quarter of coverage) 1,160Maximum of four credits a year 4,640
Exempt amounts under the retirement earnings test (in dollars)
Age of retired person in 2013 Annually MonthlyUnder full retirement age ($1 for $2 withholding rate) 15,120 1,260Full retirement age ($1 for $3 withholding rate) a 40,080 3,340Above full retirement age No limit No limita. The test applies only to earnings made in months prior to the month of attainment of full retirement age.
2013
Gen
eral
Info
rmat
ion
2 ♦ Fast Facts & Figures About Social Security, 2013
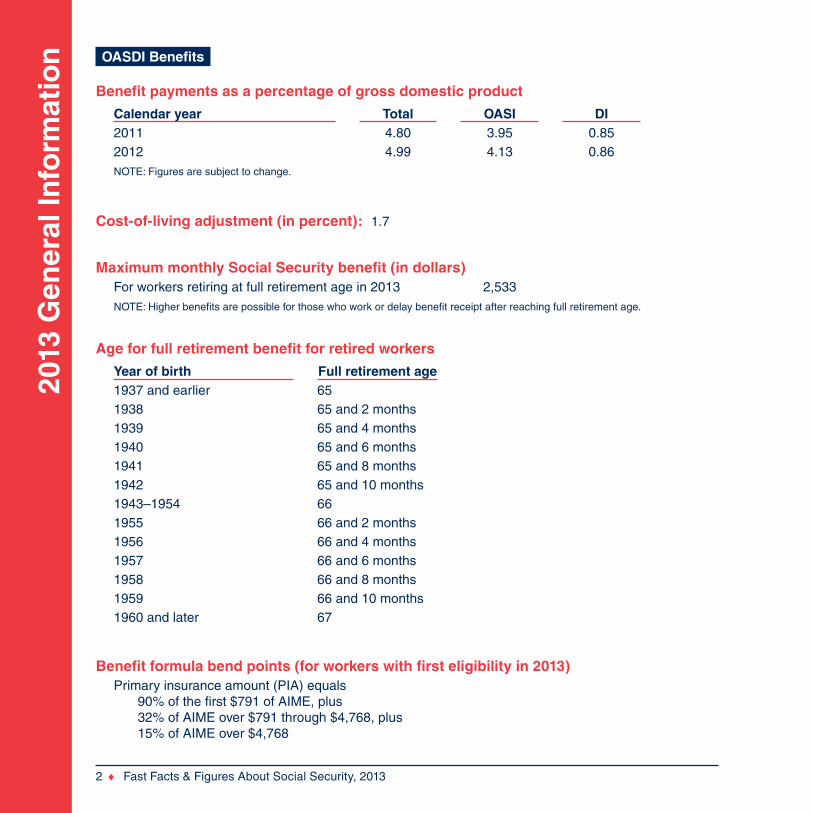
OASDI Benefits
Benefit payments as a percentage of gross domestic product
Calendar year Total OASI DI2011 4.80 3.95 0.852012 4.99 4.13 0.86NOTE: Figures are subject to change.
Cost-of-living adjustment (in percent): 1.7
Maximum monthly Social Security benefit (in dollars)For workers retiring at full retirement age in 2013 2,533NOTE: Higher benefits are possible for those who work or delay benefit receipt after reaching full retirement age.
Age for full retirement benefit for retired workers
Year of birth Full retirement age1937 and earlier 651938 65 and 2 months1939 65 and 4 months1940 65 and 6 months1941 65 and 8 months1942 65 and 10 months1943–1954 661955 66 and 2 months1956 66 and 4 months1957 66 and 6 months1958 66 and 8 months1959 66 and 10 months1960 and later 67
Benefit formula bend points (for workers with first eligibility in 2013)Primary insurance amount (PIA) equals 90% of the first $791 of AIME, plus 32% of AIME over $791 through $4,768, plus 15% of AIME over $4,768
2013 Gen
eral Info
rmatio
n
Fast Facts & Figures About Social Security, 2013 ♦ 3
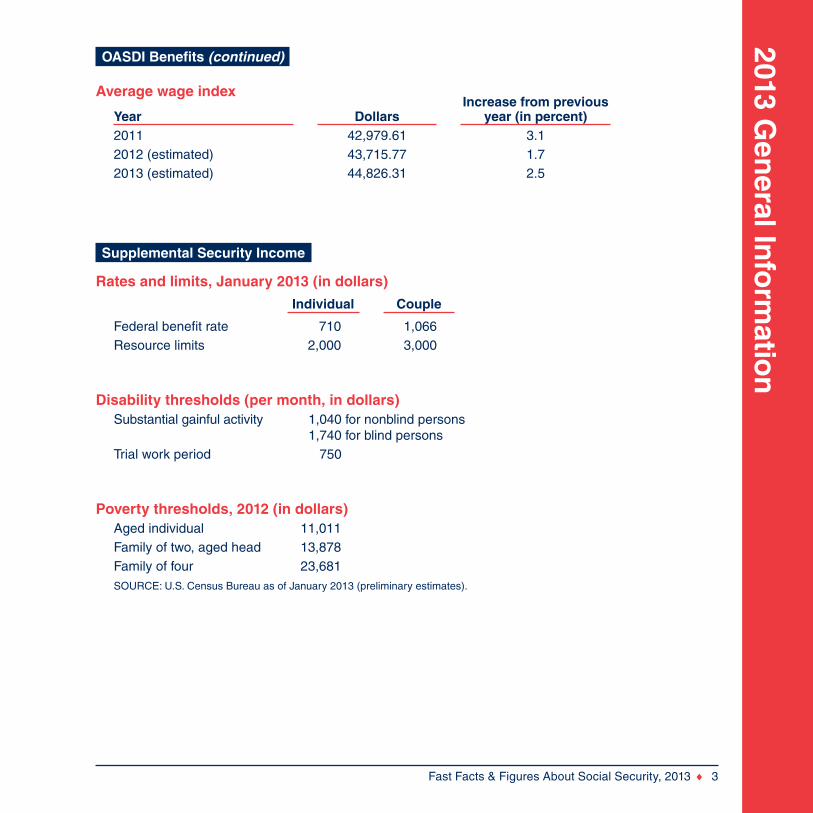
OASDI Benefits (continued)
Average wage index
Year DollarsIncrease from previous
year (in percent)2011 42,979.61 3.12012 (estimated) 43,715.77 1.72013 (estimated) 44,826.31 2.5
Supplemental Security Income
Rates and limits, January 2013 (in dollars)
Individual Couple
Federal benefit rate 710 1,066Resource limits 2,000 3,000
Disability thresholds (per month, in dollars)Substantial gainful activity 1,040 for nonblind persons
1,740 for blind personsTrial work period 750
Poverty thresholds, 2012 (in dollars)Aged individual 11,011Family of two, aged head 13,878Family of four 23,681SOURCE: U.S. Census Bureau as of January 2013 (preliminary estimates).
2013
Gen
eral
Info
rmat
ion
4 ♦ Fast Facts & Figures About Social Security, 2013
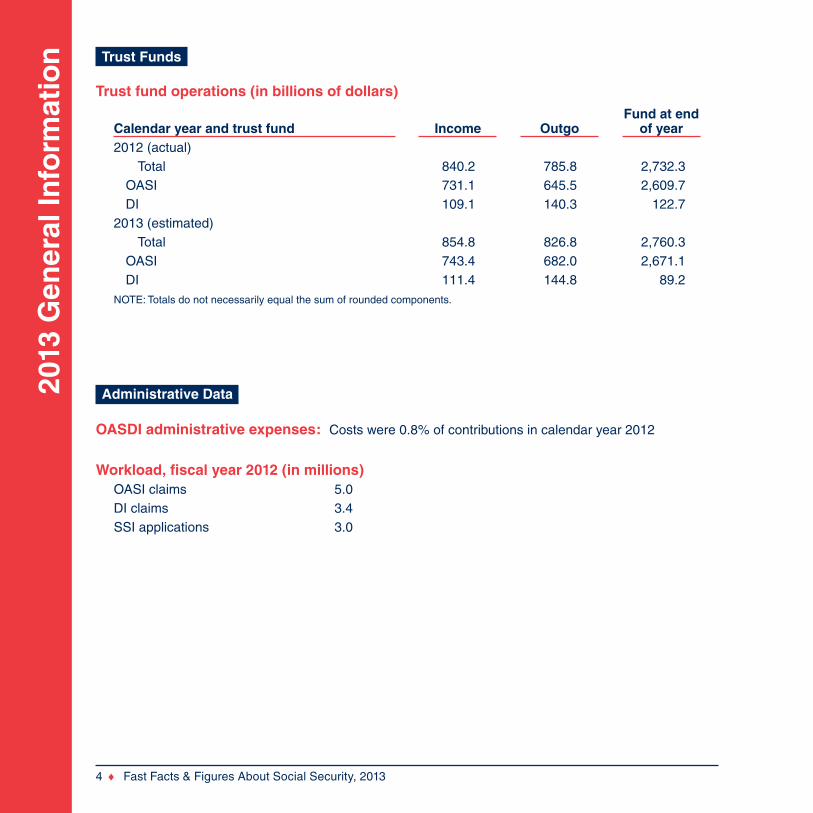
Trust Funds
Trust fund operations (in billions of dollars)
Calendar year and trust fund Income OutgoFund at end
of year2012 (actual)
Total 840.2 785.8 2,732.3OASI 731.1 645.5 2,609.7DI 109.1 140.3 122.7
2013 (estimated)Total 854.8 826.8 2,760.3
OASI 743.4 682.0 2,671.1DI 111.4 144.8 89.2
NOTE: Totals do not necessarily equal the sum of rounded components.
Administrative Data
OASDI administrative expenses: Costs were 0.8% of contributions in calendar year 2012
Workload, fiscal year 2012 (in millions)OASI claims 5.0DI claims 3.4SSI applications 3.0
Inco
me o
f the A
ged
Po
pu
lation
Fast Facts & Figures About Social Security, 2013 ♦ 5
1962 20110
10,000
20,000
30,000
40,000
50,000Dollars
21,414
8,417
47,494
18,000
Married Nonmarried
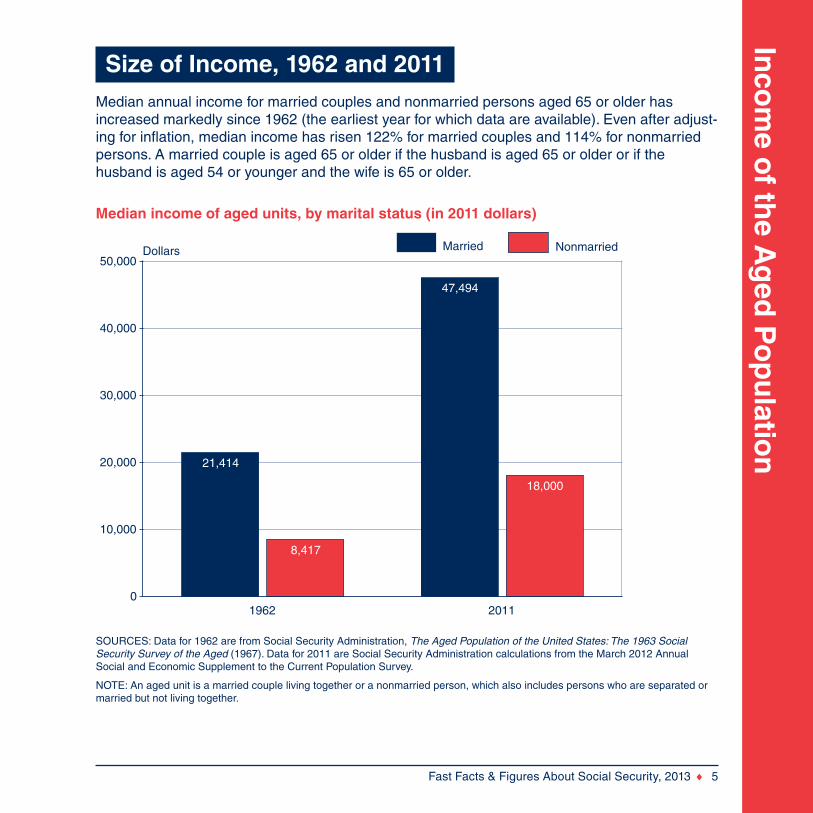
Size of Income, 1962 and 2011Median annual income for married couples and nonmarried persons aged 65 or older has increased markedly since 1962 (the earliest year for which data are available). Even after adjust-ing for inflation, median income has risen 122% for married couples and 114% for nonmarried persons. A married couple is aged 65 or older if the husband is aged 65 or older or if the husband is aged 54 or younger and the wife is 65 or older.
Median income of aged units, by marital status (in 2011 dollars)
SOURCES: Data for 1962 are from Social Security Administration, The Aged Population of the United States: The 1963 Social Security Survey of the Aged (1967). Data for 2011 are Social Security Administration calculations from the March 2012 Annual Social and Economic Supplement to the Current Population Survey.
NOTE: An aged unit is a married couple living together or a nonmarried person, which also includes persons who are separated or married but not living together.
Inco
me
of
the
Ag
ed P
op
ula
tio
n
6 ♦ Fast Facts & Figures About Social Security, 2013
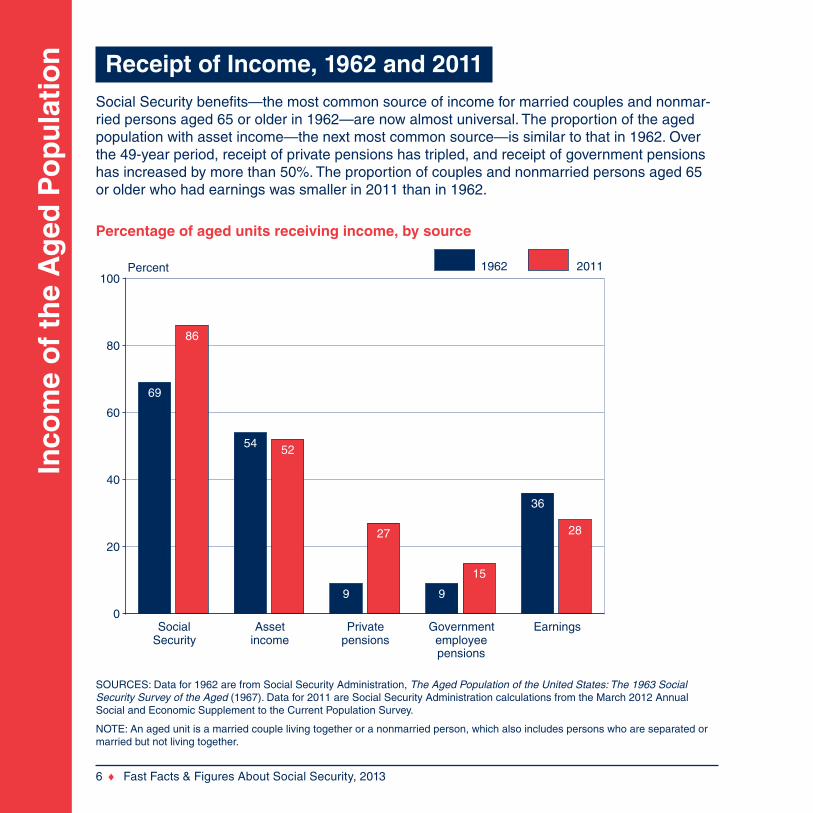
Receipt of Income, 1962 and 2011Social Security benefits—the most common source of income for married couples and nonmar-ried persons aged 65 or older in 1962—are now almost universal. The proportion of the aged population with asset income—the next most common source—is similar to that in 1962. Over the 49-year period, receipt of private pensions has tripled, and receipt of government pensions has increased by more than 50%. The proportion of couples and nonmarried persons aged 65 or older who had earnings was smaller in 2011 than in 1962.
Percentage of aged units receiving income, by source
SOURCES: Data for 1962 are from Social Security Administration, The Aged Population of the United States: The 1963 Social Security Survey of the Aged (1967). Data for 2011 are Social Security Administration calculations from the March 2012 Annual Social and Economic Supplement to the Current Population Survey.
NOTE: An aged unit is a married couple living together or a nonmarried person, which also includes persons who are separated or married but not living together.
SocialSecurity
Assetincome
Privatepensions
Governmentemployeepensions
Earnings0
20
40
60
80
100Percent
69
86
54 52
9
27
9
15
36
28
1962 2011
Inco
me o
f the A
ged
Po
pu
lation
Fast Facts & Figures About Social Security, 2013 ♦ 7
SOURCES: Data for 1962 are from Social Security Administration, The Aged Population of the United States: The 1963 Social Security Survey of the Aged (1967). Data for 2011 are Social Security Administration calculations from the March 2012 Annual Social and Economic Supplement to the Current Population Survey.
NOTES: The unit of analysis is the aged unit, defined as a married couple living together or a nonmarried person, which also includes persons who are separated or married but not living together.
Totals do not necessarily equal the sum of rounded components.
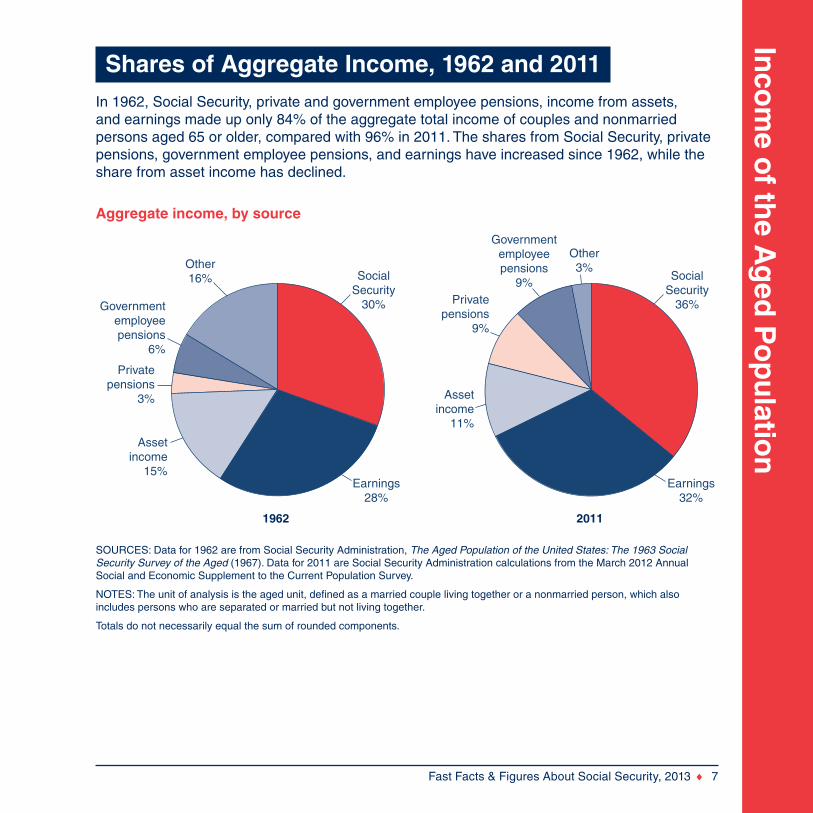
Shares of Aggregate Income, 1962 and 2011In 1962, Social Security, private and government employee pensions, income from assets, and earnings made up only 84% of the aggregate total income of couples and nonmarried persons aged 65 or older, compared with 96% in 2011. The shares from Social Security, private pensions, government employee pensions, and earnings have increased since 1962, while the share from asset income has declined.
Aggregate income, by source
Privatepensions
9%
Assetincome
11%
1962
Other16%
Governmentemployeepensions
6%
Assetincome
15%Earnings
28%
SocialSecurity
30%
Privatepensions
3%
2011
Other3%
Governmentemployeepensions
9%
Earnings32%
SocialSecurity
36%
Inco
me
of
the
Ag
ed P
op
ula
tio
n
8 ♦ Fast Facts & Figures About Social Security, 2013
SOURCE: Social Security Administration calculations from the March 2012 Annual Social and Economic Supplement to the Current Population Survey.
NOTE: An aged unit is a married couple living together or a nonmarried person, which also includes persons who are separated or married but not living together.
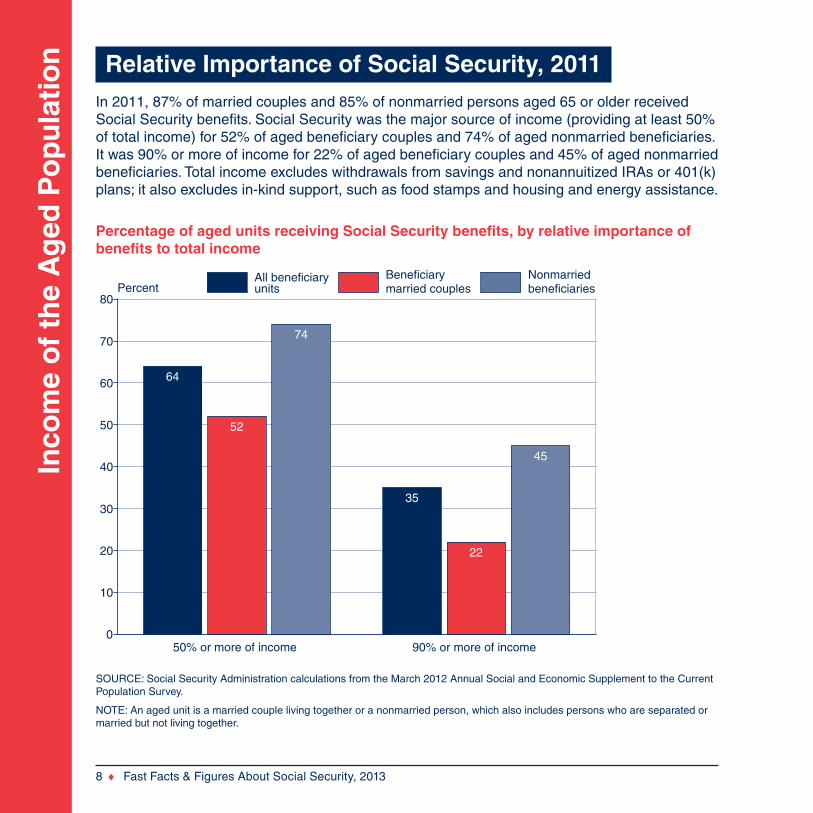
Relative Importance of Social Security, 2011In 2011, 87% of married couples and 85% of nonmarried persons aged 65 or older received Social Security benefits. Social Security was the major source of income (providing at least 50% of total income) for 52% of aged beneficiary couples and 74% of aged nonmarried beneficiaries. It was 90% or more of income for 22% of aged beneficiary couples and 45% of aged nonmarried beneficiaries. Total income excludes withdrawals from savings and nonannuitized IRAs or 401(k) plans; it also excludes in-kind support, such as food stamps and housing and energy assistance.
Percentage of aged units receiving Social Security benefits, by relative importance of benefits to total income
50% or more of income 90% or more of income0
10
20
30
40
50
60
70
80Percent
64
52
74
35
22
45
Beneficiary married couples
Nonmarried beneficiaries
All beneficiary units
Inco
me o
f the A
ged
Po
pu
lation
Fast Facts & Figures About Social Security, 2013 ♦ 9
SOURCE: Social Security Administration calculations from the March 2012 Annual Social and Economic Supplement to the Current Population Survey.
a. Current Population Survey respondents may identify themselves in more than one racial group. The “white alone” and “black alone” categories reflect respondents who reported only one race.
AllMen Women
Hispanic0
5
10
15
20
25
30Percent
8.7
5.8
3.9
2.4
11.7
8.6
16.3
11.0
7.7
5.2
17.3
11.0
18.7
9.5
Poor Near poor
White alone a
Black alone a
NonmarriedMarriedpersons
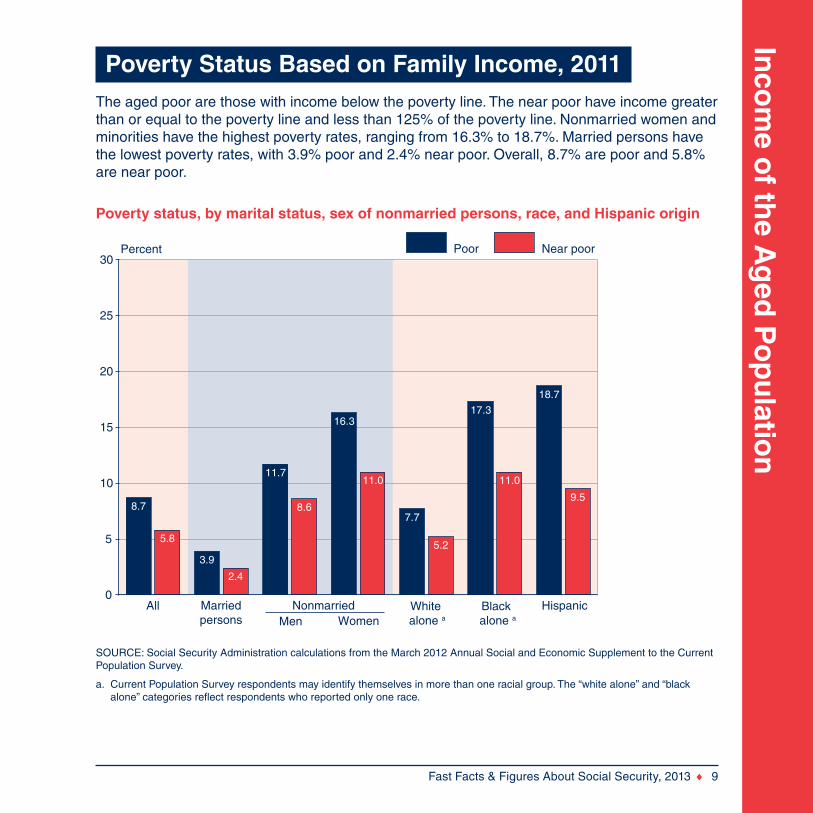
Poverty Status Based on Family Income, 2011The aged poor are those with income below the poverty line. The near poor have income greater than or equal to the poverty line and less than 125% of the poverty line. Nonmarried women and minorities have the highest poverty rates, ranging from 16.3% to 18.7%. Married persons have the lowest poverty rates, with 3.9% poor and 2.4% near poor. Overall, 8.7% are poor and 5.8% are near poor.
Poverty status, by marital status, sex of nonmarried persons, race, and Hispanic origin
OA
SD
I Pro
gra
m
10 ♦ Fast Facts & Figures About Social Security, 2013
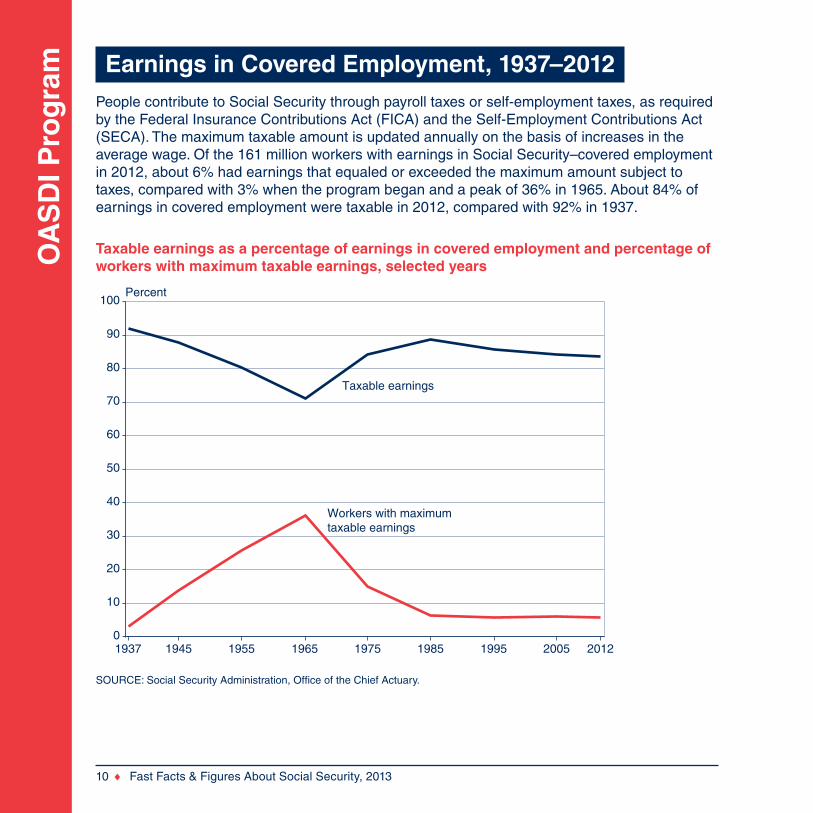
Earnings in Covered Employment, 1937–2012People contribute to Social Security through payroll taxes or self-employment taxes, as required by the Federal Insurance Contributions Act (FICA) and the Self-Employment Contributions Act (SECA). The maximum taxable amount is updated annually on the basis of increases in the average wage. Of the 161 million workers with earnings in Social Security–covered employment in 2012, about 6% had earnings that equaled or exceeded the maximum amount subject to taxes, compared with 3% when the program began and a peak of 36% in 1965. About 84% of earnings in covered employment were taxable in 2012, compared with 92% in 1937.
Taxable earnings as a percentage of earnings in covered employment and percentage of workers with maximum taxable earnings, selected years
SOURCE: Social Security Administration, Office of the Chief Actuary.
19451937 1955 1965 1975 1985 1995 2005 20120
10
20
30
40
50
60
70
80
90
100Percent
Taxable earnings
Workers with maximumtaxable earnings
OA
SD
I Pro
gram
Fast Facts & Figures About Social Security, 2013 ♦ 11
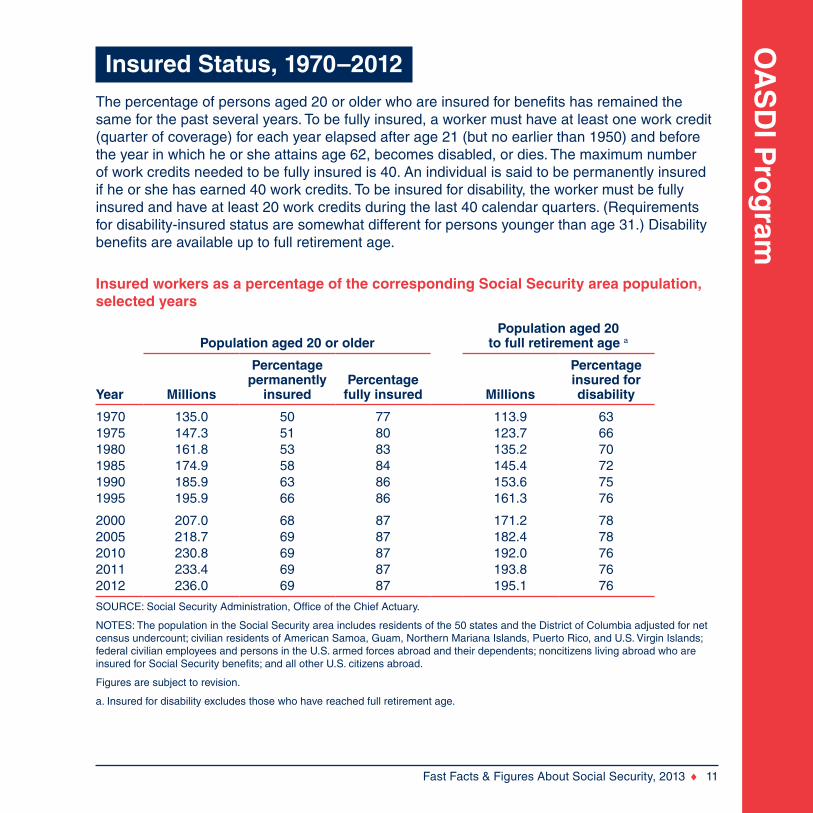
Insured Status, 1970–2012The percentage of persons aged 20 or older who are insured for benefits has remained the same for the past several years. To be fully insured, a worker must have at least one work credit (quarter of coverage) for each year elapsed after age 21 (but no earlier than 1950) and before the year in which he or she attains age 62, becomes disabled, or dies. The maximum number of work credits needed to be fully insured is 40. An individual is said to be permanently insured if he or she has earned 40 work credits. To be insured for disability, the worker must be fully insured and have at least 20 work credits during the last 40 calendar quarters. (Requirements for disability-insured status are somewhat different for persons younger than age 31.) Disability benefits are available up to full retirement age.
Insured workers as a percentage of the corresponding Social Security area population, selected years
Population aged 20 or olderPopulation aged 20
to full retirement age a
Year Millions
Percentage permanently
insuredPercentage
fully insured Millions
Percentage insured for disability
1970 135.0 50 77 113.9 631975 147.3 51 80 123.7 661980 161.8 53 83 135.2 701985 174.9 58 84 145.4 721990 185.9 63 86 153.6 751995 195.9 66 86 161.3 76
2000 207.0 68 87 171.2 782005 218.7 69 87 182.4 782010 230.8 69 87 192.0 762011 233.4 69 87 193.8 762012 236.0 69 87 195.1 76
SOURCE: Social Security Administration, Office of the Chief Actuary.
NOTES: The population in the Social Security area includes residents of the 50 states and the District of Columbia adjusted for net census undercount; civilian residents of American Samoa, Guam, Northern Mariana Islands, Puerto Rico, and U.S. Virgin Islands; federal civilian employees and persons in the U.S. armed forces abroad and their dependents; noncitizens living abroad who are insured for Social Security benefits; and all other U.S. citizens abroad.
Figures are subject to revision.
a. Insured for disability excludes those who have reached full retirement age.
OA
SD
I Pro
gra
m
12 ♦ Fast Facts & Figures About Social Security, 2013
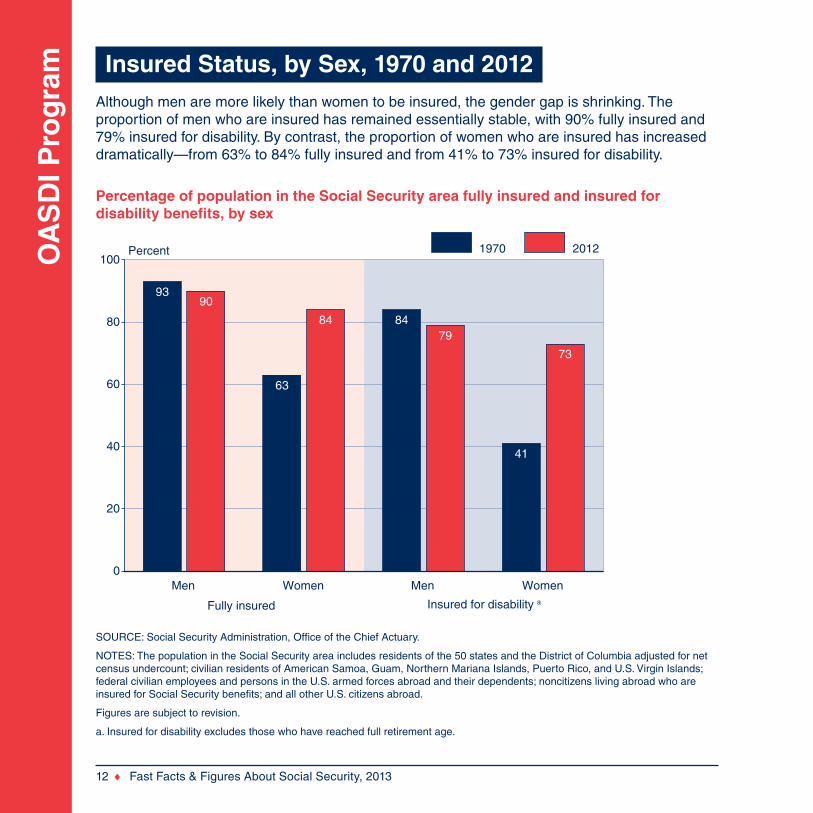
Insured Status, by Sex, 1970 and 2012Although men are more likely than women to be insured, the gender gap is shrinking. The proportion of men who are insured has remained essentially stable, with 90% fully insured and 79% insured for disability. By contrast, the proportion of women who are insured has increased dramatically—from 63% to 84% fully insured and from 41% to 73% insured for disability.
Percentage of population in the Social Security area fully insured and insured for disability benefits, by sex
SOURCE: Social Security Administration, Office of the Chief Actuary.
NOTES: The population in the Social Security area includes residents of the 50 states and the District of Columbia adjusted for net census undercount; civilian residents of American Samoa, Guam, Northern Mariana Islands, Puerto Rico, and U.S. Virgin Islands; federal civilian employees and persons in the U.S. armed forces abroad and their dependents; noncitizens living abroad who are insured for Social Security benefits; and all other U.S. citizens abroad.
Figures are subject to revision.
a. Insured for disability excludes those who have reached full retirement age.
Men Women Men Women0
20
40
60
80
100Percent
Fully insured Insured for disability a
9390
63
84 8479
41
73
1970 2012

OA
SD
I Pro
gram
Fast Facts & Figures About Social Security, 2013 ♦ 13
New Benefit Awards, 2012Benefits were awarded to about 5.7 million persons; of those, 48% were retired workers and 17% were disabled workers. The remaining 35% were survivors or the spouses and children of retired or disabled workers. These awards represent not only new entrants to the benefit rolls but also persons already on the rolls who become entitled to a different benefit, particularly conver-sions of disabled-worker benefits to retired-worker benefits at full retirement age.
New awards, by type of beneficiary
BeneficiaryNumber
(thousands) Percent
Total 5,655 100Retired workers and dependents 3,247 57
Workers 2,735 48Spouses and children 512 9
Disabled workers and dependents 1,523 27Workers 960 17Spouses and children 563 10
Survivors of deceased workers 885 16
SOURCE: Social Security Administration, Master Beneficiary Record, 100 percent data.
NOTE: Totals do not necessarily equal the sum of rounded components.
New awards, 2012
Disabled workers17%
Survivors anddependents
35%
Retired workers48%
OA
SD
I Pro
gra
m
14 ♦ Fast Facts & Figures About Social Security, 2013
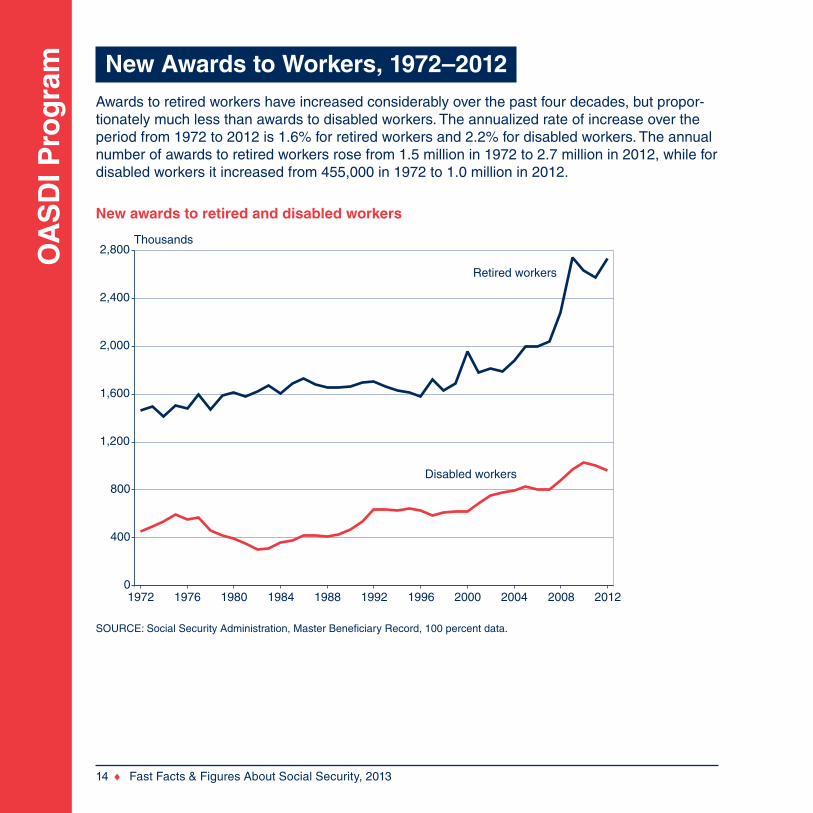
New Awards to Workers, 1972–2012Awards to retired workers have increased considerably over the past four decades, but propor-tionately much less than awards to disabled workers. The annualized rate of increase over the period from 1972 to 2012 is 1.6% for retired workers and 2.2% for disabled workers. The annual number of awards to retired workers rose from 1.5 million in 1972 to 2.7 million in 2012, while for disabled workers it increased from 455,000 in 1972 to 1.0 million in 2012.
New awards to retired and disabled workers
SOURCE: Social Security Administration, Master Beneficiary Record, 100 percent data.
1972 1976 1980 1984 1988 1992 1996 2000 2004 2008 20120
400
800
1,200
1,600
2,000
2,400
2,800Thousands
Retired workers
Disabled workers
OA
SD
I Pro
gram
Fast Facts & Figures About Social Security, 2013 ♦ 15
Beneficiaries in Current-Payment Status, December 2012
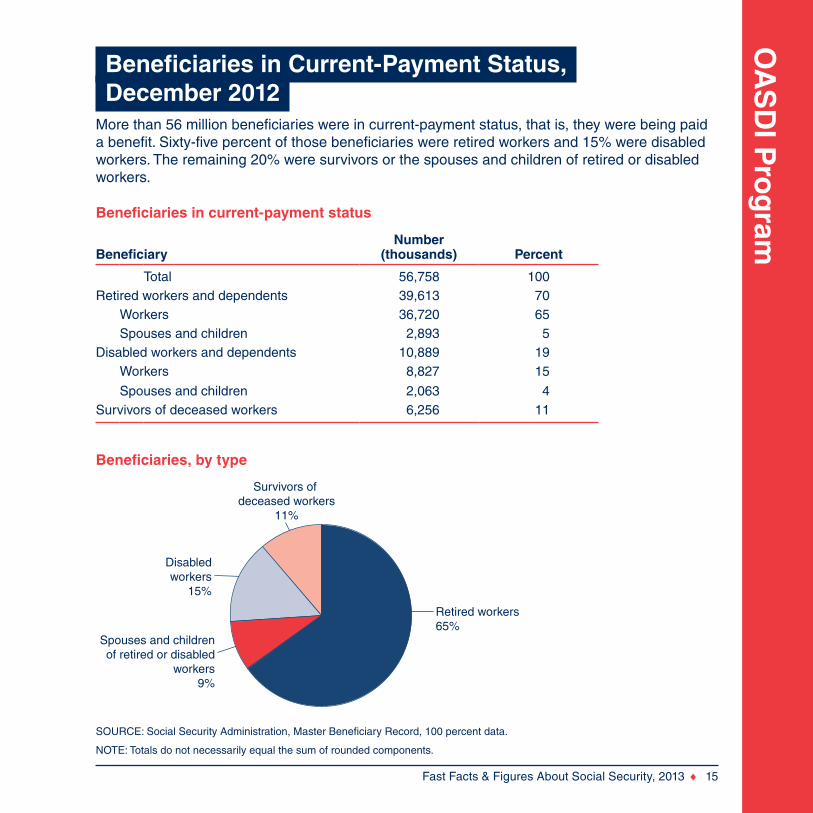
More than 56 million beneficiaries were in current-payment status, that is, they were being paid a benefit. Sixty-five percent of those beneficiaries were retired workers and 15% were disabled workers. The remaining 20% were survivors or the spouses and children of retired or disabled workers.
Beneficiaries in current-payment status
BeneficiaryNumber
(thousands) Percent
Total 56,758 100Retired workers and dependents 39,613 70
Workers 36,720 65Spouses and children 2,893 5
Disabled workers and dependents 10,889 19Workers 8,827 15
Spouses and children 2,063 4Survivors of deceased workers 6,256 11
SOURCE: Social Security Administration, Master Beneficiary Record, 100 percent data.
NOTE: Totals do not necessarily equal the sum of rounded components.
Beneficiaries, by type
Spouses and childrenof retired or disabled
workers9%
Disabledworkers
15%
Survivors of deceased workers
11%
Retired workers65%
OA
SD
I Pro
gra
m
16 ♦ Fast Facts & Figures About Social Security, 2013
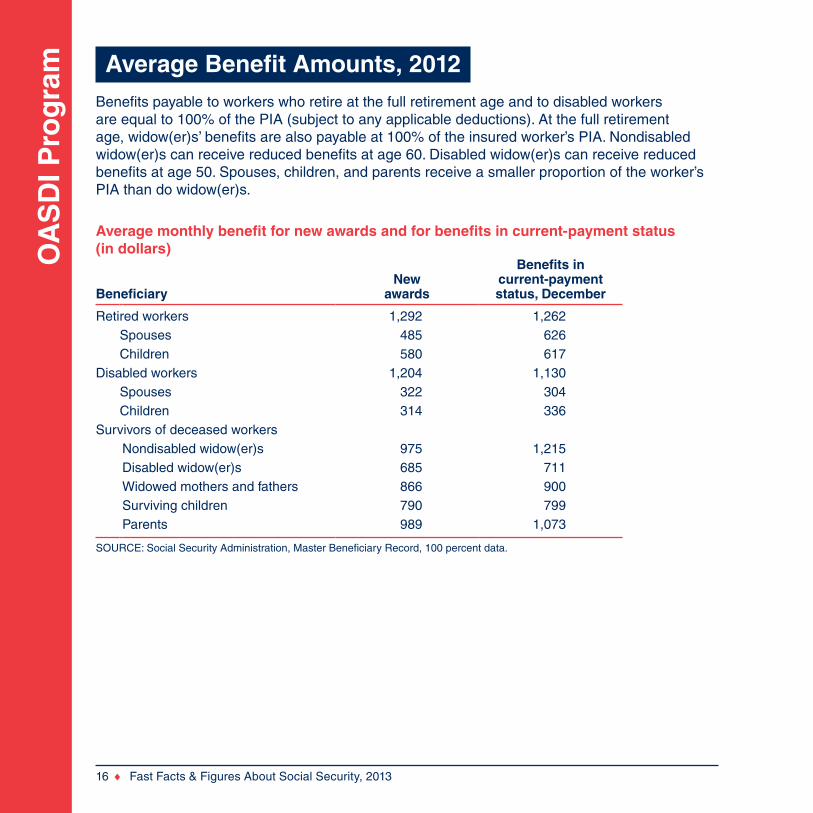
Average Benefit Amounts, 2012Benefits payable to workers who retire at the full retirement age and to disabled workers are equal to 100% of the PIA (subject to any applicable deductions). At the full retirement age, widow(er)s’ benefits are also payable at 100% of the insured worker’s PIA. Nondisabled widow(er)s can receive reduced benefits at age 60. Disabled widow(er)s can receive reduced benefits at age 50. Spouses, children, and parents receive a smaller proportion of the worker’s PIA than do widow(er)s.
Average monthly benefit for new awards and for benefits in current-payment status (in dollars)
BeneficiaryNew
awards
Benefits in current-payment status, December
Retired workers 1,292 1,262Spouses 485 626Children 580 617
Disabled workers 1,204 1,130Spouses 322 304Children 314 336
Survivors of deceased workersNondisabled widow(er)s 975 1,215Disabled widow(er)s 685 711Widowed mothers and fathers 866 900Surviving children 790 799Parents 989 1,073
SOURCE: Social Security Administration, Master Beneficiary Record, 100 percent data.
OA
SD
I Pro
gram
Fast Facts & Figures About Social Security, 2013 ♦ 17
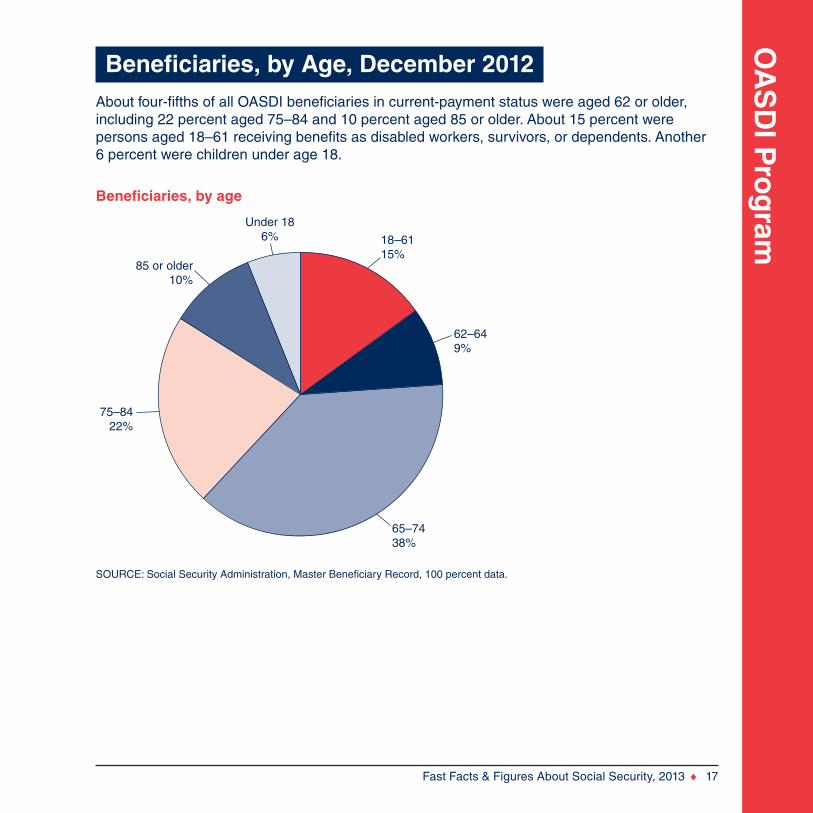
Beneficiaries, by Age, December 2012About four-fifths of all OASDI beneficiaries in current-payment status were aged 62 or older, including 22 percent aged 75–84 and 10 percent aged 85 or older. About 15 percent were persons aged 18–61 receiving benefits as disabled workers, survivors, or dependents. Another 6 percent were children under age 18.
Beneficiaries, by age
SOURCE: Social Security Administration, Master Beneficiary Record, 100 percent data.
62–649%
65–7438%
18–6115%
Under 186%
85 or older10%
75–8422%
OA
SD
I Pro
gra
m
18 ♦ Fast Facts & Figures About Social Security, 2013
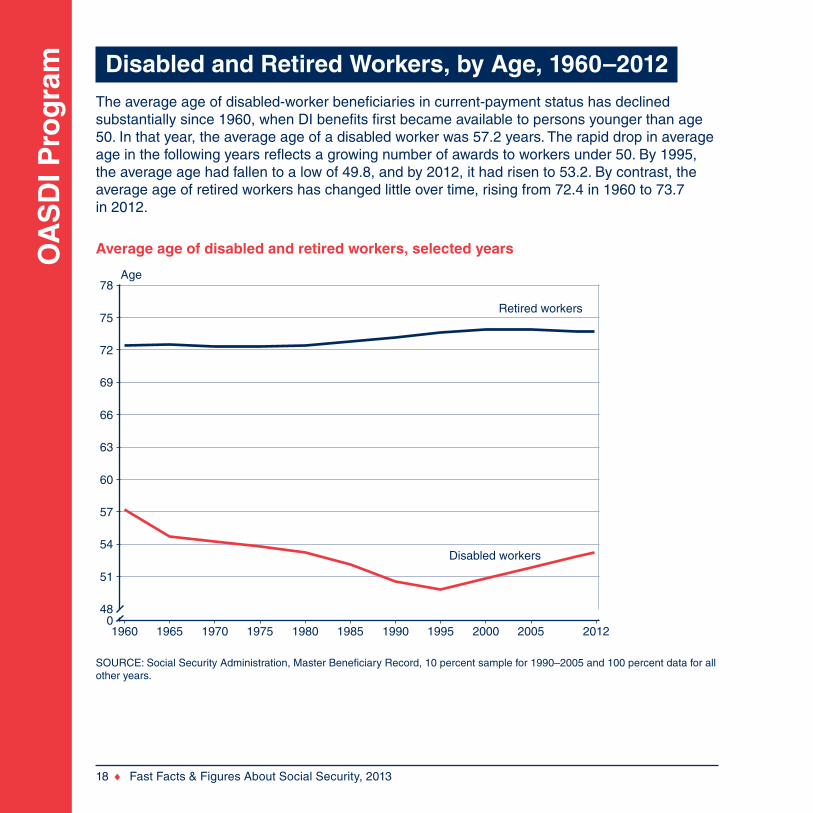
Disabled and Retired Workers, by Age, 1960–2012The average age of disabled-worker beneficiaries in current-payment status has declined substantially since 1960, when DI benefits first became available to persons younger than age 50. In that year, the average age of a disabled worker was 57.2 years. The rapid drop in average age in the following years reflects a growing number of awards to workers under 50. By 1995, the average age had fallen to a low of 49.8, and by 2012, it had risen to 53.2. By contrast, the average age of retired workers has changed little over time, rising from 72.4 in 1960 to 73.7 in 2012.
Average age of disabled and retired workers, selected years
SOURCE: Social Security Administration, Master Beneficiary Record, 10 percent sample for 1990–2005 and 100 percent data for all other years.
1960 1965 1970 1975 1980 1985 1990 1995 2000 2005 20120
48
51
54
57
60
63
66
69
72
75
78Age
Retired workers
Disabled workers
OA
SD
I Pro
gram
Fast Facts & Figures About Social Security, 2013 ♦ 19
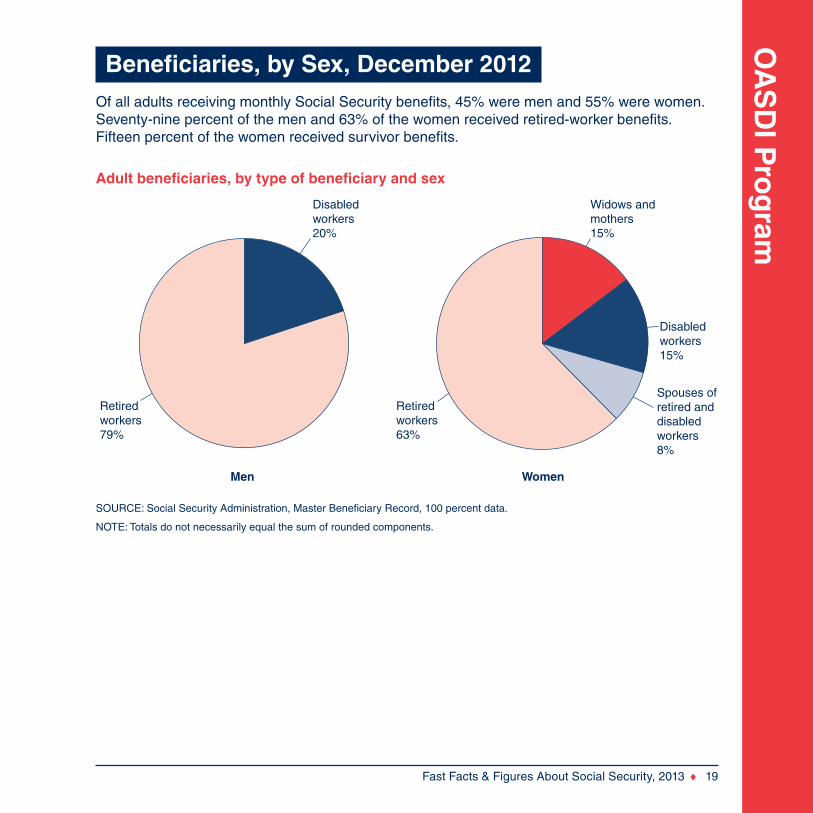
Beneficiaries, by Sex, December 2012Of all adults receiving monthly Social Security benefits, 45% were men and 55% were women. Seventy-nine percent of the men and 63% of the women received retired-worker benefits. Fifteen percent of the women received survivor benefits.
Adult beneficiaries, by type of beneficiary and sex
SOURCE: Social Security Administration, Master Beneficiary Record, 100 percent data.
NOTE: Totals do not necessarily equal the sum of rounded components.
Men Women
Disabledworkers20%
Retiredworkers79%
Retiredworkers63%
Spouses ofretired anddisabledworkers8%
Disabledworkers15%
Widows andmothers15%
OA
SD
I Pro
gra
m
20 ♦ Fast Facts & Figures About Social Security, 2013
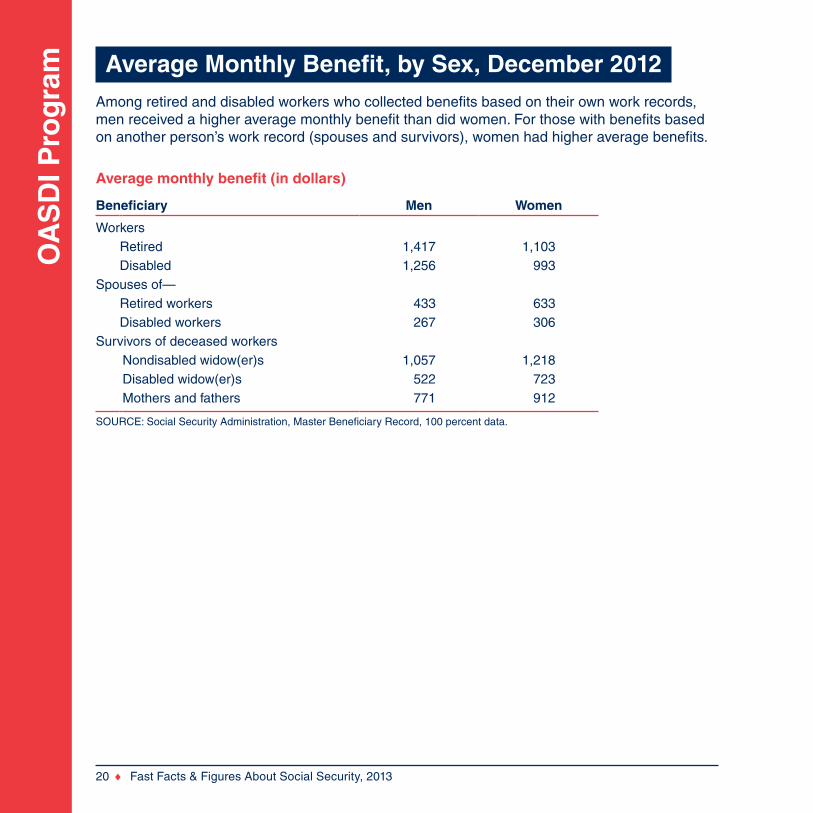
Average Monthly Benefit, by Sex, December 2012Among retired and disabled workers who collected benefits based on their own work records, men received a higher average monthly benefit than did women. For those with benefits based on another person’s work record (spouses and survivors), women had higher average benefits.
Average monthly benefit (in dollars)
Beneficiary Men Women
WorkersRetired 1,417 1,103Disabled 1,256 993
Spouses of—Retired workers 433 633Disabled workers 267 306
Survivors of deceased workersNondisabled widow(er)s 1,057 1,218Disabled widow(er)s 522 723Mothers and fathers 771 912
SOURCE: Social Security Administration, Master Beneficiary Record, 100 percent data.
OA
SD
I Pro
gram
Fast Facts & Figures About Social Security, 2013 ♦ 21
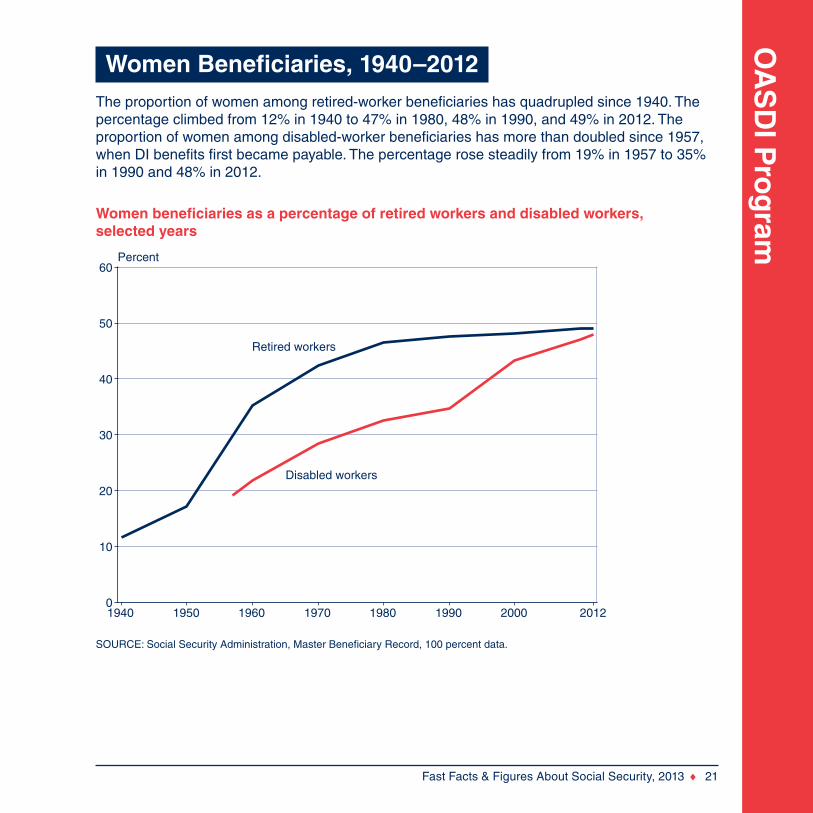
Women Beneficiaries, 1940–2012The proportion of women among retired-worker beneficiaries has quadrupled since 1940. The percentage climbed from 12% in 1940 to 47% in 1980, 48% in 1990, and 49% in 2012. The proportion of women among disabled-worker beneficiaries has more than doubled since 1957, when DI benefits first became payable. The percentage rose steadily from 19% in 1957 to 35% in 1990 and 48% in 2012.
Women beneficiaries as a percentage of retired workers and disabled workers, selected years
SOURCE: Social Security Administration, Master Beneficiary Record, 100 percent data.
1940 1950 1960 1970 1980 1990 2000 20120
10
20
30
40
50
60Percent
Retired workers
Disabled workers
OA
SD
I Pro
gra
m
22 ♦ Fast Facts & Figures About Social Security, 2013
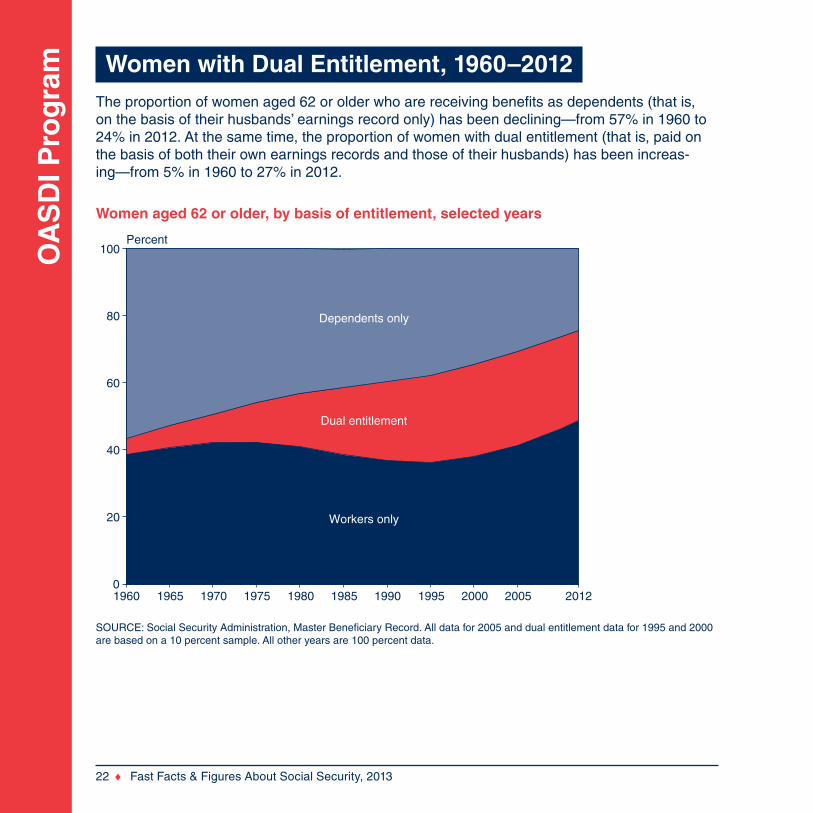
Women with Dual Entitlement, 1960–2012The proportion of women aged 62 or older who are receiving benefits as dependents (that is, on the basis of their husbands’ earnings record only) has been declining—from 57% in 1960 to 24% in 2012. At the same time, the proportion of women with dual entitlement (that is, paid on the basis of both their own earnings records and those of their husbands) has been increas-ing—from 5% in 1960 to 27% in 2012.
Women aged 62 or older, by basis of entitlement, selected years
SOURCE: Social Security Administration, Master Beneficiary Record. All data for 2005 and dual entitlement data for 1995 and 2000 are based on a 10 percent sample. All other years are 100 percent data.
1960 1965 1970 1975 1980 1985 1990 1995 2000 2005 20120
20
40
60
80
100Percent
Workers only
Dual entitlement
Dependents only
OA
SD
I Pro
gram
Fast Facts & Figures About Social Security, 2013 ♦ 23
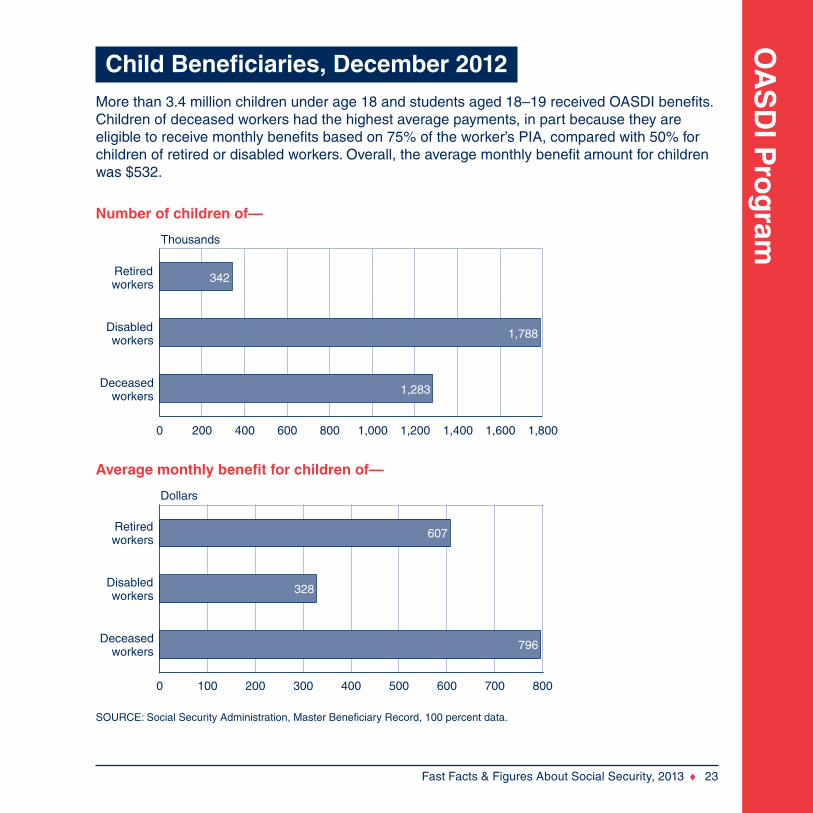
Deceasedworkers
Disabledworkers
Retiredworkers
0 200 400 600 800 1,000 1,200 1,400 1,600 1,800
Thousands
1,283
1,788
342
Deceasedworkers
Disabledworkers
Retiredworkers
0 100 200 300 400 500 600 700 800
Dollars
796
328
607
SOURCE: Social Security Administration, Master Beneficiary Record, 100 percent data.
Average monthly benefit for children of—
Child Beneficiaries, December 2012More than 3.4 million children under age 18 and students aged 18–19 received OASDI benefits. Children of deceased workers had the highest average payments, in part because they are eligible to receive monthly benefits based on 75% of the worker’s PIA, compared with 50% for children of retired or disabled workers. Overall, the average monthly benefit amount for children was $532.
Number of children of—
SS
I Pro
gra
m
24 ♦ Fast Facts & Figures About Social Security, 2013
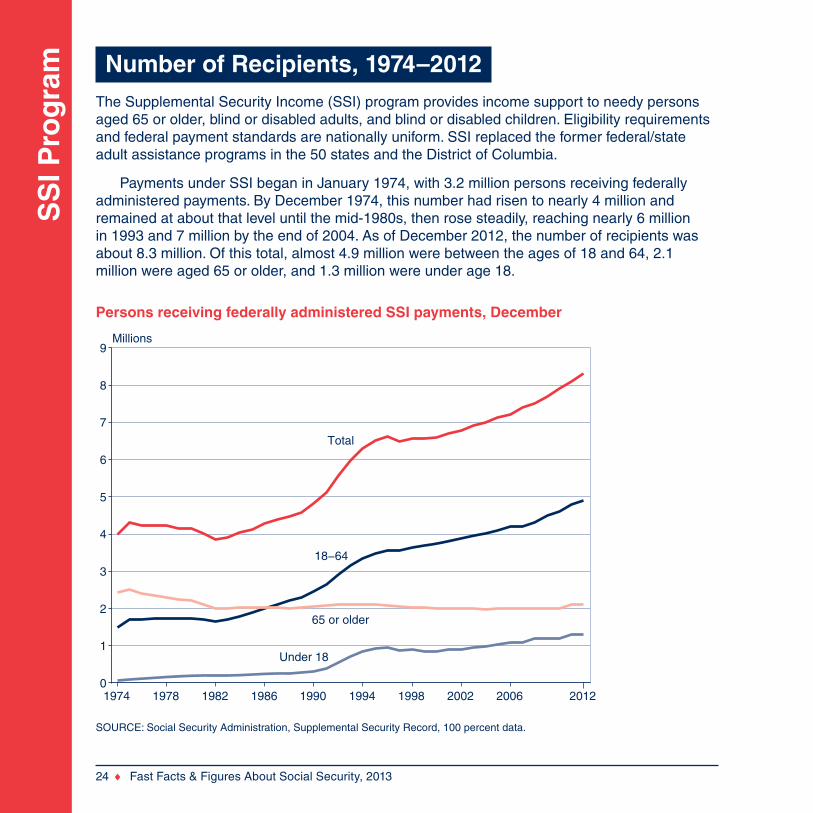
Number of Recipients, 1974–2012The Supplemental Security Income (SSI) program provides income support to needy persons aged 65 or older, blind or disabled adults, and blind or disabled children. Eligibility requirements and federal payment standards are nationally uniform. SSI replaced the former federal/state adult assistance programs in the 50 states and the District of Columbia.
Payments under SSI began in January 1974, with 3.2 million persons receiving federally administered payments. By December 1974, this number had risen to nearly 4 million and remained at about that level until the mid-1980s, then rose steadily, reaching nearly 6 million in 1993 and 7 million by the end of 2004. As of December 2012, the number of recipients was about 8.3 million. Of this total, almost 4.9 million were between the ages of 18 and 64, 2.1 million were aged 65 or older, and 1.3 million were under age 18.
Persons receiving federally administered SSI payments, December
SOURCE: Social Security Administration, Supplemental Security Record, 100 percent data.
1974 1978 1982 1986 1990 1994 1998 2002 2006 20120
1
2
3
4
5
6
7
8
9Millions
Total
18−64
65 or older
Under 18
SS
I Pro
gram
Fast Facts & Figures About Social Security, 2013 ♦ 25
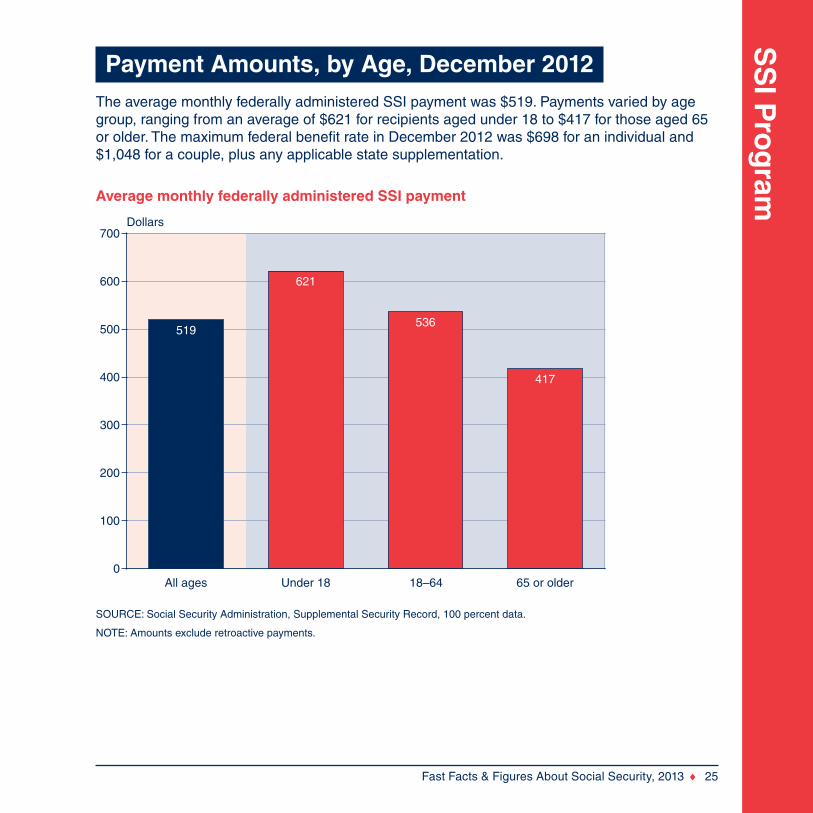
Payment Amounts, by Age, December 2012The average monthly federally administered SSI payment was $519. Payments varied by age group, ranging from an average of $621 for recipients aged under 18 to $417 for those aged 65 or older. The maximum federal benefit rate in December 2012 was $698 for an individual and $1,048 for a couple, plus any applicable state supplementation.
Average monthly federally administered SSI payment
SOURCE: Social Security Administration, Supplemental Security Record, 100 percent data.
NOTE: Amounts exclude retroactive payments.
All ages Under 18 18–64 65 or older0
100
200
300
400
500
600
700Dollars
519
621
536
417
SS
I Pro
gra
m
26 ♦ Fast Facts & Figures About Social Security, 2013
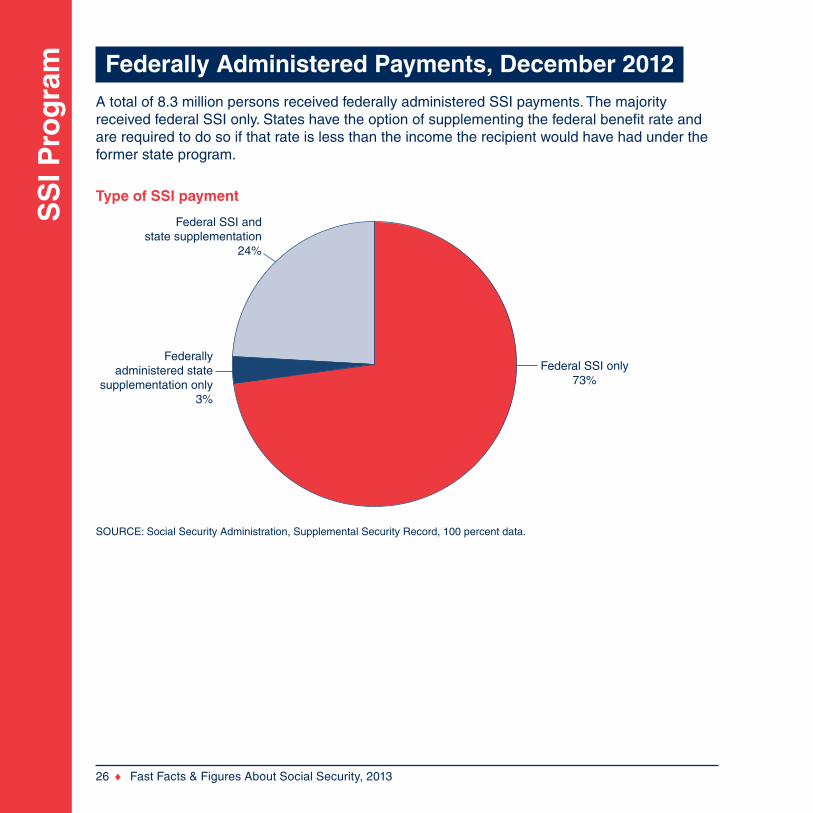
Federally Administered Payments, December 2012A total of 8.3 million persons received federally administered SSI payments. The majority received federal SSI only. States have the option of supplementing the federal benefit rate and are required to do so if that rate is less than the income the recipient would have had under the former state program.
Type of SSI payment
SOURCE: Social Security Administration, Supplemental Security Record, 100 percent data.
Federal SSI only73%
Federal SSI andstate supplementation
24%
Federallyadministered state
supplementation only3%
SS
I Pro
gram
Fast Facts & Figures About Social Security, 2013 ♦ 27
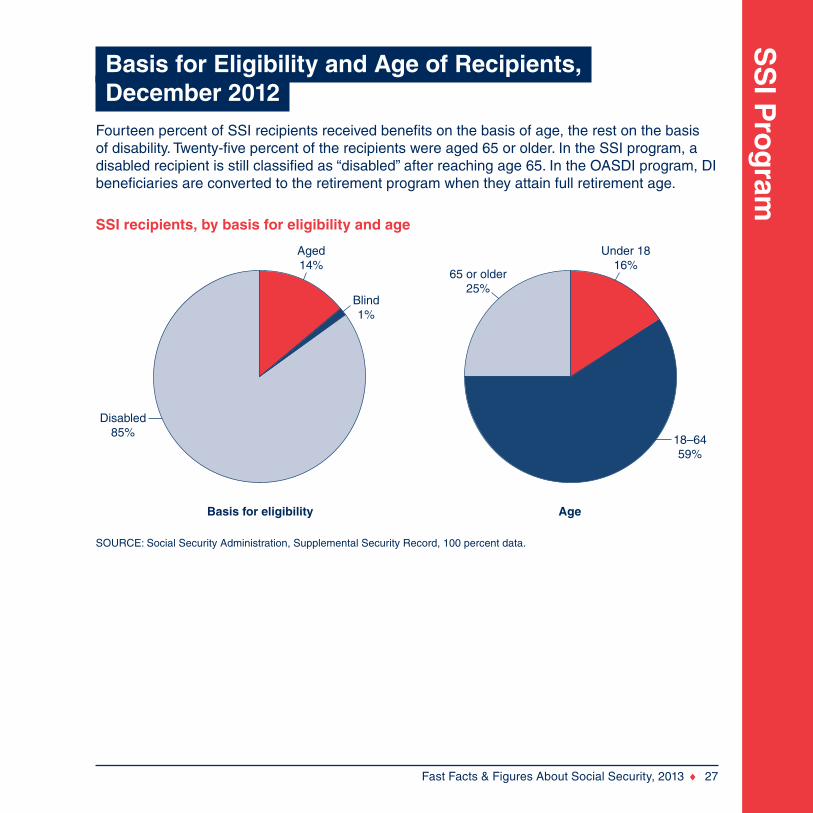
Basis for Eligibility and Age of Recipients, December 2012
Fourteen percent of SSI recipients received benefits on the basis of age, the rest on the basis of disability. Twenty-five percent of the recipients were aged 65 or older. In the SSI program, a disabled recipient is still classified as “disabled” after reaching age 65. In the OASDI program, DI beneficiaries are converted to the retirement program when they attain full retirement age.
SSI recipients, by basis for eligibility and age
SOURCE: Social Security Administration, Supplemental Security Record, 100 percent data.
Basis for eligibility Age
Disabled85%
Aged14%
Blind1%
65 or older25%
Under 1816%
18–6459%
SS
I Pro
gra
m
28 ♦ Fast Facts & Figures About Social Security, 2013
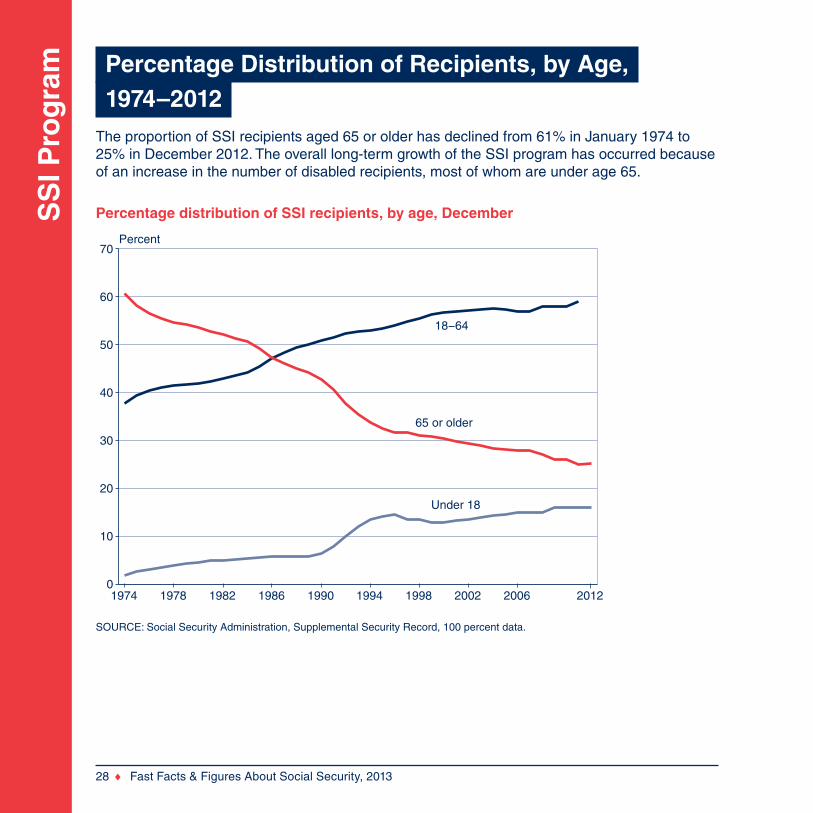
Percentage Distribution of Recipients, by Age, 1974–2012
The proportion of SSI recipients aged 65 or older has declined from 61% in January 1974 to 25% in December 2012. The overall long-term growth of the SSI program has occurred because of an increase in the number of disabled recipients, most of whom are under age 65.
Percentage distribution of SSI recipients, by age, December
SOURCE: Social Security Administration, Supplemental Security Record, 100 percent data.
1974 1978 1982 1986 1990 1994 1998 2002 2006 20120
10
20
30
40
50
60
70Percent
18−64
65 or older
Under 18
SS
I Pro
gram
Fast Facts & Figures About Social Security, 2013 ♦ 29
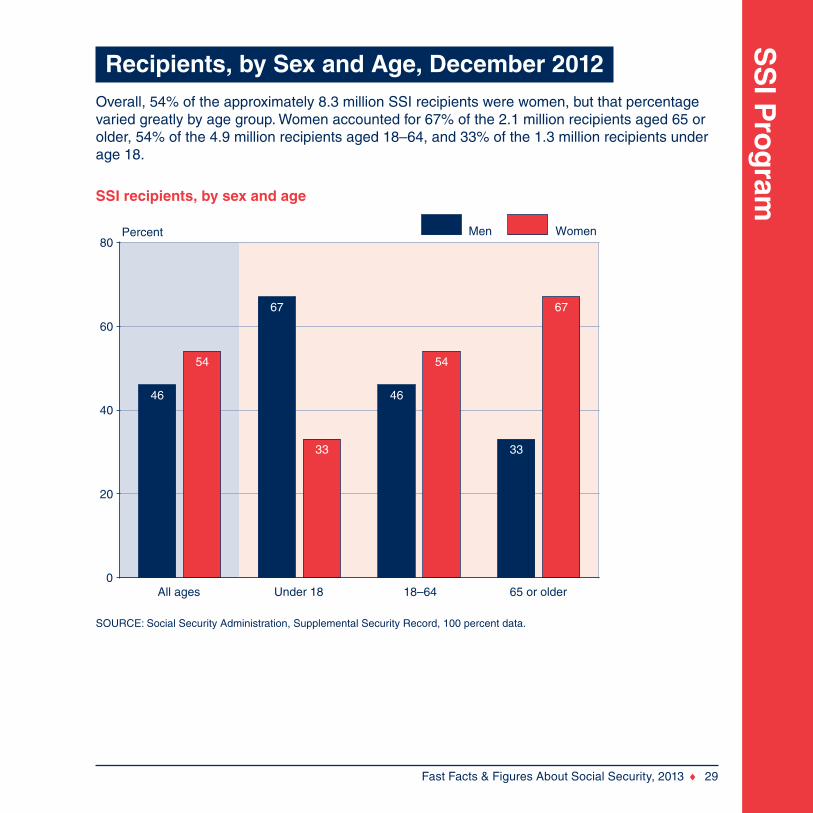
Recipients, by Sex and Age, December 2012Overall, 54% of the approximately 8.3 million SSI recipients were women, but that percentage varied greatly by age group. Women accounted for 67% of the 2.1 million recipients aged 65 or older, 54% of the 4.9 million recipients aged 18–64, and 33% of the 1.3 million recipients under age 18.
SSI recipients, by sex and age
SOURCE: Social Security Administration, Supplemental Security Record, 100 percent data.
All ages Under 18 18–64 65 or older0
20
40
60
80Percent
46
54
67
33
46
54
33
67
Men Women
SS
I Pro
gra
m
30 ♦ Fast Facts & Figures About Social Security, 2013
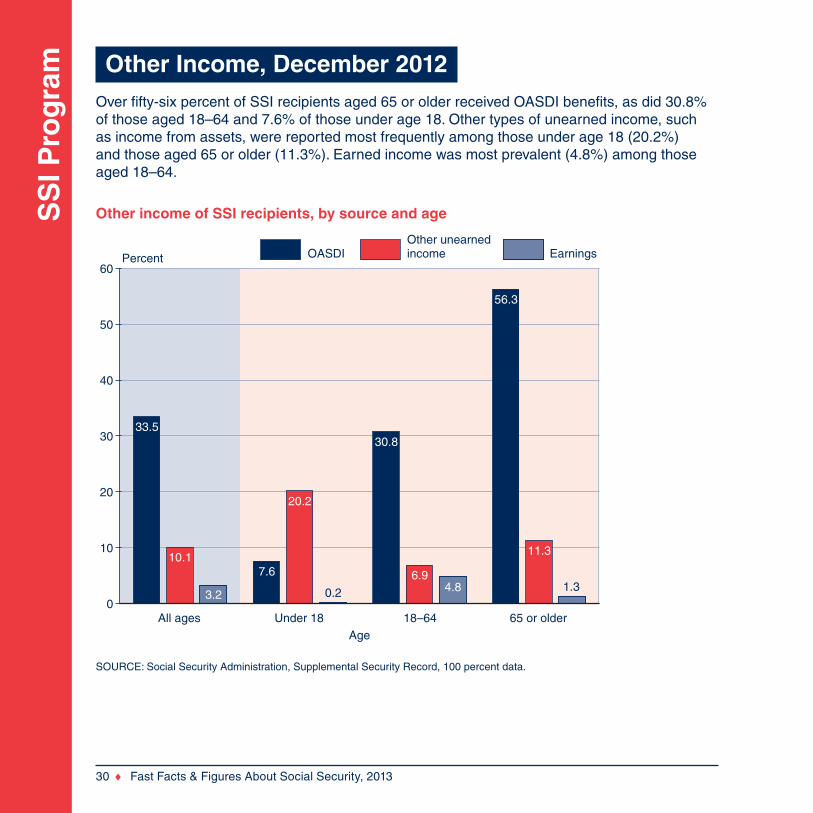
Other Income, December 2012Over fifty-six percent of SSI recipients aged 65 or older received OASDI benefits, as did 30.8% of those aged 18–64 and 7.6% of those under age 18. Other types of unearned income, such as income from assets, were reported most frequently among those under age 18 (20.2%) and those aged 65 or older (11.3%). Earned income was most prevalent (4.8%) among those aged 18–64.
Other income of SSI recipients, by source and age
SOURCE: Social Security Administration, Supplemental Security Record, 100 percent data.
All ages Under 18 18–64 65 or older0
10
20
30
40
50
60Percent
Age
33.5
10.1
3.2
7.6
20.2
0.2
30.8
6.94.8
56.3
11.3
1.3
Other unearned income EarningsOASDI
SS
I Pro
gram
Fast Facts & Figures About Social Security, 2013 ♦ 31
1974 1978 1982 1986 1990 1994 1998 2002 2006 20120
200
400
600
800
1,000
1,200
1,400Thousands
1974 1978 1982 1986 1990 1994 1998 2002 2006 20120
100
200
300
400
500
600
700Dollars
SOURCE: Social Security Administration, Supplemental Security Record, 100 percent data.
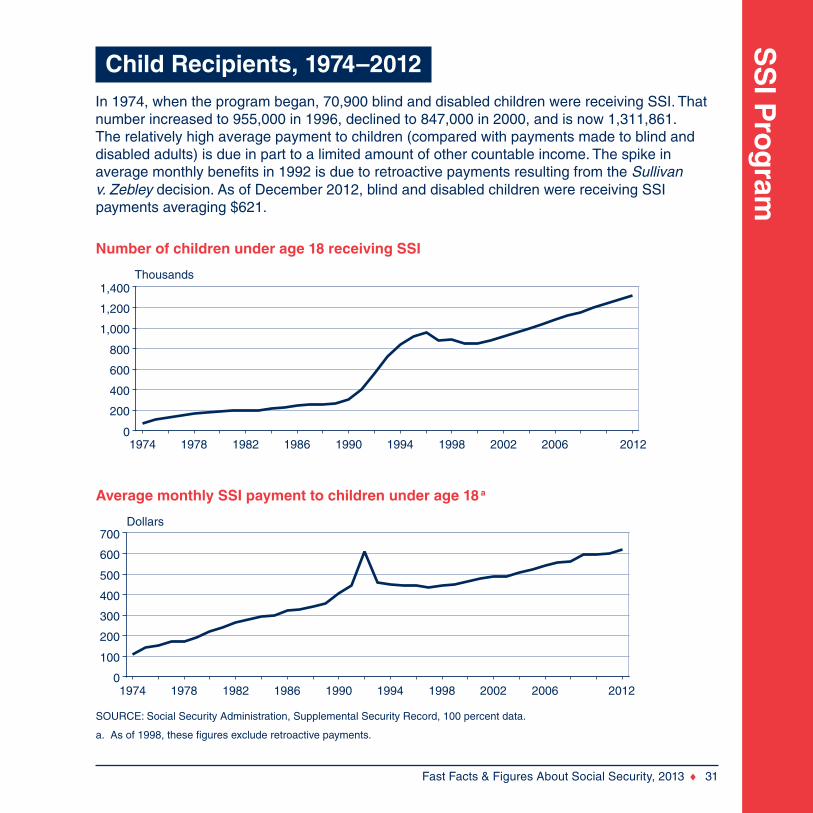
a. As of 1998, these figures exclude retroactive payments.
Average monthly SSI payment to children under age 18 a
Child Recipients, 1974–2012In 1974, when the program began, 70,900 blind and disabled children were receiving SSI. That number increased to 955,000 in 1996, declined to 847,000 in 2000, and is now 1,311,861. The relatively high average payment to children (compared with payments made to blind and disabled adults) is due in part to a limited amount of other countable income. The spike in average monthly benefits in 1992 is due to retroactive payments resulting from the Sullivan v. Zebley decision. As of December 2012, blind and disabled children were receiving SSIpayments averaging $621.
Number of children under age 18 receiving SSI
Cro
ss-P
rog
ram
Ben
efici
arie
s
32 ♦ Fast Facts & Figures About Social Security, 2013
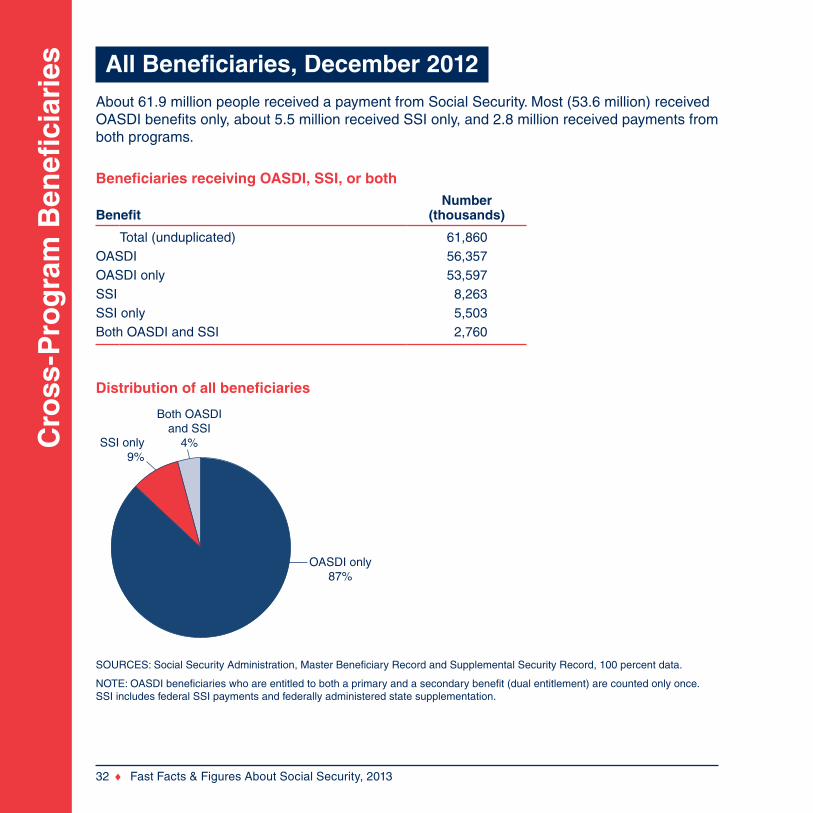
All Beneficiaries, December 2012 About 61.9 million people received a payment from Social Security. Most (53.6 million) received OASDI benefits only, about 5.5 million received SSI only, and 2.8 million received payments from both programs.
Beneficiaries receiving OASDI, SSI, or both
BenefitNumber
(thousands)
Total (unduplicated) 61,860OASDI 56,357OASDI only 53,597SSI 8,263SSI only 5,503Both OASDI and SSI 2,760
SOURCES: Social Security Administration, Master Beneficiary Record and Supplemental Security Record, 100 percent data.
NOTE: OASDI beneficiaries who are entitled to both a primary and a secondary benefit (dual entitlement) are counted only once. SSI includes federal SSI payments and federally administered state supplementation.
Distribution of all beneficiaries
Both OASDIand SSI
4%SSI only9%
OASDI only87%
Cro
ss-Pro
gram
Ben
eficiaries
Fast Facts & Figures About Social Security, 2013 ♦ 33
Distribution of beneficiaries aged 65 or older, by program
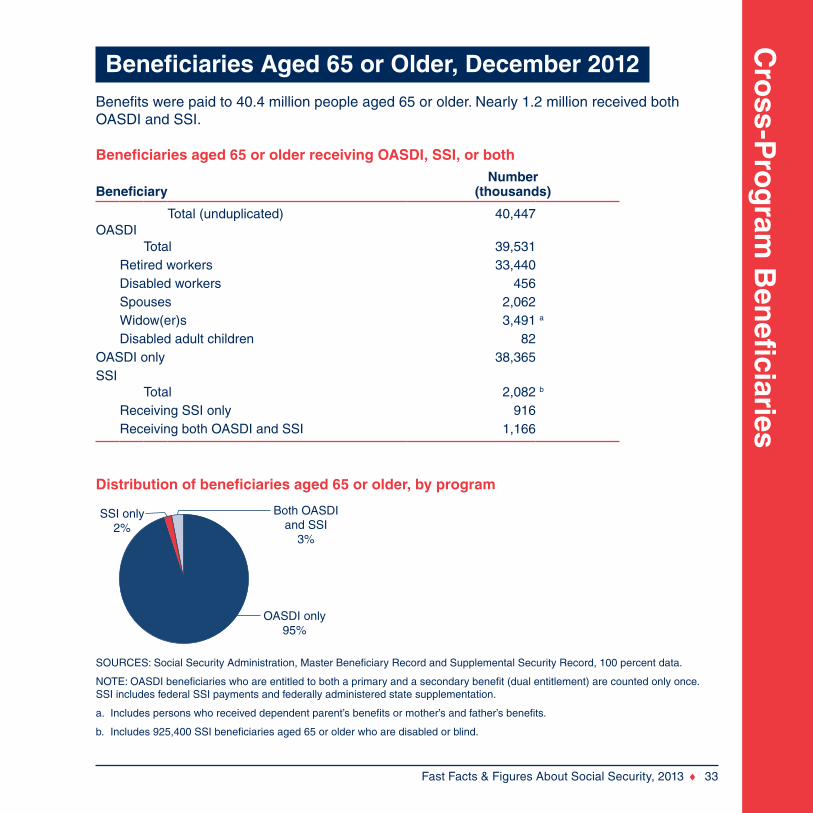
Beneficiaries Aged 65 or Older, December 2012Benefits were paid to 40.4 million people aged 65 or older. Nearly 1.2 million received both OASDI and SSI.
Beneficiaries aged 65 or older receiving OASDI, SSI, or both
BeneficiaryNumber
(thousands)
Total (unduplicated) 40,447OASDI
Total 39,531Retired workers 33,440Disabled workers 456Spouses 2,062Widow(er)s 3,491 a
Disabled adult children 82OASDI only 38,365SSI
Total 2,082 b
Receiving SSI only 916Receiving both OASDI and SSI 1,166
SOURCES: Social Security Administration, Master Beneficiary Record and Supplemental Security Record, 100 percent data.
NOTE: OASDI beneficiaries who are entitled to both a primary and a secondary benefit (dual entitlement) are counted only once. SSI includes federal SSI payments and federally administered state supplementation.
a. Includes persons who received dependent parent’s benefits or mother’s and father’s benefits.
b. Includes 925,400 SSI beneficiaries aged 65 or older who are disabled or blind.
SSI only2%
Both OASDIand SSI
3%
OASDI only95%
Cro
ss-P
rog
ram
Ben
efici
arie
s
34 ♦ Fast Facts & Figures About Social Security, 2013
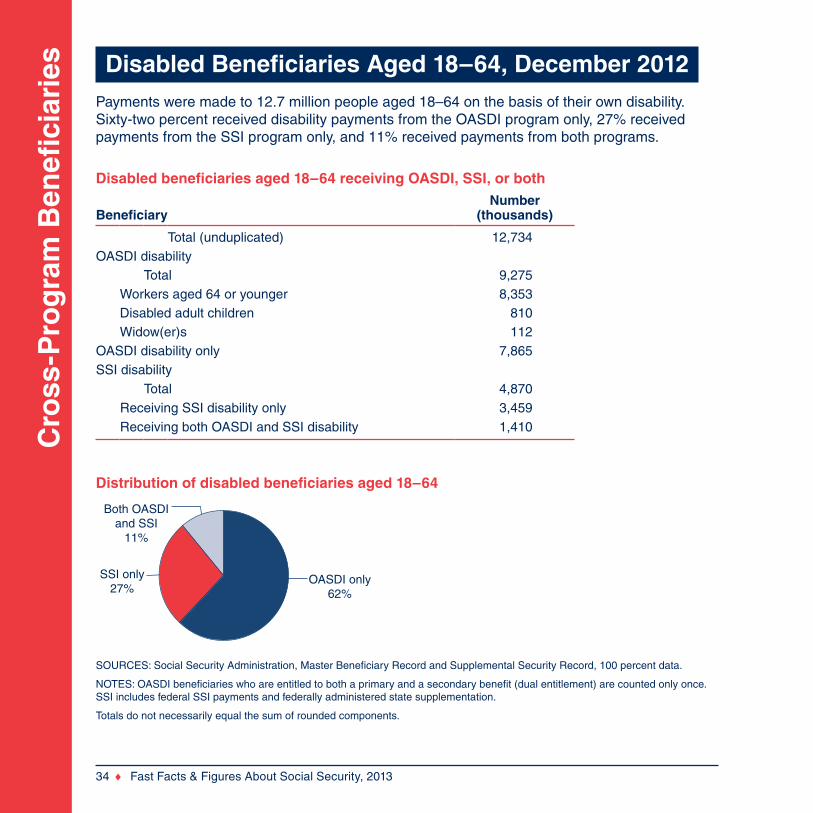
Disabled Beneficiaries Aged 18–64, December 2012Payments were made to 12.7 million people aged 18–64 on the basis of their own disability. Sixty-two percent received disability payments from the OASDI program only, 27% received payments from the SSI program only, and 11% received payments from both programs.
Disabled beneficiaries aged 18–64 receiving OASDI, SSI, or both
BeneficiaryNumber
(thousands)
Total (unduplicated) 12,734OASDI disability
Total 9,275Workers aged 64 or younger 8,353Disabled adult children 810Widow(er)s 112
OASDI disability only 7,865SSI disability
Total 4,870Receiving SSI disability only 3,459Receiving both OASDI and SSI disability 1,410
SOURCES: Social Security Administration, Master Beneficiary Record and Supplemental Security Record, 100 percent data.
NOTES: OASDI beneficiaries who are entitled to both a primary and a secondary benefit (dual entitlement) are counted only once. SSI includes federal SSI payments and federally administered state supplementation.
Totals do not necessarily equal the sum of rounded components.
Distribution of disabled beneficiaries aged 18–64
Both OASDIand SSI
11%
SSI only27%
OASDI only62%
So
cial Secu
rity Fin
ancin
g
Fast Facts & Figures About Social Security, 2013 ♦ 35
Sources$840.2 billion
Uses$840.2 billion
Administrativeexpenses
0.8%
Railroad Retirementfinancial
interchange0.6%Increase in
trust funds6.5%
Benefitpayments92.2%
Taxation ofbenefits
3.2%Interest13.0%
Payrolltaxes83.8%
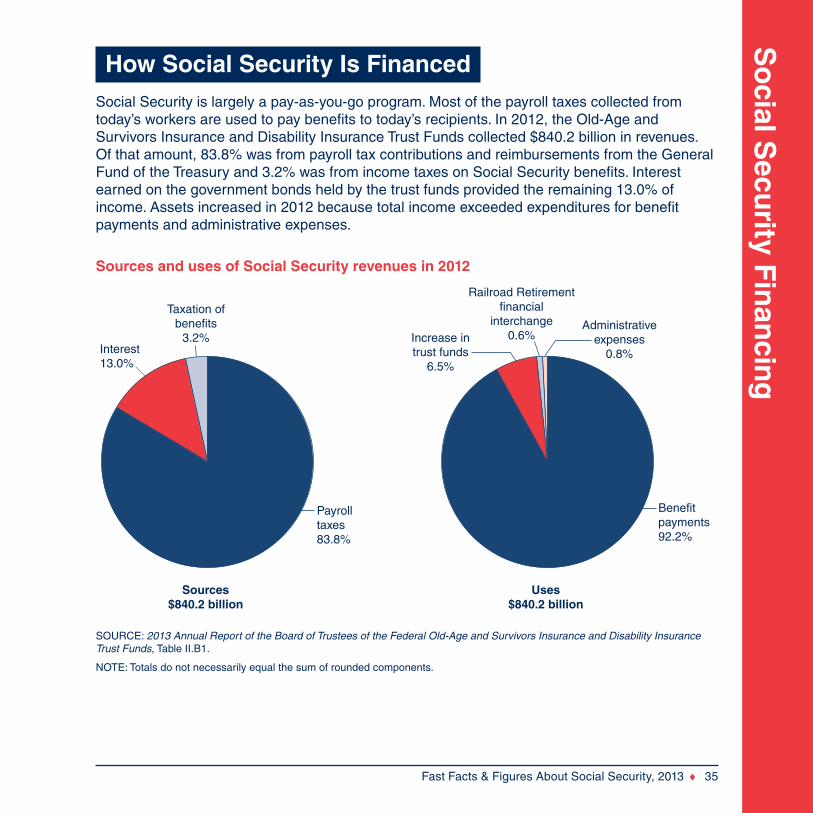
SOURCE: 2013 Annual Report of the Board of Trustees of the Federal Old-Age and Survivors Insurance and Disability Insurance Trust Funds, Table II.B1.
NOTE: Totals do not necessarily equal the sum of rounded components.
How Social Security Is FinancedSocial Security is largely a pay-as-you-go program. Most of the payroll taxes collected from today’s workers are used to pay benefits to today’s recipients. In 2012, the Old-Age and Survivors Insurance and Disability Insurance Trust Funds collected $840.2 billion in revenues. Of that amount, 83.8% was from payroll tax contributions and reimbursements from the General Fund of the Treasury and 3.2% was from income taxes on Social Security benefits. Interest earned on the government bonds held by the trust funds provided the remaining 13.0% of income. Assets increased in 2012 because total income exceeded expenditures for benefit payments and administrative expenses.
Sources and uses of Social Security revenues in 2012
So
cial
Sec
uri
ty F
inan
cin
g
36 ♦ Fast Facts & Figures About Social Security, 2013
1955 1970 1985 2000 2030 2045 2060 2075 20900
2
4
6
8
10Workers per beneficiary
Historical Estimated
2012
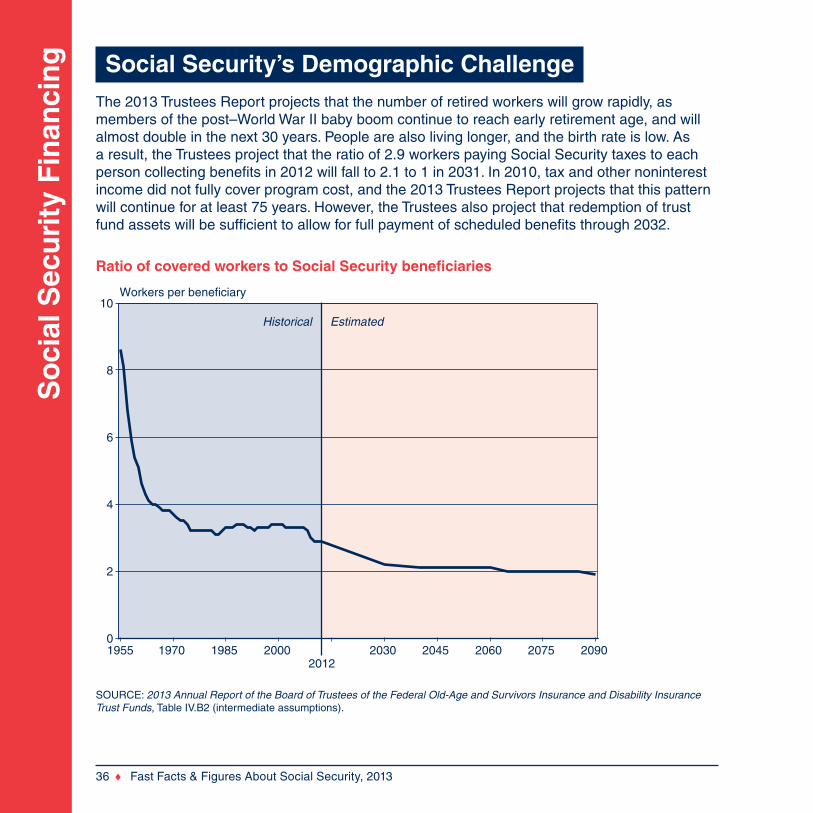
SOURCE: 2013 Annual Report of the Board of Trustees of the Federal Old-Age and Survivors Insurance and Disability Insurance Trust Funds, Table IV.B2 (intermediate assumptions).
Social Security’s Demographic ChallengeThe 2013 Trustees Report projects that the number of retired workers will grow rapidly, as members of the post–World War II baby boom continue to reach early retirement age, and will almost double in the next 30 years. People are also living longer, and the birth rate is low. As a result, the Trustees project that the ratio of 2.9 workers paying Social Security taxes to each person collecting benefits in 2012 will fall to 2.1 to 1 in 2031. In 2010, tax and other noninterest income did not fully cover program cost, and the 2013 Trustees Report projects that this pattern will continue for at least 75 years. However, the Trustees also project that redemption of trust fund assets will be sufficient to allow for full payment of scheduled benefits through 2032.
Ratio of covered workers to Social Security beneficiaries
So
cial Secu
rity Fin
ancin
g
Fast Facts & Figures About Social Security, 2013 ♦ 37
2013 2020 20272033
2041 2048 2055 2062 2069 2076 2083 2090−7
−6
−5
−4
−3
−2
−1
0
1Percent
Before insolvency After insolvency
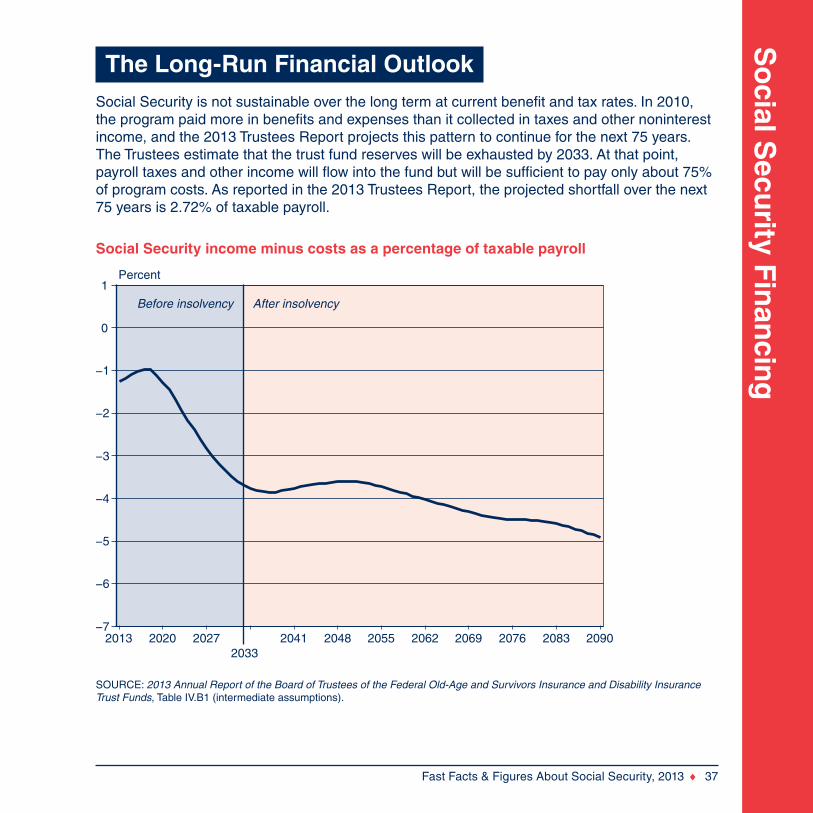
SOURCE: 2013 Annual Report of the Board of Trustees of the Federal Old-Age and Survivors Insurance and Disability Insurance Trust Funds, Table IV.B1 (intermediate assumptions).
The Long-Run Financial OutlookSocial Security is not sustainable over the long term at current benefit and tax rates. In 2010, the program paid more in benefits and expenses than it collected in taxes and other noninterest income, and the 2013 Trustees Report projects this pattern to continue for the next 75 years. The Trustees estimate that the trust fund reserves will be exhausted by 2033. At that point, payroll taxes and other income will flow into the fund but will be sufficient to pay only about 75% of program costs. As reported in the 2013 Trustees Report, the projected shortfall over the next 75 years is 2.72% of taxable payroll.
Social Security income minus costs as a percentage of taxable payroll