
Fast charge implications: Pack and cell analysis and ...
28
The INL is a U.S. Department of Energy National Laboratory operated by Battelle Energy Alliance INL/JOU-17-43278-Revision-0 Fast charge implications: Pack and cell analysis and comparison Tanvir R Tanim, Matthew G Shirk, Randy L Bewley, Eric J Dufek February 2018
Transcript of Fast charge implications: Pack and cell analysis and ...

The INL is a U.S. Department of Energy National Laboratoryoperated by Battelle Energy Alliance
INL/JOU-17-43278-Revision-0
Fast charge implications:Pack and cell analysisand comparison
Tanvir R Tanim, Matthew G Shirk, RandyL Bewley, Eric J Dufek
February 2018
INL/JOU-17-43278-Revision-0
Fast charge implications: Pack and cell analysis andcomparison
Tanvir R Tanim, Matthew G Shirk, Randy L Bewley, Eric J Dufek
February 2018
Idaho National LaboratoryIdaho Falls, Idaho 83415
http://www.inl.gov
Prepared for theU.S. Department of Energy
Office of Energy Efficiency and Renewable EnergyUnder DOE Idaho Operations Office
Contract DE-AC07-05ID14517

1
Fast charge implications: Pack and cell analysis and comparison
Tanvir R. Tanim,* Matthew G. Shirk, Randy L. Bewley, Eric J. Dufek, and Bor Yann Liaw
Energy Storage and Advanced Vehicles Department
Idaho National Laboratory
2525 N. Fremont
Idaho Falls, ID 83415 USA
Abstract
This study investigates the effect of 50-kW (about 2C) direct current fast charging on a
full-size battery electric vehicle’s battery pack in comparison to a pack exclusively charged at
3.3 kW, which is the common alternating current Level 2 charging power level. Comparable
scaled charging protocols are also independently applied to individual cells at three different
temperatures, 20°C, 30°C, and 40°C, to perform a comparative analysis with the packs.
Dominant cell-level aging modes were identified through incremental capacity analysis and
compared with full packs to gain a clear understanding of additional key factors that affect pack
aging.
While the cell-level study showed a minor impact on performance due to direct current
fast charging, the packs showed a significantly higher rate of capacity fade under similar
charging protocols. This indicates that pack-level aging cannot be directly extrapolated from cell
evaluation. Delayed fast charging, completing shortly before discharge, was found to have less of
an impact on battery degradation than conventional alternating current Level 2 charging.
Keywords
Lithium ion battery, Electric drive vehicles, AC Level 2 charging, Direct current fast charging,
Battery state-of-health
*Journal of Power Sources 381 (2018) 56–65
*Corresponding author: [email protected]
2
Acronyms
AC alternating current
BMS battery management system
CHAdeMO CHArger de MOve
DCFC direct current fast charging
DOD depth-of-discharge
EDV electric drive vehicle
EVSE electric vehicle supply equipment
EOC end of charge
EOD end of discharge
HPPC hybrid pulse power characterization
IC incremental capacity
LLI loss of lithium inventory
LAM loss of active material
LMO lithium manganese oxide, LiMn2O4
LIB lithium ion battery
NE negative electrode
OEM original equipment manufacturer
PE positive electrode
RCV rest cell voltage
RPT reference performance test
RPV rest pack voltage
SOH state-of-health
SOC state-of-charge

3
1. Introduction
Production of electric drive vehicles (EDVs) has doubled every year since 2010 [1]. New
releases of EDVs almost exclusively rely on lithium ion battery (LIB) technology due to the high
power and energy density of this class of battery. Since 2010, the average price for the
automotive LIB pack for EDVs has fallen roughly by 80%, which is a key factor behind the
upward trend of EDV sales and driving range [2]. In concert with these factors, the increasing
availability of direct current fast charging (DCFC) stations is working as a catalyst, increasing
EDV adoption and utility. The increased range and easy access to DCFC stations are
encouraging consumers to drive further without the fear of being stranded. For instance, a 25%
increase in annual electric vehicles miles is recorded in areas where drivers have access to 50 to
120-kW fast charging stations [3, 4]. Continued expansion of the DCFC network could
significantly increase the utility of battery electric vehicles and alleviate consumers’ “range
anxiety,” which often discourages consumers from buying battery electric vehicles [5].
Automotive original equipment manufacturers and electric vehicle supply equipment
(EVSE) companies are constantly expanding their fast charging networks. As of August 2017,
6,372 Tesla Superchargers [6]; 2,215 CHAdeMo chargers [7]; and 1,500 combined charging
system fast chargers [8] have been installed in the United States. Despite this progress in adding
more charging stations, EDV charging speed is not yet comparable to the fueling speed of
conventional gasoline engines, which is typically under 10 minutes [9]. Currently, the Tesla 120
kW Supercharger recharges 80% of battery capacity in 40 minutes [10], Nissan Leaf’s
CHAdeMo 50-kW DCFC recharges the battery pack from nearly empty to 80% in less than 30
minutes [11], and the Chevrolet Bolt battery pack takes an hour to recharge up to 80% with a 50
-kW combined charging system charger [12]. Higher-power charging stations up to 400 kW and
compatible vehicles are necessary to make the battery electric vehicle’s recharge time
comparable to the refueling time of gasoline engines [9]. Additional challenges will be
encountered in realizing this extreme charging speed, from battery cells to vehicle systems and
from charging infrastructure hardware to charging network economic feasibility. The U.S.
Department of Energy recently performed a technology and economic gap assessment to identify
challenges in realizing extreme fast charging up to 400 kW [9, 13-15]; some automotive OEMs
and EVSE companies have already started working on solving these challenges [16-18].
While ongoing efforts to increase charging speed and expand the network of charging
stations are reassuring for consumers, the increased charging rate associated with fast charging
could adversely affect battery performance and life. Thus, it is paramount to understand the
effects of fast charging on an LIB’s performance and life (i.e. state of health [SOH]), from the
pack to cell level and to identify the most critical factors affecting battery SOH. Knowledge
about the extent of the effects of fast charge on battery SOH would aid battery developers,
OEMs, and EVSE developers in judicious design and management of the LIB pack to achieve
the anticipated life and desired performance in a cost-effective way.

4
Lithium plating in the negative electrode has been reported as one primary concern about
fast charging LIBs [19-24], especially at low temperatures. Plating at the negative electrode
becomes thermodynamically favorable when the over potential (i.e., the difference between solid
phase and liquid phase potential) reaches or crosses zero. This usually occurs at or near the
interface of the electrode and separator where surface over potential is the largest [24-26].
Graphite, a widely used negative electrode material, is particularly susceptible to lithium plating,
due to the proximity of its reversible potential to that of lithium. While the plated lithium is
partially reversible, a significant portion of the plated lithium is irreversible [26], which could
cause accelerated performance decay (e.g., increased capacity fade and impedance rise). Part of
the irreversible or residual lithium could also become isolated, potentially changing the abuse
response of the battery. The plated lithium may grow dendritically, developing internal short
circuits and leading to major reliability concerns and, in the worst case scenario, catastrophic
safety consequences.
The magnitude of the performance and life decay due to fast charging depends on many
interrelated battery design parameters from the materials and electrode level to the cell and pack
level, as well as the charging protocol and operating temperature. From the materials point-of-
view, the selection of anode material, anode particle size, particle shape, and electrolyte play a
vital role in minimizing the effects of fast charging [20, 25, 27]. From the electrode point-of-
view, thickness, porosity, and tortuosity are critical design parameters [22, 25, 28] for avoiding
accelerated fade during fast charge. Similarly, both loading ratio (i.e., the capacity ratio between
the negative and positive electrode) and precise control of the irreversible capacity loss during
the formation period, which introduces an offset regarding the operating voltage between the two
electrodes, play a significant role in avoiding accelerated performance fade during fast charge
[25, 29-30]. Current profile, upper voltage limit, and temperature during fast charge are other key
operating parameters that could adversely affect battery life during fast charge [19, 21, 25, 30-
33].
This study investigated the effect of DCFC on SOH of a full-size battery electric vehicle
pack over their lifetimes when compared to an identical baseline pack exclusively charged at
alternating current (AC) Level 2 power levels. Charging current up to an approximate 2C rate
(scaled for a 50-kW fast charge of 24 kWh/66.2 Ah Nissan Leaf battery packs) was used in this
study. The aging trend with both DCFC and AC Level 2 charging protocols was analyzed and
compared. In an effort to isolate degradation due to fast charge (i.e., rate) from the temperature
effect, cell-level tests were performed with thermally conductive fixtures under the same
charging protocols. The dominant aging modes in the individual cells were identified and
compared with the full packs. The relative benefit of delayed DCFC charging as opposed to no
delay was also investigated in order to isolate the effect of resting state-of-charge (SOC) from
charging rate. Overall, this comprehensive experimental study quantified pack level degradation
due to DCFC in an extreme operating scenario with passive thermal management, identified key
factors affecting battery SOH under these conditions, and, finally, demonstrated the extent to

5
which degradation could be reduced by carefully controlling key factors using cell level tests as
reference control groups.
2. Experimental
2.1 Pack Testing
Two Nissan Leaf battery packs from new 2012 model year vehicles were acquired
to perform the pack-level tests. Each pack was rated at 24 kWh and 66.2 Ah. Each battery
pack consisted of 192 graphite/lithium manganese oxide-based prismatic cells that are
packaged in 48 modules, each with two parallel cells connected in series configuration.
These 2012 Leafs were equipped with 3.3-kW onboard charging modules, which charged
the pack when connected to 120 or 240 VAC through AC Level 2 EVSE. 3.3 kW was
determined to be the power that the production Leaf charged at when using a level 2
charger, through lab and field testing of that car [34, 36]. These vehicles were also
equipped with an optional 50 kW CHAdeMO DCFC charger port. These sealed packs
dissipate heat passively; therefore, there was no active thermal management of the pack.
Both packs were placed in a walk-in environmental chamber (Cincinnati Sub-
Zero-WM-1054-MP4H-27-27-S/WC) at 30°C during the 13 months of testing (Fig. 1(a)).
Average pack internal temperature from four sensors distributed across the pack (i.e., two
mounted in the left and right module stacks and two others located at the rear module
stack; see Figs. 1(c)-(d)) was obtained through the controller area network bus
communication of the battery management system (BMS). Two Bitrode FTF high power
and voltage pack testers (FTF1-500/50-1000) were used for characterization and test
cycling.
The packs were cycled with a 7,088-second power-based drive cycle, which
simulates an on road Nissan Leaf drive cycle [34]. The drive cycle discharges 14.3 kWh
(i.e., 60% of the rated energy). The packs were allowed to rest for 60 seconds after each
discharge and then were recharged with the specific charging protocol. One pack
exclusively followed the AC Level 2 charging protocol and the other one followed the
DCFC charging protocol during the entire testing period. Both charging protocols
followed the constant current-constant voltage charging scheme. The applied currents
during the AC Level 2 and DCFC constant current charging step were 8.5 A and 120 A,
respectively, up to approximately 395 V, which is the nominal upper cutoff voltage. The
OEM BMS dictated the maximum charging power to the tester during cycling charges.
The constant voltage step held the voltage at approximately 395 V until the current
tapered to 0.3 A or lower for up to 1 hour. Two cycles were repeated per day by
maintaining equal rest time between cycles after every charge. Thus, at a minimum, the
AC Level 2 and DCFC packs spent approximately 11 and 18.2 hours per day at rest at

6
their fully charged states, respectively. The BMS was active during cycling, and had
plenty of time to balance the pack at the end of each charge.
Cycling was interrupted every month and reference performance tests (RPTs)
were performed to characterize the battery packs’ SOH. The BMS remained inactive
during the RPT tests to prevent balancing during hybrid pulse power characterization
(HPPC) as well as to limit balancing during charging to obtain a better gauge of true pack
limitations, which could be masked if cells were allowed to balance and thus minimize
the impact of weaker cell(s). We checked the pack for imbalance prior to these tests using
the Nissan Consult 3+ diagnostic tool, particularly near the end of charging. Our voltage
window prevented any cells from excursions outside of their specified voltage window.
Some cells were a few millivolts higher than others at the fully charged state. The
maximum cell voltages were about 20-30 mV higher than the minimum cell (a
characteristic or limitation of the BMS), but none exceeded or came very close to the cell
upper voltage limit of 4.2V. This maximum voltage spread also remained the same upon
recharging after completion of RPT tests, which indicates consistent pack balancing
before and after RPT throughout the testing. RPT tests include a C/3 static capacity test, a
C/25 differential capacity test with 1-hour rest between the discharge and charge steps,
and a low-current HPPC test adapted for electric vehicle applications; all tests were
performed at 30°C with a voltage window between 395 V to 285 V according to USABC
EV test manual [35]. The HPPC test was performed with 1C (66.2 A) -30s discharge and
0.75C (49.65 A)-10 s regen pulses at every 10% DOD increment (6.62 Ah) from the fully
charged (395 V) state. A C/3 (22.07 A) discharge rate was used to move the DOD set
points. The pulse discharge resistance is calculated for completely unabated pulse using
|∆V/∆I| formula, where ∆V is the voltage difference immediately before the pulse at
equilibrium and at the end of pulse and ∆I is the corresponding current change. Pulses in
these time scale (10-30 s) induce ohmic, kinetic, diffusion polarization to the lithium ion
battery. For more detail, please see reference [35].

7
Fig. 1. Test setup: (a) pack, (b) cell, (c) thermocouple location at the rear module
stacks, and (d) thermocouple location at one of the side module stacks
2.2 Cell Testing
Cell-level tests were performed with cells (33.1 Ah) extracted from another new
Nissan Leaf battery pack at three different temperatures (i.e., 20°C, 30°C, and 40°C).
Analogous to the pack discharge profile, a scaled dynamic stress test profile was designed
to discharge 74.35 Wh (i.e., 60% of the rated energy, same as the pack) during cycling
[35]. The AC Level 2 cell groups were exclusively charged with the scaled AC Level 2
charging protocol, and the DCFC groups were solely charged with the scaled DCFC
charging protocol. A similar constant current constant voltage charging scheme was
applied with the same scaled upper maximum voltage (i.e., 4.11V/cell, same as the
packs). The lower voltage limit was set to 2.5V. To expedite cell-level testing, three
cycles spaced by equal rest time after every charge was performed per day instead of two
cycles per day with the packs. Doing this slightly decreased the rest time of the cells after
every charge compared to the packs (i.e., 8 hours/day more for the AC Level 2 pack and
4.4 hours/day more for the DCFC pack). This testing regime induced slightly higher
calendar aging in the packs for a given number of cycles. Figure 1(b) shows a sub-group
of cells placed inside a thermal chamber for testing. Temperature rise during fast
charging was minimized by sandwiching individual cells between two 6.35-mm
aluminum plates. Maccor 4000 series testers were used to cycle and characterize the
cells.

8
To isolate and investigate the effects of longer rest at the higher voltage for the
fast-charged cells, a sub-group of cells were aged with a delayed DCFC charging
protocol at 30°C, where the cells were not immediately recharged following every
discharge cycle. Instead, the cells were allowed to rest in the discharged state (or lower
voltage) and charged back just before starting the next discharge cycle. Similar to the
packs, cell level HPPC test was performed with 1C (33.1 A) -30s discharge and 0.75C
(24.82 A)-10 s charge pulses at every 10% DOD increment (3.31 Ah) with C/3 (11.03 A)
discharge rate between DOD set points [35].
3. Results and Discussion
3.1 Beginning of Life Characterization Tests
The design of the experiments is listed in Table 1, which includes a comparative
study between AC Level 2 and DCFC cells aged at three different temperatures (i.e.,
20°C, 30°C, and 40°C) as opposed to the single aging temperature condition (30°C) for
the packs. Pack and cell capacities were measured by performing the standard C/3 static
capacity test [35] at the beginning of life. The packs’ nominal capacities are listed in
Table 1. The pack capacities were slightly lower than their rated values due to performing
the static capacity test within a narrowed 395 to 285-V range as opposed to the rated
403.2 to 240 V. Voltage limits were tightened on the pack to allow testing and cycling to
continue despite cell capacity imbalance (or, cell-to-cell capacity variability) within the
pack through the aging process. For both the packs and cells, the charging protocol before
performing the RPT included a constant current-constant voltage charging scheme with a
C/3 constant current step based on the rated capacity and a constant voltage step where
the voltage was held at Vmax (395 V for packs and 4.11 V for cells) until the current
tapered to 0.3 A and 1.65 A, respectively, for up to 1 hour. Nominal capacities for
individual cell groups are listed in Table 1, which shows low cell-to-cell capacity
imbalance.
Figure 2 overlays the three testing profiles and their respective temperatures for
the cells for a typical cycle. These test profiles were repeated continuously, except for
monthly interruptions for RPT tests. The AC Level 2 protocol took a relatively long time
to charge the cells. The DCFC protocol immediately began to recharge the cells
following every discharge and rested at the fully charged state for a significant amount of
time. The cell temperatures remained nearly constant during AC Level 2 charging, but
increased by 3⁰C during the DCFC charging period as shown in Fig. 2. This slight
increase in temperature is visible in Fig. 2(a) at 150 min during DCFC and 420 min
during delayed DCFC. However, the packs experienced a much higher temperature rise
and slower thermal equilibration during and after fast charging. Following every charge
at beginning of life, the peak temperatures of AC Level 2 and DCFC packs climbed up to

9
34 and 41°C, respectively, which further increased to 36 and 45°C at the end of testing
(figure not included for brevity).
Fig. 2. Representative cycling profiles with different charging protocols and temperature
evolution: (a) temperature and (b) current profile

10
3.2 Pack
Figure 3 shows the evolution of the packs’ capacity fade for 13 RPTs (i.e., 13
months of cycling) and for the cells’ capacity fade for 10 RPTs (i.e., 10 months of
cycling) with respect to their initial capacities as a function of energy throughput. Each
symbol in Fig. 3 indicates an RPT starting from RPT 0. The energy throughput is based
on discharge energy only, which was tracked for every RPT set. For this comparison, the
energy throughput of the pack was scaled down to the cell level (i.e., the pack level
throughput is equal to 192 times the x-axis value in Fig. 3). Overall, both packs
experienced significant capacity fade. For instance, the AC Level 2 pack degraded 20%
after 11 months of cycling after completing 660 cycles, which is an equivalent of 41,000
miles of driving under the accelerated cycling protocol. On the other hand, the DCFC
pack reached 20% fade after only 9 months of cycling (540 cycles), which is equivalent
to 33,500 miles of driving. An average energy consumption value of 230 Wh mi-1
(obtained from Idaho National Laboratory’s Advanced Vehicle Testing Activity study of
Nissan Leaf vehicles) was used to convert the total energy throughput to the equivalent
number miles [34, 36]. Cycling of the packs continued up to RPT 13 (58 kWh), which is
equivalent to about 50,000 miles of driving and 780 cycles. The AC Level 2 pack
capacity faded 23.1% and the DCFC pack capacity faded 28.1% at the end of testing.
Figure 3 also shows that the rate of capacity fade of both packs increased in the later part
of cycling (after RPT 9 or approximately 40 kWh or 33,500 miles), with the DCFC pack
showing the lower performance of the two.
Fig. 3. Comparison of capacity fades between packs and cells.

11
The higher rate of capacity fade in both packs when compared to the cells can, in
part, be attributed to higher pack temperature. Figure 4(a) shows average temperature
distribution for AC Level 2 and DCFC packs during the entire cycling period. The
temperatures reported are the average of four thermocouples mounted on module stacks
(Figs. 1(c)-1(d)). The y-axis shows the fraction of total test time a pack spent at or below
a specific temperature, which is shown on the x-axis. The AC Level 2 pack spent a
substantial amount of time above the ambient test temperature (i.e., 30°C). For example,
it was above 33°C for 75% of the test duration, including 5% of time spent at or above
35°C. The temperature distribution of the DCFC pack was much wider than that of the
AC Level 2 pack and extended up to 45°C, which likely contributed to the additional
capacity fade observed in the DCFC pack. As noted above, the temperature in Fig. 4(a)
represents module surface temperatures; therefore, they are certainly lower than localized
peak temperatures actually experienced by cells during the different pack testing regimes.
In actuality, the four cells within each module will have higher temperatures and a non-
uniform temperature distribution [15]. Furthermore, the modules will also have different
temperatures due to passive thermal management depending on their locations in the
pack. Some of the modules, particularly the ones placed between other modules, will be
hotter than those placed near the edges of the pack due to a lower area for heat transfer.
The temperature non-uniformity will likely be wider in the DCFC pack than the AC
Level 2 pack due to the nature of joule heating. Besides higher overall temperature, this
temperature non-uniformity within the cell and pack will create non-uniform aging [36-
38] and also factor into the accelerated capacity reduction.
The data presented in Fig. 3 are insufficient to deconvolute the combined impacts
of high rate charging for DCFC and temperature. Adding to assessment difficulty is the
possibility of non-uniform aging and increased cell imbalance within the pack resulting
from a non-uniform temperature distribution. Thus, cell level tests were necessary to
better resolve the impacts of different aging factors.
Fig. 4. Cumulative temperature distribution throughout testing: (a) pack and (b) cell.

12
3.3 Cell
Cell-level tests were specifically designed to verify the comparability of aging
between the pack and cells, determine the dominant cell aging modes and how they
correlate with the packs, and de-convolute any degradation exclusively associated with
fast charging. The delayed DCFC protocol was added to the cell testing matrix to explore
the benefits of delayed charging and to observe the extent of calendar aging.
The average capacity fades of different cell groups have also been plotted as a
function of cumulative cell discharge energy throughput in Fig. 3. Cells tested under
similar ambient conditions show a significant reduction in the capacity fade when
compared with the packs. Cells cycled at 30°C experienced 57% and 61% reduction in
capacity fade with AC Level 2 and DCFC protocols, respectively, over the corresponding
packs at the end of cell testing and completed 960 cycles. Interestingly, both of the packs’
capacity fade exceeded the 40°C cell capacity fade. Furthermore, the difference in
capacity fade between AC Level 2 and DCFC treatments nearly disappeared at the cell
level. The maximum cell-level difference in capacity fade between AC Level 2 and
DCFC charging protocols was less than 1% and consistent with the three temperatures
investigated in this study. This 1% difference in capacity fade can be associated with the
slightly higher temperature of the DCFC cells during charging (Figs. 2 and 4(b)).
Fixturing of the cells with conductive plates was very effective in minimizing
temperature rise during AC Level 2 charging (Fig. 4(b)). However, the DCFC cells
experienced a slight increase in temperature up to 3°C during high-rate charging, but did
not spend more than 10% of the test time above the ambient set temperatures.
It is also evident that delaying charging just before the next drive cycle was
effective in extending battery life. The DCFC cells were at rest for 58% (i.e., 13.8 hours)
of their daily test time at their fully charged states, whereas delayed DCFC cells spent the
same amount of time at a lower voltage (i.e., about 60% depth of discharge [DOD]) after
every discharge. Resting the DCFC cells at the higher voltage induced 11% total capacity
fade at the end of cell testing (i.e., RPT 10 or 71.3kWh), whereas the delayed DCFC
brought that fade down to 9.8%. Thus, the delayed DCFC protocol was able to preserve
1.2% of the battery life compared to having no delay, which can reasonably be
extrapolated to 2 to 3% less capacity fade at the end of battery life. This reduction in
capacity fade with delayed DCFC was primarily due to decreased calendar aging
associated with the lower voltage rest after every discharge cycle due to a reduced rate of
solid electrolyte interphase side reactions [40]. Interestingly, the delayed DCFC charging
protocol was also found to be better in extending battery life (up to 1% for the 30°C cell
test group) than the AC Level 2 charging protocol. This small difference between DCFC
and AC Level 2 is due more to SOC (i.e., an artifact of testing) than the induced thermal
effects of high rate.
13
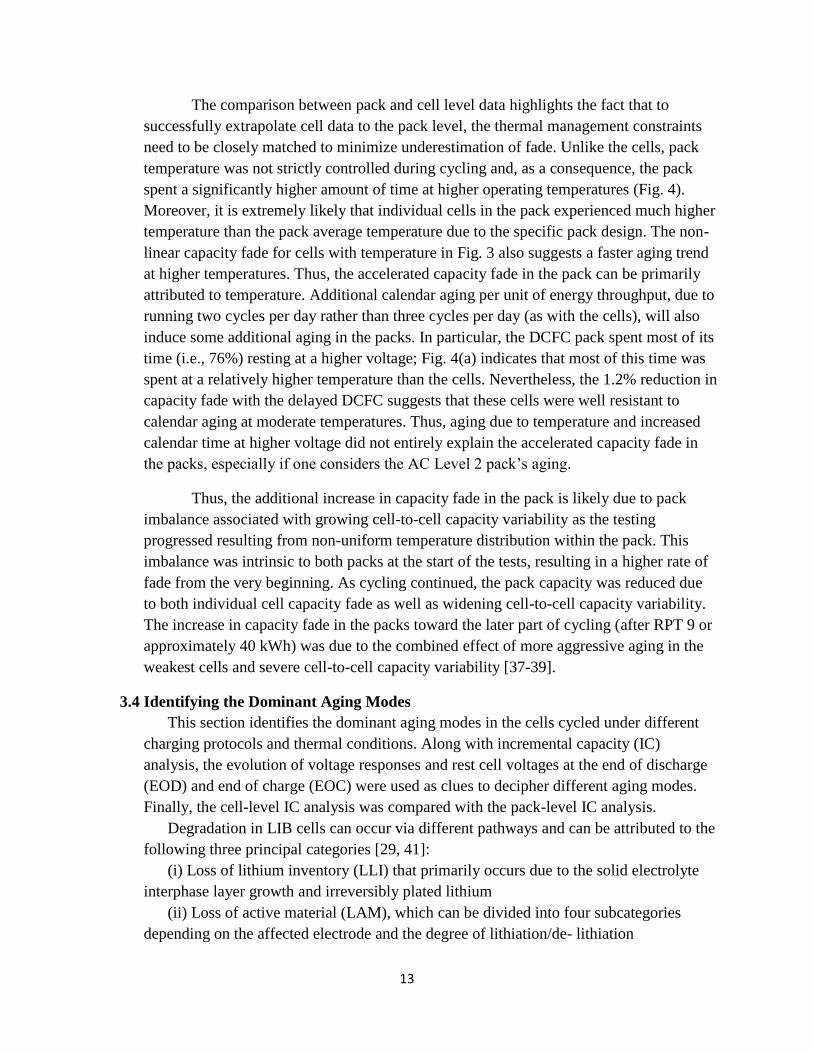
The comparison between pack and cell level data highlights the fact that to
successfully extrapolate cell data to the pack level, the thermal management constraints
need to be closely matched to minimize underestimation of fade. Unlike the cells, pack
temperature was not strictly controlled during cycling and, as a consequence, the pack
spent a significantly higher amount of time at higher operating temperatures (Fig. 4).
Moreover, it is extremely likely that individual cells in the pack experienced much higher
temperature than the pack average temperature due to the specific pack design. The non-
linear capacity fade for cells with temperature in Fig. 3 also suggests a faster aging trend
at higher temperatures. Thus, the accelerated capacity fade in the pack can be primarily
attributed to temperature. Additional calendar aging per unit of energy throughput, due to
running two cycles per day rather than three cycles per day (as with the cells), will also
induce some additional aging in the packs. In particular, the DCFC pack spent most of its
time (i.e., 76%) resting at a higher voltage; Fig. 4(a) indicates that most of this time was
spent at a relatively higher temperature than the cells. Nevertheless, the 1.2% reduction in
capacity fade with the delayed DCFC suggests that these cells were well resistant to
calendar aging at moderate temperatures. Thus, aging due to temperature and increased
calendar time at higher voltage did not entirely explain the accelerated capacity fade in
the packs, especially if one considers the AC Level 2 pack’s aging.
Thus, the additional increase in capacity fade in the pack is likely due to pack
imbalance associated with growing cell-to-cell capacity variability as the testing
progressed resulting from non-uniform temperature distribution within the pack. This
imbalance was intrinsic to both packs at the start of the tests, resulting in a higher rate of
fade from the very beginning. As cycling continued, the pack capacity was reduced due
to both individual cell capacity fade as well as widening cell-to-cell capacity variability.
The increase in capacity fade in the packs toward the later part of cycling (after RPT 9 or
approximately 40 kWh) was due to the combined effect of more aggressive aging in the
weakest cells and severe cell-to-cell capacity variability [37-39].
3.4 Identifying the Dominant Aging Modes
This section identifies the dominant aging modes in the cells cycled under different
charging protocols and thermal conditions. Along with incremental capacity (IC)
analysis, the evolution of voltage responses and rest cell voltages at the end of discharge
(EOD) and end of charge (EOC) were used as clues to decipher different aging modes.
Finally, the cell-level IC analysis was compared with the pack-level IC analysis.
Degradation in LIB cells can occur via different pathways and can be attributed to the
following three principal categories [29, 41]:
(i) Loss of lithium inventory (LLI) that primarily occurs due to the solid electrolyte
interphase layer growth and irreversibly plated lithium
(ii) Loss of active material (LAM), which can be divided into four subcategories
depending on the affected electrode and the degree of lithiation/de- lithiation

14
(iii) Changes in reaction kinetics and ohmic resistance, which collectively manifest as
an increase in polarization resistance.
For more detail, interested readers are encouraged to read Ref. [29, 41] and the
references therein. In Ref. [29], Dubarry et al. outlined a detailed mechanistic approach to
quantify different degradation modes using IC and differential voltage analysis. Their
inference-based mechanistic approach was later implemented in a Matlab-based
simulation toolbox named “Alawa” [42]. Experimental IC/ differential voltage signatures
can be compared with Alawa's emulated signatures to identify or separate different aging
types for different LIB chemistries. Some experimental validation based on Alawa
simulations can be found in Ref. [43-45].
For this analysis, generic graphite and lithium manganese oxide half-cell data
provided in Alawa were used for a qualitative understanding of the aging process from
the evolution of IC plots. As a result, an exact voltage and IC signature (not included for
brevity) match between Alawa and these experiments could not be obtained. Despite this
fact, the trends obtained from the Alawa simulations were qualitatively similar to the test
results. Low rate differential capacity data were used for the IC analysis, which ensured
minimal polarization effects in the IC analysis.
At first, the charge-discharge voltage response at low rate was carefully analyzed to
derive clues that could be attributed to a specific type of aging. Figure 5(a) shows the
voltage versus capacity plots of representative cells from the 30°C cell groups exclusively
charged with AC Level 2 and DCFC. A similar trend in charge-discharge voltage
responses was observed for the other cells, but the rate of capacity fade was different for
different temperatures and was not included in this paper for conciseness. Figure 5(b)
plots the average rest cell voltage (RCV) at the EOC and EOD for the respective groups.
The RCVs were recorded after allowing the cells to rest for an hour following the slow
charge or discharge steps.
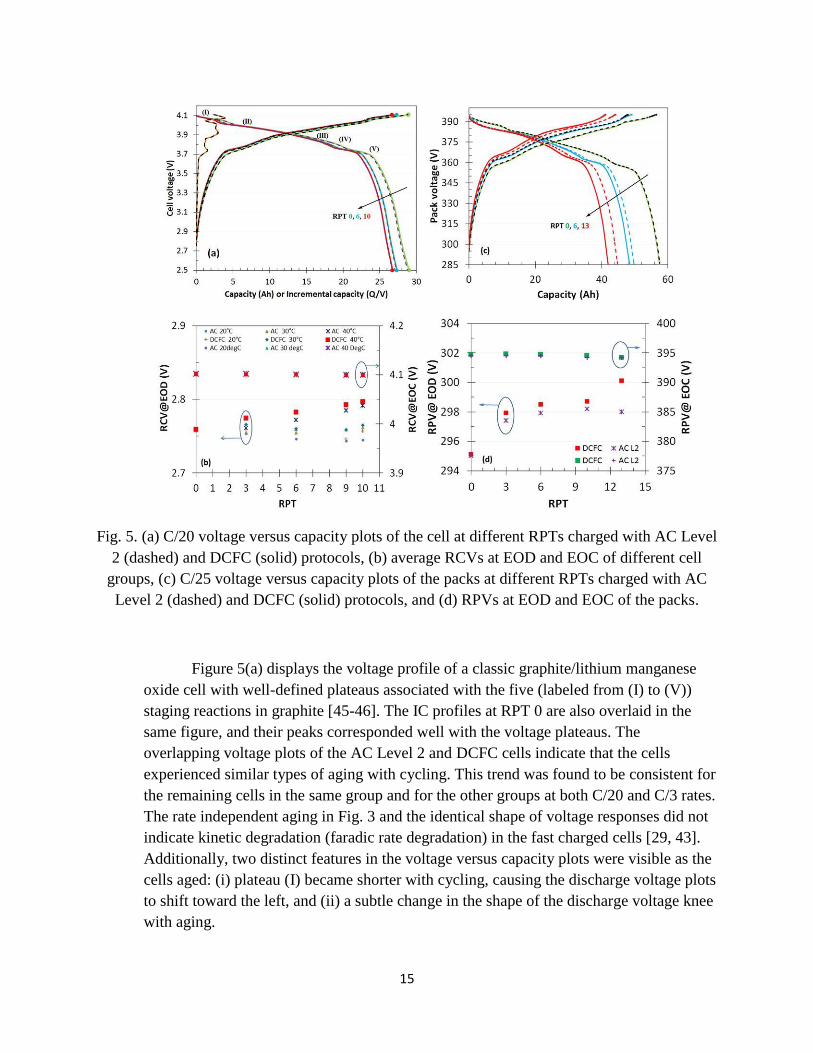
15
Fig. 5. (a) C/20 voltage versus capacity plots of the cell at different RPTs charged with AC Level
2 (dashed) and DCFC (solid) protocols, (b) average RCVs at EOD and EOC of different cell
groups, (c) C/25 voltage versus capacity plots of the packs at different RPTs charged with AC
Level 2 (dashed) and DCFC (solid) protocols, and (d) RPVs at EOD and EOC of the packs.
Figure 5(a) displays the voltage profile of a classic graphite/lithium manganese
oxide cell with well-defined plateaus associated with the five (labeled from (I) to (V))
staging reactions in graphite [45-46]. The IC profiles at RPT 0 are also overlaid in the
same figure, and their peaks corresponded well with the voltage plateaus. The
overlapping voltage plots of the AC Level 2 and DCFC cells indicate that the cells
experienced similar types of aging with cycling. This trend was found to be consistent for
the remaining cells in the same group and for the other groups at both C/20 and C/3 rates.
The rate independent aging in Fig. 3 and the identical shape of voltage responses did not
indicate kinetic degradation (faradic rate degradation) in the fast charged cells [29, 43].
Additionally, two distinct features in the voltage versus capacity plots were visible as the
cells aged: (i) plateau (I) became shorter with cycling, causing the discharge voltage plots
to shift toward the left, and (ii) a subtle change in the shape of the discharge voltage knee
with aging.

16
LIBs typically develop a positive offset during formation of the solid electrolyte
interphase layer at the beginning of life. The formation process could consume up to 10
to 15% of the initial reversible capacity, primarily in the form of LLI [43]. Because of
this offset, the cell capacity becomes limited by the negative electrode at EOD. At EOC,
the positive electrode limits the capacity, leaving a fraction of the negative electrode
unused [41]. The offset also creates unbalanced SOC translation in the two electrodes.
Thus, the gradual decrease in cell voltage toward EOD (Fig. 5(a)) is indicative of the
graphite electrode’s gradual voltage climb, which is evidence the graphite electrode limits
the discharge capacity. LAM, on the other hand, would lead to a change in the cell
loading ratio (LR=QNE/QPE) due to reduced capacity, where Q is the capacity of each
individual electrode [29].
As discussed earlier, LAM can be divided into four subcategories depending on the
affected electrode and the extent of lithiation or de-lithiation: LAMliPE, LAMdePE,
LAMliNE, and LAMdeNE [29]. Here, ‘li’ and ‘de’ stand for lithiated and de-lithiated states,
respectively, and ‘PE’ and ‘NE’ indicate positive and negative electrodes, respectively.
When LAM occurs in the PE in the charging regime (LAMliPE), NE is less fully lithiated
due to less charge being released from the PE (i.e., PE lithium storage capability
reduces). As a result, RCV (or cell SOC) at EOC will gradually decrease with cycling.
During testing, RCV at EOC remained constant throughout cycling for all cell groups
(Fig. 5(b)), indicating no probability of LAMliPE. In the discharging regime, an electrode
affected by LAMdePE will complete its electrochemical reactions at a relatively higher
voltage (i.e., higher cell SOC), which will manifest as a higher RCV at EOD similar to
Fig. 5(b). However, Fig. 5(a) shows that the shape of the voltage knees at EOD did not
change, indicating that NE still limited the discharge capacity of the cell throughout
testing. This observation eliminates LAMdePE as a possible aging mode.
Besides reducing the storage capacity of the electrodes, LAM in NE could lead to
some additional safety concerns. In particular, LAMdeNE could create conditions that are
favorable to lithium plating. These conditions occur toward EOC when NE becomes fully
lithiated before the PE completely releases all of its reserve lithium. As a result, RCV at
EOC increases with cycling. However, Figure 5(b) does not show any increase in EOC
voltage throughout testing, implying no LAMdeNE-type aging. The discharge curves
reported in Fig. 5(a) did not show any new high voltage plateau or change in appearance
at the beginning of discharge, which is indicative of a new active phase associated with
metallic lithium deposits as reported in [26]. This is additional evidence that lithium
plating did not occur at any point throughput testing. In part, this may be due to the
higher operating temperature and lowered upper charging voltage (from 4.2 to 4.11 V),
which avoided conditions favorable for lithium plating.
With LAMliPE, LAMdePE, and LAMdeNE eliminated as possible aging modes, the
increased RCV at EOD (Fig. 5(b)) can only be associated with LAMliNE and LLI. The

17
shortening of plateau (I) illustrated in Fig. 5(a) primarily can be attributed to LLI due to
the slippage of the NE voltage with respect to PE [29]. LAMLiNE would lead to a
reduction in the cell loading ratio. The reduced cell loading ratio would make the
discharge curve appear shorter and/or sharper, especially beyond plateau (V) (Fig. 5(a)).
Thus, after careful examination of the voltage and RCVs, the dominant aging modes
present can be narrowed down to LLI and LAMLiNE. The DCFC protocol does not appear
to contribute significantly to capacity loss (i.e., no significant kinetic (faradic)
degradation was observed [29, 43]). In addition, lithium plating was not detected using
electrochemical means during any point of testing.
The above analysis was repeated for the two packs exclusively charged with AC
Level 2 and DCFC protocols. The evolution of voltage responses and RPV at EOD and
EOC are plotted in Figs. 5(c) and (d). The packs showed a comparable trend to the cells,
which suggests a similar aging pattern but at different rates. Similar to the cell, the pack
voltage responses did not show any evidence of significant rate-based kinetic
degradation. Shortening of plateau (I) dominated pack aging and resembled the cell aging
pattern but at a much higher rate. In contrast to the cells, plateau (I) of both packs
completely vanished after RPT 6. This effect was seen because the pack experienced
much more capacity fade than the cells (twice the amount at RPT 6), which completely
exhausted plateau (I), primarily by LLI. Analogous to the cells, RPV at EOC remained
unchanged throughout cycling, whereas RPV at EOD showed a clear increase, with the
DCFC pack increasing more (i.e., about 2 V at RPT 13) than the AC Level 2 pack. The
discharge curves did not show any new high-voltage plateau, which is a signature of
lithium plating as discussed before. Next, IC analysis was used to verify the conclusions.

18
Figures 6(a)-(d) present the IC plots of representative cells and packs exclusively
charged with AC Level 2 and DCFC protocols at 30°C throughout testing. A Savitzky-
Golay filter [48] was used to filter out noise from both the cell and pack data. In addition
to filtering, a six-point moving average was used to obtain a clear pattern of the pack IC
curves without any loss of generality.
Fig. 6. Experimental IC (dQ/dV) curves at 30°C: (a) AC Level 2 cell, (b) DCFC
cell, (c) AC Level 2 pack, and (d) DCFC pack
IC analysis with packs is not as straightforward as with cells. For a single cell, the
cell voltage response (and IC signature) varies with the electrodes’ loading ratio and
offset. Loading ratio and offset both change with battery age through different aging
pathways. Packs comprise hundreds of cells in complex series-parallel configurations and
every cell contributes to the overall pack voltage. For example, the Nissan Leaf pack
investigated in this study consists of 192 cells, packaged in 48 series connected modules,
each with two parallel cells connected in series. Pack voltage is affected by both the
evolving electrode imbalance within the cells and cell-to-cell capacity heterogeneity
within the pack. In an idealized scenario with uniform cells, a pack’s composite IC
signature should scale with the cells. In practice, even a new battery pack could have
sufficient cell-to-cell capacity variability to convolute direct IC analysis [37-39]. Non-

19
uniform aging can occur in a passive, thermally managed battery pack like the present
Nissan Leaf example or in any pack where cells are not individually and identically
managed exacerbates the situation, leading to a progressively worse imbalance as the
pack ages [37-39]. Consequently, a small group of weak cells in the pack could
significantly reduce the overall pack capacity by leaving most of the cells undercharged
and/or under discharged as a BMS can only balance a pack in terms of voltage (or SOC)
and not in terms of capacity. With this in mind, a cell-level IC analysis was performed
first and the results were compared to pack-level composite IC signatures to support
analysis of the fade modes present during AC Level 2 and DCFC.
For the cell-level analysis, the five dominant peaks are numbered from 1 to 5 in Fig.
6(a). The IC signatures of the AC Level 2 and DCFC cells at RPT 0 were
indistinguishable, as were the IC signatures of the AC Level 2 and DCFC packs.
However, the IC signatures of the cells, particularly the second peak, were slightly
different than those of the packs, which is likely due to inherent cell-to-cell capacity
variability within the pack.
In all cases, the intensity of peak 1 decreased with cycling, which primarily can be
attributed to LLI resulting from the shortening of plateau (I) (Fig. 5(a)). A slight shift of
the curves toward the right was noticeable, which indicated a minor increase in ohmic
polarization. An absence of peak broadening provided additional evidence that kinetic
degradation was not dominant throughout the cycling [29, 41]. The peak-to-peak distance
decreased slightly with cycling, a clear indication of the presence of LAMliNE, although
not as dominant as the LLI. Unlike LAM, LLI does not affect distance between the peaks
[49]. Reduced loading ratio with cycling also made peaks 2, 4, and 5 appear narrower
with increased intensity. These trends hold for the cells tested at 20°C and 40°C.
Figures 7(a) through 7(d) show the evolutions of simulated IC signatures exclusively
for LAMdeNE, LAMdePE, LAMLiNE, and LLI as obtained using the Alawa toolbox [42].
The amount of degradation for these individual modes is adjusted to match the
experimental 10.9% total capacity fade at RPT 10 for the 30°C cell groups. The
simulated IC curves for LAMdeNE and LAMdePE do not align with the experimental IC
curves shown in Figs. 6(a) and 6(b), supporting our previous conclusion that these two
types of aging were not happening and that dominating aging modes were LAMLiNE and
LLI. Of these two modes, the respective change associated with peaks 1, 2 and 5, which
are more sensitive to LLI than LAMLiNE, indicate that LLI is a more dominant aging
mode than LAMLiNE.
The pack IC curves (Figs. 6(c) and 6(d)) show similar aging pattern to the cells but at
much more aggressive rates due to higher overall capacity fade. Plateau (I) disappeared
completely after RPT 6, which was reflected as a diminished area under Peak 1 in the IC
curves primarily due to LLI. Unlike in the cells, Peak 3 completely disappeared with pack
cycling. Unlike with the cells, where the IC plots were more tightly packed, the pack IC
signatures showed higher drift. More drift in the IC signatures is an indication of wider

20
cell-to-cell imbalance within the pack, which effectively contributed to the more
aggressive pack capacity reduction.
Fig. 7. Simulated IC curves at C/20: (a) 3.3% LAMdeNE, (b) 2.3% LAMdePE,
(c) 0.9% LAMliNE, and (d) 1.0% LLI per RPT to achieve 10.9% capacity fade of the AC
Level 2 cell group at RPT 10
Figure 8 shows the evolution of HPPC discharge resistance of cells and packs
derived from the HPPC test data across the DOD window. Resistances at higher DODs
fall in the nonlinear voltage knee on the cell discharge curve, thus a slight increase in
DOD associated with slightly higher capacity fade translates into a significant increase in
resistance toward higher DODs. Figure 8(a) shows that cells did not experience any
significant increase in resistance up to RPT 10, indicating that the NE (graphite) electrode
was in good condition and providing additional evidence that LAMLiNE was not the
dominant aging mode [43]. The DCFC cells experienced an insignificant increase in
resistance over the AC Level 2 cells, supporting the previous claim that DCFC cells
experienced similar types of degradation as the AC Level 2 cells. The packs’ resistance
showed comparable trends, but with a higher overall resistance increase due to higher
overall capacity fade. The difference in resistance, clearly visible after 50% DOD in Fig.
8(b), gradually increased with RPT again due to difference in capacity fade and overall

21
pack imbalance. The higher resistance in the DCFC pack led to more heat generation due
to more Joule heating, causing more capacity fade and exacerbating pack imbalance as
the cycling progressed. This cascading effect ultimately caused the gradual divergence in
capacity fade between the AC Level 2 and DCFC packs toward the later part of cycling
(after RPT 9 or approximately 40 kWh; Fig. 3).
Fig. 8. HPPC discharge resistance at different DODs at 30°C: (a) cell average and (b) pack.
Unfilled markers represent the AC Level 2 protocol and filled markers depict the DCFC
protocol.
4. Conclusion
It can be concluded that strict temperature control can largely minimize the
detrimental effect of fast charging up to 2C for appropriately developed cells such as the
Nissan Leaf cells studied here. Loss of lithium inventory and loss of active material in the
negative electrode were found to be the primary aging modes in the cells tested with AC
Level 2 and DCFC charging protocols using IC analysis. Kinetic degradation did not
appear to contribute significantly to capacity loss up to 2C charging. Lithium plating was
not detected using electrochemical means during any point of the testing for the three
temperatures investigated (i.e., 20°C, 30°C, and 40°C). A delayed fast charging protocol
to minimize rest at high SOC was found to be better than fast charging with no delay and
could extend battery life up to 2 to 3% at 30°C for the cells tested in this study. The
delayed fast charge was also found to be better than conventional AC Level 2 charging
without any delay because more time during the evaluation was spent at a lower cell
SOC.
Pack level testing with similar protocols showed comparable but significantly
higher aging. IC analysis with the composite pack voltage response was used to

22
qualitatively infer comparability and draw correlation between the pack’s and cells’ aging
modes. Additional contribution in pack aging came from elevated and non-uniform
temperature throughout the packs, which was exacerbated by passive thermal
management. Besides the primary aging types identified in the cell-level evaluation, pack
imbalance arising from heterogeneous aging associated with non-uniform temperature
within the packs likely affected the overall pack capacity. The result again underscored
the benefit of thermal management that will not only keep pack temperature below a
certain level but also maintain temperature uniformity within the cells and pack. The
ultimate system design requires understanding of aspects that extend beyond scaling the
performance at the cell level. This study clearly demonstrates that successful
extrapolation of cell performance to pack performance requires careful consideration of
the thermal management constraints to avoid underestimation of fade in the packs.
While the present study was limited to 50-kW DCFC, the results highlight the
needs and implications, which will arise as charging times are expected to continue to
decrease as identified in [9, 15].
Acknowledgment
Funding was provided from the Vehicle Technologies Office of the U.S.
Department of Energy’s Office of Energy Efficiency and Renewable Energy under the
guidance of the Advanced Battery Cell Research Program. This manuscript has been
authored by Battelle Energy Alliance, LLC under Contract No. DE-AC07-05ID14517
with the U.S. Department of Energy. The United States Government retains and the
publisher, by accepting the article for publication, acknowledges that the United States
Government retains a nonexclusive, paid-up, irrevocable, world-wide license to publish
or reproduce the published form of this manuscript, or allow others to do so, for United
States Government purposes.

23
References
[1] B. Nykvist, M. Nilsson, Rapidly falling costs of battery packs for electric vehicles, Nature
Clim. Change, 5 (4) (2015), 329-332.
[2] S. M. Knupfer, R. Hensley, P. Hertzke, P. Schaufuss, Electrifying insights: How automakers
can drive electrified vehicle sales and profitability, McKinsey & Company, Jan 2017.
[3] N. Lutsey, S. Searle, S. Chambliss, and A. Bandivadekar, Assessment of leading electric
vehicle promotion activities in United States cities, International Council on Clean
Transportation, July 2015.
[4] M. McCarthy, California ZEV policy update- SAE 2017 Government/Industry meeting,
Society of Automotive Engineers, Washington, DC. Jan 2017.
[5] Light Duty Electric Drive Vehicles Monthly Sales Updates, Argonne National Laboratory,
2017, https://www.anl.gov/energy-systems/project/light-duty-electric-drive-vehicles-
monthly-sales-updates (accessed 3.02.2017).
[6] https://www.tesla.com/supercharger (accessed August 2017).
[7] https://www.chademo.com/ (accessed August 2017).
[8] http://www.charinev.org/ccs-at-a-glance/infrastructure/ (accessed August 2017).
[9] S. Ahmed, I. Bloom, A. N. Jansen, T. Tanim, E. Dufek, A. Pesaran, A. Burnham, R. B.
Carlson, F. Dias, K. Hardy, M. Keyser, C. Kreuzer, A. Markel, A. Meintz, C. Michelbacher,
M. Mohanpurkar, P. A. Nelson, D. C. Robertson, D. Scoffield, M. Shirk, T. Stephens, R.
Vijayagopal, J. Zhang, Enabling fast charging – A battery technology gap assessment, J
Power Sources, 367 (2017) 250-262.
[10] https://www.tesla.com/charging (accessed June 2017).
[11] https://www.nissanusa.com/electric-cars/leaf/owner-questions/ev-charge-time (accessed:
June 2017).
[12] https://www.chevyevlife.com/bolt-ev-charging-guide#superFast, (accessed June 2017).
[13] A. Burnham, E. J. Dufek, T. Stephens, J. Francfort, C. Michelbacher, R. B. Carlson, J.
Zhang, R. Vijayagopal, F. Dias, M. Mohanpurkar, D. Scoffield, K. Hardy, M. Shirk, R.
Hovsapian, S. Ahmed, I. Bloom, A. N. Jansen, M. Keyser, C. Kreuzer, A. Markel, A. Meintz,
A. Pesaren, T. R. Tanim, Enabling Fast Charging - Infrastructure and Economic
Considerations, J Power Sources, 367 (2017) 237-249.
[14] A. Meintz, J. Zhang, R. Vijayagopal, C. Kreuzer, S. Ahmed, I. Bloom, A. Burnham, B.
Carlson, F. Dias, E. J. Dufek, J. Francfort, A. N. Jansen, M. Keyser, A. Markel, C.
Michelbacher, M. Mohanpurkar, A. Pesaran, D. Scoffield, M. Shirk, T. Stephens, T. Tanim,
Enabling Fast Charging – Vehicle Considerations, J Power Sources, 367 (2017) 216-227.
[15] M. Keyser, A. Pesaran, Q. Li, S. Santhanagopalan, K. Smith, E. Wood, S. Ahmed, I.
Bloom, E. Dufek, M. Shirk, A. Meintz, C. Kreuzer, C. Michelbacher, A. Burnham, T.
Stephens, J. Francfort, R. B. Carlson, J. Zhang, R. Vijayagopal, K. Hardy, F. Dias, M.
Mohanpurkar, D. Scoffield, A. N. Jansen, T. Tanim, A. Markel, Enabling fast charging –
Battery thermal considerations, J Power Sources, 367 (2017) 228-236.

24
[16] CHAdeMo announces high power version of the protocol, available at:
http://www.chademo.com/wp/wp-content/uploads/2016/06/2016-06-
01_High_power_CHAdeMO.pdf (accessed June 2017).
[17] Charging interface initiative e.V. - Industry statement on future charging infrastructure,
available at:
http://www.charinev.org/fileadmin/Downloads/Papers_and_Regulations/CharIN_industry_st
atement.pdf (accessed June 2017).
[18] 800-Volt Charging, available at: https://newsroom.porsche.com/en/technology/porsche-
engineering-e-power-electromobility-800-volt-charging-12720.html (accessed June 2017).
[19] S. S. Zhang, K. Xu, T. R. Jow, Study of the charging process of a LiCoO2-based Li-ion
battery, J. Power Sources, 160 (2006) 1349–1354.
[20] R. V. Bugga, M. C. Smart, Lithium plating behavior in lithium-ion cells, ECS Transactions
25 (36) (2010) 241-252.
[21] J. C. Burns, D. A. Stevens, J. R. Dahn, In-situ detection of lithium plating using high
precision coulometry, J. Electrochem. Soc., 162 (2015) A959–A964.
[22] K. Gallagher, S. Trask, C. Bauer, T. Woehrle, S. Lux, M. Tschech, P. Lamp, B. Polzin, S.
Ha, B. Long, Q. Wu, W. Lu, D. Dees, A. Jansen, Optimizing areal capacities through
understanding the limitations of lithium-ion electrodes, J. Electrochem. Soc., 163 (2016),
A138-A149.
[23] P. Prezas, L. Somerville, P. Jennings, A. McGordon, J. K. Basco, T. Duong, I. Bloom,
Effect of Fast Charging of Lithium-Ion Cells: Performance and Post-Test Results, SAE
Technical Paper Series, 2016-01-1194.
[24] R. Chandrasekaran, Quantification of bottlenecks to fast charging of lithium-ion-insertion
cells for electric vehicles, J Power Sources, 271 (2014) 622-632.
[25] P. Arora, M. Doyle, and R. E. White, Mathematical modeling of the lithium deposition
overcharge reaction in lithium‐ion batteries using carbon‐based negative electrodes, J.
Electrochem. Soc. 146 (10) (1999) 3543-3553.
[26] D. Anseán, M. Dubarry, A. Devie, B. Y. Liaw, V. M. García, J. C. Viera, M. González,
Operando lithium plating quantification and early detection of a commercial LiFePO4 cell
cycled under dynamic driving schedule, J Power Sources 356 (2017) 36-46.
[27] G. Park, N. Gunawardhana, H. Nakamura, Y. S. Lee, M. Yoshio, The study of
electrochemical properties and lithium deposition of graphite at low temperature, J Power
Sources, 199 (2012) 293-299 22.
[28] B. Suthar, P.W. Northrop, D. Rife, V.R. Subramanian, Effect of porosity, thickness and
tortuosity on capacity fade of anode, J. Electrochem. Soc. 162 (9) (2015) A1708-A1717.
[29] M. Dubarry, C. Truchot, B. Y. Liaw, Synthesize battery degradation modes via a diagnostic
and prognostic model, J Power Sources 219 (2012) 204-216.
[30] S. Zhang, The effect of the charging protocol on the cycle life of a Li-ion battery, J Power
Sources 161 (2) (2006) 1385-1391.

25
[31] W. Shen, T. Tu Vo, A. Kapoor, Charging algorithm of lithium ion batteries: An overview,
7th IEEE conference on Industrial Electronics and Applications, 2012, pp. 1567-1572.
[32] D. Anseán, M. González, J. C. Viera, V. M. García, C. Blanco, M. Valledor, Fast charging
technique for high power lithium iron phosphate batteries: A cycle life analysis, J Power
Sources 239 (2013) 9-15.
[33] T. T. Vo, X. Chen, W. Shen, A. Kapoor, New charging strategy for lithium-ion batteries
based on the integration of Taguchi method and state of charge estimation, J Power Sources,
273 (2015) 413-422.
[34] M. Shirk, J. Wishart, Effects of electric vehicle fast charging on battery life and vehicle
performance, SAE Technical Paper, 2015-01-1190.
[35] USABC Electric Vehicle Battery Test Manual Revision 3, Idaho National Laboratory,
DOE/ID-15-34184, June 2015.
[36] www.avt.inl.gov (accessed August 2017).
[37] T. Baumhöfer, M. Brühl, S. Rothgang, D. U. Sauer, Production caused variation in capacity
aging trend and correlation to initial cell performance, J Power Sources, 247 (2014) 332-338.
[38] S. Paul, C. Diegelmann, H. Kabza, W. Tillmetz, Analysis of ageing inhomogeneities in
lithium-ion battery systems, J Power Sources, 239 (2013) 642-650.
[39] S.F. Schuster, M. J. Brand, P. Berg, M. Gleissenberger, A. Jossen, Lithium-ion cell-to-cell
variation during battery electric vehicle operation, J Power Sources, 297 (2015) 242-251.
[40] T. R. Tanim, C. D. Rahn, Aging formula for lithium ion batteries with solid electrolyte
interphase layer growth, J Power Sources, 294 (2015) 239-247.
[41] M. Dubarry, A. Devie, and B. Y. Liaw, The value of battery diagnostics and prognostics, J.
Energy Power Sources 1 (5) (2014) 242-249.
[42] Alawa toolbox, available at: https://www.soest.hawaii.edu/HNEI/alawa/.
[43] M. Dubarry, C. Truchot, B. Y. Liaw, Cell degradation in commercial LiFePO4 cells with
high-power and high-energy designs, J Power Sources, 258 (2014) 408-419.
[44] M. Kassem, C. Delacourt, Postmortem analysis of calendar-aged graphite/LiFePO4 cells, J
Power Sources, 235 (2013) 159-171.
[45] J. P. Schmidt, H. Y. Tran, J. Richter, E. Ivers-Tiffée, M. Wohlfahrt-Mehrens, Analysis and
prediction of the open circuit potential of lithium-ion cells, J Power Sources 239 (2013) 696-
704 (2017) 36-46.
[46] T. Ohzuku, Y. Iwakoshi, K. Sawai, Formation of lithium‐graphite intercalation compounds
in nonaqueous electrolytes and their application as a negative electrode for a lithium ion
(shuttlecock) cell, J. Electrochem. Soc., 140 (9) (1993) 2490-2497.
[47] D. Aurbach, B. Markovsky, I. Weissman, E. Levi, Y. Ein-Eli, On the correlation between
surface chemistry and performance of graphite negative electrodes for Li ion batteries,
Electrochem. Acta, 45 (1-2) (1999) 67-86.
[48] A. Savitzky, M. J. E. Golay, Smoothing and differentiation of data by simplified least
squares procedures, Analytical Chemistry, 36 (8) (1964) 1627–1639.

26
[49] J. Marchicki, Modeling, parametrization, and diagnostics for lithium-ion batteries with
automotive applications, MS thesis, The Ohio State University, (2012) 87.