Fast Approximated Betweenness Centrality of Directed and ...
12
Fast Approximated Betweenness Centrality of Directed and Weighted Graphs Angelo Furno 1 , Nour-Eddin El Faouzi 1 , Rajesh Sharma 2 , and Eugenio Zimeo 3 1 Univ. Lyon, IFSTTAR, ENTPE, LICIT UMR T9401, Lyon, France, [email protected], [email protected] 2 University of Tartu, Tartu, Estonia, [email protected] 3 University of Sannio, Benevento, Italy, [email protected] Abstract. Node betweenness centrality is a reference metric to identify the most critical spots of a network. However, its exact computation exhibits already high (time) complexity on unweighted, undirected graphs. In some domains such as transportation, weighted and directed graphs can provide more realistic model- ing, but at the cost of an additional computation burden that limits the adoption of betweenness centrality for real-time monitoring of large networks. As largely demonstrated in previous work, approximated approaches represent a viable so- lution for continuous monitoring of the most critical nodes of large networks, when the knowledge of the exact values is not necessary for all the nodes. This paper presents a fast algorithm for approximated computation of between- ness centrality for weighted and directed graphs. It is a substantial extension of our previous work which focused only on unweighted and undirected networks. Similarly to that, it is based on the identification of pivot nodes that equally con- tribute to betweenness centrality values of the other nodes of the network. The pivots are discovered via a cluster-based approach that permits to identify the nodes that have the same properties with reference to clusters’ border nodes. The results prove that our algorithm exhibits significantly lower execution time and a bounded and tolerable approximation with respect to state-of-the-art approaches for exact computation when applied to very large, weighted and directed graphs. Keywords: Betweenness Centrality, Directed Weighted Graphs, Fast Computa- tion, Large Scale Networks, Real-time Monitoring 1 Introduction Real-time monitoring of large networks for detecting and predicting critical spots is a compelling challenge due to the high complexity of computing robustness metrics. Graph models have proven to be a valid approach to study topological bottlenecks of many kinds of networks via centrality indicators such as betweenness centrality. How- ever, while undirected and unweighted graphs represent a basic abstraction of these networks, weighted graphs can better capture edge diversity, especially in some appli- cation domains, such as transportation. Betweenness centrality (BC) [14] is a very popular network metric to character- ize nodes that are most traversed by shortest paths connecting pairs of other nodes
Transcript of Fast Approximated Betweenness Centrality of Directed and ...
Fast Approximated Betweenness Centrality ofDirected and Weighted Graphs
Angelo Furno1, Nour-Eddin El Faouzi1, Rajesh Sharma2, and Eugenio Zimeo3
1 Univ. Lyon, IFSTTAR, ENTPE, LICIT UMR T9401, Lyon, France,[email protected], [email protected]
2 University of Tartu, Tartu, Estonia,[email protected]
3 University of Sannio, Benevento, Italy,[email protected]
Abstract. Node betweenness centrality is a reference metric to identify the mostcritical spots of a network. However, its exact computation exhibits already high(time) complexity on unweighted, undirected graphs. In some domains such astransportation, weighted and directed graphs can provide more realistic model-ing, but at the cost of an additional computation burden that limits the adoptionof betweenness centrality for real-time monitoring of large networks. As largelydemonstrated in previous work, approximated approaches represent a viable so-lution for continuous monitoring of the most critical nodes of large networks,when the knowledge of the exact values is not necessary for all the nodes.This paper presents a fast algorithm for approximated computation of between-ness centrality for weighted and directed graphs. It is a substantial extension ofour previous work which focused only on unweighted and undirected networks.Similarly to that, it is based on the identification of pivot nodes that equally con-tribute to betweenness centrality values of the other nodes of the network. Thepivots are discovered via a cluster-based approach that permits to identify thenodes that have the same properties with reference to clusters’ border nodes. Theresults prove that our algorithm exhibits significantly lower execution time and abounded and tolerable approximation with respect to state-of-the-art approachesfor exact computation when applied to very large, weighted and directed graphs.
Keywords: Betweenness Centrality, Directed Weighted Graphs, Fast Computa-tion, Large Scale Networks, Real-time Monitoring
1 IntroductionReal-time monitoring of large networks for detecting and predicting critical spots isa compelling challenge due to the high complexity of computing robustness metrics.Graph models have proven to be a valid approach to study topological bottlenecks ofmany kinds of networks via centrality indicators such as betweenness centrality. How-ever, while undirected and unweighted graphs represent a basic abstraction of thesenetworks, weighted graphs can better capture edge diversity, especially in some appli-cation domains, such as transportation.
Betweenness centrality (BC) [14] is a very popular network metric to character-ize nodes that are most traversed by shortest paths connecting pairs of other nodes
2 Angelo Furno et al.
of a graph. It has been widely adopted to study many application domains but thehigh computation time limits its adoption for real-time monitoring of very large net-works. The fastest algorithm to compute the exact value of betweenness centrality hasbeen proposed by Brandes [9]. Given a graph G(V,E), it exhibits O(n+m) space andO(nm) time complexities for unweighted graphs and O(nm+ n2log(n)) for weightedones, where n = |V | is the number of nodes and m = |E| the number of edges. Toachieve this performance, Brandes adopts a single-source shortest-paths (SSSP) algo-rithm based on breadth-first graph search or on Dijkstra algorithm for unweighted andweighted graphs, respectively. Each exploration is computed with a complexity O(m)and O(m+ n · log(n)), for unweighted and weighted graphs respectively. This is typi-cally good for sparse graphs (where m� n2) but not sufficient for real-time monitoringof very large networks. A faster approach, useful for some kinds of applications, al-lows achieving lower computation time by calculating approximated BC values. Thesestrategies try to penalize some shortest paths or to exploit topological properties toidentify only k� n pivot nodes as sources for the computation of SSSP. While sev-eral attempts exist for computing approximated values of betweenness centrality ofunweighted graphs, a few of them focus on directed and weighted graphs, which bettermodel several real-world networks.
In this paper, we propose an adaptable algorithm for computing approximated val-ues of BC of directed and weighted networks. The performance of the algorithm canbe tuned based on the amount of error we can tolerate on the approximation. It isan extension of the algorithm originally proposed in [15, 16] for undirected and un-weighted graphs to directed and weighted ones. The algorithm, similarly to the onesproposed in [10] and [18], exploits topological characteristics of the graph in order toclassify nodes for their selection as pivots. Differently from the papers above, it exploitsclustering to identify reference nodes (clusters’ border nodes) to perform a topologicalanalysis. The solution can calculate an almost exact value of betweenness centrality forseveral nodes, i.e., the most critical ones, while keeping a good approximation for theothers, with an execution time that strictly depends on the number of retained pivots.
Our algorithm is validated by using real-world transportation networks. By assum-ing that edge weights represent the traveled distance or the free-flow-travel time, be-tweenness centrality provides indications about redistributions of the traffic flow (orpotential congestion), if we make the assumption that people prefer the shortest (fastest)paths to reach their destinations. Our analysis is based on a real large-scale road-network and Global Positioning System (GPS) taxi traces. We leverage geo-referenced,time-stamped taxi trips to reconstruct per-link median travel time/speed with a hourlyfrequency. Such traffic indicator is used as the edge weight in the modeling graph.However, it is not possible to estimate such traffic indicator for all network edges: someportions of the road networks are never traversed by taxis in the observed time period.Therefore, for such regions of the network, we used an interpolation technique basedon supervised machine learning. The performance analysis shows that the proposedalgorithm is a valid solution for real-time monitoring of large-scale graphs.
The rest of the paper is organized as follows. Sec. 2 presents related work, whileSec. 3 describes our fast BC algorithm. In Sec. 4, we evaluate our approach on a large-scale transportation dataset. Sec. 5 concludes the work and highlights future directions.
Fast Approximated Betweenness Centrality of Directed and Weighted Graphs 3
2 Related Work
Betweenness centrality, originally proposed in [13] for undirected graphs was extendedto directed graph in [31]. Brandes in [9] proposed a faster algorithm which also worksfor weighted networks. The idea was based on the adoption of SSSP algorithm based onbreadth-first graph search or on Dijkstra algorithm, for unweighted and weighted graphsrespectively. Several approaches, aiming to evaluate exact or approximated solutions,have been developed to further reduce the computation time. The proposed solutionscan be classified according to three main categories: (i) exploiting and increasing par-allelism, (ii) estimating BC values through a partial exploration of the graph, (iii) cal-culating BC values of fraction of nodes in dynamically evolving graphs.Parallel approaches: In [4], the first parallel implementation for computing between-ness centrality is presented, which handles weighted graphs as well. It is based on afine-grained multi-level parallelism, in which the neighbors of a given node are tra-versed concurrently on a shared data structure with granular locking. The algorithmhas been successively improved [23] by removing the need for locking in the depen-dency accumulation stage of Brandes’ algorithm through the adoption of a successorlist instead of a predecessor list for each node.Incremental approaches: A different set of approaches (stream-based) tries to avoidrecomputing the BC values of all the nodes of a graph G′ ≡ G+∆G when they areknown for a previous configuration G. For example, in [21], researchers proposed anefficient approach that reduces the search space by focusing only on the vertices whosebetweenness centralities get changed as a consequence of an update in the graph. Simi-larly, in [19], by using the hypergraph sketch data structure, i.e., a weighted hyper-edgerepresentation of shortest paths, computation time was reduced. Based on samplingbased techniques [28], Bergamini et. al. first proposed a semi-dynamic [6] and, later,a fully dynamic approach [5] for dynamic networks (both weighted and unweighted),capable of performing in-memory computation with millions of edges. Recently, anefficient algorithm for incremental BC computation [20] has been proposed. The algo-rithm exhibits good performance when the graph changes for a very limited number ofnodes. Conversely, the high speedup drastically reduces when the graph is subject tosignificant changes of its topology.Approximated approaches: The third research trend focuses on achieving low compu-tation time by calculating approximated BC values. These strategies try to penalizesome shortest paths, whose computation is the most expensive task in the whole pro-cess. For example, in [32], the authors only consider paths up to fixed length k. Bran-des and Pich [10] also proposed an approximated algorithm for faster BC calculationby choosing only k � n pivots as sources for the SSSP algorithm through differentstrategies, showing that random selection of pivots can achieve accuracy levels compa-rable to other heuristics. However, this approach overestimates the BC of unimportantnodes that are near a pivot. To overcome this problem, various solutions have beenproposed, e.g., a generalization framework for betweenness approximation has beenproposed in [18]. The idea is to scale BC values in order to reduce them with referenceto nodes close to pivots. In another paper, a solution to reduce the pivots for nodes withhigh centrality is proposed via adaptive sampling techniques [3]. A recent work [27]based on approximation shows large fluctuations of accuracy over the top-100 nodes
4 Angelo Furno et al.
on a scale-free graph. A random, shortest path based [26] approximation approach waspresented in [28].
For directed and unweighted networks an approach is presented in [8], where, simi-larly to [11], authors precompute reachable vertices for all the graph nodes. However, atthe best of our knowledge, there is a scarcity of contributions focusing on both weightedand directed networks. BC has been proven to be a proxy for traffic volume in [2], butthis paper does not address the problem of performing fast computation of BC in largedynamic networks, which is the main objective and contribution of this paper.
3 Fast BC computation of weighted and directed graphsIn this section, we present the W2C-FastBC algorithm, the weighted and directed ver-sion of the one previously proposed in [15,16]. It allows reducing BC computation timeof weighted and directed graphs in a parametric way, i.e., by acting on the accuracy ofBC values. The algorithm is based on the Brandes’ one for weighted graphs and on theheuristic proposed in [30] for identifying graph pivots. As in our previous work, we ex-ploit a fast clustering algorithm based on modularity for identifying graph communitiesand their related border nodes. Specifically, we used a distributed implementation [29]of Louvain method for weighted and directed graphs [24]. In the following subsections,we briefly introduce the adopted notation, the Brandes’ algorithm and discuss modular-ity for weighted graphs.
3.1 NotationWe assume the following definition throughout the paper. Let G(V , E, T , W , f (E, T ))be a dynamic, weighted, directed graph, where V denotes the set of nodes and E ⊆V ×V the one of edges. N = |V | denotes the number of nodes in the graph. W representsthe set of weights and T the set of time units. For instance, for very large networks, Tmay represent hours of the day. We highlight that the length of the considered time unit(e.g., 1 hour) represents the period of observations before a new computation of BCis launched, and translates therefore into a time constraint for computing betweennesscentrality. The function f : E × T –> W maps each edge ei j ∈ E at time slot t ∈ Tto a weight w ∈W . We denote as G(V , E, W ) a directed and weighted instance of thedynamic graph G related to a specific time slot t and therefore associated to a subsetof weights W ⊆W . The algorithms reported in the following are related to a specificinstance G of the dynamic graph G, i.e., BC computation is iteratively performed (in aquasi-real time fashion) at the beginning of time slot t+1 on the instance of the dynamicgraph related to time slot t.
A path p(vi, v j), between two nodes vi and v j of G, consists of a set of nodes andedges that connect these two nodes. The length of a path between any two nodes vi andv j, represented by len(p(vi, v j)), is the sum of the weights of the edges (or hops) to reachv j from vi. If nodes vi and v j are directly connected, then the path length is the weight ofthe link, or 1 for unweighted graphs. A shortest path between any two nodes vi and v j,denoted as sp(vi,v j), is a path with the minimum length, among all the paths connectingthe two nodes. Multiple shortest paths may exist between the same pair of nodes, i.e.,multiple paths having the same length. The distance d(vi,v j) = len(sp(vi,v j)) is the
Fast Approximated Betweenness Centrality of Directed and Weighted Graphs 5
length of the shortest path between nodes vi and v j. We denote σviv j as the number ofshortest paths between vi and v j, while σviv j(vk) represents the number of shortest pathsfrom vi to v j that cross node vk.
3.2 Brandes’ algorithmGiven a graph G, the pair-dependency of a source node s on an another node v fora destination t of the graph is defined as δst(v) = σst (v)
σst. The betweenness centrality
of any node v can be expressed in terms of dependency score δs•(v) = ∑t∈V δst(v),obtained by summing the pair-dependencies of each pair of nodes on v that has s assource node. To compute this score, Brandes’ algorithm exploits a recursive relationthat is motivated by this observation: let R = {w : v ∈ Ps(w)} be the set of nodes w suchthat v is a predecessor of w along a shortest path that starts from node s, and Ps(w) ={v∈V : {v,w}∈E,d(s,w)= d(s,v)+d(v,w)} the set of direct predecessors of a genericnode w in the shortest paths from the source node s to w; then, v is a predecessor alsoin any other shortest path starting from s and passing through a different w ∈ R [9].Consequently, we have:
δs•(v) = ∑w:v∈Ps(w)
σsv
σsw(1+δs•(w)), (1)
Finally, the betweenness centrality BC of node v is obtained as:
BC(v) = ∑s∈V
δs•(v). (2)
For scaling purpose, BC values are often normalized by dividing them by (n−1) ·(n−2)/2 for undirected graphs and by (n−1) · (n−2) for directed ones.
Conceptually, Brandes’ algorithm runs in two phases. During the first phase, it per-forms a search on the whole graph to find all the shortest paths starting from every nodes, considered as source of the breadth-first exploration of the whole graph. In the sec-ond phase, it performs dependency accumulation by backtracking along the discoveredshortest paths. During these two phases, the algorithm maintains four data structures foreach node found on the way: a predecessor list Ps(v), the distance ds(v) from the source,the number of shortest paths from the source σst(v) and the dependency accumulationwhen backtracking at the end of the search.
3.3 Weighted modularity and Louvain methodModularity is a metric, defined as a value between -1 and 1, to measure how tightlythe nodes are attached with each other in the network. It was introduced to identifycommunities in undirected and unweighted (or weighted) networks [25]. Given a graphG, partitioned into a set of communities C = {c1,c2, ...,cD}, formally, modularity [22]of graph G is defined as follows:
Q =1m ∑
i, j∈V
[Ai j−
kini kout
j
m
]δ (ci,c j) (3)
6 Angelo Furno et al.
where δ is 1 if ci = c j (nodes i and j belong to the same community) or 0 otherwise, mis the sum of all of the edge weights in the graph, kin
i , koutj are the sum of the weights of
the edges entering node i and the edges exiting node j, respectively; Ai j is 0 if nodes niand n j are not connected. In case the nodes ni and n j are connected then Ai j is wi, j, thatis the weight of the edge connecting nodes i and j.
We exploit modularity for clustering weighted directed graphs with the Louvainmethod [7,12]. The algorithm initially searches for small communities. Then, it createsa new graph whose nodes are the communities identified in the previous step. Thesetwo steps are iteratively run until there is no modularity gain derived by aggregatingclusters in larger communities. In our implementation, the weights used to computeweighted modularity are assumed as in the notion of closeness (nodes are tighter if theyhave lower distance or travel time), i.e. “smaller is tighter”. This choice is motivated bythe fact that we want to reduce the number of border nodes for each cluster. Therefore,we generate communities whose nodes are highly locally inter-connected with short(or fast to travel) local paths. Conversely, when computing shortest paths in SSSPs,weights are assumed as in the notion of length (or travel time), i.e., “higher is farther”.We use a distributed variant of the Louvain algorithm for weighted and directed graphs[24,29]: all vertices select a new community simultaneously, updating the local view ofthe graph after each change. Even though some choices will not maximize modularity,after multiple iterations, communities will typically converge thus producing a finalresult relatively close to the sequential version of the algorithm.
3.4 W2C-FastBCGiven a graph G, we split it into a set of clusters (i.e., C) by using the Louvain (Alg. 1,line 2) method for weighted graphs [29]1. The main result of clustering is the identifica-tion of border nodes (an array for each cluster). A border node is a node having at leastone neighbor node in a different cluster (line 4). Then, a parallel execution of Brandes’algorithm (based on Dijkstra2) is performed inside each cluster to compute the localBC (lines 6-11). This computation generates the partial inner-cluster contribution to theBC of each node and additional information, such as the weighted shortest paths andthe distances from a node of a cluster towards each border node of the same cluster.
The information above is used to identify the nodes inside each cluster that equallycontribute to the dependency score of each node of the graph (equivalence class, see[15, 30] for more details). Taking into account that nodes belonging to the same classproduce the same dependency score on each node of the graph, one representative nodeshould be identified as a source node for applying Dijkstra’s algorithm (line 19). Thisnode is called class pivot. The partial dependency score calculated for the pivot is thenmultiplied by the cardinality of the pivot class (line 20). This method avoids re-applyingDijkstra’ algorithm to another node of the same class, thus ensuring fast calculation ofBC if P�N, where P represents the set of pivots selected and N represents the numberof nodes of the graph.
1The implementation leverages a Scala parallel solution partially based on the DistributedGraph Analytics (DGA) by Sotera: https://github.com/Sotera/distributed-graph-analytics.
2The adoption of Dijkstra algorithm instead of breadth first search represents a main variantof our FastBC algorithm proposed in this paper.

Fast Approximated Betweenness Centrality of Directed and Weighted Graphs 7
Algorithm 1 W2C-Fast-BC: pseudo-code of the main function1: function W2C-FASTBC(G,C,kFrac)2: C← weightedLouvainClustering(G)3: map i← 1, |C| do4: bordernodesi← f indBorderNodes(G,Ci)5: end map6: map i← 1, |V| do7: localδi← computeLocalδ (i,C,bordernodes)8: end map9: reduce i← (1, |V|), localδs, localδz, i = j do
10: localBCi← localδs(i)+ localδz( j)11: end reduce12: map i← 1, |C| do13: superClassesi←WkMeansClustering(Ci,classesi,kFrac)14: end map15: map i← 1, |superClasses| do16: Pi← selectPivotO f (superClassesi, localBC)17: end map18: map i← 1, |P| do19: δi← computeδFrom(Pi)20: δi← (δi− localBC) · |superClassesi|21: end map22: reduce i← (1, |V|),δs,δz, i = j do23: BCi← δs(i)+δz( j)24: end reduce25: for i← 1, |V| do26: BCi← BCi + localBCi27: end for28: return BC29: end function
The final value of BC is obtained for each node by summing up all partial con-tributions (produced by the reduce operation, lines 22:24) with local BC values (lines25:27). To further reduce the computation time, we extended the concept of class byintroducing super classes through an additional clustering operation inside each initialLouvain-derived cluster (line 13). A super class is a group of classes, belonging to thesame Louvain cluster and obtained by clustering (via K-means) the vectors generatedby considering, for each node, the normalized distances from the Louvain cluster’s bor-dernodes and the amount of shortest paths towards them. To perform class grouping,we exploit a parallel K-means algorithm by using a different K for each initial Louvaincluster. K is defined as a fraction (K-Fraction) of the initial number of classes belong-ing to each Louvain cluster. For example, by considering a fraction equals to 0.4, thealgorithm adopts a 0.4 fraction of the number of classes in each Louvain cluster. Bythis approach, we are able to drive the behavior of the algorithm towards the desiredcomputation time. However, when the computation time decreases the approximationworsens, as deeply illustrated in our previous work [15, 16, 30].
8 Angelo Furno et al.
4 Evaluation: dynamic analysis of a real-world road network
We implemented our algorithms using Scala with the Apache-Spark framework. Sparkwas configured to work in the standalone cluster mode on two Intel Xeon E5 2640 2.4GHz multi-core machines, each equipped with 56 virtual cores and 128 GB of DDR4RAM. All algorithms for BC computation leverage 10 cores by spawning the map-reduce tasks on two Spark workers, each equipped with 5 executors.
To evaluate our W2C-Fast-BC algorithm, we leverage a large-scale transportationgraph, namely Rhone-ROADS, corresponding to the entire road network of the Rhone-Alpes region, France [17]. The graph includes the agglomeration of Lyon and its sur-roundings and has a geographical extent of approximately 3,300 Km2. The networkis directed and unweighted, with 117,605 nodes and 248,337 edges. We transformedthe Rhone-ROADS graph into a dynamic weighted graph by relying on an additionaldataset, namely Rhone-TAXIS, which reports on anonymized GPS traces of taxis ac-tive in the Rhone-Alpes region. Rhone-TAXIS has been collected by the French opera-tor Radio Taxi via a fleet of approximately 400 taxis during 2011-2012. Geo-referencedtaxi trips are collected according to a variable sampling interval (between 10 and 60seconds), with a global average of 800,000 measurements per day. The generic sampleof the Rhone-TAXIS dataset, i.e., an elementary taxi trip, includes the time-stampedstart and arrival GPS positions of a small segment traveled by the associated taxi iden-tifier. These measures permit to roughly estimate the traveled distance and the instantspeed of the taxi moving along a given road segment. In order to improve the quality ofthe Rhone-TAXIS dataset and properly compute the edge weights, we have filtered outelementary trips with unrealistic speeds (i.e., higher than 130 Km/h).
We map-matched all the elementary trips of the Rhone-TAXIS dataset and com-puted hourly median speeds for the edges of the Rhone-ROADS graph, thus generatinga (discrete) dynamic weighted graph. More specifically, we considered 24 hourly timeslots for a typical day, and computed the weighted graph instance corresponding to eachtime slot t. To that purpose, we retain only the edges with non-null value of the medianspeed during t, as estimated from the map-matched taxi trips related to the same edgeand time slot t. Thus, we calculate the weight at time slot t of each edge (which cor-responds to a road link with known length) as the estimated travel time to cross thecorresponding road segment, i.e., the ratio of the length of the link to the median speedestimated on that link. By iterating this process for the different time slots, we obtainthe final dynamic weighted graph (i.e., our graph G).
The W2C-Fast-BC and Brandes algorithms are applied iteratively to each hourlyinstance of the dynamic graph (i.e., a snapshot G). This is conceptually equivalent to anon-line operational situation, where the graph naturally emerges from sensor-collecteddata used to continuously compute up-to-date traffic information on each edge withhourly periodicity. It is worth noting that, given the relatively small size of the ob-served taxi fleet and the circadian rhythm characterizing human mobility, snapshotsof the dynamic graph related to rush hours (e.g., 7:00-09:00 and 17:00-19:00) have amuch smaller size with respect to the original Rhone-ROADS graph, i.e., approximately30,000 nodes and 60,000 edges (see the framed portion of the graph in Fig. 1a). Suchsize further reduces for graph snapshots related to non-rush hours. Indeed, most of theobserved elementary trips are condensed within the city center of Lyon, with only few
Fast Approximated Betweenness Centrality of Directed and Weighted Graphs 9
(a) KNR-interpolated graph at08:00
(b) Top-1000 nodes’ BC valuesat 08:00
(c) Spatial distribution of theerror at 08:00 with K-fraction= 0.2 (top-1000 BC)
(d) Execution time of W2C-Fast-BC vs Brandes-BC at08:00
(e) W2C-Fast-BC averageperc. error (top 1,000 nodes) at08:00
(f) Top-1000 BC perc. error at08:00
(g) Percentage of possible in-versions (all nodes)
00:0
0
02:0
0
04:0
0
06:0
0
08:0
0
10:0
0
12:0
0
14:0
0
16:0
0
18:0
0
20:0
0
22:0
00
1000
2000
3000
4000
5000
6000
7000
Exec.
tim
e [
s]
W2C-Fast-BC (K-frac. = 0.2)
Exact
(h) Dynamic Graph: executiontime
00:0
0
02:0
0
04:0
0
06:0
0
08:0
0
10:0
0
12:0
0
14:0
0
16:0
0
18:0
0
20:0
0
22:0
00.00
0.05
0.10
0.15
0.20
0.25
0.30
0.35
Avg.
Perc
. Err
or
[%]
W2C-Fast-BC (K-frac. = 0.2)
(i) Dynamic Graph: averagepercentage error (top-1000)
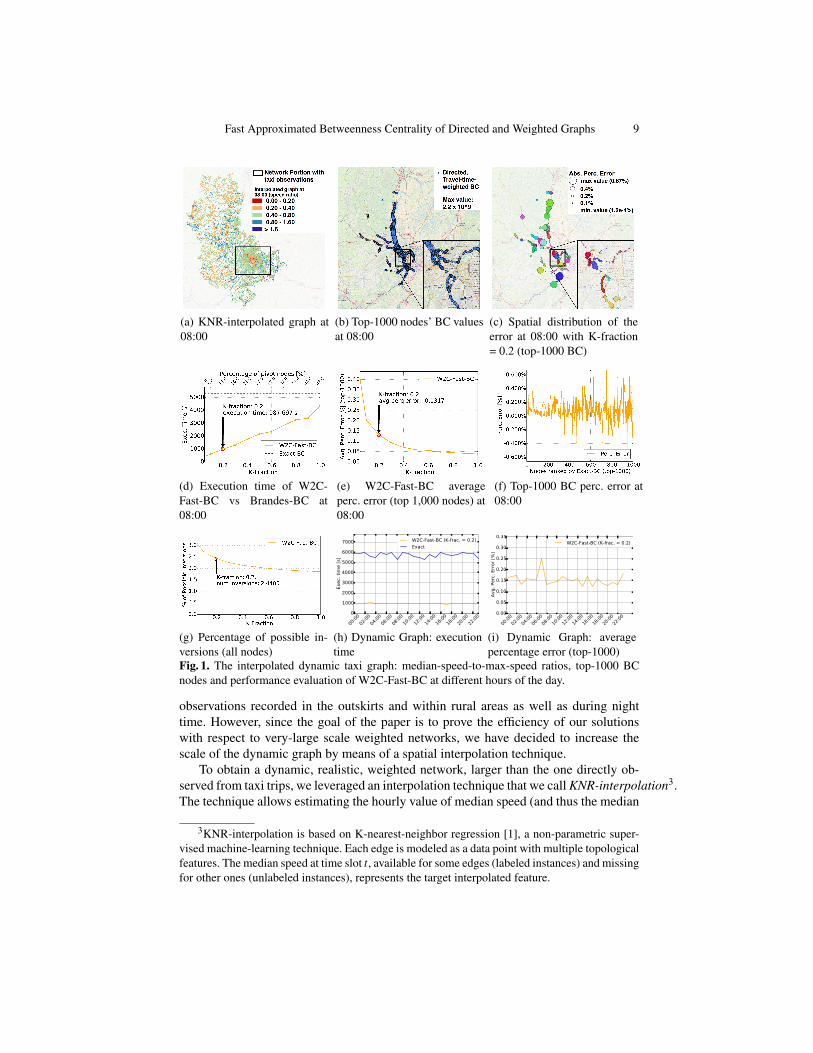
Fig. 1. The interpolated dynamic taxi graph: median-speed-to-max-speed ratios, top-1000 BCnodes and performance evaluation of W2C-Fast-BC at different hours of the day.
observations recorded in the outskirts and within rural areas as well as during nighttime. However, since the goal of the paper is to prove the efficiency of our solutionswith respect to very-large scale weighted networks, we have decided to increase thescale of the dynamic graph by means of a spatial interpolation technique.
To obtain a dynamic, realistic, weighted network, larger than the one directly ob-served from taxi trips, we leveraged an interpolation technique that we call KNR-interpolation3.The technique allows estimating the hourly value of median speed (and thus the median
3KNR-interpolation is based on K-nearest-neighbor regression [1], a non-parametric super-vised machine-learning technique. Each edge is modeled as a data point with multiple topologicalfeatures. The median speed at time slot t, available for some edges (labeled instances) and missingfor other ones (unlabeled instances), represents the target interpolated feature.
10 Angelo Furno et al.
travel-time weight) for those edges of the original Rhone-ROADS network with noavailable observation from taxi trips at time slot t. Fig. 1a graphically shows the KNR-interpolated snapshot at 08:00 of a typical working day. Fig. 1a also presents speed-ratios (i.e., median speed divided by road speed limit) either estimated via taxi traces(for the framed portion of the graph) or via the KNR interpolation technique. Red andorange colors indicate highly-congested situations on the edge, i.e., lower values of thespeed ratio, while greens and blues indicate a smooth, non-congested situation at timet. The resulting graph has approximately the same size of the Rhone-ROADS network.
The values of BC for the top-1000 nodes are reported in Fig. 1b (nodes with largercircles have higher BC) for the snapshot related to 08:00. As it can be observed fromFig. 1d, the exact algorithm for computing BC on the weighted graph requires a com-putation time of more than one hour, therefore unable to complete within the durationof the time slot. Remarkably, our W2C-Fast-BC computes in only 987 seconds (i.e.,approximately 15 minutes) when using a K-fraction equal to 0.2, showing an averagepercentage error of 0.13% (Fig. 1e) and a maximum percentage error of±0.7% (Fig. 1f)over the top-1000 BC nodes. The number of clusters obtained via the Louvain methodis 127, while the number of classes, as retrieved by the K-means algorithm, correspondsto 12494 (which also represents the number of pivot) out of 117605 nodes. The spatialdistribution of the absolute percentage error is reported in Fig. 1c, with a node sizeproportional to the error, and a different color to represent the cluster each node be-longs to. The figure highlights a scattered distribution of the percentage error over thegraph. Finally, we also report in Fig. 1g the percentage of inversions against the maxi-mum number of possible inversions [16], which clearly highlights the capability of oursolution to preserve a good ranking (i.e., low percentage of inversions) of all the net-work nodes in terms of their BC values, even when using low values of the K-fractionparameter.
Similar results have been observed over the whole dynamic graph (i.e., the 24 hourlytime slots, as reported in Fig. 1h and Fig. 1i), thus proving the adequacy of our solutionfor quasi real-time monitoring of dynamic, directed, weighted road-networks.
5 ConclusionWe presented an approximated betweenness centrality computation method for weightedand directed graphs. By exploiting representative pivot nodes, identified through thedefinition of a class of equivalence, the proposed algorithm is able to find the most crit-ical nodes in a directed and weighted graph with a significant speedup and a negligibleerror if compared to the exact Brandes’ algorithm. The algorithm has been evaluatedon a real transportation network dataset, where dynamic weights were derived fromthe analysis of GPS-taxi data. The results reported in the paper show that directed andweighted graphs provide further information useful for a more realistic interpretation ofhigh BC values. Moreover, the dynamic analysis exhibits continuously changing valuesof BC that are useful for predicting possible critical spots. Therefore, the algorithm rep-resents an important milestone towards the objective of defining a complete frameworkfor monitoring road networks and predicting traffic flows.
In the future, we aim to leverage additional solutions to further reduce computa-tion time and error by exploiting, for instance, the hierarchical information produced
Fast Approximated Betweenness Centrality of Directed and Weighted Graphs 11
by the Louvain community detection algorithm. Moreover, in relation to the transporta-tion case study, we will consider additional information (e.g., dynamic traffic volumes)in order to exploit dynamically computed BC values as effective predictors of networkcongestion. Finally, we aim to generalize the study of the performance of the algorithm,by means of a thorough evaluation with respect to other approximated solutions, by us-ing different kinds of network (e.g., small-world, random networks) related to differentapplication domains (e.g., social networks, brain networks, etc.).
AcknowledgmentThis work has been supported by the French research project PROMENADE (grantnumber ANR-18-CE22-0008), the H2020 framework project SoBigData, grant number654024, and the GAUSS project (MIUR, PRIN 2015, Contract 2015KWREMX).
References
1. Altman, N.S.: An introduction to kernel and nearest-neighbor nonparametric regression. TheAmerican Statistician 46(3), 175–185 (1992)
2. Altshuler, Y., Puzis, R., Elovici, Y., Bekhor, S., Pentland, A.S.: Augmented betweennesscentrality for mobility prediction in transportation networks. In: International Workshop onFinding Patterns of Human Behaviors in Network and Mobility Data (NEMO), (2011).
3. Bader, D.A., Kintali, S., Madduri, K., Mihail, M.: Approximating betweenness centrality.In: Proceedings of the 5th International Conference on Algorithms and Models for the Web-graph, WAW’07, pp. 124–137. Springer-Verlag, Berlin, Heidelberg (2007)
4. Bader, D.A., Madduri, K.: Parallel algorithms for evaluating centrality indices in real-worldnetworks. In: Parallel Processing, 2006. ICPP 2006. International Conference on, pp. 539–550. IEEE (2006)
5. Bergamini, E., Meyerhenke, H.: Approximating betweenness centrality in fully dynamic net-works. Internet Mathematics 12(5), pp. 281–314 (2016).
6. Bergamini, E., Meyerhenke, H., Staudt, C.L.: Approximating betweenness centrality in largeevolving networks. In: 17th Workshop on Algorithm Engineering & Experiments, ALENEX’15, pp. 133–146. SIAM, Philadelphia, PA, USA (2015)
7. Blondel, V.D., Guillaume, J.L., Lambiotte, R., Lefebvre, E.: Fast unfolding of communitiesin large networks. Journal of Statistical Mechanics: Theory and Experiment P10008, (2008)
8. Borassi, M., Natale, E.: KADABRA is an adaptive algorithm for betweenness via random ap-proximation. In: ESA, LIPIcs, vol. 57, pp. 20:1–20:18. Schloss Dagstuhl - Leibniz-Zentrumfuer Informatik (2016)
9. Brandes, U.: A faster algorithm for betweenness centrality. Journal of Mathematical Sociol-ogy 25(163) (2001)
10. Brandes, U., Pich, C.: Centrality estimation in large networks. International Journal of Bi-furcation and Chaos 17(07), pp. 2303–2318 (2007)
11. Chehreghani, M.H., Bifet, A., Abdessalem, T.: Efficient exact and approximate algorithmsfor computing betweenness centrality in directed graphs. In: Pacific-Asia Conference onKnowledge Discovery and Data Mining. Springer, Cham, p. 752–764 (2018).
12. Dugue, N., Perez., A.: Directed louvain: maximizing modularity in directed networks. In:PhD Thesis, Universite d’Orleans (2015)
13. Freeman, L.C.: Centrality in social networks conceptual clarification. Social Networks 1(3),pp. 215–239 (1978)
12 Angelo Furno et al.
14. Freeman, L.C.: A set of measures of centrality based on betweenness. Sociometry 25, pp.35–41 (1997)
15. Furno, A., El Faouzi, N.E., Sharma, R., Zimeo, E.: Reducing pivots of approximated be-tweenness computation by hierarchically clustering complex networks. In: InternationalConference on Complex Networks and their Applications, pp. 65–77. Springer (2017)
16. Furno, A., El Faouzi, N.E., Sharma, R., Zimeo, E.: Two-level clustering fast betweennesscentrality computation for requirement-driven approximation. In: 2017 IEEE InternationalConference on Big Data (Big Data), pp. 1289–1294. IEEE (2017)
17. Furno, A., El Faouzi, N.E., Sharma, R., Cammarota, V., Zimeo, E.: A Graph-Based Frame-work for Real-Time Vulnerability Assessment of Road Networks. In: 2018 IEEE Interna-tional Conference on Smart Computing (SMARTCOMP), pp. 234–241. IEEE (2018)
18. Geisberger, R., Sanders, P., Schultes, D.: Better approximation of betweenness centrality.In: Proceedings of the Meeting on Algorithm Engineering & Expermiments, pp. 90–100.Society for Industrial and Applied Mathematics (2008)
19. Hayashi, T., Akiba, T., Yoshida, Y.: Fully dynamic betweenness centrality maintenance onmassive networks. Proc. VLDB Endow. 9(2), pp. 48–59 (2015).
20. Kourtellis, N., Morales, G.D.F., Bonchi, F.: Scalable online betweenness centrality in evolv-ing graphs. In 2016 IEEE 32nd International Conference on Data Engineering (ICDE) pp.1580–1581 (2016)
21. Lee, M.J., Lee, J., Park, J.Y., Choi, R.H., Chung, C.W.: Qube: A quick algorithm for updatingbetweenness centrality. In: Proceedings of the 21st International Conference on World WideWeb, WWW ’12, pp. 351–360. ACM, New York, NY, USA (2012)
22. Leicht, E.A., Newman, M.E.J.: Community Structure in Directed Networks. Physical ReviewLetters 100(11), 118703 (2008).
23. Madduri, K., Ediger, D., Jiang, K., Bader, D.A., Chavarria-Miranda, D.: A faster parallelalgorithm and efficient multithreaded implementations for evaluating betweenness centralityon massive datasets. In: 2009 IEEE Parallel & Distributed Processing International Sympo-sium on, pp. 1–8. IEEE (2009)
24. Newman, M.E.: Analysis of weighted networks. Physical Review E 70(5), 056131 (2004)25. Newman, M.E.J., Girvan, M.: Finding and evaluating community structure in networks.
Phys. Rev. E 69, 026113 (2004)26. Newman, M.J.: A measure of betweenness centrality based on random walks. Social Net-
works 27(1), pp. 39 – 54 (2005).27. Ohara, K., Saito, K., Kimura, M., Motoda, H.: Accelerating Computation of Distance Based
Centrality Measures for Spatial Networks. In: International Conference on Discovery Sci-ence. Springer, Cham, (2016).
28. Riondato, M., Kornaropoulos, E.M.: Fast approximation of betweenness centrality throughsampling. Data Mining and Knowledge Discovery 30(2), pp. 438–475 (2016)
29. Sotera: dga-graphx: Graphx algorithms. online URL https://github.com/Sotera/spark-distributed-louvain-modularity. Last checked on Oct. 2018.
30. Suppa, P., Zimeo, E.: A clustered approach for fast computation of betweenness centrality insocial networks. In: 2015 IEEE International Congress on Big Data, pp. 47–54 (2015)
31. White, D.R., Borgatti, S.P.: Betweenness centrality measures for directed graphs. SocialNetworks 16(4), pp. 335 – 346 (1994)
32. White, S., Smyth, P.: Algorithms for estimating relative importance in networks. In: Pro-ceedings of the ninth ACM SIGKDD international conference on Knowledge discovery anddata mining, pp. 266–275. ACM (2003)


![spcl.inf.ethz.chspcl.inf.ethz.ch/Publications/.pdf/pushpull-slides.pdf · spcl.inf.ethz.ch @spcl_eth 1. Forward traversals BETWEENNESS CENTRALITY BRANDES [1] [1] U. Brandes. A faster](https://static.fdocuments.in/doc/165x107/5f93dd3f74a1c70c3d675e39/spclinfethz-spclinfethzch-spcleth-1-forward-traversals-betweenness-centrality.jpg)


![Randomized flow model and centrality measure for electrical ......the betweenness centrality measure of [16] is computed, to more realistically capture the importance of the role played](https://static.fdocuments.in/doc/165x107/60f7b3fe8fba690d5c20f68c/randomized-flow-model-and-centrality-measure-for-electrical-the-betweenness.jpg)