
Fashion & Lifestyle
37
Sector Thematic Fashion & Lifestyle From a disruptor’s lens II In this instalment of the ‘From a Disruptor’s Lens’ series, we assess key vitals of offline apparel (Previous edition tracked F&G). The sight isn’t pretty! Short of a few disciplined operators, most categories (especially their tails) perfectly fit our ‘Prone-to-Disruption’ framework. Meanwhile, e-tailers have evidently stepped up efforts on (1) broadening their online stack (i.e. online consumer lifetime value (LTV) continues to increase with reducing CAC), (2) improving F&L profitability and (3) expanding footprint. This can be vetted by India’s rising relevance in global e-tailers’ topline, profitability and capital allocation decisions. Against this backdrop, it is prudent to limit investment exposure to highly disciplined value retailers (largely off-limits to e-tail) such as V-MART and re-capitalised brands with reasonable consumer pull (ABFRL). Jay Gandhi Retail, Paints [email protected] +91-22-6171-7320
Transcript of Fashion & Lifestyle

Sector Thematic
Fashion & Lifestyle
From a disruptor’s lens II
In this instalment of the ‘From a Disruptor’s Lens’ series, we assess key vitals of
offline apparel (Previous edition tracked F&G). The sight isn’t pretty! Short of a
few disciplined operators, most categories (especially their tails) perfectly fit our
‘Prone-to-Disruption’ framework. Meanwhile, e-tailers have evidently stepped up
efforts on (1) broadening their online stack (i.e. online consumer lifetime value
(LTV) continues to increase with reducing CAC), (2) improving F&L profitability
and (3) expanding footprint. This can be vetted by India’s rising relevance in
global e-tailers’ topline, profitability and capital allocation decisions. Against this
backdrop, it is prudent to limit investment exposure to highly disciplined value
retailers (largely off-limits to e-tail) such as V-MART and re-capitalised brands
with reasonable consumer pull (ABFRL).
Jay Gandhi Retail, Paints
+91-22-6171-7320

26 April 2021 Sector Thematic
Fashion & Lifestyle
HSIE Research is also available on Bloomberg ERH HDF <GO> & Thomson Reuters
From a disruptor’s lens II In this instalment of the ‘From a Disruptor’s Lens’ series, we assess key vitals of
offline apparel (Previous edition tracked F&G). The sight isn’t pretty! Short of a
few disciplined operators, most categories (especially their tails) perfectly fit our
‘Prone-to-Disruption’ framework. Meanwhile, e-tailers have evidently stepped up
efforts on (1) broadening their online stack (i.e. online consumer lifetime value
(LTV) continues to increase with reducing CAC), (2) improving F&L profitability
and (3) expanding footprint. This can be vetted by India’s rising relevance in
global e-tailers’ topline, profitability and capital allocation decisions. Against this
backdrop, it is prudent to limit investment exposure to highly disciplined value
retailers (largely off-limits to e-tail) such as V-MART and re-capitalised brands
with reasonable consumer pull (ABFRL).
Focus on F&L segment rises, online stack becomes more potent: Along with the
increasing F&L skew in revenue mix, e-tailers have stepped up efforts to improve
profitability of their F&L verticals. GMs for e-tailers have significantly improved
(4-13pp over FY17-20) due to increasing (a) sourcing margins on private labels
and partner brands and (b) skew of fresh brand assortment. This, is partly a
consequence of weak offline retailers attempting to release cash from working
capital (note: contribution margins for both e-tailers – Amazon and Flipkart -
are now in the positive). This, along with their ever-increasing cloud/3P
commission/ad-based services, is making the online stack more potent with time.
Why is this important? Cash flows from e-tailers’ non-core operations can be
used to woo brands, private label vendors, and 3P sellers alike with better terms-
of-trade in exchange for better sourcing margins and fresher assortment (Myntra
is a classic case in point). This, in turn, increases e-tailers’ competitiveness vis-à-
vis traditional formats (multi-brand department stores and weak brands/private
labels) and leads to higher consumer traffic/conversion rates. Voila! E-tail’s
flywheel begins to work!
‘Prone-to-Disruption’ framework remains validated: Our ‘prone-to-Disruption’
framework for offline F&L retailers (low differentiation and sales velocity + high
AoV + high GM and cost structures + increasing vendor support = market share
loss to e-tailers) remains validated. 3P department stores, ethnic wear, and weak
brands seem most prone to disruption on this equation, while value fashion
seems off-limits for e-tailers. FY17-20 category-wise performance and FY21
recovery corroborates this trend.
COVID-19 second wave - final nail in the coffin for the tail! Given the weak
cash positions, sinking profitability, and debilitating working capital woes across
category tails, the second wave of lockdowns could prove fatal for many. Even
stronger ones are likely to report a second round of sub-optimal performance.
Based on our store map, Maharashtra and Delhi (both partially locked down)
account for 25-40% of stores across all formats (ex-value fashion). Revenue
exposure could be as high as 40-60% (HSIE). The most exposed companies in our
coverage are STOP and TCNS Clothing.
Slim pickings! Amidst imminent disruption, deteriorating unit economics and
second wave-led pains, investors have slim pickings across the F&L space. It is
prudent to restrict exposure to highly disciplined value retailers such as V-MART
(TP: 2,800/sh; implying 22xFY23 EV/EBITDA, Reco: ADD) and re-capitalised
brands with reasonable consumer pull like ABFRL (TP: 200/sh, implying 14x
FY23 EV/EBITDA, Reco: BUY). Trent remains a good biz at extra-ordinary
valuations. Maintain SELL (TP: 585/sh, implying 26x FY23 EV/EBITDA; stock
currently trades at 34x FY23 EV/EBITDA).
Company RECO CMP TP
(Rs)
Avenue
Supermarts SELL 2778 2160
Titan SELL 1523 1300
ABFRL BUY 174 200
Trent SELL 736 585
STOP SELL 193 170
TCNS Clo. REDUCE 448 400
V-MART ADD 2626 2800
Asian Paints REDUCE 2556 2300
Berger Paints SELL 710 610
Kansai
Nerolac BUY 548 650
CMP as on 23 Apr 21
Did you know?
The annual cash position of our
apparel universe (25+ F&L
retailers accounting for 2/3rds of
the organised pie) < 20% of the
annual fund raise of key e-tailers
- capital divide is just too huge!
Jay Gandhi
+91-22-6171-7320

Page | 2
Fashion & Lifestyle Thematic
Story in Charts
No differentiation and low sales velocity
Source: Company, HSIE Research, Note: Revenue per sq. ft are estimates for unlisted companies
+ High gross margins and cost structure…
Source: Company, HSIE Research
+ Increasing vendors’ crutch
Source: Company, HSIE Research
51
89
92
102
42
65
50
34
51
130
115
97
108
37
68
38
33
15
160
138
125
95
39
57
43
29
16
248
233
182
109
55
52
28
43
- 40 80
120 160 200 240 280
My
ntr
a/Ja
bo
ng
*
ST
OP
FL
FL
Arv
ind
Fas
hio
n
AB
FR
L
TC
NS
Clo
.
Lif
esty
le I
nt
V2
Ret
ail
V-M
AR
T
Tre
nt
Rel
ian
ce R
etai
l
Payable Days
FY18 FY19 FY20 2HFY21
Category-wise performance continues to validate our framework for the apparel universe
(7)5 6 4
13
(2) (4)
(24)(16)
1 7
(5)3 2
8 (0) 0
(9)3 (1)
(12)(1)
9 12 3
(17)(9)
(17)(10)
(30)(20)(10)-10 20
-10,000 20,000 30,000 40,000 50,000
LI
(Dep
t S
tore
)
ST
OP
FL
FL
-Cen
tra
l
-Bra
nd
Fa
cto
ry
TC
NS
Clo
thin
g
Co
mp
an
y A
Co
mp
an
y B
Co
mp
an
y C
Co
mp
an
y D
-In
dit
ex I
nd
ia
Co
mp
an
y B
Co
mp
an
y C
Co
mp
an
y D
SS
IPL
Ra
ym
on
d
Ma
du
ra
AF
L b
ran
ds
Co
mp
an
y E
VM
AR
T
V2
Ret
ail
Pa
nta
loo
ns
Zu
dio
Co
mp
an
y E
Co
mp
an
y F
Co
mp
an
y G
Co
mp
an
y H
Co
mp
an
y I
Co
mp
an
y J
Dept Stores Ethnic wear Fast Fashion Brands Value Fashion
Revenue per sq. ft (Rs) RPSF (5-yr CAGR)
AOV: Rs. 2300-3300 AOV: Rs. 3000-4000 AOV: Rs. 2000-4000 AOV: Rs. 3000-4000 AOV: Rs. 700-1800
42
45
42
34
65
73
60
62
67
46
56
39
59
50
55
54
60
45
57
46
40
32
28
40
36
25
33
32
26
33 34 36 27
57
39
54 51 57 53 45
28
52 46
56 48
42 40 49
40 37 24 24
31 25 28 26 22
48
-10 20 30 40 50 60 70
-
20
40
60
80
Lif
esty
le I
nt
Lif
esty
le (
Dep
t)
Sh
op
per
s S
top
FL
FL
TC
NS
Clo
thin
g
Co
mp
an
y A
Co
mp
an
y B
Co
mp
an
y C
Co
mp
an
y D
Co
mp
an
y E
Wes
tsid
e
-In
dit
ex I
nd
ia
Co
mp
an
y A
Co
mp
an
y B
AF
L b
ran
ds
-Ma
du
ra
Kew
al K
ira
n
Ra
ym
on
d
Co
mp
an
y A
Pa
nta
loo
ns
Zu
dio
VM
AR
T
V2
Ret
ail
Co
mp
an
y A
Co
mp
an
y B
Co
mp
an
y C
Co
mp
an
y D
Co
mp
an
y E
E-t
ail
*Dept Stores Ethnic Wear Fast Fashion Brands Value Fashion E-
tail*
Gross Margin (%) Opex (As % of sales)Most Vulnerable to
Online DistruptionLeast Vulnerable to
Online Distruption

Page | 3
Fashion & Lifestyle Thematic
= …Market share loss (for department stores/legacy brands) to e-tailers (pure play dept stores and select brands most
vulnerable on this equation)
Source: Company, HSIE Research, Apparel retailers representing ~2/3rds the organized pie
In Apparel, top continues to fragment Category-wise growth rate (%)
Source: Company, HSIE Research, Note: RR: Reliance Retail Source: Company, HSIE Research
Value fashion has seen the fastest area addition across
formats
Did you know? The annual fund raise of e-tailers is
>5x the cumm. cash reserves of 27 F&L retailers
Source: Company, HSIE Research Source: Company, HSIE Research, 27 offline F&L retailers
(representing ~2/3rds the organized pie) used as base
Fast
Fashion
2
Private
labels
6
Brands
32
Ethnic wear
8
Value /Off-
price
27
Dept. stores
24
Myntra
/Jabong*
0
Fast Fashion
4 Private
labels
5
Brands
21
Ethnic wear
7 Value /Off-
price
43
Dept. stores
13
Myntra
/Jabong*
7
40 43 41 42 38
34 35 33 31
28
49 47 46 43 41
-
10
20
30
40
50
60
FY16 FY17 FY18 FY19 FY20
Top 6 market share Top 5 market share (ex-RR)
Top 5 rel. market share (ex-RR) 40
32
22
15
7 7
-
10
20
30
40
50 E
-Co
mm
Val
ue/
Off
-Pri
ce
Fas
t F
ash
ion
Eth
nic
wea
r
Bra
nd
s
Dep
t S
tore
s
5-yr revenue CAGR (%)
30 34
67
(64) (73)
51
(100)
(50)
-
50
100
150
Amazon
raised
Flipkart
raised
Amazon
cash burn
Flipkart
cash burn
Cumm.
cash of
offline
universe
FY17 FY18 FY19 FY20
11
5
18
5
19
-
10
20
30
40
50
F&G Dept Stores Fast Fashion Brands Value
Fashion
Area (mn sq. Ft)

Page | 4
Fashion & Lifestyle Thematic
Table of Contents
Online stack keeps becoming more potent ......................................................................... 5
India’s increasing relevance in global e-tailer’s top-line, profitability and capital
allocation decisions .......................................................................................................... 5
Indian e-tailers’ FY20/FY21E performance ................................................................... 6
E-tailers’ growth vs unit economics – Not a binary decision anymore! .................. 6
‘Prone-to-Disruption’ framework for offline remains validated! .................................... 9
FY17-20 category-wise performance and FY21 recovery ................................................ 11
Multi-brand department stores .......................................................................................... 11
Ethnic wear ............................................................................................................................ 13
Brands ..................................................................................................................................... 15
Fast fashion/private labels ................................................................................................... 17
Value fashion ......................................................................................................................... 19
Second wave - Final nail in the coffin for category tails! ................................................. 21
Peer valuation ........................................................................................................................ 23

Page | 5
Fashion & Lifestyle Thematic
Online stack gets more potent
India remains key to global retail dominance: Over the past decade, India has
singularly become the most important piece to solve for in the ‘global retail
dominance’ puzzle as most global biggies have lost the retail war in China to
locally bred Alibaba and Tencent. This can be easily gauged by India’s increasing
relevance in Amazon/Walmart’s (1) topline/profitability (2) capital allocation
decisions. Note: Domestic retailer Reliance Retail, too, remains aggressive in price
action and supply chain investments post its recent INR 473bn fund raise.
#1. India’s increasing relevance in global e-tailers’ topline/profitability:
Amazon international’s Rest of the World (RoW) segment has consistently
outpaced its operations in other countries over CY15-20 (grew at 44% CAGR;
now constituting 12% of Amazon International’s topline). Walmart’s Indian
entities too have seen a meaningful jump in contribution to topline.
RoW (including India) now accounts for 12% of Amazon’s top-line, has grown at 44% CAGR over CY15-20
Source: Company, HSIE Research
#2. India’s increasing relevance in global e-tailers’ capital allocation decisions:
Amazon has meaningfully expanded (post a soft CY18/19) its international
fulfilment centre footprint (36% CAGR vs 44% revenue CAGR in CY20). A sizeable
share of this footprint expansion is likely to have come from India. This rings true for
Walmart-backed Flipkart too.
India is key to Global Retail dominance. Global e-tailers continue to increase their focus on the country for
growth. Movement in capital investments towards 1. supply chain, 2. broadening of the online stack
corroborates this trend.
Interestingly, growth doesn’t come at the cost of incremental unit economics. GM/contribution margins
(ability to absorb ‘bad costs’) continue to improve for e-tailers as revenue mix improves.
Focus to improve profitability of the Fashion & Lifestyle (F&L) segment is palpable (Myntra’s performance
corroborates this trend). We suspect that improving mix coupled with the ever-increasing commission-
based services of e-tailers is making the online stack more potent with each passing year.
Management commentary across key Indian entities of Amazon and Walmart:
Amazon
“Company continues to invest in, opening new fulfilment centres, and technology advancement”
“Company has continued to invest heavily on building infrastructure and logistics business to expand keeping in
mind the future growth. Therefore, expenses grew considerably. It will keep on investing in further expansion and
technology”
Flipkart
“Technology, infrastructure and supply chain through Ekart were the top investment areas for Flipkart in the past few
years as will be in the next few years.
- Kalyan Krishnamurthy, Chief Executive Officer, Flipkart
30
20 24
20
44
29
-
10
20
30
40
50
US Germany UK Japan RoW Total
US Germany UK Japan RoW Total
4 5 5 7 7 7 8 10 11 11 12
-
20.0
40.0
60.0
80.0
100.0
CY
10
CY
11
CY
12
CY
13
CY
14
CY
15
CY
16
CY
17
CY
18
CY
19
CY
20
United States Germany UK Japan RoW

Page | 6
Fashion & Lifestyle Thematic
Amazon’s (international business) capital commitments in CY20, sizably increased with improving unit economics;
India has had a crucial part to play in both
Source: Company, HSIE Research
India’s share in Walmart’s topline is estimated to have increased too courtesy
Flipkart
Source: Company, HSIE Research
Indian e-tailers’ FY20/FY21E topline performance: While growth did moderate
for both Amazon and Flipkart’s Indian units in FY20 (10/13% respectively) due to
slower customer adoption to regulatory changes in business/ownership
framework dictated by Press Note 2, channel checks suggest both have bounced
back well in FY21 (HSIE: 45-50% topline growth). Interestingly, growth doesn’t
come at the cost of incremental unit economics. Amazon’s international
operation is now profitable (USD. 0.7bn). We estimate India to have
contributed ~30% to Amazon international’s CY20 profit swing.
E-tailers’ growth vs unit economics – not a binary decision anymore!
Indian e-tailers have meaningfully stepped up focus on improving profitability of
their F&L vertical (case in point: Myntra). This, along with the ever-increasing
commission/ad-based/3P seller services of e-tailers, is making the online stack
more potent with each passing year.
(1) Gross margins for e-tailers have significantly improved (4-13pp over FY17-20)
with scale as (a) sourcing margins on private labels and partner brands and (b)
skew of fresh brand assortment continues to improve. The latter is a consequence
of weak offline retailers (with weak balance sheets) attempting to release cash
(discussed in subsequent chapters). Note: contribution margins for both e-tailers
are now in the positive. Amazon has done a better job on profitability than
Flipkart.
-4
-3
-2
-1
-
1
2
3
4
CY14 CY15 CY16 CY17 CY18 CY19 CY20
Amazon International EBITDA margin (%)
6
24 23 21
13
40
10
24 21
2 6
36
-
10
20
30
40
50
CY15 CY16 CY17 CY18 CY19 CY20
International Retail (Rev growth %)
International Retail (FFC Area growth %)
3
4
6 6
9
-
2
4
6
8
10
-
2,000
4,000
6,000
8,000
10,000
12,000
FY17 FY18 FY19 FY20 FY21E
Walmart (Indian entities) revenue India (As % of Walmart Int revenue)

Page | 7
Fashion & Lifestyle Thematic
(2) ‘Bad costs’ absorption (such as fulfillment costs, returns and parts of S&M
expenses) has meaningfully improved courtesy scale and higher GMs (pre-
COVID too). The pandemic has only helped in increasing AoVs, minimising
CACs thereby improving profitability further.
(3) E-tailers have been sweating their assets better with each passing year.
Indian e-tailers continues to improve on scale, profitability, and efficiency
Source: Company, HSIE Research, All entities (Ex-AWS). Note:
Financials are unadjusted for Related party transactions, hence,
inferences are strictly directional. Base revenue indexed to INR 100
Source: Company, HSIE Research, Note: Financials are unadjusted for
related party transactions, hence, inferences are strictly directional.
Base revenue indexed to INR 100
Reimbursements for damages of fulfilled inventory for a key e-tailer has significantly dropped over FY17-20. This
‘bad’ cost is likely to meaningfully decline in FY21 too as returns have reduced during the pandemic
Source: Company, HSIE Research
E-tailers have been sweating their assets better with each passing year
Source: Company, HSIE Research, Note: Financials unadjusted for Related party transactions, hence, inferences are strictly directional
16
15
-
10
20
30
40
FY17 FY18 FY19 FY20
WC/sales (%)
Amazon India group Flipkart India group (Ex-PhonePe)
22
12
-
10
20
30
40
FY17 FY18 FY19 FY20
(WC + Capex)/sales (%)
Amazon India group Flipkart India group (Ex-PhonePe)
5
10
15
20
25
FY16 FY17 FY18 FY19 FY20
Reimbursement for damages of fulfilled inventories (As % of sales)
-21
-15.0
-30
-25
-20
-15
-10
-5
-
FY
17
EB
ITD
A
GP
M in
crea
se
FF
C/O
ther
s
(As
% o
f re
v)
S&
M
(As
% o
f re
v)
Em
plo
yee
ex
p
Oth
ers
(As
% o
f re
v)
FY
20
EB
ITD
A (
%)
Flipkart's profitability
INR. 255INR 100
-28
-11
-30
-25
-20
-15
-10
-5
-
FY
17
EB
ITD
A
GP
M in
crea
se
FF
C/O
ther
s
(As
% o
f re
v)
S&
M
(As
% o
f re
v)
Em
plo
yee
ex
p
Oth
ers
(As
% o
f re
v)
FY
20
EB
ITD
A (
%)
Amazon India's profitability
INR. 100 INR. 230

Page | 8
Fashion & Lifestyle Thematic
Myntra continues to improve terms of trade to woo brands and 3P sellers alike
It is important to appreciate that, from a capital allocation point of view, F&G (a low AoV, Low GM category) is
expected to attract a big chunk of Walmart/Amazon’s capital in India. Hence, if the groups were to attempt at
maintaining cash burn, profitability improvement of their respective F&L verticals is an imperative. Hence at the
risk of being prescriptive, a higher focus on brand sales and private labels makes more sense than being aggressive
on the low AOV, low margin categories. This narrative already seems to be in the works (case in point: Myntra’s
performance).
Myntra continues to better terms of trade to woo brands: Since Walmart’s acquisition of Myntra, there seems to be
a clear focus on increasing (1) fresher assortment from brands and (2) private labels in Myntra’s revenue mix. We
suspect this is being done by wooing more brands with better terms of trade. This can be seen in Myntra’s
improving gross and contribution margins.
Channel checks suggest, during the pandemic, offline retailers’ desperation to liquidate fresher inventory across
categories has only helped e-tailers’ profitability (as online AoVs and GMs increased, and CAC decreased). In its
CY20 annual report, Walmart attributed the GM increase primarily to Flipkart’s improving mix (along with
reduced fuel sales in the US).
Better terms of trade for brands and 3P sellers could make Myntra/other big F&L e-tailers partners of choice over
older pipes like multi-brand department stores and other inefficient formats. This could, in turn, translate into
better sourcing margins and improved competitiveness for e-tailers vis-a-vis weak private labels and brands, which
in turn could lead to reduced footfalls for the weak offline operators and, hence, more pressure on their already
weak cash position.
Myntra's performance over FY18-20 Myntra seems to be bettering terms of trade to woo
brands/3P sellers
Source: Company, HSIE Research, Revenue is indexed to 100 in base
year
Source: Company, HSIE Research
100
159
26
-2
-23 -50
-
50
100
150
200
Revenue GPM (%) CM (%) EBITDA (%)
FY18 FY19 FY20
-
50
100
150
200
Inventory
days
Receivable
days
Payable days Core CC
cycle (days)
FY18 FY19 FY20

Page | 9
Fashion & Lifestyle Thematic
‘Prone-to-disruption’ framework remains validated!
Consolidation is a foregone conclusion
Ethnic wear
‘Prone-to-disruption’ framework remains validated: In the backdrop of e-tailers
training eyes on growth and improving profitability from their F&L vertical, it is
key to assess which categories are more prone to disruption. Our ‘Prone-to-
Disruption’ framework remains validated. Based on the framework, multi-brand
departmental stores, ethnic wear and weak private labels seem most prone on
this equation, while value fashion retail seems nearly insulated.
‘Prone-to-Disruption’ framework in apparel:
Low differentiation and sales velocity + high AoV + high GM + high-cost
structures + increasing vendor support = market share loss to e-tailers.
Let’s look at how different apparel categories stack up on this framework and
how they have their fared over the past 4-5 years – a phase when F&L e-tailers
came into their own.
No differentiation, low sales velocity and high AoV
Source: Company, HSIE Research, Note: Revenue per sq. ft are estimates for unlisted companies
+
Against the backdrop of e-tailers training eyes on growth and improving
profitability from their F&L vertical, it is key to assess which categories are more
prone to disruption. In our initiating coverage report titled ‘Who’s moving the
Retail Flywheel?’, we introduced a framework to assess this trend. It remains
validated till date.
The framework: low differentiation, low sales velocity + high AoV + high GM +
high cost structures + increasing vendor support = market share loss for e-
tailers.
Based on the framework, multi-brand departmental stores, ethnic wear and
weak private labels seem most prone to disruption on this equation, while value
fashion retail seems nearly insulated.
Did you know? The annual cash position of our apparel universe (25+ F&L
retailers accounting for 2/3rds of the organised pie) < 20% of the annual fund
raise of key e-tailers - capital divide is just too huge!
(7)5 6 4
13
(2) (4)
(24)(16)
1 7
(5)3 2
8 (0) 0
(9)3 (1)
(12)(1)
9 12 3
(17)(9)
(17)(10)
(30)(20)(10)-10 20
-10,000 20,000 30,000 40,000 50,000
LI
(Dep
t S
tore
)
ST
OP
FL
FL
-Cen
tra
l
-Bra
nd
Fa
cto
ry
TC
NS
Clo
thin
g
Co
mp
an
y A
Co
mp
an
y B
Co
mp
an
y C
Co
mp
an
y D
-In
dit
ex I
nd
ia
Co
mp
an
y B
Co
mp
an
y C
Co
mp
an
y D
SS
IPL
Ra
ym
on
d
Ma
du
ra
AF
L b
ran
ds
Co
mp
an
y E
VM
AR
T
V2
Ret
ail
Pa
nta
loo
ns
Zu
dio
Co
mp
an
y E
Co
mp
an
y F
Co
mp
an
y G
Co
mp
an
y H
Co
mp
an
y I
Co
mp
an
y J
Dept Stores Ethnic wear Fast Fashion Brands Value Fashion
Revenue per sq. ft (Rs) RPSF (5-yr CAGR)
AOV: Rs. 2300-3300 AOV: Rs. 3000-4000 AOV: Rs. 2000-4000 AOV: Rs. 3000-4000 AOV: Rs. 700-1800

Page | 10
Fashion & Lifestyle Thematic
High gross margins and cost structure…
Source: Company, HSIE Research
+ Increasing vendors’ crutch
Source: Company, HSIE Research
= …market share loss (for department stores/ethnic wear/weak brands) to e-tailers
Source: Company, HSIE Research
Fast
Fashion
2
Private
labels
6
Brands
32
Ethnic wear
8
Value /Off-
price
27
Dept. stores
24
Myntra
/Jabong*
0
Fast Fashion
4 Private
labels
5
Brands
21
Ethnic wear
7 Value /Off-
price
43
Dept. stores
13
Myntra
/Jabong*
7
51
89
92
102
42
65
50
34
51
130
115
97
108
37
68
38
33
15
160
138
125
95
39
57
43
29
16
248
233
182
109
55
52
28
43
- 40 80
120 160 200 240 280
My
ntr
a/Ja
bo
ng
*
ST
OP
FL
FL
Arv
ind
Fas
hio
n
AB
FR
L
TC
NS
Clo
.
Lif
esty
le I
nt
V2
Ret
ail
V-M
AR
T
Tre
nt
Rel
ian
ce R
etai
l
Payable Days
FY18 FY19 FY20 2HFY21
42
45
42
34
65
73
60
62
67
46
56
39
59
50
55
54
60
45
57
46
40
32
28
40
36
25
33
32
26
33 34 36 27
57
39
54 51 57 53 45
28
52 46
56 48
42 40 49
40 37 24 24
31 25 28 26 22
48
-10 20 30 40 50 60 70
-
20
40
60
80
Lif
esty
le I
nt
Lif
esty
le (
Dep
t)
Sh
op
per
s S
top
FL
FL
TC
NS
Clo
thin
g
Co
mp
an
y A
Co
mp
an
y B
Co
mp
an
y C
Co
mp
an
y D
Co
mp
an
y E
Wes
tsid
e
-In
dit
ex I
nd
ia
Co
mp
an
y A
Co
mp
an
y B
AF
L b
ran
ds
-Ma
du
ra
Kew
al K
ira
n
Ra
ym
on
d
Co
mp
an
y A
Pa
nta
loo
ns
Zu
dio
VM
AR
T
V2
Ret
ail
Co
mp
an
y A
Co
mp
an
y B
Co
mp
an
y C
Co
mp
an
y D
Co
mp
an
y E
E-t
ail
*
Dept Stores Ethnic Wear Fast Fashion Brands Value Fashion E-
tail*
Gross Margin (%) Opex (As % of sales)Most Vulnerable to
Online DistruptionLeast Vulnerable to
Online Distruption

Page | 11
Fashion & Lifestyle Thematic
FY17-20 category-wise performance/FY21 recovery
Multi-brand department stores
Sales velocity: Multi-brand department stores predominantly sell 3P brands
(no/low product differentiation). Private labels form an insignificant part of the
portfolio. The format’s sales velocity typically ranges between INR 8,500-
12,500/sq. ft (among the lowest across apparel formats) and has remained under
pressure over FY17-20 (as highlighted in the chart below), given their over-
indexation to (1) a predominately urban consumer base and (2) Malls. Migration
of this urban cohort to e-tail has been the fastest in apparel. Fulfilment cost – rent
arbitrage has now evidently shifted in favour of online platforms in these high
population density urban districts. Healthy AoVs of this format (INR 2,300-3,300)
make this format prime for online disruption.
GMs and cost of retailing continue to rise, making the format less competitive
with each passing year. The format remains the worst-hit by the pandemic.
Vendor support: Creditor days have untenably increased over the years and cash
position remains extremely weak. While STOP has raised ~INR 3bn via rights
issue, this is at best survival capital and not growth capital. Hence, over the next
few years, focus is likely to be on fixing working capital, while growth takes a
backseat. Meanwhile, e-tailers continue to sweeten the deal for vendors.
Revenue growth and sales velocity remain uninspiring for multi-brand department stores
Source: Company, HSIE Research
Department stores remain over-indexed to the urban consumer base
PCI/Store
Distribution (%)
Population
(mn)
District
(#)
Co. A
(%)
Districts
(#)
Shoppers
Stop (%)
Districts
(#)
Central
(%)
Districts
(#)
Brand
Factory (%)
Districts
(#)
Planet
Fashion
(%)
Districts
(#)
<100K 371 130 7.0 4 2.5 1 2.9 1 3.8 3 18.9 33
100-150K 141 54 11.3 7 11.1 7 5.7 2 8.8 7 19.3 24
150-200K 107 40 21.1 10 19.8 10 11.4 3 25.0 10 19.7 29
200-250K 68 25 11.3 7 2.5 2 8.6 3 6.3 4 13.3 18
250-300K 27 5 11.3 3 6.2 2 25.7 3 7.5 1 9.9 5
300-500K 38 8 26.8 4 35.8 4 34.3 4 43.8 4 12.0 7
500K+ 20 3 11.3 3 22.2 3 11.4 3 5.0 1 6.9 2
` 771 265 100 38 100 29 100 19 100 30 100 118
16 7
14 5
19 15 5
11 5 4
14
1
(4)
11 1
(61)(70)(80)
(60)
(40)
(20)
-
20
40
SS (Dept Store) Central Co. A
Revenue growth (%)
FY16 FY17 FY18 FY19 FY20 9MFY21
6
(0)
(3)(4)
(2)
-
2
4
6
8
Central SS (Dept Store) Co. A
4-yr Rev/sq. ft CAGR (%)

Page | 12
Fashion & Lifestyle Thematic
Gross margins and cost of retailing are on the rise, thereby ceding competitiveness to the online channel
Source: Company, HSIE Research
Vendor support has reached untenable levels; hence, over the next few years, focus would likely be on fixing
working capital, while growth takes a backseat
Source: Company, HSIE Research
Given the wafer-thin cash position, fixing working capital is likely to take precedence over growth
Source: Company, HSIE Research
428
(10)
280
(56)
17
(7)(100)
-
100
200
300
400
500
SS (Dept Store) Central Co. A
FY17-20 GPM expansion/(contraction) - Bps
FY17-20 EBITDAM expansion/(contraction)-Bps
484
(27)
287
(100)
-
100
200
300
400
500
600
SS (Dept Store) -Central Co. A
FY17-20 Opex (As % of sales) expansion/(contraction)- Bps1
04
3,9
01
13
4 70
7
2,8
85
87
4
2,7
58
2,2
21
1,9
49
1,4
76
25
3
1,0
98
-
1,000
2,000
3,000
4,000
5,000
SS (Dept Store) Central Co. A
Cash & Equivalents (INR. mn)
FY16 FY17 FY18 FY19 FY20 1HFY21
6 4
19
4 2
26
8 9
29
9 11
21
(19)
5
21
(30)
(20)
(10)
-
10
20
30
40
STOP FLFL Co. A
RoCE (%)
FY16 FY17 FY18 FY19 FY20
91
38
145
64 50
89
26
(12)
56
92
56
162 138
36 29
190
274 248
233
(58)
41
(100)
(50)
-
50
100
150
200
250
300
Co. A STOP FLFL Co. A STOP FLFL Co. A STOP FLFL
Inventory + Receivables (Days) Payable Days (x) Core CC Cycle
FY18 FY19 FY20 1HFY21

Page | 13
Fashion & Lifestyle Thematic
Ethnic wear
Primed for online disruption: Organised ethnic wear as a category remains
highly fragmented with the Top 5 constituting <7% of the category. Hence, even
the top hasn’t really achieved meaningful scale yet.
The relatively higher (than department store) sales velocity (INR10,000-14,000/sq.
ft) is underpinned by a high AoV (INR. 3,000-4,000), Hence, sensitivity to a
footfall cut is higher for this category. This, coupled with high GM (60-65%), high
and increasing cost of retailing (50-60%) and a deteriorating working capital
cycle, is a perfect recipe to cede share to the online channel and it has.
The consistent drop in sales velocity (0 to -10% CAGR) across all offline
distribution channels (EBOs, LFS, MBOs) over the past four years even for the
category leader corroborates the loss in share/pricing power to e-tail. Note:
category tails are worse off.
Meanwhile, e-tailers have been aggressive in introducing their ethnic wear
private labels over the past few years.
Rental expense as a percentage of owned EBO sales for women’s ethnic wear
retailers are grossly higher (25-40%) vs online fulfilment costs (8-11%). Hence,
this category seems primed for online disruption. The format remains amongst
the worst-hit along with department stores by the pandemic.
Vendor support While still manageable, creditor days have been rising steadily
for this cohort to cushion the impact of rising inventory + receivable days. This,
along with weak cash position of the cohort, could translate into desperation to
liquidate inventory ergo compromised profitability.
There has been a constant drop in topline growth and sales velocity across all offline distribution channels for ethnic
wear
Source: Company, HSIE Research
Most ethnic retailers seem to be hiding behind high GMs as cost of retailing has inched up meaningfully over FY17-20
Source: Company, HSIE Research
0
(1)
(7)(10) (10)
(28)(30)
(25)
(20)
(15)
(10)
(5)
-
5
Co. B Co. E Co. C TCNS
Clo.
Co. A Co. D
2-yr Revenue/EBO CAGR (%)
20
5
24
5
28
3
(66
9)
(29
7)
(51
9)
(33
6)
15
(29
7)
(63
2)
(1,8
50
)
49
2
(2,000)
(1,500)
(1,000)
(500)
-
500
1,000
TCNS
Clo.
Co. A Co. B Co. C Co. D Co. E
FY17-20 GPM expansion/(contraction) - Bps
FY17-20 EBITDAM expansion/(contraction)-Bps
541
957
372
(202)
1,553
(1,010)(1,500)
(1,000)
(500)
-
500
1,000
1,500
2,000
TCNS
Clo.
Co. A Co. B Co. C Co. D Co. E
FY17-20 Opex (As % of sales) expansion/(contraction)- Bps
61
13
(6)
29
-
22
0
(5)
2
(1)
(14)
14
(55)(80)
(60)
(40)
(20)
-
20
40
60
80
TCNS
Clo.
Co. A Co. B Co. C Co. D Co. E
Revenue growth (%)
FY16 FY17 FY18 FY19 FY20 9MFY21

Page | 14
Fashion & Lifestyle Thematic
Core cash conversion cycle has been deteriorating with time for this cohort
Source: Company, HSIE Research
…this is reflected in the weak cash position and deteriorating return profile across the cohort
Source: Company, HSIE Research
11
6
16
1 85
0
37
6
1
17
39
2,3
04
49
0
3
4,4
05
1,4
58
-
1,000
2,000
3,000
4,000
5,000
TCNS
Clothing
Co. A Co. B Co. C Co. D Co. E
Cash & Equivalents (INR. mn)
FY16 FY17 FY18 FY19 FY20 1HFY2151
27
17 14
-
32
50
6
(6)
9 16
30 28
15 10
3
12
25 29
8 8 14
5
21 14
8 5
13
(13)
22
(20)
-
20
40
60
TCNS
Clothing
Co. A Co. B Co. C Co. D Co. E
RoCE (%)
FY16 FY17 FY18 FY19 FY20
13
9
16
0
10
9
11
9
98
19
5
42
20
14
22
2 2
1
98
14
0
95
97
96
17
4
16
1 19
8
12
9
15
1
13
2
20
2
39
34
27
56
60
19
12
2 16
4
10
2
95
71
18
2
25
3
- - - - -
55
19
7
-
50
100
150
200
250
300
TCNS
Clo.
Co. A Co. B Co. C Co. D Co. E TCNS
Clo.
Co. A Co. B Co. C Co. D Co. E TCNS
Clo.
Co. A Co. B Co. C Co. D Co. E
Inventory + Receivables (Days) Payable Days (x) Core CC Cycle
FY18 FY19 FY20 1HFY21

Page | 15
Fashion & Lifestyle Thematic
Brands
Differentiation and topline performance: While brands as a cohort have been
relatively more stable than department stores and women’s ethnic wear in
topline performance, given a reasonable pull (high differentiation), especially in
metros, performance leaves one wanting for more, given the gross under-
penetration of the category.
Sales velocity and GMs at INR 14,000-18,000/sq. ft, while healthy, doesn’t quite
justify the rising cost of retailing (up 1 to 14pp over FY17-20) and many brands
have been found hiding behind higher gross margins.
This coupled with a deteriorating working capital and increasing payables
support means that most in the cohort are likely to focus on fixing their balance
sheets, while growth takes a backseat over the next 1-2 years.
Also, high AoVs (INR 3,000-4,000) could be at risk if brands continue to lose
consumer wardrobe-share to fast fashion and strong private labels.
Re-capitalised balance sheets (ABFRL) are better off. Strong brands may perhaps
be able to switch to a relatively leaner working capital by reducing lead times
(fast fashion-esque). However, execution is key.
For the tail, RoCEs have dropped below cost of capital (pre-COVID too) and cash
position remains weak.
For a cohort which should by definition have higher consumer pull, growth remains lackluster
Source: Company, HSIE Research
Most brands seem to be hiding behind higher gross margins as cost of retailing has consistently increased
Source: Company, HSIE Research
7 7 7 12
-
10
3 4
(7)
2
21
9 9
(0) (1)
29
12 13 11 14
9 8 13
8
(6)
11 5
(10)
8
(20)
(10)
-
10
20
30
40
Madura Raymond Monte
Carlo
Kewal
Kiran
AFL
Brands
Co. A
Revenue growth (%)
FY16 FY17 FY18 FY19 FY20
(15
0)
23
3
38
9
1,1
04
(13
0)
17
3
(25
5)
(30
)
37
9
(32
3)
(96
5) (5
43
)
(1,500)
(1,000)
(500)
-
500
1,000
1,500
Madura Monte Carlo AFL Brands
FY17-20 GPM expansion/(contraction) - Bps
FY17-20 EBITDAM expansion/(contraction)-Bps
105
264
10
1,428
835 717
-
200
400
600
800
1,000
1,200
1,400
1,600
Madura Raymond Monte
Carlo
Kewal
Kiran
AFL
Brands
Co. A
FY17-20 Opex (As % of sales) expansion/(contraction)- Bps
6
2
(0)(2)
(9)(10)
(8)
(6)
(4)
(2)
-
2
4
6
8
Co. B Madura Co. A Raymond AFL
Brands
4-yr Rev/sq. ft CAGR (%)

Page | 16
Fashion & Lifestyle Thematic
Working capital has deteriorated too and is likely to be the focus over FY21-23 and growth will take a backseat or be
over-reliant on online channel, which could lead to reduction in pricing power
Source: Company, HSIE Research
Cash position for the tail is weak Return ratios have slipped below cost of capital for
most
Source: Company, HSIE Research Source: Company, HSIE Research
19
2
5,3
32
1,2
08
1,7
97
25
0 1
,86
5
5,9
25
1,1
41
2,6
73
52
1
-1,000 2,000 3,000 4,000 5,000 6,000 7,000
AB
FR
L
Ra
ym
on
d
Mo
nte
Ca
rlo
Kew
al K
ira
n
AF
L B
ran
ds
Co
. A
Cash & Equivalents (INR. mn)
FY16 FY17 FY18 FY19 FY20 1HFY21
15
7 14
21
2
13 9
(2)
12 15
(8)
8
(20)
(10)
-
10
20
30
40
50
AB
FR
L
Ra
ym
on
d
Mo
nte
Ca
rlo
Kew
al K
ira
n
AF
L
Co
. A
RoCE (%)
FY16 FY17 FY18 FY19 FY20
11
4
16
7 23
0
15
0
18
7
13
6
10
2
70
70
35
92
44
12
97
16
1
11
5
94
92
86
19
2
25
5
29
6
25
5 3
49
-
10
9
11
0
87
37
18
2
82
14
6 20
9
21
8
16
7
-
100
200
300
400
AB
FR
L
Ra
ym
on
d
Mo
nte
Ca
rlo
Kew
al K
ira
n
AF
L
Co
. A
AB
FR
L
Ra
ym
on
d
Mo
nte
Ca
rlo
Kew
al K
ira
n
AF
L
Co
. A
AB
FR
L
Ra
ym
on
d
Mo
nte
Ca
rlo
Kew
al K
ira
n
AF
L
Co
. A
Inventory + Receivables (Days) Payable Days (x) Core CC Cycle
FY18 FY19 FY20 1HFY21
Page | 17
Fashion & Lifestyle Thematic
Fast fashion/private labels
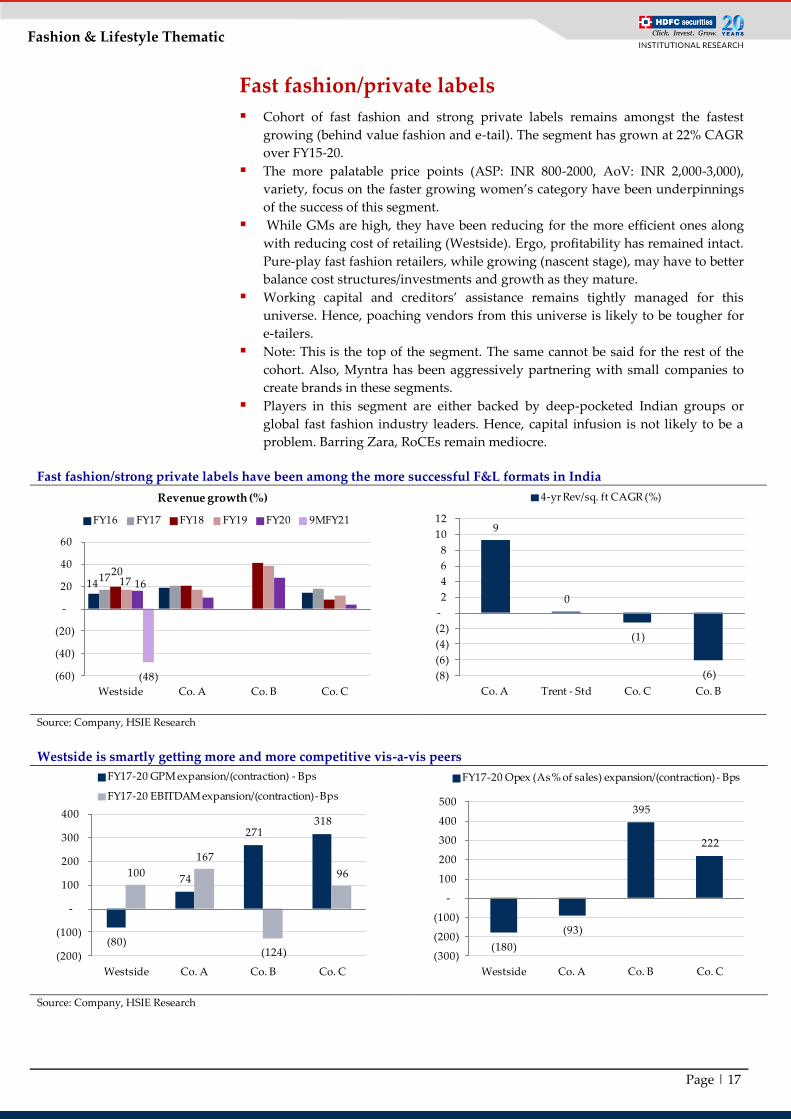
Cohort of fast fashion and strong private labels remains amongst the fastest
growing (behind value fashion and e-tail). The segment has grown at 22% CAGR
over FY15-20.
The more palatable price points (ASP: INR 800-2000, AoV: INR 2,000-3,000),
variety, focus on the faster growing women’s category have been underpinnings
of the success of this segment.
While GMs are high, they have been reducing for the more efficient ones along
with reducing cost of retailing (Westside). Ergo, profitability has remained intact.
Pure-play fast fashion retailers, while growing (nascent stage), may have to better
balance cost structures/investments and growth as they mature.
Working capital and creditors’ assistance remains tightly managed for this
universe. Hence, poaching vendors from this universe is likely to be tougher for
e-tailers.
Note: This is the top of the segment. The same cannot be said for the rest of the
cohort. Also, Myntra has been aggressively partnering with small companies to
create brands in these segments.
Players in this segment are either backed by deep-pocketed Indian groups or
global fast fashion industry leaders. Hence, capital infusion is not likely to be a
problem. Barring Zara, RoCEs remain mediocre.
Fast fashion/strong private labels have been among the more successful F&L formats in India
Source: Company, HSIE Research
Westside is smartly getting more and more competitive vis-a-vis peers
Source: Company, HSIE Research
9
0
(1)
(6)(8)
(6)
(4)
(2)
-
2
4
6
8
10
12
Co. A Trent - Std Co. C Co. B
4-yr Rev/sq. ft CAGR (%)
(80)
74
271 318
100
167
(124)
96
(200)
(100)
-
100
200
300
400
Westside Co. A Co. B Co. C
FY17-20 GPM expansion/(contraction) - Bps
FY17-20 EBITDAM expansion/(contraction)-Bps
(180)
(93)
395
222
(300)
(200)
(100)
-
100
200
300
400
500
Westside Co. A Co. B Co. C
FY17-20 Opex (As % of sales) expansion/(contraction)- Bps
14 17
20 17 16
(48)(60)
(40)
(20)
-
20
40
60
Westside Co. A Co. B Co. C
Revenue growth (%)
FY16 FY17 FY18 FY19 FY20 9MFY21

Page | 18
Fashion & Lifestyle Thematic
Working capital in this cohort remains tightly managed for most
Source: Company, HSIE Research
Backed by deep-pocked Indian conglomerates or global
fast fashion retailers, cash infusion is unlikely to be an
issue
Ex-Zara, return profile remains mediocre for now
Source: Company, HSIE Research Source: Company, HSIE Research
10
29
1
(15)
8
16
7
(1)
10
24
11 17
11
17 12
25
11
20
6
(0)
(20)
(10)
-
10
20
30
40
Trent - Std Co. A Co. B Co. C
RoCE (%)
FY16 FY17 FY18 FY19 FY20
5,3
21
44
3
22
7
16
5
33
4
9,1
03
2,3
39
82
0
5,3
41
-
2,000
4,000
6,000
8,000
10,000
Westside Co. A Co. B Co. C
Cash & Equivalents (INR. mn)
FY16 FY17 FY18 FY19 FY20 1HFY21
62
37
65 66
34 24
11
36 28
13
54
30 37
62
100
19 13
49
18
49 52
83
43 40
-
20
40
60
80
100
120
Trent -
Standalone
Co. A Co. B Co. C Trent -
Standalone
Co. A Co. B Co. C Trent -
Standalone
Co. A Co. B Co. C
Inventory + Receivables (Days) Payable Days (x) Core CC Cycle
FY18 FY19 FY20 1HFY21

Page | 19
Fashion & Lifestyle Thematic
Value fashion
Value fashion constitute ~54% of the Rs. 3.5tn Indian apparel market and has the
biggest target group in India. Top retailers account for a meager 13% of the value
fashion (VF) market.
Format remains amongst the most successful (22% revenue CAGR over FY16-20)
& profitable ones across apparel retail
Low AoVs (INR. 700-1,800), low GMs (30-40%) and cost of retailing (25-30%)
have kept this segment largely out of reach for e-tailers as it is extremely difficult
to be profitable online in this category even at scale. The deterrent is the big cost
arbitrage - Rent (4-8%) vs Online Fulfilment (10-15%).
However, short of a few disciplined operators (VMART), growth for the tail has
come at significant deterioration in unit economics and working capital position.
Given that cash for expansion remains absent for the VF tail, we suspect focus
will shift to liquidating inventory and paying of creditors. This also presents an
opportunity for stronger VF retailers such as V-MART to scout for inorganic
growth. V-MART’s recently raised INR 3.7bn which could come in handy for the
same.
While V-MART remains disciplined, value fashion tail’s growth has come at the cost of unit economics
Source: Company, HSIE Research
Ex-Pantaloons, cost of retailing has been on its way up for value fashion retailers
Source: Company, HSIE Research
(600)
(400)
(200)
-
200
400
600
Pa
nta
loo
ns
VM
AR
T
V2
Ret
ail
Rel
ian
ce F
&L
Co
. A
Co
. C
Co
. D
Co
. F
Co
. G
FY17-20 GPM expansion/(contraction) - Bps
FY17-20 EBITDAM expansion/(contraction)-Bps
(359)
293 332
(200) (198)
597
(74)
234
(58)
(600)(400)(200)
-200 400 600 800
Pa
nta
loo
ns
VM
AR
T
V2
Ret
ail
Rel
ian
ce F
&L
Co
. A
Co
. C
Co
. D
Co
. F
Co
. G
FY17-20 Opex (As % of sales) expansion/(contraction)- Bps
(70)
(20)
30
80
130
Pa
nta
loo
ns
VM
AR
T
V2
Ret
ail
Rel
ian
ce F
&L
Co
. A
Co
. C
Co
. D
Co
. F
Co
. G
Revenue growth (%)
FY16 FY17 FY18 FY19 FY20 9MFY21 9 7
2 0 0
(1)
(9)(11) (11)
(12) (13)(15)
(10)
(5)
-
5
10
15 Z
ud
io
Rel
ian
ce F
&L
FB
B
Pa
nta
loo
ns
Co
. A
VM
AR
T
Co
. F
Co
. C
Co
. D
Co
. E
V2
Ret
ail
4-yr Rev/sq. ft CAGR (%)

Page | 20
Fashion & Lifestyle Thematic
Working capital management for the tail remains messy, focus will be on liquidating inventory as soon as possible to
pay off creditors
Source: Company, HSIE Research
Cash position and return profile for the tail remains weak
Source: Company, HSIE Research
36
6
71
33
15
24
7
12
9
67
5
90
49
25
53
2
80
15
5
-
200
400
600
800
1,000
VM
AR
T
V2
Ret
ail
Co
. C
Co
. D
Co
. E
Co
. F
Co
. G
Cash & Equivalents (INR. mn)
FY16 FY17 FY18 FY19 FY20 1HFY21
11
14
18
12
4
27
-4
8
18
3
21
(3)
-
21
14
(60)
(40)
(20)
-
20
40
60
VM
AR
T
V2
Ret
ail
Co
. C
Co
. D
Co
. E
Co
. F
Co
. G
RoCE (%)
FY16 FY17 FY18 FY19 FY20
92
10
5
11
8
71
11
0
78
16
4
50
65
11
3
40
49
23
17
0
42
39
5 3
1 62
55
(6)
10
5
10
9
90
84
10
0
82
14
6
43
57
11
8
41
18
9
30
11
2
62
52
(28
)
43
(88
)
52
35
11
6
16
2
28
52
88
11
0
(150)(100)
(50)-
50 100 150 200 250
VM
AR
T
V2
Ret
ail
Co
. C
Co
. D
Co
. E
Co
. F
Co
. G
VM
AR
T
V2
Ret
ail
Co
. C
Co
. D
Co
. E
Co
. F
Co
. G
VM
AR
T
V2
Ret
ail
Co
. C
Co
. D
Co
. E
Co
. F
Co
. G
Inventory + Receivables (Days) Payable Days (x) Core CC Cycle
FY18 FY19 FY20 1HFY21

Page | 21
Fashion & Lifestyle Thematic
Second wave - final nail in the coffin for the tail!
Second wave could prove to be the final nail in the coffin for many category
tails: Given the weak cash position, sinking profitability, and debilitating
working capital woes across category tails, a second wave of lockdowns could
prove to be the final nail in the coffin for weak retailers. Even for stronger
retailers, it is likely to translate into a second round of sub-optimal financial
performance.
Key Indian states and UTs (Maharashtra, Delhi, Rajasthan, and Gujarat) are
already under a partial lockdown in some shape or form with restricted sale of
non-essential products.
Our proprietary store map suggests that for our entire apparel universe,
Maharashtra, and Delhi (partially locked down currently) account for 25-40% of
stores across all formats (ex-value fashion). Revenue exposure could be as high as
40-60%. Hence, the most impacted are likely to be department stores and ethnic
wear retailers, who incidentally have a weak cash cover and worsening working
capital position (most impacted companies/formats under coverage/ listed:
Central, Brand Factory, STOP, and TCNS Clothing)
4/12 top cities (high on per capita income and population density are currently
under partial lockdown, while the next 5-6 cities are on the verge of imposing
stricter restrictions/partial lockdowns).
Note: Top 12 cities in India account for 40-80% of stores for our coverage universe
(ex-value fashion), accounting for an estimated 60-95% of their revenue base.
Store concentration of retailers in Maharashtra and Delhi
Source: Company, HSIE Research
Top 12 cities footprint exposure across retailers
Source: Company, HSIE Research
24
39
28 29 26 32 29
13
33
19 22
33
23
35 29 25
17 12
18 13
20
10 4 4
- 10 20 30 40 50
Wes
tsid
e
Co
. A
Co
. B
Co
. C
TC
NS
Clo
Co
. A
Co
. B
Co
. C
Co
. D
Co
. E
Co
. F
Co
. G
Bra
nd
Fac
tory
Cen
tral
ST
OP
Co
. A
Pan
talo
on
s
Pla
net
Fas
hio
n
Zu
dio
Co
. A
Co
. B
Co
. C
V-M
AR
T
V2
Ret
ail
FF/Pvt. Labels Ethnic wear Dept Stores VF/Off-Price
Store Concentration in Maharashtra + Delhi (%)
45
81 66 67
53 60 52
67 71
38 56 63
49 63 55 51
34 49
2 7
27 42 39
-
20
40
60
80
100
Wes
tsid
e
Co
. A
Co
. B
Co
. C
TC
NS
Clo
Co
. A
Co
. B
Co
. C
Co
. D
Co
. E
Co
. F
Co
. G
Bra
nd
Fac
tory
Cen
tral
ST
OP
Co
. A
Pan
talo
on
s
Zu
dio
V-M
AR
T
V2
Ret
ail
Rel
ian
ce T
ren
ds
Co
. A
Co
. B
FF/Pvt. Labels Ethnic wear Dept Stores VF/Off-Price
Store contribution of Top 12 cities (%)
Page | 22
Fashion & Lifestyle Thematic
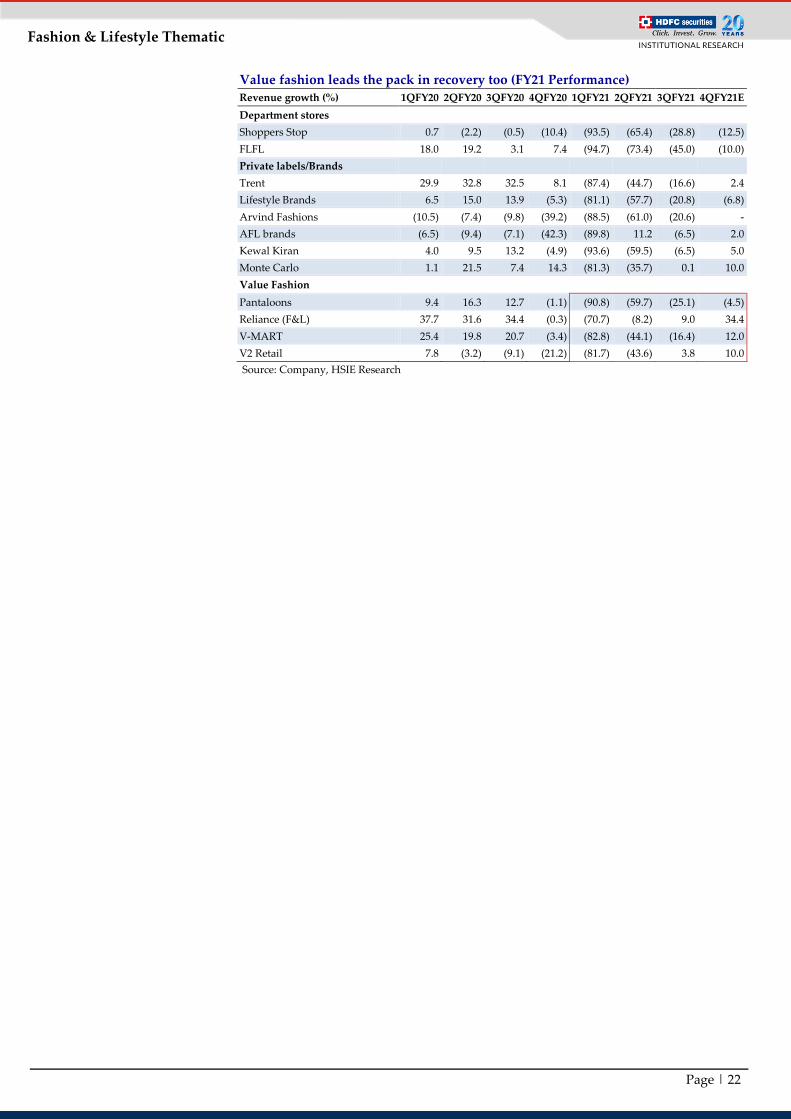
Value fashion leads the pack in recovery too (FY21 Performance)
Revenue growth (%) 1QFY20 2QFY20 3QFY20 4QFY20 1QFY21 2QFY21 3QFY21 4QFY21E
Department stores
Shoppers Stop 0.7 (2.2) (0.5) (10.4) (93.5) (65.4) (28.8) (12.5)
FLFL 18.0 19.2 3.1 7.4 (94.7) (73.4) (45.0) (10.0)
Private labels/Brands
Trent 29.9 32.8 32.5 8.1 (87.4) (44.7) (16.6) 2.4
Lifestyle Brands 6.5 15.0 13.9 (5.3) (81.1) (57.7) (20.8) (6.8)
Arvind Fashions (10.5) (7.4) (9.8) (39.2) (88.5) (61.0) (20.6) -
AFL brands (6.5) (9.4) (7.1) (42.3) (89.8) 11.2 (6.5) 2.0
Kewal Kiran 4.0 9.5 13.2 (4.9) (93.6) (59.5) (6.5) 5.0
Monte Carlo 1.1 21.5 7.4 14.3 (81.3) (35.7) 0.1 10.0
Value Fashion
Pantaloons 9.4 16.3 12.7 (1.1) (90.8) (59.7) (25.1) (4.5)
Reliance (F&L) 37.7 31.6 34.4 (0.3) (70.7) (8.2) 9.0 34.4
V-MART 25.4 19.8 20.7 (3.4) (82.8) (44.1) (16.4) 12.0
V2 Retail 7.8 (3.2) (9.1) (21.2) (81.7) (43.6) 3.8 10.0
Source: Company, HSIE Research

Page | 23
Fashion & Lifestyle Thematic
Peer Valuation
Company CMP
MCap
(Rs
bn)
Reco TP Revenue (Rs. bn) EBITDA (Rs. bn) EBITDAM (%) EPS (Rs) P/E (x) EV/EBITDA (x) RoE(%)
FY21E FY22E FY23E FY21E FY22E FY23E FY21E FY22E FY23E FY21E FY22E FY23E FY21E FY22E FY23E FY21E FY22E FY23E FY21E FY22E FY23E
Retail
Avenue 2,778 1,767 SELL 2,160 238 351 436 18 30 38 7.4 8.7 8.7 17.8 31.6 39.0 155.9 87.8 71.3 100.8 58.1 44.8 9.9 15.4 16.2
ABFRL 174 150 BUY 200 52 83 96 2 12 14 4.0 14.3 14.7 (6.8) (0.6) 0.1 NM NM NM 82.8 13.9 9.8 (45.5) (2.7) 0.2
Shoppers
Stop 193 17 SELL 170 17 30 33 (2) 2 2 (11.3) 5.1 6.0 (17.8) (5.9) (3.3) NM NM NM NM 10.9 8.0 (21.6) (8.3) (4.3)
V Mart 2,626 48 ADD 2,800 11 17 23 1 1 2 4.7 8.6 8.9 19.5 59.0 78.1 134.7 44.5 33.6 82.0 28.4 20.8 5.1 11.4 13.4
Trent 736 213 SELL 580 20 38 46 2 7 8 8.4 17.5 17.1 (2.6) 4.6 5.2 NM NM NM 143.4 33.4 28.0 (3.8) 6.7 7.1
TCNS
Clo. 448 27 REDUCE 400 6 11 13 (1) 1 1 (13.1) 7.9 9.0 (6.2) 9.0 10.9 NM 44.6 39.7 (30.6) 29.9 23.2 (6.2) 9.9 10.5
Titan 1,523 1,352 SELL 1,300 217 267 314 20 31 36 9.4 11.5 11.6 13.2 21.4 26.2 115.7 71.2 58.1 68.6 45.3 38.2 16.6 24.2 26.3
Reliance
Retail 560 3,750 NR 560 1,410 2,034 2,429 84 116 132 6.0 5.7 5.4 8.5 14.1 15.2 66.7 42.5 39.8 40.2 29.2 25.6 12.4 12.0 11.8
Paints
Asian
Paints 2,556 2,451 REDUCE 2,300 213 244 273 48 54 60 22.5 22.0 21.8 32.5 37.2 42.8 78.7 68.8 59.7 50.9 45.0 40.2 28.3 28.0 28.2
Berger
Paints 710 689 SELL 610 66 79 89 11 14 16 17.0 17.3 17.5 7.1 8.8 9.9 99.6 81.0 71.4 61.0 50.1 43.9 23.9 24.7 23.4
Kansai
Paints 548 305 BUY 650 50 59 67 9 10 11 17.3 16.6 16.8 9.9 11.4 13.2 55.3 48.0 41.7 35.2 30.7 26.9 13.5 14.1 14.6
Source: HSIE Research

Page | 24
Fashion & Lifestyle Thematic
Financials (ABFRL)
Consolidated Income Statement
Year End (March) FY16 FY17 FY18 FY19 FY20 FY21E FY22E FY23E
Net Revenues 60,339 66,029 71,721 81,177 87,425 52,039 83,402 95,658
Growth (%) 226.0 9.4 8.6 13.2 7.7 (40.5) 60.3 14.7
Material Expenses 27,518 30,087 33,901 39,250 42,058 25,943 41,578 47,210
Employee Expense 6,205 7,058 7,723 9,130 10,584 8,534 10,008 11,431
Rent Expense 9,032 10,172 10,429 11,104 12,468 4,059 4,254 4,831
Advertisement Expense 3,954 2,867 3,380 4,415 4,755 1,561 4,170 5,166
Other Expenses 9,847 11,470 11,605 11,738 12,906 9,877 11,449 12,943
EBITDA 3,784 4,375 4,683 5,541 4,655 2,065 11,943 14,078
EBITDA Growth (%) 420.5 15.6 7.0 18.3 (16.0) (55.6) 478.5 17.9
EBITDA Margin (%) 6.3 6.6 6.5 6.8 5.3 4.0 14.3 14.7
Depreciation 3,381 2,425 2,805 2,823 2,488 9,294 10,264 11,171
EBIT 403 1,950 1,878 2,717 2,167 (7,229) 1,680 2,906
Other Income (Including EO Items) 264 382 328 648 522 4,092 565 548
Interest 1,765 1,797 1,716 1,874 2,123 4,703 3,031 3,359
PBT (1,097) 535 490 1,491 565 (7,840) (787) 95
Total Tax - - (688) (1,721) 1,361 (1,973) (198) 24
RPAT (1,097) 535 1,178 3,212 (796) (5,867) (589) 71
Exceptional Gain/(loss) - - - - - - - -
Adjusted PAT (1,097) 535 1,178 3,212 (796) (5,867) (589) 71
APAT Growth (%) (51.9) (148.7) 120.2 172.7 (124.8) 637.3 (90.0) (112.1)
Adjusted EPS (Rs) (1.4) 0.7 1.5 4.2 (1.0) (7.6) (0.8) 0.1
EPS Growth (%) (51.9) (148.7) 120.2 172.7 (124.8) 637.3 (90.0) (112.1)
Consolidated Balance sheet
Year End (March) FY16 FY17 FY18 FY19 FY20 FY21E FY22E FY23E
SOURCES OF FUNDS
Share Capital - Equity 7,688 7,705 7,717 7,735 7,740 8,644 9,376 9,376
Reserves 1,367 1,876 3,214 6,554 3,119 6,299 19,978 19,371
Total Shareholders Funds 9,055 9,582 10,931 14,289 10,859 14,943 29,354 28,747
Preference Share Capital 5 5 0 - - - - -
Long Term Debt 6,766 12,705 11,879 7,238 8,550 8,550 1,550 1,550
Short Term Debt 11,727 7,736 6,735 9,791 19,213 15,213 4,213 4,213
Total Debt 18,493 20,441 18,614 17,029 27,763 23,763 5,763 5,763
Net Deferred Taxes - - (688) (2,634) (1,950) (1,950) (1,950) (1,950)
Other Non-current Liabilities & Provns 1,127 1,418 1,607 1,737 25,894 25,867 29,084 32,861
TOTAL SOURCES OF FUNDS 28,680 31,446 30,464 30,420 62,567 62,624 62,252 65,422
APPLICATION OF FUNDS
Net Block 5,280 6,275 7,227 6,959 6,943 5,658 5,752 5,984
CWIP 254 250 459 224 436 436 436 436
Other Non-current Assets 17,956 18,606 19,875 19,917 41,328 41,172 44,307 48,018
Total Non-current Assets 23,490 25,131 27,561 27,100 48,707 47,266 50,495 54,438
Inventories 14,105 14,313 16,912 19,213 23,494 19,247 22,850 26,208
Debtors 3,124 4,522 5,518 7,866 8,402 8,554 8,683 9,173
Other Current Assets 4,913 5,897 5,889 8,782 9,986 5,944 9,527 10,927
Cash & Equivalents 192 497 770 616 4,351 3,033 2,743 2,742
Total Current Assets 22,335 25,228 29,089 36,477 46,233 36,779 43,803 49,049
Creditors 14,298 14,578 20,093 23,986 22,733 15,683 22,850 27,518
Other Current Liabilities & Provns 2,846 4,335 6,093 9,170 9,640 5,738 9,196 10,548
Total Current Liabilities 17,144 18,913 26,186 33,157 32,373 21,421 32,046 38,066
Net Current Assets 5,191 6,315 2,903 3,321 13,860 15,358 11,757 10,984
TOTAL APPLICATION OF FUNDS 28,680 31,446 30,464 30,420 62,567 62,624 62,252 65,422
Source: Company, HSIE Research

Page | 25
Fashion & Lifestyle Thematic
Consolidated Cash flow statement Year ending March FY16 FY17 FY18 FY19 FY20 FY21E FY22E FY23E
Reported PBT (1,098) 535 490 149 565 (7,840) (787) 95
Non-operating & EO Items (179) 134 237 1,590 (502) (4,092) (565) (548)
Interest Expenses 1,765 1,761 1,669 1,846 2,123 4,703 3,031 3,359
Depreciation 3,381 2,425 2,805 2,823 2,488 2,845 3,291 3,613
Working Capital Change (741) (573) 760 (937) (2,229) (2,816) 3,311 772
Tax Paid (19) (30) (10) (196) (61) 1,973 198 (24)
OPERATING CASH FLOW ( a ) 3,109 4,252 5,951 5,276 2,384 (5,226) 8,480 7,267
Capex (2,076) (4,499) (3,271) (2,792) (4,668) (1,560) (3,385) (3,844)
Free Cash Flow (FCF) 1,033 (247) 2,680 2,484 (2,283) (6,787) 5,095 3,423
Investments - 4 (36) 22 47 - - -
Non-operating Income 217 38 55 4 (599) 4,248 (2,570) (3,163)
INVESTING CASH FLOW ( b ) (1,859) (4,456) (3,252) (2,766) (5,220) 2,688 (5,955) (7,007)
Debt Issuance/(Repaid) (1,313) 498 (2,481) (2,674) 8,602 (8,703) (21,031) (3,359)
FCFE (280) 251 199 (189) 6,318 (15,490) (15,936) 64
Share Capital Issuance (16) 11 12 9 72 9,951 15,000 -
Dividend - - - - - - - (678)
Others - - - - 479 (27) 3,217 3,777
FINANCING CASH FLOW ( c ) (1,330) 509 (2,469) (2,664) 9,153 1,221 (2,814) (261)
NET CASH FLOW (a+b+c) (80) 305 230 (154) 6,318 (1,318) (290) (1)
EO Items, Others - - - - - - - -
Closing Cash & Equivalents 190 495 726 572 2,651 1,333 1,043 1,042
Key Ratios
FY16 FY17 FY18 FY19 FY20 FY21E FY22E FY23E
PROFITABILITY (%)
GPM 54.4 54.4 52.7 51.6 51.9 50.1 50.1 50.6
EBITDA Margin 6.3 6.6 6.5 6.8 5.3 4.0 14.3 14.7
EBIT Margin 0.7 3.0 2.6 3.3 2.5 (13.9) 2.0 3.0
APAT Margin (1.8) 0.8 1.6 4.0 (0.9) (11.3) (0.7) 0.1
RoE (17.6) 5.7 11.5 25.5 (6.3) (45.5) (2.7) 0.2
RoIC (or Core RoCE) 1.8 6.6 6.1 8.7 4.7 (8.9) 2.0 3.4
RoCE 2.9 7.8 9.2 15.8 2.7 (3.6) 2.6 3.9
EFFICIENCY
(6.61)
Tax Rate (%) - - - - - 25.2 25.2 25.2
Fixed Asset Turnover (x) 9.3 8.3 6.6 6.5 5.8 3.1 4.2 4.0
Inventory (days) 85 79 86 86 98 135 100 100
Debtors (days) 19 25 28 35 35 60 38 35
Other Current Assets (days) 30 33 30 39 42 42 42 42
Payables (days) 86 81 102 108 95 110 100 105
Other Current Liab & Provns (days) 17 24 31 41 40 40 40 40
Cash Conversion Cycle (days) 30 32 11 12 40 86 39 31
Net Debt (Rs mn) 18,301 19,945 17,844 16,412 23,413 20,730 3,020 3,021
Net D/E (x) 2.0 2.1 1.6 1.1 2.2 1.4 0.1 0.1
Interest Coverage (x) 0.2 1.1 1.1 1.4 1.0 (1.5) 0.6 0.9
PER SHARE DATA (Rs)
EPS (1.4) 0.7 1.5 4.2 (1.0) (7.6) (0.8) 0.1
CEPS 3.0 3.8 5.2 7.8 2.2 3.2 10.2 12.0
Dividend - - - - - - 0.6 0.9
Book Value 11.8 12.4 14.2 18.5 14.0 17.3 31.3 30.7
VALUATION
P/E (x) (122.3) 251.0 114.0 41.8 (168.7) (22.9) (228.0) 1,888.3
P/BV (x) 14.8 14.0 12.3 9.4 12.4 10.1 5.6 5.7
EV/EBITDA (x) 40.3 35.3 32.5 27.3 33.9 82.8 13.9 9.8
EV/Revenues (x) 2.5 2.3 2.1 1.9 1.8 3.3 2.0 1.4
OCF/EV (%) 2.0 2.8 3.9 3.5 1.5 (3.1) 5.1 5.3
FCF/EV (%) 0.7 (0.2) 1.8 1.6 (1.4) (4.0) 3.1 2.5
FCFE/Mkt Cap (%) (0.2) 0.2 0.1 (0.1) 4.7 (10.3) (9.8) 0.0
Source: Company, HSIE Research

Page | 26
Fashion & Lifestyle Thematic
Financials (Trent Ltd) Standalone Income Statement Year End (March) FY16 FY17 FY18 FY19 FY20E FY21E FY22E FY23E
Net Revenues 14,919 17,166 20,663 25,317 31,777 20,141 37,565 45,655
Growth (%) 9.9 15.1 20.4 22.5 25.5 (36.6) 86.5 21.5
COGS 7,213 8,060 9,588 12,324 16,037 10,601 19,274 23,776
Employee Expense 1,323 1,661 2,026 2,525 3,131 2,618 3,756 4,565
A&P Expense 424 461 382 430 493 272 601 730
Rent Expense 1,874 2,278 2,668 3,180 2,026 1,540 2,318 2,739
Other Expenses 3,158 3,479 3,987 4,494 4,458 3,424 5,034 6,026
EBITDA 927 1,226 2,014 2,365 5,632 1,687 6,582 7,817
EBITDA Growth (%) 68.9 32.3 64.2 17.5 138.1 (70.1) 290.2 18.8
EBITDA Margin (%) 6.2 7.1 9.7 9.3 17.7 8.4 17.5 17.1
Depreciation 345 376 417 465 2,311 2,350 2,804 3,364
EBIT 582 850 1,597 1,901 3,321 (663) 3,778 4,454
Other Income (Including EO Items) 886 837 426 359 1,517 1,714 751 704
Interest 376 337 306 368 2,383 2,370 2,349 2,694
PBT 1,093 1,350 1,716 1,892 2,455 (1,318) 2,180 2,464
Total Tax 227 282 549 617 909 (385) 549 620
RPAT before share of associate earnings 866 1,069 1,167 1,275 1,546 (933) 1,631 1,844
Share of associate earnings - - - - - - - -
Minority share of Profit/(Loss) - - - - - - - -
RPAT 866 1,069 1,167 1,275 1,546 (933) 1,631 1,844
Exceptional (Gain)/loss 1 (247) - 5 0 - - -
Adjusted PAT 867 822 1,167 1,279 1,546 (933) 1,631 1,844
APAT Growth (%) 98.6 (5.2) 42.1 9.6 20.8 (160.4) (274.8) 13.0
Adjusted EPS (Rs) 26.1 2.5 3.5 3.8 4.3 (2.6) 4.6 5.2
Standalone Balance sheet Year End (March) FY16 FY17 FY18 FY19 FY20E FY21E FY22E FY23E
SOURCES OF FUNDS
Share Capital - Equity 332 332 332 332 355 355 355 355
Reserves 14,000 15,076 15,839 16,636 24,634 23,271 24,902 26,254
Total Shareholders Funds 14,332 15,408 16,172 16,968 24,990 23,626 25,257 26,609
Minority Interest - - - - - - - -
Long Term Debt 960 998 999 2,996 2,997 2,997 2,997 2,997
Short Term Debt 2,998 2,919 2,915 1,946 - - - -
Lease Liability
21,471 21,556 24,467 28,670
Total Debt 3,958 3,917 3,914 4,941 24,468 24,554 27,464 31,667
Net Deferred Taxes (86) (101) (28) (72) (1,070) (1,070) (1,070) (1,070)
Other Non-current Liabilities & Provns - 24 23 4 69 69 69 69
TOTAL SOURCES OF FUNDS 18,205 19,248 20,081 21,842 48,458 47,179 51,721 57,276
APPLICATION OF FUNDS
Net Block 4,160 4,899 5,779 6,271 7,142 7,633 8,866 10,543
CWIP 537 55 96 850 231 231 231 231
Other Non-current Assets 5,803 6,139 6,119 7,250 9,125 9,125 9,125 9,125
RoU Assets
19,041 19,127 21,442 24,754
Total Non-current Assets 10,499 11,093 11,993 14,372 35,539 36,117 39,665 44,654
Inventories 2,701 2,983 3,392 4,894 5,865 3,863 6,895 8,318
Debtors 20 31 131 141 133 84 158 192
Other Current Assets 2,202 2,074 2,701 3,157 2,241 1,338 2,341 2,657
Cash & Equivalents 5,321 5,593 4,899 2,970 9,103 8,802 7,892 7,749
Total Current Assets 10,244 10,681 11,122 11,162 17,343 14,087 17,286 18,916
Creditors 1,492 1,565 1,946 2,289 2,565 1,846 3,032 3,622
Other Current Liabilities & Provns 1,046 962 1,088 1,403 1,859 1,178 2,197 2,671
Total Current Liabilities 2,538 2,526 3,034 3,692 4,423 3,025 5,229 6,293
Net Current Assets 7,706 8,155 8,088 7,470 12,919 11,063 12,057 12,623
TOTAL APPLICATION OF FUNDS 18,205 19,248 20,081 21,842 48,458 47,179 51,721 57,276
Source: Company, HSIE Research

Page | 27
Fashion & Lifestyle Thematic
Standalone Cash flow statement Year ending March FY16 FY17 FY18 FY19 FY20E FY21E FY22E FY23E
Reported PBT 1,094 1,103 1,716 1,896 2,455 (1,318) 2,180 2,464
Non-operating & EO Items (617) (324) (40) (122) (1,228) - - -
Interest Expenses 160 128 87 180 2,058 2,370 2,349 2,694
Depreciation 353 383 424 465 2,319 2,350 2,804 3,364
Working Capital Change 280 (336) (668) (1,356) (1,112) 1,556 (1,904) (709)
Tax Paid (189) (313) (491) (781) (807) 385 (549) (620)
OPERATING CASH FLOW ( a ) 1,081 642 1,029 282 3,686 5,342 4,881 7,192
Capex (1,326) (488) (1,369) (2,890) (1,501) (949) (1,865) (2,420)
Free Cash Flow (FCF) (245) 153 (341) (2,609) 2,185 4,393 3,016 4,772
Investments (67) 176 881 2,234 (5,870) - - -
Non-operating Income 500 207 186 199 (200) - - -
(Increase)/decrease in RoU
(1,979) (4,487) (5,933)
INVESTING CASH FLOW ( b ) (892) (105) (302) (457) (7,570) (2,928) (6,352) (8,353)
Debt Issuance/(Repaid) 541 (466) (341) 841 (4,367) (2,370) (2,349) (2,694)
FCFE 297 (313) (681) (1,768) (2,182) 2,023 666 2,078
Share Capital Issuance - - - - 9,498 - - -
Dividend (752) (6) (399) (459) (520) (430) - (492)
Others (0) - - - - 85 2,911 4,203
FINANCING CASH FLOW ( c ) (211) (472) (740) 382 4,611 (2,715) 562 1,018
NET CASH FLOW (a+b+c) (22) 64 (12) 206 727 (301) (910) (143)
EO Items, Others - - - - - - - -
Closing Cash & Equivalents 252 316 303 509 441 140 (770) (913)
Key Ratios
FY16 FY17 FY18 FY19 FY20E FY21E FY22E FY23E
PROFITABILITY (%)
GPM 51.7 53.0 53.6 51.3 49.5 47.4 48.7 47.9
EBITDA Margin 6.2 7.1 9.7 9.3 17.7 8.4 17.5 17.1
EBIT Margin 3.9 5.0 7.7 7.5 10.5 (3.3) 10.1 9.8
APAT Margin 5.8 4.8 5.6 5.1 4.9 (4.6) 4.3 4.0
RoE 6.2 5.5 7.4 7.7 7.4 (3.8) 6.7 7.1
RoIC (or Core RoCE) 3.8 4.8 7.5 7.5 7.2 (1.2) 6.9 7.1
RoCE 6.8 5.7 7.0 7.3 8.7 1.6 6.9 7.1
EFFICIENCY
Tax Rate (%) 20.8 25.5 32.0 32.5 37.0 29.2 25.2 25.2
Fixed Asset Turnover (x) 2.6 2.7 3.0 3.4 3.7 2.1 3.3 3.3
Inventory (days) 66 63 60 71 67 70 67 67
Debtors (days) 0 1 2 2 2 2 2 2
Other Current Assets (days) 54 44 48 46 26 24 23 21
Payables (days) 37 33 34 33 29 33 29 29
Other Current Liab & Provns (days) 26 20 19 20 21 21 21 21
Cash Conversion Cycle (days) 58 54 56 65 44 41 40 39
Net D/E (x) (0.1) (0.1) (0.1) 0.1 0.6 0.7 0.8 0.9
Interest Coverage (x) 1.5 2.5 5.2 5.2 1.4 (0.3) 1.6 1.7
PER SHARE DATA (Rs)
EPS 26.1 2.5 3.5 3.8 4.3 (2.6) 4.6 5.2
CEPS 36.5 3.6 4.8 5.2 10.8 4.0 12.4 14.6
Dividend
Book Value 431.3 46.4 48.7 51.1 70.0 66.2 70.8 74.5
VALUATION
P/E (x) 28.2 297.5 209.4 191.1 169.8 (281.3) 161.0 142.4
P/BV (x) 1.7 15.9 15.1 14.4 10.5 11.1 10.4 9.9
EV/EBITDA (x) 262.2 198.0 120.9 104.2 46.1 154.3 40.1 34.3
EV/Revenues (x) 16.3 14.1 11.8 9.7 8.2 12.9 7.0 5.9
OCF/EV (%) 0.4 0.3 0.4 0.1 1.4 2.1 1.8 2.7
FCF/EV (%) (0.1) 0.1 (0.1) (1.1) 0.8 1.7 1.1 1.8
FCFE/Mkt Cap (%) 0.1 (0.1) (0.3) (0.7) (0.9) 0.8 0.3 0.9
Dividend Yield (%) - - - - - - - -
Source: Company, HSIE Research

Page | 28
Fashion & Lifestyle Thematic
Financials (V-MART Retail)
Consolidated Income Statement
Year End (March) FY16 FY17 FY18 FY19P FY20E FY21E FY22E FY23E
Net Revenues 8,093 10,017 12,224 14,337 16,630 10,962 17,450 22,563
Growth (%) 12.4 23.8 22.0 17.3 16.0 (34.1) 59.2 29.3
COGS 5,712 7,028 8,303 9,703 11,263 7,426 11,804 15,217
Employee Expense 623 783 984 1,257 1,536 1,184 1,605 2,076
A&P Expense 191 226 262 339 394 197 401 517
Rent Expense 400 452 526 672 942 769 923 1,180
Other Expenses 549 682 821 1,037 1,171 866 1,221 1,557
EBITDA 618 848 1,328 1,329 1,324 520 1,495 2,017
EBITDA Growth (%) (2.9) 37.1 56.7 0.1 (0.4) (60.7) 187.5 34.9
EBITDA Margin (%) 7.6 8.5 10.9 9.3 8.0 4.7 8.6 8.9
Depreciation 190 186 229 276 334 364 434 527
EBIT 428 662 1,099 1,053 990 156 1,061 1,490
Other Income (Including EO Items) 26 41 41 (39) 45 219 419 429
Interest 31 35 15 16 34 67 48 23
PBT 423 668 1,125 998 1,001 308 1,432 1,895
Total Tax 147 229 348 382 202 (46) 360 477
RPAT 276 439 777 616 799 354 1,071 1,418
Exceptional Gain/(loss) 14 - - (98) - - - -
Adjusted PAT 262 439 777 714 799 354 1,071 1,418
APAT Growth (%) (33.1) 67.6 77.0 (8.1) 11.9 (55.7) 202.7 32.4
Adjusted EPS (Rs) 14.5 24.3 42.9 39.5 44.0 19.5 59.0 78.1
Consolidated Balance sheet
Year End (March) FY16 FY17 FY18 FY19P FY20E FY21E FY22E FY23E
SOURCES OF FUNDS
Share Capital - Equity 181 181 181 181 182 197 197 197
Reserves 2,127 2,520 3,293 3,911 4,643 8,732 9,738 11,025
Total Shareholders Funds 2,307 2,700 3,474 4,093 4,825 8,929 9,935 11,221
Long Term Debt - 6 3 0 - - - -
Short Term Debt 270 351 3 219 229 729 229 229
Total Debt 270 357 6 219 229 729 229 229
Net Deferred Taxes (42) (79) (92) (118) (160) (160) (160) (160)
Other Non-current Liabilities & Provns 84 37 42 60 - - - -
TOTAL SOURCES OF FUNDS 2,619 3,016 3,430 4,254 4,894 9,498 10,004 11,291
APPLICATION OF FUNDS
Net Block 1,103 1,173 1,447 1,655 1,749 1,454 1,979 1,994
CWIP 23 12 35 40 25 25 25 25
Other Non-current Assets 1 0 1 12 53 53 53 53
Total Non-current Assets 1,127 1,185 1,483 1,707 1,827 1,532 2,057 2,072
Inventories 2,044 2,692 3,071 3,290 4,779 3,304 4,255 5,378
Debtors - - - - - - - -
Other Current Assets 252 204 317 431 420 271 421 533
Cash & Equivalents 366 748 536 773 129 5,787 5,443 6,055
Total Current Assets 2,662 3,644 3,924 4,493 5,328 9,361 10,119 11,966
Creditors 956 1,599 1,668 1,483 1,968 1,201 1,865 2,349
Other Current Liabilities & Provns 215 214 309 464 293 193 308 398
Total Current Liabilities 1,171 1,813 1,977 1,946 2,261 1,395 2,172 2,747
Net Current Assets 1,491 1,831 1,947 2,547 3,067 7,966 7,947 9,219
TOTAL APPLICATION OF FUNDS 2,619 3,016 3,430 4,254 4,894 9,498 10,004 11,291
Source: Company, HSIE Research

Page | 29
Fashion & Lifestyle Thematic
Consolidated Cash flow statement Year ending March FY16 FY17 FY18 FY19P FY20E FY21E FY22E FY23E
Reported PBT 423 668 1,125 993 1,001 308 1,432 1,895
Non-operating & EO Items 173 (22) 8 89 13 (219) (419) (429)
Interest Expenses 31 35 15 16 34 67 48 23
Depreciation 190 179 222 268 334 364 434 527
Working Capital Change (207) 69 (346) (270) (1,091) 758 (324) (660)
Tax Paid (149) (243) (381) (332) (241) 46 (360) (477)
OPERATING CASH FLOW ( a ) 461 687 643 763 49 1,324 810 880
Capex (260) (415) (478) (407) (546) (69) (959) (542)
Free Cash Flow (FCF) 201 272 166 357 (497) 1,256 (149) 338
Investments (101) (337) 395 (339) 550 - - -
Non-operating Income (10) 25 (68) 12 2 219 419 429
INVESTING CASH FLOW ( b ) (372) (728) (151) (734) 5 151 (540) (113)
Debt Issuance/(Repaid) (50) 47 (366) (19) (26) 433 (548) (23)
FCFE 151 319 (201) 338 (523) 1,688 (696) 315
Share Capital Issuance 8 0 9 19 13 3,750 - -
Dividend (53) (6) (27) (44) (37) - (66) (131)
Others - 8 - - (60) - - -
FINANCING CASH FLOW ( c ) (96) 49 (384) (44) (110) 4,183 (614) (154)
NET CASH FLOW (a+b+c) (6) 8 109 (14) (56) 5,658 (344) 612
EO Items, Others - - - - - - - -
Closing Cash & Equivalents 20 29 196 123 110 5,708 5,364 5,977
Key Ratios FY16 FY17 FY18 FY19P FY20E FY21E FY22E FY23E
PROFITABILITY (%)
GPM 29.4 29.8 32.1 32.3 32.3 32.3 32.4 32.6
EBITDA Margin 7.6 8.5 10.9 9.3 8.0 4.7 8.6 8.9
EBIT Margin 5.3 6.6 9.0 7.3 6.0 1.4 6.1 6.6
APAT Margin 3.2 4.4 6.4 5.0 4.8 3.2 6.1 6.3
RoE 12.0 17.5 25.2 18.9 17.9 5.1 11.4 13.4
RoIC (or Core RoCE) 12.5 19.2 29.4 21.5 19.2 4.2 19.2 22.8
RoCE 11.2 16.4 24.4 18.9 18.1 6.0 11.4 13.5
EFFICIENCY
Tax Rate (%) 35.9 34.3 30.9 34.8 20.2 (15.0) 25.2 25.2
Fixed Asset Turnover (x) 4.8 7.6 6.8 6.4 6.2 4.0 4.7 5.3
Inventory (days) 92 98 92 84 105 110 89 87
Debtors (days) - - - - - - - -
Other Current Assets (days) 11 7 9 11 9 9 9 9
Payables (days) 43 58 50 38 43 40 39 38
Other Current Liab & Provns (days) 10 8 9 12 6 6 6 6
Cash Conversion Cycle (days) 51 39 42 45 64 73 52 51
Net D/E (x) (0.0) (0.1) (0.2) (0.1) 0.0 (0.6) (0.5) (0.5)
Interest Coverage (x) 13.7 18.8 71.9 65.3 29.4 2.3 22.1 64.9
PER SHARE DATA (Rs)
EPS 14.5 24.3 42.9 39.5 44.0 19.5 59.0 78.1
CEPS 25.0 34.6 55.6 54.7 62.4 39.6 82.9 107.2
Dividend 1.25 1.25 2.00 1.70 - 3.00 6.00 4.50
Book Value 127.7 149.5 192.0 226.1 265.8 491.8 547.2 618.1
VALUATION
P/E (x) 181.1 108.1 61.2 66.5 59.7 134.7 44.5 33.6
P/BV (x) 20.6 17.6 13.7 11.6 9.9 5.3 4.8 4.2
EV/EBITDA (x) 76.7 55.6 35.4 35.3 36.1 82.0 28.4 20.8
EV/Revenues (x) 5.9 4.7 3.8 3.3 2.9 3.9 2.4 1.9
OCF/EV (%) 1.0 1.5 1.4 1.6 0.1 3.1 1.9 2.1
FCF/EV (%) 0.4 0.6 0.4 0.8 (1.0) 2.9 (0.3) 0.8
FCFE/Mkt Cap (%) 0.3 0.7 (0.4) 0.7 (1.1) 3.5 (1.5) 0.7
Dividend Yield (%) 0.0 0.0 0.1 0.1 - 0.1 0.2 0.2
Source: Company, HSIE Research

Page | 30
Fashion & Lifestyle Thematic
Financials (TCNS Clothing) Consolidated Income Statement
Year End (March) (Rs mn) FY16 FY17 FY18
(IND-AS) FY19 FY20E FY21E FY22E FY23E
Net Revenues 4,854 7,009 9,971 11,480 11,487 6,362 10,910 12,522
Growth (%) 61.3 44.4 18.9 15.1 0.1 (44.6) 71.5 14.8
COGS 1,883 2,599 3,425 3,899 4,023 2,670 3,823 4,394
Selling and distribution 218 386 1,717 2,388 2,691 1,566 2,462 2,790
Employee Expense 678 798 1,021 1,274 1,489 1,297 1,516 1,697
ESOPs 898 736 215 164 87 - 70 25
Rent Expense 568 776 938 1,099 1,224 776 1,146 1,315
Other Expenses 648 952 1,100 887 1,108 885 1,036 1,177
Reported EBITDA (39) 763 1,554 1,768 865 (832) 857 1,124
Adjusted EBITDA - adjusted for ESOPs 860 1,499 1,770 1,932 951 (832) 927 1,149
Adj EBITDA Growth (%) 68.2 74.4 18.0 9.2 (50.8) (187.5) (211.4) 23.9
Reported EBITDA Margin (%) (0.8) 10.9 15.6 15.4 7.5 (13.1) 7.9 9.0
Adjusted EBITDA Margin (%) 17.7 21.4 17.8 16.8 8.3 (13.1) 8.5 9.2
Depreciation 89 134 167 222 261 191 245 315
Reported EBIT (128) 629 1,388 1,546 603 (1,024) 612 809
Adjusted EBIT 771 1,365 1,603 1,710 690 (1,024) 682 834
Other Income (Including EO Items) 21 19 67 75 123 428 251 221
Interest 29 25 7 5 7 60 90 90
PBT (136) 624 1,448 1,616 719 (656) 773 940
Total Tax 279 466 467 302 (33) (255) 195 237
RPAT (415) 158 981 1,314 752 (401) 579 704
Exceptional Gain/(loss) - - - - - - - -
Adjusted PAT (adj for ESOP) 483 894 1,196 1,478 839 (401) 649 729
APAT Growth (%) 83.9 85.0 (0.0) 23.6 (43.2) (147.8) (261.6) 12.4
Adjusted EPS (Rs) 5.3 8.0 21.2 23.2 13.1 (6.2) 10.0 11.3
Consolidated Balance sheet
Year End (March) (Rs mn) FY16 FY17 FY18
(IND-AS) FY19 FY20E FY21E FY22E FY23E
SOURCES OF FUNDS
Share Capital - Equity 92 111 113 123 123 129 129 129
Reserves 380 2,708 4,202 6,063 6,477 6,130 6,708 6,868
Total Shareholders Funds 471 2,819 4,315 6,186 6,600 6,259 6,837 6,997
Preference Share 12 - - - - - - -
Long Term Debt 78 3 2 - - - - -
Short Term Debt 304 86 1 - - 1,000 1,000 1,000
Total Debt 382 88 3 - - 1,000 1,000 1,000
Net Deferred Taxes (155) (97) (115) (160) (350) (350) (350) (350)
Other Non-current Liabilities & Provns 48 44 63 66 3,691 3,691 3,691 3,691
TOTAL SOURCES OF FUNDS 759 2,854 4,266 6,092 9,941 10,600 11,179 11,338
APPLICATION OF FUNDS
Net Block 393 469 575 592 434 342 629 827
CWIP 2 33 25 3 21 21 21 21
Other Non-current Assets - - 198 208 3,568 3,568 3,568 3,568
Total Non-current Assets 395 502 798 804 4,023 3,931 4,217 4,416
Inventories 1,371 1,940 2,239 2,741 3,302 2,876 3,288 3,602
Debtors 642 997 1,571 1,807 1,756 1,569 1,793 2,024
Other Current Assets 408 573 735 739 832 456 743 808
Cash & Equivalents 116 150 512 1,608 1,713 2,986 2,807 2,388
Total Current Assets 2,537 3,659 5,057 6,896 7,604 7,887 8,631 8,822
Creditors 846 1,093 1,144 1,150 1,223 959 1,225 1,389
Other Current Liabilities & Provns 1,328 214 444 457 462 259 444 510
Total Current Liabilities 2,174 1,307 1,588 1,607 1,685 1,218 1,670 1,899
Net Current Assets 364 2,352 3,468 5,288 5,919 6,669 6,961 6,923
TOTAL APPLICATION OF FUNDS 759 2,854 4,266 6,092 9,941 10,600 11,179 11,338
Source: Company, HSIE Research

Page | 31
Fashion & Lifestyle Thematic
Consolidated Cash flow statement
Year ending March (Rs mn) FY16 FY17 FY18
(IND-AS) FY19 FY20E FY21E FY22E FY23E
Reported PBT (415) 158 981 1,616 661 (656) 773 940
Non-operating & EO Items 1,178 1,208 683 157 (23) (428) (251) (221)
Interest Expenses 29 25 7 5 382 60 90 90
Depreciation 89 134 167 222 1,032 191 245 315
Working Capital Change (212) (646) (971) (778) (475) 523 (471) (381)
Tax Paid (325) (628) (452) (323) (266) 255 (195) (237)
OPERATING CASH FLOW ( a ) 344 251 413 899 1,310 (55) 191 507
Capex (271) (242) (274) (237) (315) (100) (532) (513)
Free Cash Flow (FCF) 74 9 140 662 995 (155) (341) (6)
Investments (18) (40) (14) (1,250) 210 (500) (300) (300)
Non-operating Income 9 12 12 53 80 428 251 221
INVESTING CASH FLOW ( b ) (279) (271) (276) (1,434) (25) (172) (580) (592)
Debt Issuance/(Repaid) (16) (294) (86) (1) (634) 1,000 - -
FCFE 58 (285) 54 662 361 845 (341) (6)
Share Capital Issuance - 331 302 389 46 63 - -
Dividend - - - - - - - (544)
Others (30) (25) (7) (5) (382) (60) (90) (90)
FINANCING CASH FLOW ( c ) (45) 12 210 383 (971) 1,003 (90) (634)
NET CASH FLOW (a+b+c) 20 (8) 347 (151) 314 776 (479) (719)
EO Items, Others - - - - - - - -
Closing Cash & Equivalents 28 20 367 216 529 1,305 826 107
Key Ratios
FY16 FY17
FY18
(IND-AS) FY19 FY20E FY21E FY22E FY23E
PROFITABILITY (%)
GPM 61.2 62.9 65.7 66.0 66.0 65.0 58.0 65.0
EBITDA Margin 17.7 21.4 17.8 16.8 8.3 (13.1) 8.5 9.2
EBIT Margin 15.9 19.5 16.1 14.9 6.0 (16.1) 6.2 6.7
APAT Margin 10.0 12.8 12.0 12.9 7.3 (6.3) 5.9 5.8
RoE 61.8 54.4 27.7 28.2 13.1 (6.2) 9.9 10.5
RoIC (or Core RoCE) 226.9 20.7 28.9 33.8 11.4 (7.9) 6.4 7.2
RoCE 50.7 49.9 28.2 28.6 10.6 (3.6) 6.6 7.1
EFFICIENCY
Tax Rate (%) (204.3) 74.7 32.3 18.7 (4.7) 38.8 25.2 25.2
Fixed Asset Turnover (x) 7.8 12.3 13.1 12.7 13.3 6.6 7.3 6.2
Inventory (days) 103 101 82 87 105 165 110 105
Debtors (days) 48 52 57 57 56 90 60 59
Other Current Assets (days) 31 30 27 24 26 26 25 24
Payables (days) 64 57 42 37 39 55 41 41
Other Current Liab & Provns (days) 100 11 16 15 15 15 15 15
Cash Conversion Cycle (days) 19 115 108 117 134 211 139 132
Net D/E (x) 0.6 (0.0) (0.1) (0.3) (0.3) (0.3) (0.3) (0.2)
Interest Coverage (x) (4.3) 25.5 206.8 300.8 83.5 (17.1) 6.8 9.0
PER SHARE DATA (Rs)
EPS 5.3 8.0 21.2 23.2 13.1 (6.2) 10.0 11.3
CEPS 6.2 9.2 24.2 26.6 17.2 (3.3) 13.8 16.2
Dividend - - - - - - 7.0 8.0
Book Value 5.1 25.3 76.5 96.9 103.2 96.9 105.8 108.3
VALUATION
P/E (x) 85.0 55.7 21.1 19.3 34.2 (72.1) 44.6 39.7
P/BV (x) 87.2 17.7 5.9 4.6 4.3 4.6 4.2 4.1
EV/EBITDA (x) (715.2) 35.9 17.3 14.6 29.8 (30.6) 29.9 23.2
EV/Revenues (x) 5.7 3.9 2.7 2.3 2.2 4.0 2.4 2.1
OCF/EV (%) 1.2 0.9 1.5 3.5 5.1 (0.2) 0.7 1.9
FCF/EV (%) 0.3 0.0 0.5 2.6 3.9 (0.6) (1.3) (0.0)
FCFE/Mkt Cap (%) 0.2 (1.0) 0.2 2.4 1.3 3.1 (1.2) (0.0)
Dividend Yield (%) - - - - - - 1.6 1.8
Source: Company, HSIE Research

Page | 32
Fashion & Lifestyle Thematic
Financials (Shoppers Stop)
Consolidated Income Statement
Year End (March) FY16 FY17 FY18 FY19E FY20E FY21E FY22E FY23E
Net Revenues 44,320 37,569 36,967 35,779 34,639 17,466 30,351 33,363
Growth (%) 3.4 (15.2) (1.6) (3.2) (3.2) (49.6) 73.8 9.9
COGS 28,632 23,448 22,679 20,783 20,142 10,880 17,635 19,090
Employee Expense 3,330 2,873 3,157 3,296 3,346 2,731 2,957 3,246
A&P Expense 805 619 573 723 700 178 611 673
Rent Expense 3,830 3,642 3,766 4,045 4,211 2,248 3,717 4,082
Other Expenses 5,932 5,064 4,678 4,476 4,479 3,398 3,890 4,271
EBITDA 1,791 1,924 2,115 2,457 1,761 (1,969) 1,542 2,000
EBITDA Growth (%) (33.2) 7.4 9.9 16.2 (28.3) (211.8) (178.3) 29.7
EBITDA Margin (%) 4.0 5.1 5.7 6.9 5.1 (11.3) 5.1 6.0
Depreciation 1,297 1,187 1,149 1,406 2,534 1,812 2,239 2,345
EBIT 494 737 966 1,051 (774) (3,780) (697) (345)
Other Income (Including EO Items) 260 184 2,325 187 246 2,076 240 374
Interest 848 600 377 138 76 354 203 382
PBT (95) 321 2,914 1,099 (604) (2,059) (661) (353)
Total Tax 334 203 176 449 704 (494) (142) (65)
RPAT before share of associate earnings (428) 119 2,739 650 (1,308) (1,565) (519) (288)
Share of associate earnings 25 - - - - - - -
Minority share of Profit/(Loss) - - - - - - - -
RPAT (403) 119 2,739 650 (1,308) (1,565) (519) (288)
Exceptional (gain)/loss - 128 (2,160) - 97 97 97 97
Adjusted PAT (403) 247 579 650 (1,211) (1,468) (422) (192)
APAT Growth (%) (195.0) (161.4) 134.1 12.3 (286.4) 21.2 (71.3) (54.5)
Adjusted EPS (Rs) (4.8) 3.0 6.6 7.4 (13.8) (16.7) (4.8) (2.2)
Consolidated Balance sheet
Year End (March) FY16 FY17 FY18 FY19E FY20E FY21E FY22E FY23E
SOURCES OF FUNDS
Share Capital - Equity 417 418 440 440 440 440 440 440
Reserves 4,734 4,375 8,605 8,707 7,698 4,987 4,278 3,767
Total Shareholders Funds 5,151 4,792 9,044 9,147 8,138 5,427 4,718 4,207
Minority Interest (12) 52 - - - - - -
Long Term Debt 4,581 3,710 440 20 2 2 2 2
Short Term Debt 3,710 5,141 813 724 1,553 1,553 1,553 1,553
Total Debt 8,290 8,851 1,253 745 1,555 1,555 1,555 1,555
Net Deferred Taxes (36) (43) (198) (320) (2,641) (2,641) (2,641) (2,641)
Other Non-current Liabilities & Provns - - 6 6 6 6 6 6
TOTAL SOURCES OF FUNDS 13,393 13,653 10,106 9,578 7,058 4,348 3,638 3,128
APPLICATION OF FUNDS
Net Block 8,093 8,248 6,630 6,050 5,927 3,267 2,152 921
CWIP 333 200 182 351 102 102 102 102
Other Non-current Assets 2,005 2,217 97 97 - - - -
Total Non-current Assets 10,431 10,665 6,908 6,498 6,029 3,369 2,254 1,023
Inventories 5,792 5,776 3,563 10,719 12,392 6,727 11,108 11,936
Debtors 519 568 477 472 341 172 299 328
Other Current Assets 3,436 3,378 3,845 3,988 4,035 2,035 3,536 3,886
Cash & Equivalents 104 134 2,885 2,758 1,949 1,298 1,680 2,430
Total Current Assets 9,850 9,856 10,770 17,938 18,716 10,232 16,622 18,580
Creditors 4,944 4,908 5,191 12,771 15,219 8,009 13,086 14,110
Other Current Liabilities & Provns 1,945 1,961 2,381 2,087 2,468 1,245 2,163 2,377
Total Current Liabilities 6,889 6,869 7,572 14,858 17,724 9,385 15,533 16,487
Net Current Assets 2,962 2,987 3,198 3,080 992 847 1,089 2,093
TOTAL APPLICATION OF FUNDS 13,393 13,653 10,106 9,578 7,058 4,348 3,638 3,128
Source: Company, HSIE Research

Page | 33
Fashion & Lifestyle Thematic
Consolidated Cash flow statement Year ending March FY16 FY17 FY18 FY19E FY20E FY21E FY22E FY23E
Reported PBT (95) (581) 2,320 1,099 (716) (1,962) (564) (257)
Non-operating & EO Items (3) 178 (2,258) (7) (191) (2,173) (336) (471)
Interest Expenses 848 600 377 138 1,973 354 203 382
Depreciation 1,297 1,187 1,149 1,406 4,504 1,812 2,239 2,345
Working Capital Change (69) (502) 1,749 17 616 (599) (13) 30
Tax Paid (425) (241) (356) (565) (424) 494 142 65
OPERATING CASH FLOW ( a ) 1,554 640 2,981 2,088 5,761 (2,074) 1,671 2,095
Capex (1,722) (1,114) (297) (1,133) (1,764) (394) (1,231) (1,212)
Free Cash Flow (FCF) (169) (474) 2,684 955 3,997 (2,468) 439 883
Investments - - (200) (224) (1,078) - - -
Non-operating Income 4 7 146 37 0 2,173 336 471
INVESTING CASH FLOW ( b ) (1,718) (1,107) (351) (1,320) (2,842) 1,779 (895) (741)
Debt Issuance/(Repaid) 24 (584) (3,594) (565) (4,253) (354) (203) (382)
FCFE (145) (1,058) (910) 390 (255) (2,823) 236 501
Share Capital Issuance 232 486 1,959 11 - - - -
Dividend (151) - (75) (80) (80) - (191) (222)
Others - - - - - - - -
FINANCING CASH FLOW ( c ) 105 (98) (1,710) (634) (4,332) (354) (394) (605)
NET CASH FLOW (a+b+c) (60) (566) 920 134 (1,413) (650) 382 749
EO Items, Others
Closing Cash & Equivalents 72 55 53 171 40 (607) (225) 525
Key Ratios FY16 FY17 FY18 FY19E FY20E FY21E FY22E FY23E
PROFITABILITY (%)
GPM 35.4 37.6 38.7 41.9 41.9 37.7 41.9 42.8
EBITDA Margin 4.0 5.1 5.7 6.9 5.1 (11.3) 5.1 6.0
EBIT Margin 1.1 2.0 2.6 2.9 (2.2) (21.6) (2.3) (1.0)
APAT Margin (0.9) 0.7 1.6 1.8 (3.5) (8.4) (1.4) (0.6)
RoE (7.7) 5.0 8.4 7.1 (14.0) (21.6) (8.3) (4.3)
RoIC (or Core RoCE) 17.2 3.0 7.1 8.8 (31.0) (69.3) (20.8) (19.4)
RoCE 26.1 4.3 7.3 7.4 (12.4) (21.1) (6.8) 2.8
EFFICIENCY
Tax Rate (%) (352.6) 45.0 23.3 40.9 (138.7) 25.2 25.2 25.2
Fixed Asset Turnover (x) 5.4 4.3 4.8 4.4 3.7 1.8 2.8 2.8
Inventory (days) 48 56 35 109 131 141 134 131
Debtors (days) 4 6 5 5 4 4 4 4
Other Current Assets (days) 28 33 38 41 43 43 43 43
Payables (days) 41 48 51 130 160 167 157 154
Other Current Liab & Provns (days) 16 19 24 21 26 26 26 26
Cash Conversion Cycle (days) 24 28 3 3 (10) (7) (4) (4)
Net D/E (x) 1.6 1.8 (0.2) (0.2) (0.0) 0.0 (0.0) (0.2)
Interest Coverage (x) 0.6 1.2 2.6 7.6 (10.1) (10.7) (3.4) (0.9)
PER SHARE DATA (Rs)
EPS (4.8) 3.0 6.6 7.4 (13.8) (16.7) (4.8) (2.2)
CEPS 10.7 17.2 19.6 23.4 15.0 3.9 20.7 24.5
Dividend 0.8 0.8 0.8 0.8 - 1.8 2.1 3.0
Book Value 61.7 57.4 102.8 104.0 92.5 61.7 53.6 47.8
VALUATION
P/E (x) (39.9) 65.1 29.3 26.1 (14.0) (11.5) (40.2) (88.3)
P/BV (x) 3.1 3.4 1.9 1.9 2.1 3.1 3.6 4.0
EV/EBITDA (x) 13.5 12.9 7.2 6.1 9.4 (8.7) 10.9 8.0
EV/Revenues (x) 0.5 0.7 0.4 0.4 0.5 1.0 0.6 0.5
OCF/EV (%) 6.4 2.6 19.5 14.0 34.8 (12.1) 9.9 13.0
FCF/EV (%) (0.7) (1.9) 17.5 6.4 24.1 (14.3) 2.6 5.5
FCFE/Mkt Cap (%) (0.9) (6.6) (5.4) 2.3 (1.5) (16.7) 1.4 3.0
Dividend Yield (%) 0.4 0.4 0.4 0.4 - 0.9 1.1 1.6
Source: Company, HSIE Research

Page | 34
Fashion & Lifestyle Thematic
0
50
100
150
200
250
Ap
r-2
0
Jun
-20
Au
g-2
0
Oct
-20
Dec
-20
Feb
-21
Ap
r-2
1
ABFRL
0
100
200
300
400
500
600
700
800
900
1000
Ap
r-2
0
Jun
-20
Au
g-2
0
Oct
-20
Dec
-20
Feb
-21
Ap
r-2
1
Trent
0
500
1000
1500
2000
2500
3000
3500
Ap
r-2
0
Jun
-20
Au
g-2
0
Oct
-20
Dec
-20
Feb
-21
Ap
r-2
1
V-Mart
0
100
200
300
400
500
600
Ap
r-2
0
Jun
-20
Au
g-2
0
Oct
-20
Dec
-20
Feb
-21
Ap
r-2
1
TCNS
0
50
100
150
200
250
300
Ap
r-2
0
Jun
-20
Au
g-2
0
Oct
-20
Dec
-20
Feb
-21
Ap
r-2
1
Shoppers Stop
Rating Criteria
BUY: >+15% return potential
ADD: +5% to +15% return potential
REDUCE: -10% to +5% return potential
SELL: > 10% Downside return potential
1 Yr Price Movement

Page | 35
Fashion & Lifestyle Thematic
Thematic reports by HSIE
Cement: WHRS – A key cog
in the flywheel
Autos: Where are we on “S”
curve?
FMCG: Defensive businesses
but not valuations
Autos: A changed landscape Banks: Double whammy for
some
India Equity Strategy: Atma
Nirbhar Bharat
Indian IT: Demand recovery
in sight
Life Insurance: Recovery may
be swift with protection
driving margins
Retail: Whole flywheel is
broken?
Appliances: Looing beyond
near-term disruption
Pharma: Chronic therapy – A
portfolio prescription
Indian Gas: Looking beyond
the pandemic
India Equity Strategy:
Quarterly flipbook
Real Estate: Ripe for
consumption
Indian IT: expanding centre
of gravity
Indian Chemical: Evolution
to revolution!
Life Insurance: ULIP vs. MF Infrastructure: On the road to
rerating
Cement: Spotting the sweet
spot
Pharma: Cardiac: the
heartbeat of domestic market
Life Insurance: Comparative
annual report analysis
Indian microfinance: Should
you look micro as macros
disappoint?
India Equity Strategy:
Quarterly flipbook
Autos: Divergent trends in
PVs and 2Ws
India Internet: the stage is set FMCG: Opportunity in
adversity - A comparative
scorecard
Logistics: Indian Railways -
getting aggressive
Industrials: Triggering a new
cycle
Indian IT: raising the bar India Equity Strategy:
Quarterly flipbook
India Equity Strategy:
Quarterly flipbook
India Hospitals: capital
discipline improving,
sustenance is key
Autos: Will EVs impact the
‘EV’?
Cement: Riding High Power: Reforms essential for
rennaissance

Page | 36
Fashion & Lifestyle Thematic
HDFC securities
Institutional Equities
Unit No. 1602, 16th Floor, Tower A, Peninsula Business Park,
Senapati Bapat Marg, Lower Parel, Mumbai - 400 013
Board: +91-22-6171-7330 www.hdfcsec.com
Disclosure:
I, Jay Gandhi, MBA, author and the name subscribed to this report, hereby certify that all of the views expressed in this research report accurately reflect our
views about the subject issuer(s) or securities. HSL has no material adverse disciplinary history as on the date of publication of this report. We also certify that no
part of our compensation was, is, or will be directly or indirectly related to the specific recommendation(s) or view(s) in this report.
Research Analyst or his/her relative or HDFC Securities Ltd. does not have any financial interest in the subject company. Also Research Analyst or his relative or
HDFC Securities Ltd. or its Associate may have beneficial ownership of 1% or more in the subject company at the end of the month immediately preceding the
date of publication of the Research Report. Further Research Analyst or his relative or HDFC Securities Ltd. or its associate does not have any material conflict of
interest.
Any holding in stock –No
HDFC Securities Limited (HSL) is a SEBI Registered Research Analyst having registration no. INH000002475.
Disclaimer:
This report has been prepared by HDFC Securities Ltd and is solely for information of the recipient only. The report must not be used as a singular basis of any
investment decision. The views herein are of a general nature and do not consider the risk appetite or the particular circumstances of an individual investor;
readers are requested to take professional advice before investing. Nothing in this document should be construed as investment advice. Each recipient of this
document should make such investigations as they deem necessary to arrive at an independent evaluation of an investment in securities of the companies
referred to in this document (including merits and risks) and should consult their own advisors to determine merits and risks of such investment. The
information and opinions contained herein have been compiled or arrived at, based upon information obtained in good faith from sources believed to be reliable.
Such information has not been independently verified and no guaranty, representation of warranty, express or implied, is made as to its accuracy, completeness
or correctness. All such information and opinions are subject to change without notice. Descriptions of any company or companies or their securities mentioned
herein are not intended to be complete. HSL is not obliged to update this report for such changes. HSL has the right to make changes and modifications at any
time.
This report is not directed to, or intended for display, downloading, printing, reproducing or for distribution to or use by, any person or entity who is a citizen or
resident or located in any locality, state, country or other jurisdiction where such distribution, publication, reproduction, availability or use would be contrary to
law or regulation or what would subject HSL or its affiliates to any registration or licensing requirement within such jurisdiction.
If this report is inadvertently sent or has reached any person in such country, especially, United States of America, the same should be ignored and brought to the
attention of the sender. This document may not be reproduced, distributed or published in whole or in part, directly or indirectly, for any purposes or in any
manner.
Foreign currencies denominated securities, wherever mentioned, are subject to exchange rate fluctuations, which could have an adverse effect on their value or
price, or the income derived from them. In addition, investors in securities such as ADRs, the values of which are influenced by foreign currencies effectively
assume currency risk. It should not be considered to be taken as an offer to sell or a solicitation to buy any security.
This document is not, and should not, be construed as an offer or solicitation of an offer, to buy or sell any securities or other financial instruments. This report
should not be construed as an invitation or solicitation to do business with HSL. HSL may from time to time solicit from, or perform broking, or other services for,
any company mentioned in this mail and/or its attachments.
HSL and its affiliated company(ies), their directors and employees may; (a) from time to time, have a long or short position in, and buy or sell the securities of the
company(ies) mentioned herein or (b) be engaged in any other transaction involving such securities and earn brokerage or other compensation or act as a market
maker in the financial instruments of the company(ies) discussed herein or act as an advisor or lender/borrower to such company(ies) or may have any other
potential conflict of interests with respect to any recommendation and other related information and opinions.
HSL, its directors, analysts or employees do not take any responsibility, financial or otherwise, of the losses or the damages sustained due to the investments
made or any action taken on basis of this report, including but not restricted to, fluctuation in the prices of shares and bonds, changes in the currency rates,
diminution in the NAVs, reduction in the dividend or income, etc.
HSL and other group companies, its directors, associates, employees may have various positions in any of the stocks, securities and financial instruments dealt in
the report, or may make sell or purchase or other deals in these securities from time to time or may deal in other securities of the companies / organizations
described in this report.
HSL or its associates might have managed or co-managed public offering of securities for the subject company or might have been mandated by the subject
company for any other assignment in the past twelve months.
HSL or its associates might have received any compensation from the companies mentioned in the report during the period preceding twelve months from the
date of this report for services in respect of managing or co-managing public offerings, corporate finance, investment banking or merchant banking, brokerage
services or other advisory service in a merger or specific transaction in the normal course of business.
HSL or its analysts did not receive any compensation or other benefits from the companies mentioned in the report or third party in connection with preparation
of the research report. Accordingly, neither HSL nor Research Analysts have any material conflict of interest at the time of publication of this report.
Compensation of our Research Analysts is not based on any specific merchant banking, investment banking or brokerage service transactions. HSL may have
issued other reports that are inconsistent with and reach different conclusion from the information presented in this report.
Research entity has not been engaged in market making activity for the subject company. Research analyst has not served as an officer, director or employee of
the subject company. We have not received any compensation/benefits from the subject company or third party in connection with the Research Report.
HDFC securities Limited, I Think Techno Campus, Building - B, "Alpha", Office Floor 8, Near Kanjurmarg Station, Opp. Crompton Greaves, Kanjurmarg
(East), Mumbai 400 042 Phone: (022) 3075 3400 Fax: (022) 2496 5066 Compliance Officer: Binkle R. Oza Email: [email protected] Phone: (022)
3045 3600
HDFC Securities Limited, SEBI Reg. No.: NSE, BSE, MSEI, MCX: INZ000186937; AMFI Reg. No. ARN: 13549; PFRDA Reg. No. POP: 11092018; IRDA
Corporate Agent License No.: CA0062; SEBI Research Analyst Reg. No.: INH000002475; SEBI Investment Adviser Reg. No.: INA000011538; CIN -
U67120MH2000PLC152193