FAS Customer Satisfaction Index (CSI) –– The Basics
1
Improving the customer experience is one of Financial and Administrative Services’ (FAS) True North pillars of excellence to support the UCSF mission. Our FAS-wide customer survey program strives to capture your feedback in a way that both respects your time and helps us continuously improve. FAS Customer Satisfaction Index (CSI) –– The Basics Want more details? See our summary highlights of progress made on Financial & Administrative Services (FAS) Survey Approach June July Aug Sept Oct Nov Dec Jan Feb Mar Apr May Q1 Q2 Q3 Q4 Serves as True North metric for Customer Experience pillar Uses a quarterly sampling approach to balance survey fatigue with the need for data to support continuous improvement Flexible survey questionnaire facilitates experimentation Individual mini surveys measure your experience in 6 major service areas Survey Schedule July 2019 * October 2019 * January 2020 * April 2020 06/28/19 Lorem ipsum Benchmarks 1 = Poor 0 2 11 3 22 4 33 5 44 6 56 7 67 8 78 9 89 10 = Excellent 100 RATING CSI CSI conversion: ((CSI – 1/9)*100) Customer Satisfaction Model The Customer Satisfaction Index (CSI) has a cause-and-effect model which leads to important outcomes of partnership and trust. •FAS score = average of 6 surveys •10 pt scale converted to 0-100 score reflects average score (not percent satisfied or top box) •Internal service scores often lower (usually 50s, 60s & 70s) due to the complex nature of service delivery ADDITIONAL BENCHMARKS: http://www.theacsi.org http://www.cfigroup.com
Transcript of FAS Customer Satisfaction Index (CSI) –– The Basics
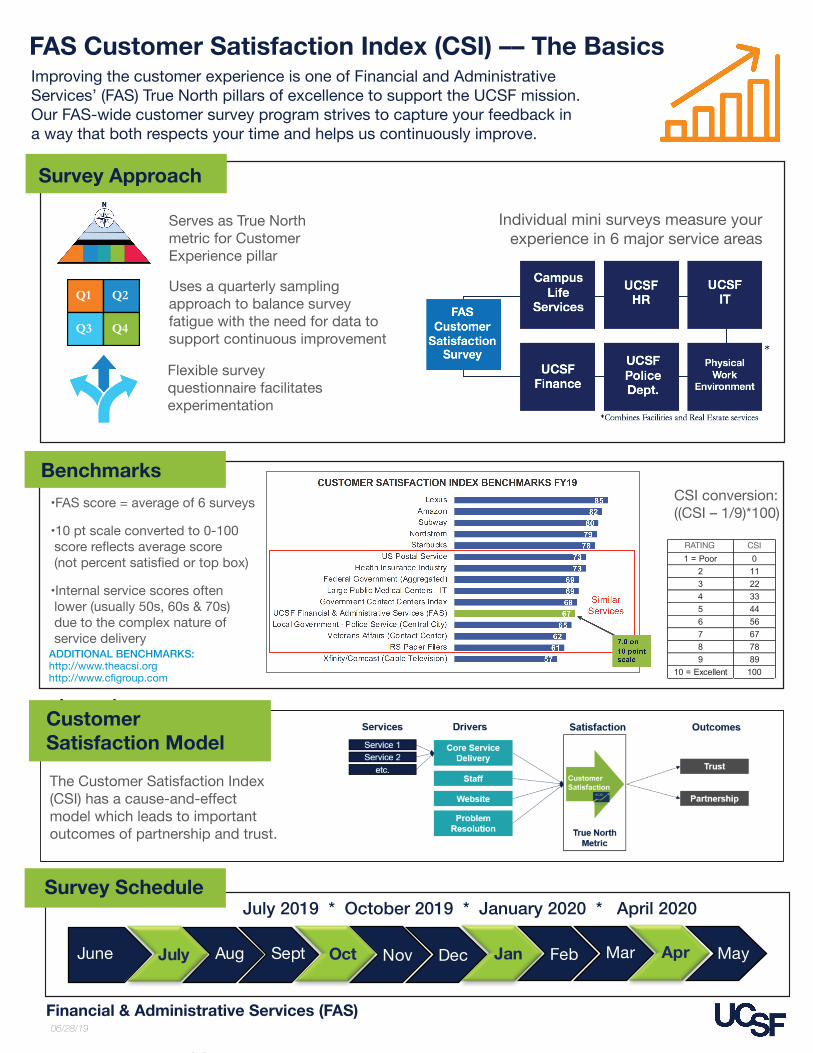
Improving the customer experience is one of Financial and Administrative Services’ (FAS) True North pillars of excellence to support the UCSF mission. Our FAS-wide customer survey program strives to capture your feedback in a way that both respects your time and helps us continuously improve.
FAS Customer Satisfaction Index (CSI) –– The Basics
Want more details? See our summary highlights of progress made on some of our action plans through April 2018. Action plans are sorted by FAS Department and show engagement questions impacted.
Financial & Administrative Services (FAS)
Survey Approach
June July Aug Sept Oct Nov Dec Jan Feb Mar Apr May
Q1 Q2
Q3 Q4
Serves as True North metric for Customer Experience pillar
Uses a quarterly sampling approach to balance survey fatigue with the need for data to support continuous improvement
Flexible survey questionnaire facilitates experimentation
Individual mini surveys measure your experience in 6 major service areas
Survey ScheduleJuly 2019 * October 2019 * January 2020 * April 2020
06/28/19
Lorem ipsum
Benchmarks
1 = Poor 02 113 224 335 446 567 678 789 89
10 = Excellent 100
RATING CSI
CSI conversion:((CSI – 1/9)*100)
Customer Satisfaction Model
The Customer Satisfaction Index (CSI) has a cause-and-effect model which leads to important outcomes of partnership and trust.
•FAS score = average of 6 surveys
•10 pt scale converted to 0-100 score reflects average score (not percent satisfied or top box)
•Internal service scores often lower (usually 50s, 60s & 70s) due to the complex nature of service delivery ADDITIONAL BENCHMARKS: http://www.theacsi.orghttp://www.cfigroup.com