Farmers: The HUNT Study, Norway Anxiety and Depression ... among farmers.pdf · Anxiety and...
11
Full Terms & Conditions of access and use can be found at http://www.tandfonline.com/action/journalInformation?journalCode=wagr20 Download by: [182.73.193.34] Date: 29 February 2016, At: 02:29 Journal of Agromedicine ISSN: 1059-924X (Print) 1545-0813 (Online) Journal homepage: http://www.tandfonline.com/loi/wagr20 Anxiety and Depression Symptoms Among Farmers: The HUNT Study, Norway Magnhild Oust Torske, Bjørn Hilt, David Glasscock, Peter Lundqvist & Steinar Krokstad To cite this article: Magnhild Oust Torske, Bjørn Hilt, David Glasscock, Peter Lundqvist & Steinar Krokstad (2016) Anxiety and Depression Symptoms Among Farmers: The HUNT Study, Norway, Journal of Agromedicine, 21:1, 24-33, DOI: 10.1080/1059924X.2015.1106375 To link to this article: http://dx.doi.org/10.1080/1059924X.2015.1106375 Published with license by Taylor & Francis.© 2016 M. O. Torske, B. Hilt, D. Glasscock, P. Lundqvist, S. Krokstad. Accepted author version posted online: 21 Oct 2015. Submit your article to this journal Article views: 261 View related articles View Crossmark data
Transcript of Farmers: The HUNT Study, Norway Anxiety and Depression ... among farmers.pdf · Anxiety and...
Full Terms & Conditions of access and use can be found athttp://www.tandfonline.com/action/journalInformation?journalCode=wagr20
Download by: [182.73.193.34] Date: 29 February 2016, At: 02:29
Journal of Agromedicine
ISSN: 1059-924X (Print) 1545-0813 (Online) Journal homepage: http://www.tandfonline.com/loi/wagr20
Anxiety and Depression Symptoms AmongFarmers: The HUNT Study, Norway
Magnhild Oust Torske, Bjørn Hilt, David Glasscock, Peter Lundqvist & SteinarKrokstad
To cite this article: Magnhild Oust Torske, Bjørn Hilt, David Glasscock, Peter Lundqvist &Steinar Krokstad (2016) Anxiety and Depression Symptoms Among Farmers: The HUNT Study,Norway, Journal of Agromedicine, 21:1, 24-33, DOI: 10.1080/1059924X.2015.1106375
To link to this article: http://dx.doi.org/10.1080/1059924X.2015.1106375
Published with license by Taylor & Francis.©2016 M. O. Torske, B. Hilt, D. Glasscock, P.Lundqvist, S. Krokstad.
Accepted author version posted online: 21Oct 2015.
Submit your article to this journal
Article views: 261
View related articles
View Crossmark data
Anxiety and Depression Symptoms Among Farmers: The HUNT Study, NorwayMagnhild Oust Torskea, Bjørn Hiltb,c, David Glasscockd, Peter Lundqviste, and Steinar Krokstada,f
aHUNT Research Center, Department of Public Health and General Practice, Faculty of Medicine, the Norwegian University of Science andTechnology (NTNU), Levanger, Norway; bDepartment of Public Health and General Practice, Faculty of Medicine, the Norwegian University ofScience and Technology, Trondheim, Norway; cDepartment of Occupational Medicine, St. Olav’s Hospital, Trondheim University Hospital,Trondheim, Norway; dDanish Ramazzini Center, Department of Occupational Medicine, Regional Hospital West Jutland, University ResearchClinic, Herning, Denmark; eDepartment of Work Science, Business Economics and Environmental Psychology, Swedish University ofAgricultural Sciences, Alnarp, Sweden; fPsychiatric Department, Levanger Hospital, Nord-Trøndelag Health Trust, Norway
ABSTRACTAgriculture has undergone profound changes, and farmers face a wide variety of stressors. Ouraim was to study the levels of anxiety and depression symptoms among Norwegian farmerscompared with other occupational groups. Working participants in the HUNT3 Survey (The Nord-Trøndelag Health Study, 2006–2008), aged 19–66.9 years, were included in this cross-sectionalstudy. We compared farmers (women, n = 317; men, n = 1,100) with HUNT3 participants workingin other occupational groups (women, n = 13,429; men, n = 10,026), classified according tosocioeconomic status. We used the Hospital Anxiety and Depression Scale (HADS) to measureanxiety and depression symptoms. Both male and female farmers had higher levels of depressionsymptoms than the general working population, but the levels of anxiety symptoms did not differ.The differences in depression symptom levels between farmers and the general working popula-tion increased with age. In an age-adjusted logistic regression analysis, the odds ratio (OR) fordepression caseness (HADS-D ≥8) when compared with the general working population was 1.49(95% confidence interval [CI]: 1.22–1.83) in men and 1.29 (95% CI: 0.85–1.95) in women. Malefarmers had a higher OR of depression caseness than any other occupational group (OR = 1.94,95% CI: 1.52–2.49, using higher-grade professionals as reference). Female farmers had an ORsimilar to men (2.00, 95% CI: 1.26–3.17), but lower than other manual occupations. We found thatfarmers had high levels of depression symptoms and average levels of anxiety symptomscompared with other occupational groups.
KEYWORDSAgricultural workers;anxiety; cross-sectionalstudies; depression;socioeconomic factors
Introduction
Few occupations have undergone more profoundchanges over the past few decades than thoseexperienced by farmers, and the number ofNorwegian farmers has decreased.1 Despite geo-graphical and political differences, the same trendscan be seen in most industrialized countries,2,3 andthe demands and stressors farmers face in arapidly changing sector appear to be similar acrossborders.4
Occupational stressors that are unique tofarmers, such as physical environment, familystructure, farm economy, bureaucracy, andother uncertainties associated with farming,5,6
may have been aggravated in recent yearsbecause of the structural and economic changesin agriculture.6 These stressors may be hazar-dous to mental health, but research has so far
not provided a clear answer to the question ofwhether or not the mental health of farmersdiffers from that of the general workingpopulation.7 Psychiatric disorders are com-monly a contributing factor to suicide,8 andfarmers are at increased risk of suicide.9,10
Mental illness appears to be particularly stigma-tizing in farming communities, and farmersseem reluctant to contact the health care systemfor help for mental health problems.5,6 Verylimited research is available on the mentalhealth of female farmers, but there is someevidence to suggest that female farmers experi-ence more psychological distress than their malecolleagues.11–13
The HUNT Study (Helseundersøkelsen i Nord-Trøndelag, the Nord-Trøndelag Health Study) isone of the largest health studies ever performed. It
CONTACT Magnhild Oust Torske [email protected] HUNT Research Center, Forskningsvegen 2, 7600 Levanger, Norway.
JOURNAL OF AGROMEDICINE2016, VOL. 21, NO. 1, 24–33http://dx.doi.org/10.1080/1059924X.2015.1106375
© 2016 M. O. Torske, B. Hilt, D. Glasscock, P. Lundqvist, S. Krokstad. Published with license by Taylor & Francis.This is an Open Access article. Non-commercial re-use, distribution, and reproduction in any medium, provided the original work is properly attributed, cited, and is not altered,transformed, or built upon in any way, is permitted. The moral rights of the named author(s) have been asserted.
Dow
nloa
ded
by [
182.
73.1
93.3
4] a
t 02:
29 2
9 Fe
brua
ry 2
016
has been undertaken in Nord-Trøndelag County,Norway, since the 1980s. Nord-Trøndelag Countyhas a substantial agricultural production, and theHUNT Study represents a unique opportunity tostudy the mental health of farmers.
We wanted to answer the following researchquestion: Do the levels of anxiety and depressionsymptoms in Norwegian farmers differ from thoseof other occupational groups?
Materials and methods
The HUNT Study includes large total population-based cohorts from Nord-Trøndelag County:HUNT1 (1984–1986), HUNT2 (1995–1997), andHUNT3 (2006–2008), with 125,000 participants intotal.14–16 The county is largely rural, the largest ofthe six main towns has a population of only 21,000.
All 93,860 residents of Nord-Trøndelag aged 20years and above were invited to take part inHUNT3. In all, 50,805 (54.1%) participated.Information from the participants was gatheredthrough various questionnaires, an interview atthe health examination sites, and measurementssuch as weight and height.16
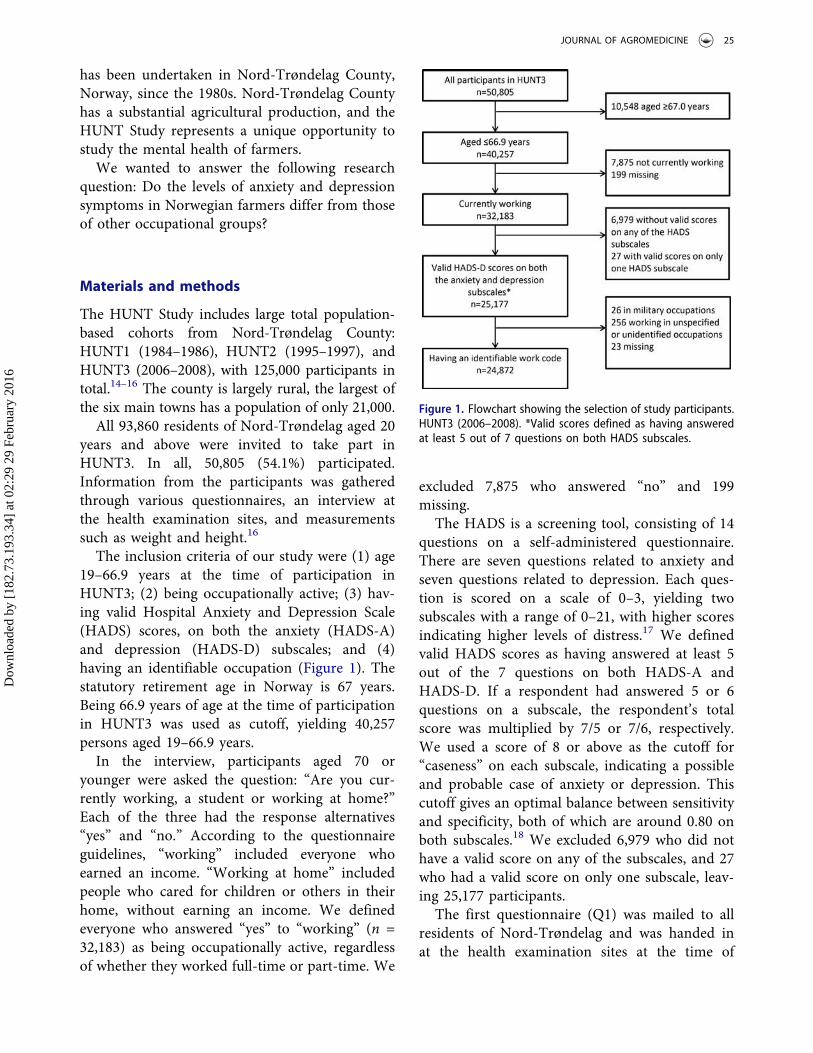
The inclusion criteria of our study were (1) age19–66.9 years at the time of participation inHUNT3; (2) being occupationally active; (3) hav-ing valid Hospital Anxiety and Depression Scale(HADS) scores, on both the anxiety (HADS-A)and depression (HADS-D) subscales; and (4)having an identifiable occupation (Figure 1). Thestatutory retirement age in Norway is 67 years.Being 66.9 years of age at the time of participationin HUNT3 was used as cutoff, yielding 40,257persons aged 19–66.9 years.
In the interview, participants aged 70 oryounger were asked the question: “Are you cur-rently working, a student or working at home?”Each of the three had the response alternatives“yes” and “no.” According to the questionnaireguidelines, “working” included everyone whoearned an income. “Working at home” includedpeople who cared for children or others in theirhome, without earning an income. We definedeveryone who answered “yes” to “working” (n =32,183) as being occupationally active, regardlessof whether they worked full-time or part-time. We
excluded 7,875 who answered “no” and 199missing.
The HADS is a screening tool, consisting of 14questions on a self-administered questionnaire.There are seven questions related to anxiety andseven questions related to depression. Each ques-tion is scored on a scale of 0–3, yielding twosubscales with a range of 0–21, with higher scoresindicating higher levels of distress.17 We definedvalid HADS scores as having answered at least 5out of the 7 questions on both HADS-A andHADS-D. If a respondent had answered 5 or 6questions on a subscale, the respondent’s totalscore was multiplied by 7/5 or 7/6, respectively.We used a score of 8 or above as the cutoff for“caseness” on each subscale, indicating a possibleand probable case of anxiety or depression. Thiscutoff gives an optimal balance between sensitivityand specificity, both of which are around 0.80 onboth subscales.18 We excluded 6,979 who did nothave a valid score on any of the subscales, and 27who had a valid score on only one subscale, leav-ing 25,177 participants.
The first questionnaire (Q1) was mailed to allresidents of Nord-Trøndelag and was handed inat the health examination sites at the time of
Figure 1. Flowchart showing the selection of study participants.HUNT3 (2006–2008). *Valid scores defined as having answeredat least 5 out of 7 questions on both HADS subscales.
JOURNAL OF AGROMEDICINE 25
Dow
nloa
ded
by [
182.
73.1
93.3
4] a
t 02:
29 2
9 Fe
brua
ry 2
016
participation. The second questionnaire (Q2) washanded out at the health examination site andreturned by mail, resulting in a lower responserate. The HADS questions were on Q2, and ofthe 7,006 without valid anxiety and depressionscores, 6,749 (96.3%) had not returned Q2. Theproportion of respondents with valid HADS scoreswas very similar in farmers and nonfarmers.
Information about a participant’s work title wasgathered at the interview. If a participant had morethan one job, only the main occupation wasrecorded. The work titles were classified manuallyby Statistics Norway according to the STYRK(Standard for yrkesklassifisering, StandardClassification of Occupations) work codes.19 TheSTYRK is based on ISCO-88(COM), which is theEuropean Union version of the InternationalStandard Classification of Occupations (ISCO-88).20 The STYRK work codes are hierarchal. Thefirst number in the four-digit code provides infor-mation about the main occupational category, thesecond provides further subdivision, and so on.There were 1,168 working respondents (includingrespondents who were outside of the age range orwithout valid HADS scores), recorded with a worktitle, who had not been classified by StatisticsNorway. They were classified manually into oneof the nine main subgroups given by the first digitin the four-digit STYRK code. Work titles thatcould not be readily placed into one of the ninegroups were coded as “unidentified.” We excluded305 respondents who were in military occupations(n = 26), missing (n = 23), or in unspecified orunidentified occupations (n = 256), yielding a finalstudy population of 24,872.
Using the first digit of the STYRK codes, thestudy population was classified into six groupsbased on a simplified version of the Erikson-Goldthorpe-Portocarero (EGP) social classscheme.21 We defined the study group “farmers”(n = 1,598) as the following occupations withSTYRK codes starting with 6 (“Occupation infarming, forestry and fisheries”): “6111 Field cropand vegetable growers” (n = 83), “6121 Dairy andlivestock producers” (n = 664), “6122 Poultry pro-ducers” (n = 7), “6129 Animal producers andrelated workers not elsewhere classified” (n = 6),and “6130 Crop and animal producers” (n = 838).When going through the work titles of the farmers
manually, several smaller subgroups were identi-fied. Reindeer owners (n = 18), any work title thatimplied that the respondent was a farm workerand not a self-owning farmer (n = 133), andrespondents with work titles suggesting that theywere wrongly classified as farmers (n = 30) werereclassified. The remaining 1,417 respondents allhad a variation of “farmer” as their work title.
STYRK codes starting with 1 (“Legislators,senior officials and managers,” n = 1,963) and 2(“Academia,” n = 2,636) were combined in a sim-plified EGP group labeled “Higher-grade profes-sionals” (n = 4,599). STYRK codes starting with 3(“Occupation with shorter education from college/university/tech. school,” n = 5,949) were labeled“Lower-grade professionals.” STYRK codes start-ing with 4 (“Office/service occupations,” n =1,718) and 5 (“Sale/service/care occupations,” n =5,613) were labeled “Routine non-manual employ-ees” (n = 7,331). STYRK codes starting with 7(“Trade/craft occupation,” n = 2,427) and 8(“machine operator/transport worker,” n = 1,696)were labeled “Lower-grade technicians, supervisorsof manual workers, skilled manual workers,” fromhere on referred to as “skilled manual workers.” Inaddition, “6112 Market gardeners” (n = 83) and“6310 Fish farmers” (n = 70) were included, yield-ing a total of 4,276 skilled manual workers. STYRKcodes starting with 9 (“Occupation that doesn’trequire education,” n = 1,047) were classified as“Unskilled manual workers.” In addition, “6411Fishery workers” (n = 36), “6210 Forestry workers”(n = 66), as well as the previously mentioned farmworkers (n = 133) and reindeer owners (n = 18)were classified as unskilled manual workers, mak-ing the total n = 1,300.
We compared farmers with the combined groupof HUNT3 participants working in all other occu-pations (AOO), as well as dividing the AOO groupaccording to the EGP scheme. We investigated theassociation between occupation and depression byusing HADS-D caseness as the dependent variablein two different logistic regression models. HADS-A caseness was not tested, as no differencesbetween farmers and the other occupationalgroups were found in the initial analyses. In thefirst model, we compared farmers with the AOOgroup by including being a farmer as a dichoto-mous variable. In the second model, we put
26 M. O. TORSKE ET AL.
Dow
nloa
ded
by [
182.
73.1
93.3
4] a
t 02:
29 2
9 Fe
brua
ry 2
016
farmers into a socioeconomic context by includingEGP group as a categorical variable, using higher-grade professionals as the reference category.
We used directed acyclic graphs (DAGs) to iden-tify possible confounders and mediators.22 The ana-lyses were stratified by sex to eliminate sex as aconfounder and to allow investigation of possiblesex differences. We considered age as a confounderand adjusted for it by entering age as a categoricalvariable in 10-year increments in both models. Inthe first model, we also adjusted for education,using data from the National Education Databasethat were matched with HUNT3 data by using the11-digit unique national identification number.Education was classified according to the highestlevel of education completed: Higher education (≥3years), secondary school, or not having graduatedfrom secondary school. In the second model, wedid not adjust for education, as we considerededucation to be a mediator in the relationshipbetween the exposure variable occupation (as ameasure of socioeconomic status) and the outcomevariable depression. We also considered other vari-ables, such as physical health, social background,and work-related variables, to be mediators and didnot adjust for them.
The analyses were conducted using IBM SPSSStatistics 21 (IBM, Armonk, NY, USA). The forestplot was made using Metadata Viewer version1.05.23
Results
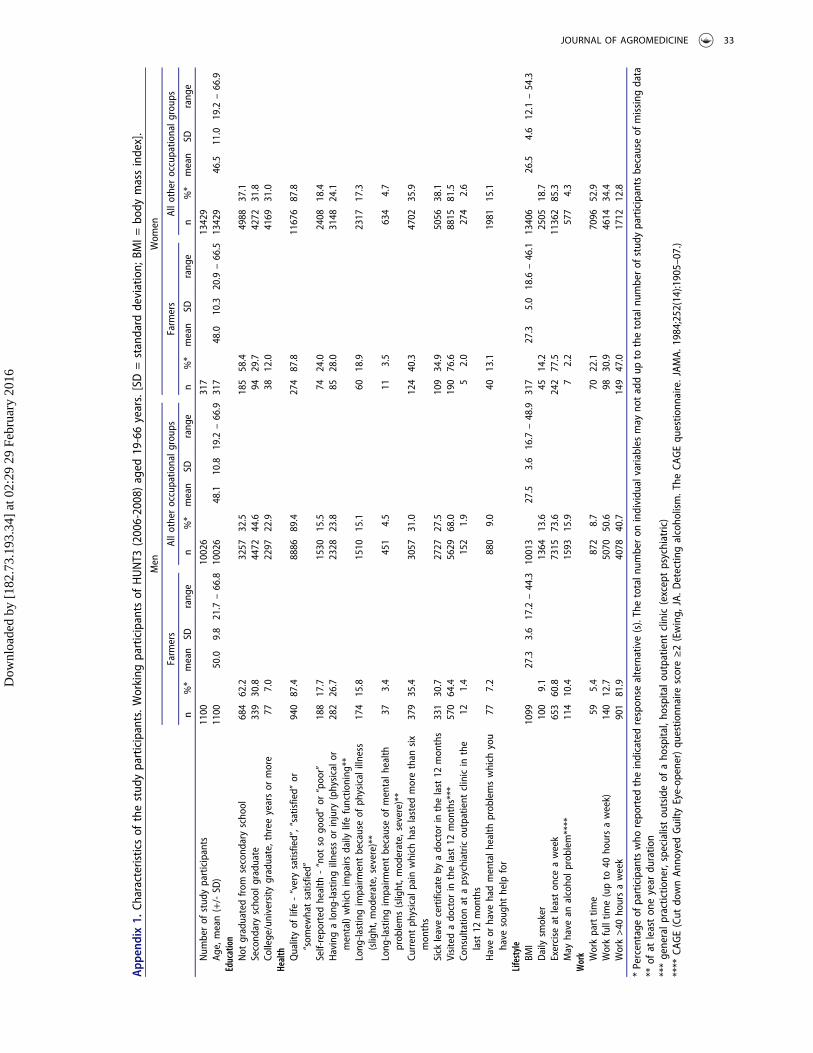
Characteristics of the study group and the AOOgroup are shown in Appendix 1. HADS-A andHADS-D mean scores and prevalences of anxietyand depression caseness are shown in Table 1.Farmers had a higher mean HADS-D score and ahigher prevalence of depression caseness than thegeneral working population, but the levels of anxi-ety symptoms did not differ. In the age-adjustedlogistic regression analysis, male farmers (125cases) had an odds ratio (OR) of depression case-ness of 1.49 (95% confidence interval [CI]: 1.22–1.83) compared with the AOO group (1033 cases).The OR for female farmers (25 cases) was 1.29(95% CI: 0.85–1.95) compared with the AOOgroup (828 cases). When adjusting for age andeducation, the ORs fell to 1.35 (95% CI: 1.10–1.65) in men and 1.21 (95% CI: 0.80–1.83) inwomen. Results of the logistic regression modelwith EGP groups are shown in Figure 2. Malefarmers had the highest level of depression symp-toms of any occupational group in our study.
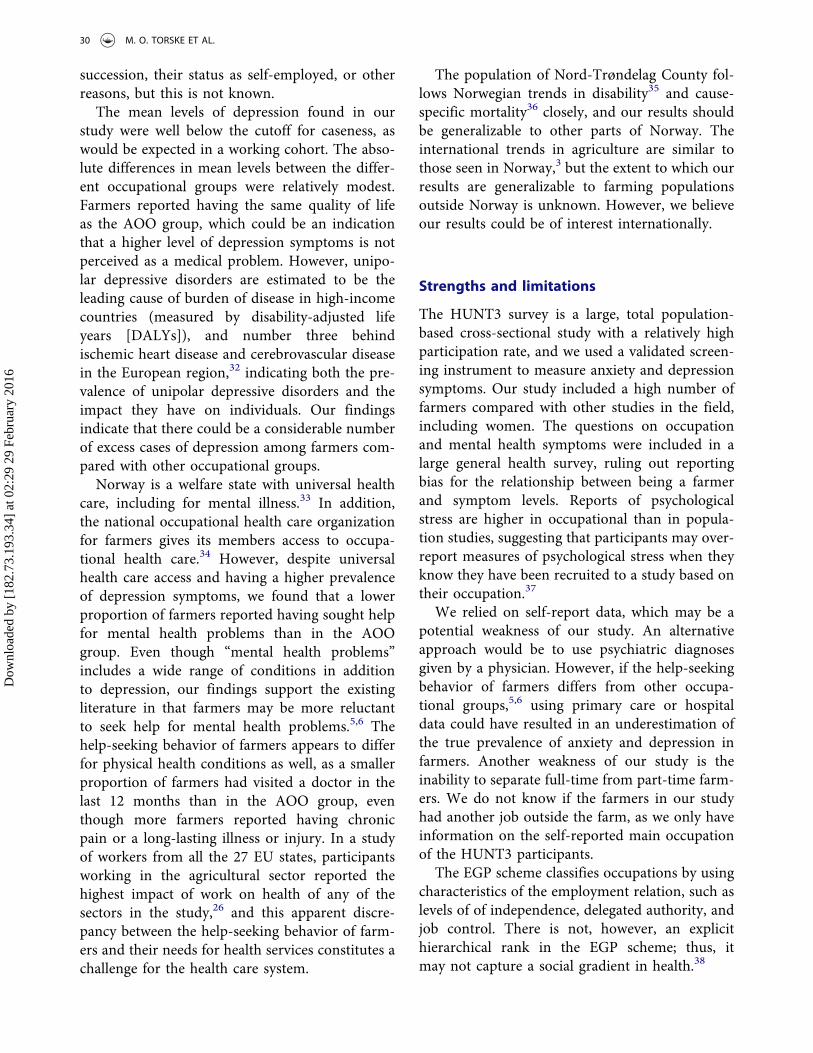
The results of age-stratified analyses are shown inFigure 3. The absolute differences in mean HADS-Ascores between farmers and the AOO group wereminor formen andwomen, as well as in all age groups(Figure 3A). The absolute differences inmeanHADS-D scores between farmers and the AOO groupincreased with increasing age (Figure 3B).
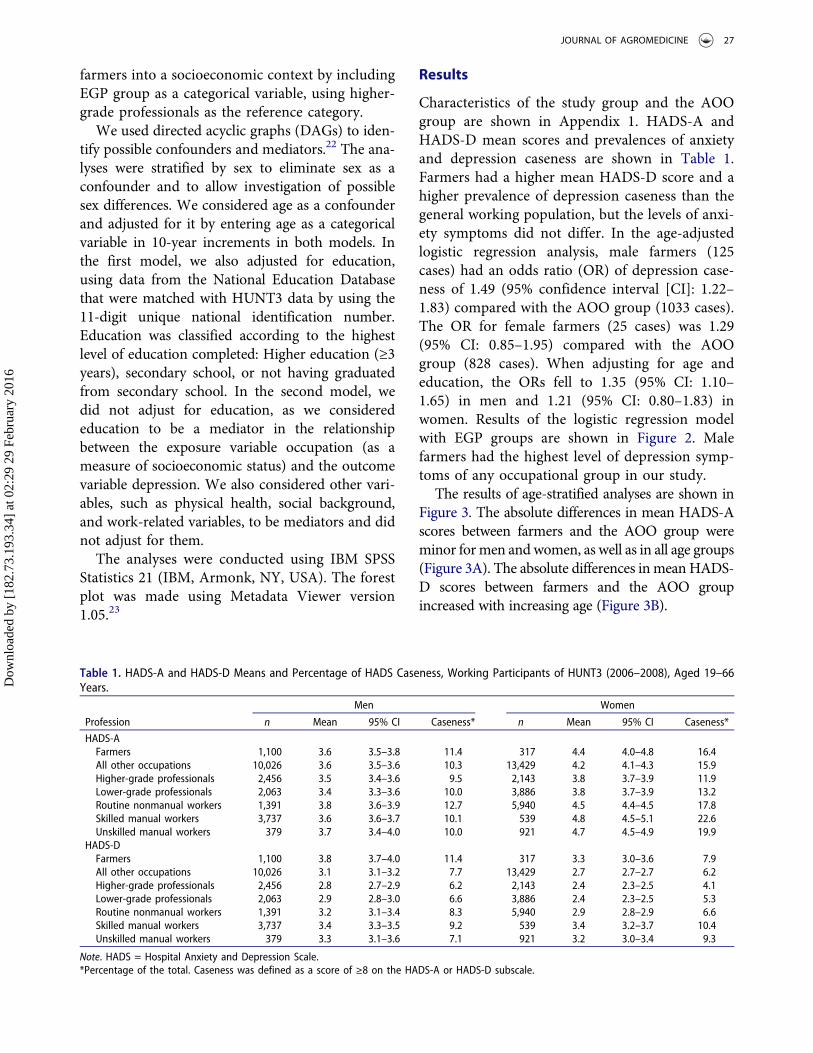
Table 1. HADS-A and HADS-D Means and Percentage of HADS Caseness, Working Participants of HUNT3 (2006–2008), Aged 19–66Years.
Men Women
Profession n Mean 95% CI Caseness* n Mean 95% CI Caseness*
HADS-AFarmers 1,100 3.6 3.5–3.8 11.4 317 4.4 4.0–4.8 16.4All other occupations 10,026 3.6 3.5–3.6 10.3 13,429 4.2 4.1–4.3 15.9Higher-grade professionals 2,456 3.5 3.4–3.6 9.5 2,143 3.8 3.7–3.9 11.9Lower-grade professionals 2,063 3.4 3.3–3.6 10.0 3,886 3.8 3.7–3.9 13.2Routine nonmanual workers 1,391 3.8 3.6–3.9 12.7 5,940 4.5 4.4–4.5 17.8Skilled manual workers 3,737 3.6 3.6–3.7 10.1 539 4.8 4.5–5.1 22.6Unskilled manual workers 379 3.7 3.4–4.0 10.0 921 4.7 4.5–4.9 19.9
HADS-DFarmers 1,100 3.8 3.7–4.0 11.4 317 3.3 3.0–3.6 7.9All other occupations 10,026 3.1 3.1–3.2 7.7 13,429 2.7 2.7–2.7 6.2Higher-grade professionals 2,456 2.8 2.7–2.9 6.2 2,143 2.4 2.3–2.5 4.1Lower-grade professionals 2,063 2.9 2.8–3.0 6.6 3,886 2.4 2.3–2.5 5.3Routine nonmanual workers 1,391 3.2 3.1–3.4 8.3 5,940 2.9 2.8–2.9 6.6Skilled manual workers 3,737 3.4 3.3–3.5 9.2 539 3.4 3.2–3.7 10.4Unskilled manual workers 379 3.3 3.1–3.6 7.1 921 3.2 3.0–3.4 9.3
Note. HADS = Hospital Anxiety and Depression Scale.*Percentage of the total. Caseness was defined as a score of ≥8 on the HADS-A or HADS-D subscale.
JOURNAL OF AGROMEDICINE 27
Dow
nloa
ded
by [
182.
73.1
93.3
4] a
t 02:
29 2
9 Fe
brua
ry 2
016
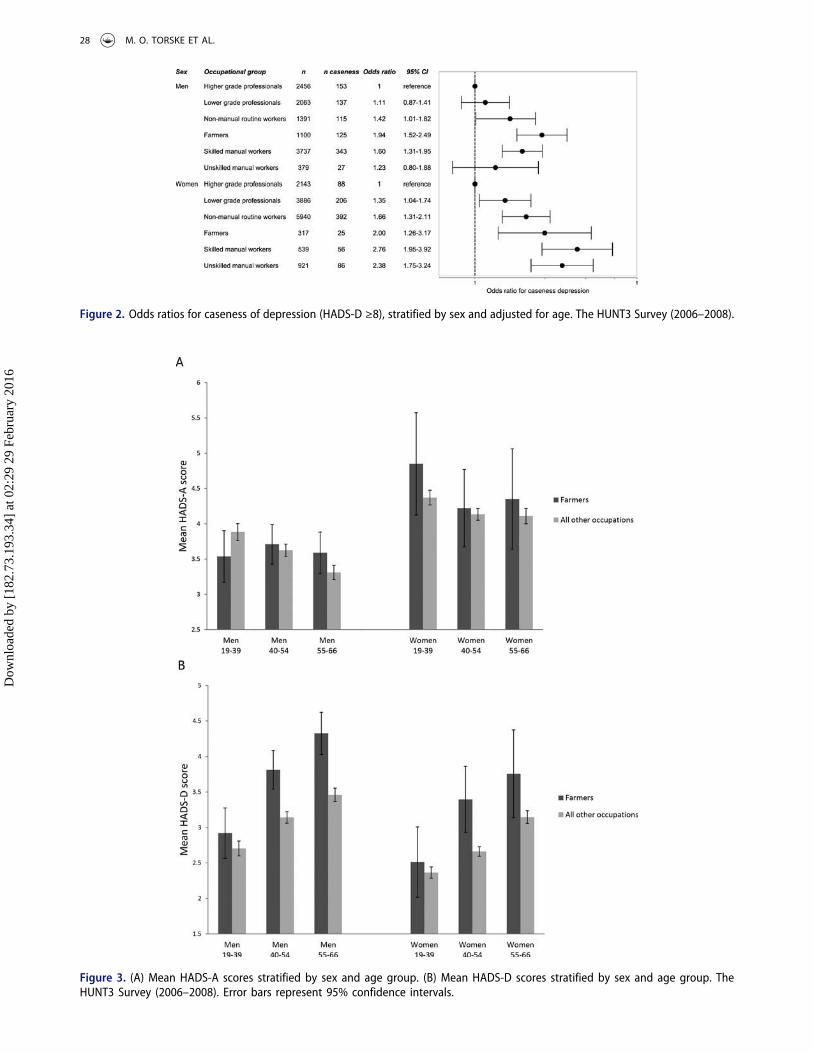
Figure 2. Odds ratios for caseness of depression (HADS-D ≥8), stratified by sex and adjusted for age. The HUNT3 Survey (2006–2008).
Figure 3. (A) Mean HADS-A scores stratified by sex and age group. (B) Mean HADS-D scores stratified by sex and age group. TheHUNT3 Survey (2006–2008). Error bars represent 95% confidence intervals.
28 M. O. TORSKE ET AL.
Dow
nloa
ded
by [
182.
73.1
93.3
4] a
t 02:
29 2
9 Fe
brua
ry 2
016

Discussion
We found that farmers had a higher prevalence ofdepression symptoms than the general workingpopulation. Although we cannot infer causality ina cross-sectional study, this may be an indicationof the structural pressure farmers are under.
The size of HUNT3 made it possible to look atthe mental health of farmers from a socioeco-nomic perspective. Numerous studies suggest astepwise social gradient in health,24 includingdepression,25 with groups of low socioeconomicstatus being at higher risk. Farmers are an occupa-tional group that is not immediately easy to putinto a socioeconomic context. Farming is a manualoccupation without a formal education require-ment, and farmers are commonly exposed to anumber of work conditions that are generally con-sidered unfavorable, such as long working hours,monotonous tasks, and a dangerous physical workenvironment.26 In addition to physically demand-ing work, farming requires diverse skills, such asadministration and economy. Farmers do, how-ever, have a great deal of autonomy at work.26
Norwegian farms are generally family-owned, andfarmers are almost always self-employed. Controlhas been shown to be crucial for health,24 and inKarasek’s job demand-control model, the interac-tion between high job demands and low decisionlatitude predicts mental distress.27 Even thoughfarmers may face high demands, they also havehigh job decision latitude. However, insecurityrelated to future employment can have negativeeffects on workers’ health,28,29 and we proposethat working in agriculture during a period ofmajor changes may have led to a perceived lackof control and a feeling of job insecurity.
A Norwegian study from the Health Survey ofHordaland found that male agricultural workers(ISCO-88(COM) 6.1, which includes the STYRKcodes defined as “farmers” in our study) had thehighest HADS-D level of all the occupationalgroups in the study,30 and our results supporttheir finding. The causes of the high depressionlevel of in particular male farmers cannot be iden-tified in a cross-sectional study and cannot bereadily explained. A perceived lack of control orjob insecurity may be two of many possible expla-nations. Using a screening tool instead of
diagnoses of anxiety and depression may beanother. The HADS is not a diagnostic tool, andhigh scores on the depression scale could becaused by transient factors such as physical illnessor going through divorce and not a diagnosis ofdepression. However, we did not find any evidenceof farmers having more problems related to phy-sical health, family problems, or lack of social net-work than the skilled or unskilled manual workers(results not shown). The farmers in our study hadcomparable education levels to the skilled andunskilled manual workers, and farmers had morefavorable lifestyle indicators, such as smoking andalcohol consumption (results not shown).
Comparing farmers with other occupationalgroups in a cross-sectional study is particularlychallenging because the selection out of the occu-pation is probably higher than in most other occu-pations and may also be related to the outcome inour study. The number of farmers in Nord-Trøndelag County decreased by more than 30 %between 1999 and 2008 alone.1 The high propor-tion of farmers who reported working more than40 hours per week is an indication that being ingood health is crucial to be able to stay in farming,and it is also an indicator of the general pressurethe occupational group is under. Farmers who leftfarming in favor of an off-farm job may have had adifferent health status than the ones who stayed inthe profession, creating a selection bias ofunknown direction and magnitude. We foundthat the differences in depression levels betweenfarmers and the AOO group increased with age.Young, healthy, well-educated farmers may havefound it easier to find an off-farm job than oldercolleagues with higher depression and anxietylevels. Factors such as aging making physicallychallenging tasks more difficult, insecurity relatingto farm succession, or a lack of other options butto stay on the farm31 may also play a role, but wedo not have data available on them. The increasingdepression levels with age could also be a reflec-tion of a cohort effect. Another premature way outof the farming profession is disability pension.One might hypothesize that the selection processof farmers with depressive symptoms beingawarded disability pensions might differ fromother occupations, because of factors such as thepreviously mentioned insecurity related to farm
JOURNAL OF AGROMEDICINE 29
Dow
nloa
ded
by [
182.
73.1
93.3
4] a
t 02:
29 2
9 Fe
brua
ry 2
016
succession, their status as self-employed, or otherreasons, but this is not known.
The mean levels of depression found in ourstudy were well below the cutoff for caseness, aswould be expected in a working cohort. The abso-lute differences in mean levels between the differ-ent occupational groups were relatively modest.Farmers reported having the same quality of lifeas the AOO group, which could be an indicationthat a higher level of depression symptoms is notperceived as a medical problem. However, unipo-lar depressive disorders are estimated to be theleading cause of burden of disease in high-incomecountries (measured by disability-adjusted lifeyears [DALYs]), and number three behindischemic heart disease and cerebrovascular diseasein the European region,32 indicating both the pre-valence of unipolar depressive disorders and theimpact they have on individuals. Our findingsindicate that there could be a considerable numberof excess cases of depression among farmers com-pared with other occupational groups.
Norway is a welfare state with universal healthcare, including for mental illness.33 In addition,the national occupational health care organizationfor farmers gives its members access to occupa-tional health care.34 However, despite universalhealth care access and having a higher prevalenceof depression symptoms, we found that a lowerproportion of farmers reported having sought helpfor mental health problems than in the AOOgroup. Even though “mental health problems”includes a wide range of conditions in additionto depression, our findings support the existingliterature in that farmers may be more reluctantto seek help for mental health problems.5,6 Thehelp-seeking behavior of farmers appears to differfor physical health conditions as well, as a smallerproportion of farmers had visited a doctor in thelast 12 months than in the AOO group, eventhough more farmers reported having chronicpain or a long-lasting illness or injury. In a studyof workers from all the 27 EU states, participantsworking in the agricultural sector reported thehighest impact of work on health of any of thesectors in the study,26 and this apparent discre-pancy between the help-seeking behavior of farm-ers and their needs for health services constitutes achallenge for the health care system.
The population of Nord-Trøndelag County fol-lows Norwegian trends in disability35 and cause-specific mortality36 closely, and our results shouldbe generalizable to other parts of Norway. Theinternational trends in agriculture are similar tothose seen in Norway,3 but the extent to which ourresults are generalizable to farming populationsoutside Norway is unknown. However, we believeour results could be of interest internationally.
Strengths and limitations
The HUNT3 survey is a large, total population-based cross-sectional study with a relatively highparticipation rate, and we used a validated screen-ing instrument to measure anxiety and depressionsymptoms. Our study included a high number offarmers compared with other studies in the field,including women. The questions on occupationand mental health symptoms were included in alarge general health survey, ruling out reportingbias for the relationship between being a farmerand symptom levels. Reports of psychologicalstress are higher in occupational than in popula-tion studies, suggesting that participants may over-report measures of psychological stress when theyknow they have been recruited to a study based ontheir occupation.37
We relied on self-report data, which may be apotential weakness of our study. An alternativeapproach would be to use psychiatric diagnosesgiven by a physician. However, if the help-seekingbehavior of farmers differs from other occupa-tional groups,5,6 using primary care or hospitaldata could have resulted in an underestimation ofthe true prevalence of anxiety and depression infarmers. Another weakness of our study is theinability to separate full-time from part-time farm-ers. We do not know if the farmers in our studyhad another job outside the farm, as we only haveinformation on the self-reported main occupationof the HUNT3 participants.
The EGP scheme classifies occupations by usingcharacteristics of the employment relation, such aslevels of of independence, delegated authority, andjob control. There is not, however, an explicithierarchical rank in the EGP scheme; thus, itmay not capture a social gradient in health.38
30 M. O. TORSKE ET AL.
Dow
nloa
ded
by [
182.
73.1
93.3
4] a
t 02:
29 2
9 Fe
brua
ry 2
016
A HUNT3 nonparticipation study found thatnonparticipants had lower socioeconomic statusthan participants, as well as a higher prevalenceof psychiatric disorders. There are indications thatdepression may be a more important restrictingfactor for participation in HUNT3 than anxiety.39
Selection bias is likely to result in an underestima-tion of the differences between socioeconomicgroups, but the magnitude cannot be assessed.
Conclusion
Our hypothesis for this study was that working inan industry that has been under long-term struc-tural and economic pressure may be detrimentalto mental health. Our results indicate that thismight be the case, although we cannot infer caus-ality in a cross-sectional study. More studies oflongitudinal and qualitative design are needed toinvestigate the effects changes in agricultural pol-icy-making, economy, and technology may haveon the mental health of farmers. Our results alsoemphasize the continued need for preventiveoccupational health strategies in agriculture, aswell as finding ways to address the apparent dif-ference in the healthcare-seeking behavior of farm-ers compared with the general population,especially for mental illness.
Acknowledgments
The Nord-Trøndelag Health Study (HUNT) is a collabora-tion between HUNT Research Center (Faculty of Medicine,Norwegian University of Science and Technology NTNU),Nord-Trøndelag County Council, Central Norway HealthAuthority, and the Norwegian Institute of Public Health.
Funding
The project was funded by the Research Levy on AgriculturalProducts/the Agricultural Agreement Research Fund,Norway. The funders had no involvement in study design,data collection and analysis, preparation of the manuscript,or the decision to publish.
Ethics approval: All participants of HUNT3 providedwritten informed consent. The HUNT Study was approvedby the Regional Committee for Medical and Health ResearchEthics (REC Central), as was the present study (2012/1359).
References
1. Statistics Norway. Structure of agriculture. Oslo-Kongsvinger: Statistics Norway; 2014. Available at:https://www.ssb.no/statistikkbanken/selecttable/hovedtabellHjem.asp?KortNavnWeb=stjord&CMSSubjectArea=jord-skog-jakt-og-fiskeri&PLanguage=1&checked=true. Accessed June 25, 2014.
2. Donham KJ, Thelin A. Agricultural Medicine:Occupational and Environmental Health for the HealthProfessions. Ames, IA: Blackwell Publishing; 2006.
3. Food And Agriculture Organization of the UnitedNations. The State of Food and Agriculture. Rome:Food And Agriculture Organization of the UnitedNations; 2012. Available at: http://www.fao.org/docrep/017/i3028e/i3028e.pdf. Accessed April 9, 2014.
4. Kolstrup CL, Kallioniemi M, Lundqvist P, KymalainenHR, Stallones L, Brumby S. International perspectiveson psychosocial working conditions, mental health,and stress of dairy farm operators. J Agromedicine.2013;18:244–255.
5. Kallioniemi MK, Simola A, Kinnunen B, KymäläinenHR. Stress in farm entrepreneurs. In: Langan-Fox J,Cooper CL, eds. Handbook of Stress in theOccupations. Cheltenham, UK: Edward Elgar;2011:381–402.
6. Gregoire A. The mental health of farmers. Occup Med(Lond). 2002;52:471–476.
7. Fraser CE, Smith KB, Judd F, Humphreys JS, Fragar LJ,Henderson A. Farming and mental health problems andmental illness. Int J Soc Psychiatry. 2005;51:340–349.
8. Hawton K, van Heeringen K. Suicide. Lancet.2009;373:1372–1381.
9. Stallones L, Doenges T, Dik BJ, Valley MA. Occupationand suicide: Colorado, 2004–2006. Am J Ind Med.2013;56:1290–1295.
10. Kennedy AJ, Maple MJ, McKay K, Brumby SA. Suicideand accidental death in Australia’s rural farming com-munities: a review of the literature. Rural RemoteHealth. 2014;14:2517.
11. KallioniemiMK, Simola AJK, KymalainenHR, Vesala HT,Louhelainen JK. Mental symptoms among Finnish farmentrepreneurs. Ann Agric Environ Med. 2009;16:159–168.
12. Thomas HV, Lewis G, Thomas DR, et al. Mental healthof British farmers. Occup Environ Med. 2003;60:181–185.
13. Booth NJ, Lloyd K. Stress in farmers. Int J SocPsychiatry. 2000;46:67–73.
14. Holmen J, Midthjell K, Forsen L, Skjerve K, Gorseth M,Oseland A. Helseundersøkelsen i Nord-Trøndelag1984–86. Fremmøtet og sammenlikning av dem sommøtte og dem som ikke møtte [A health survey inNord-Trøndelag 1984-86. Participation and compari-son of attendants and non-attendants]. Tidsskr NorLægeforen. 1990;110:1973–1977.
15. Holmen J, Midthjell K, Krüger Ø et al. The Nord-Trøndelag Health Study 1995–97 (HUNT2): objectives,
JOURNAL OF AGROMEDICINE 31
Dow
nloa
ded
by [
182.
73.1
93.3
4] a
t 02:
29 2
9 Fe
brua
ry 2
016
contents, methods and participation. Norsk Epidemiol.2003;13:19–32.
16. Krokstad S, Langhammer A, Hveem K, et al. Cohortprofile: the HUNT Study, Norway. Int J Epidemiol.2012;42:968–977.
17. Zigmond AS, Snaith RP. The hospital anxiety anddepression scale. Acta Psychiatr Scand. 1983;67:361–370.
18. Bjelland I, Dahl AA, Haug TT, Neckelmann D. Thevalidity of the Hospital Anxiety and Depression Scale.An updated literature review. J Psychosom Res.2002;52:69–77.
19. Statistics Norway. Standard Classification ofOccupations. Oslo-Kongsvinger: Statistics Norway;1998. Available at: http://www.ssb.no/a/publikasjoner/pdf/nos_c521/nos_c521.pdf. Accessed April 9, 2014.
20. International Labour Organization. ISCO-88. Availableat: http://www.ilo.org/public/english/bureau/stat/isco/isco88/. Published 2004. Accessed April 9 2014.
21. Erikson R, Goldthorpe JH. The Constant Flux. A Studyof Class Mobility in Industrial Societies. Oxford, UK:Clarendon Press; 1992.
22. Glymour MM, Greenland S. Causal Diagrams. In:Modern Epidemiology, third edition (by: Rothman, KJ.Greenland, S. Lash, TL.). Philadelphia, PA: LippincottWilliams & Wilkins; 2008:183–209.
23. Boyles AL, Harris SF, Rooney AA, Thayer KA. ForestPlot Viewer: a new graphing tool. Epidemiology.2011;22:746–747.
24. Marmot M. The Status Syndrome: How Social StandingAffects Our Health and Longevity. New York: HenryHolt and Company; 2005.
25. Lorant V, Deliege D, Eaton W, Robert A, PhilippotP, Ansseau M. Socioeconomic inequalities in depres-sion: a meta-analysis. Am J Epidemiol. 2003;157:98–112.
26. Parent-Thirion A, Macías EF, Hurley J, Vermeylen G.Fourth European Working Conditions Survey. Dublin:European Foundation for the Improvement of Livingand Working Conditions; 2007.
27. Karasek RA. Job demands, job decision latitude, andmental strain: implications for job redesign. Admin SciQ. 1979;24:285–308.
28. Sverke M, Hellgren J, Naswall K. No security: a meta-analysis and review of job insecurity and its consequences.J Occup Health Psychol. 2002;7:242–264.
29. Ferrie JE, Shipley MJ, Marmot MG, Stansfeld S, SmithGD. Health effects of anticipation of job change andnon-employment: longitudinal data from the WhitehallII study. BMJ. 1995;311:1264–1269.
30. Sanne B, Mykletun A, Dahl AA, Moen BE, Tell GS.Occupational differences in levels of anxiety anddepression: the Hordaland Health Study. J OccupEnviron Med. 2003;45:628–638.
31. Rogers M, Barr N, O’Callaghan Z, Brumby S,Warburton J. Healthy ageing: farming into the twilight.Rural Soc. 2013;22:251–262.
32. World Health Organization. The Global Burden of Disease:2004 Update. Geneva: World Health Organization; 2008.
33. Esping-Andersen G. The Three Worlds of WelfareCapitalism. Princeton, NJ: Princeton University Press;1990.
34. Norsk Landbruksrådgivning HMS. Ås: NorskLandbruksrådgivning HMS. Available at: http://www.lhms.no/. Published 2014. Accessed December 23, 2014.
35. Krokstad S, Johnsen R, Westin S. Social determinantsof disability pension: a 10-year follow-up of 62 000people in a Norwegian county population. Int JEpidemiol. 2002;31:1183–1191.
36. Statistics Norway. Causes of death. Oslo-Kongsvinger:Statistics Norway; 2013 Available at: https://www.ssb.no/statistikkbanken/selecttable/hovedtabellHjem.asp?KortNavnWeb=dodsarsak&CMSSubjectArea=helse&PLanguage=1&checked=true. Accessed June 23 2014.
37. Goodwin L, Ben-Zion I, Fear NT, Hotopf M, StansfeldSA, Wessely S. Are reports of psychological stresshigher in occupational studies? A systematic reviewacross occupational and population based studies.PLoS ONE. 2013;8:e78693.
38. Oakes JM, Kaufman JS. Methods in SocialEpidemiology. San Francisco: Jossey-Bass; 2006.
39. Langhammer A, Krokstad S, Romundstad P, HegglandJ, Holmen J. The HUNT study: participation is asso-ciated with survival and depends on socioeconomicstatus, diseases and symptoms. BMC Med ResMethodol. 2012;12:143.
32 M. O. TORSKE ET AL.
Dow
nloa
ded
by [
182.
73.1
93.3
4] a
t 02:
29 2
9 Fe
brua
ry 2
016
App
endix1.
Characteristicsof
thestud
yparticipants.W
orking
participantsof
HUNT3
(2006-2008)aged
19-66years.[SD=standard
deviation;
BMI=
body
massindex].
Men
Wom
en
Farm
ers
Allo
ther
occupatio
nalg
roup
sFarm
ers
Allo
ther
occupatio
nalg
roup
s
n%*
mean
SDrang
en
%*
mean
SDrang
en
%*
mean
SDrang
en
%*
mean
SDrang
e
Num
berof
stud
yparticipants
1100
10026
317
13429
Age,mean(+/-SD
)1100
50.0
9.8
21.7
–66.8
10026
48.1
10.8
19.2
–66.9
317
48.0
10.3
20.9
–66.5
13429
46.5
11.0
19.2
–66.9
Education
Not
graduatedfrom
second
aryscho
ol684
62.2
3257
32.5
185
58.4
4988
37.1
Second
aryscho
olgraduate
339
30.8
4472
44.6
9429.7
4272
31.8
College/university
graduate,three
yearsor
more
777.0
2297
22.9
3812.0
4169
31.0
Health Qualityof
life-“verysatisfied”,“satisfied”
or“som
ewhatsatisfied”
940
87.4
8886
89.4
274
87.8
11676
87.8
Self-repo
rted
health
-“not
sogo
od”or
“poor”
188
17.7
1530
15.5
7424.0
2408
18.4
Havingalong
-lastingillness
orinjury
(physicalo
rmental)which
impairs
daily
lifefunctio
ning
**282
26.7
2328
23.8
8528.0
3148
24.1
Long
-lastingimpairm
entbecauseof
physicalillness
(slight,m
oderate,severe)**
174
15.8
1510
15.1
6018.9
2317
17.3
Long
-lastingimpairm
entbecauseof
mentalh
ealth
prob
lems(slight,m
oderate,severe)**
373.4
451
4.5
113.5
634
4.7
Currentph
ysical
pain
which
haslasted
morethan
six
mon
ths
379
35.4
3057
31.0
124
40.3
4702
35.9
Sick
leavecertificate
byado
ctor
inthelast12
mon
ths
331
30.7
2727
27.5
109
34.9
5056
38.1
Visitedado
ctor
inthelast
12mon
ths***
570
64.4
5629
68.0
190
76.6
8815
81.5
Consultatio
nat
apsychiatric
outpatient
clinicin
the
last
12mon
ths
121.4
152
1.9
52.0
274
2.6
Haveor
have
hadmentalh
ealth
prob
lemswhich
you
have
soug
hthelp
for
777.2
880
9.0
4013.1
1981
15.1
Lifestyle
BMI
1099
27.3
3.6
17.2
–44.3
10013
27.5
3.6
16.7
–48.9
317
27.3
5.0
18.6
–46.1
13406
26.5
4.6
12.1
–54.3
Dailysm
oker
100
9.1
1364
13.6
4514.2
2505
18.7
Exercise
atleaston
ceaweek
653
60.8
7315
73.6
242
77.5
11362
85.3
May
have
analcoho
lproblem
****
114
10.4
1593
15.9
72.2
577
4.3
Work Workparttim
e59
5.4
872
8.7
7022.1
7096
52.9
Workfulltim
e(upto
40ho
ursaweek)
140
12.7
5070
50.6
9830.9
4614
34.4
Work>40
hoursaweek
901
81.9
4078
40.7
149
47.0
1712
12.8
*Percentage
ofparticipantswho
repo
rted
theindicatedrespon
sealternative(s).Thetotaln
umberon
individu
alvariables
may
notaddup
tothetotaln
umberof
stud
yparticipantsbecauseof
missing
data
**of
atleaston
eyear
duratio
n***generalp
ractictio
ner,specialistou
tsideof
aho
spital,ho
spitalo
utpatient
clinic(exceptpsychiatric)
****
CAGE(Cut
downAn
noyedGuilty
Eye-op
ener)qu
estio
nnaire
score≥2(Ewing,
JA.D
etectin
galcoho
lism.The
CAGEqu
estio
nnaire.JAM
A.1984;252(14):1905–07.)
JOURNAL OF AGROMEDICINE 33
Dow
nloa
ded
by [
182.
73.1
93.3
4] a
t 02:
29 2
9 Fe
brua
ry 2
016