Farmed Tilapia - Seafood Watch · Ecuador is the main exporter of fresh ... densities and the...
41
Farmed Tilapia (Oreochromis spp.) (© Monterey Bay Aquarium) Ecuador Ponds 6/5/2012 Ariel Zajdband, Seafood Watch Disclaimer Seafood Watch® strives to ensure all our Seafood Reports and the recommendations contained therein are accurate and reflect the most up-to-date evidence available at time of publication. All our reports are peer- reviewed for accuracy and completeness by external scientists with expertise in ecology, fisheries science or aquaculture. Scientific review, however, does not constitute an endorsement of the Seafood Watch program or its recommendations on the part of the reviewing scientists. Seafood Watch is solely responsible for the conclusions reached in this report. We always welcome additional or updated data that can be used for the next revision. Seafood Watch and Seafood Reports are made possible through a grant from the David and Lucile Packard Foundation.
Transcript of Farmed Tilapia - Seafood Watch · Ecuador is the main exporter of fresh ... densities and the...
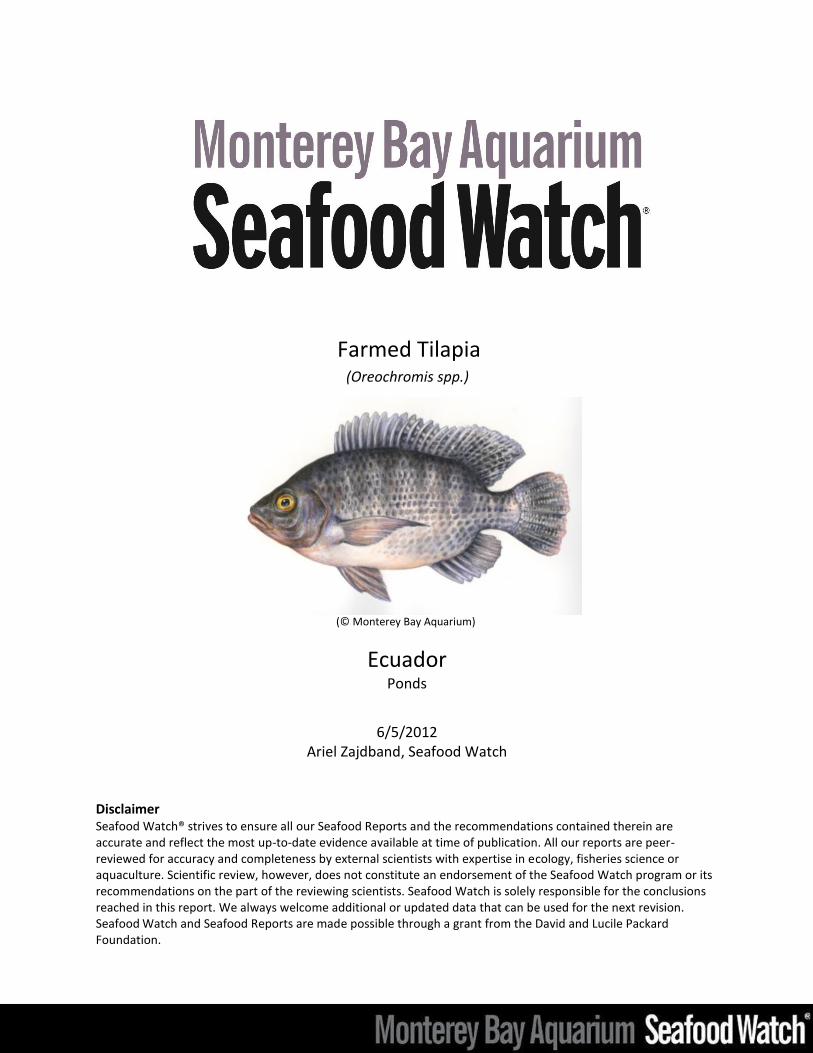
Farmed Tilapia (Oreochromis spp.)
(© Monterey Bay Aquarium)
Ecuador Ponds
6/5/2012 Ariel Zajdband, Seafood Watch
Disclaimer Seafood Watch® strives to ensure all our Seafood Reports and the recommendations contained therein are accurate and reflect the most up-to-date evidence available at time of publication. All our reports are peer-reviewed for accuracy and completeness by external scientists with expertise in ecology, fisheries science or aquaculture. Scientific review, however, does not constitute an endorsement of the Seafood Watch program or its recommendations on the part of the reviewing scientists. Seafood Watch is solely responsible for the conclusions reached in this report. We always welcome additional or updated data that can be used for the next revision. Seafood Watch and Seafood Reports are made possible through a grant from the David and Lucile Packard Foundation.
2
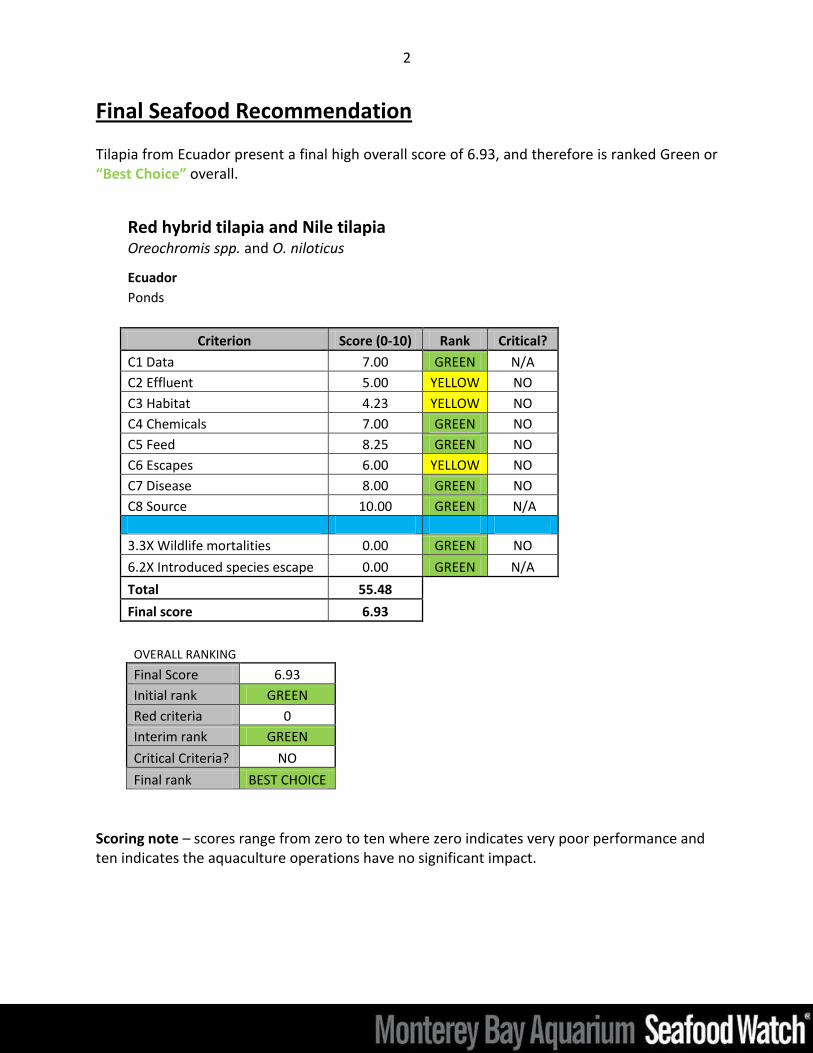
Final Seafood Recommendation Tilapia from Ecuador present a final high overall score of 6.93, and therefore is ranked Green or “Best Choice” overall.
Red hybrid tilapia and Nile tilapia
Oreochromis spp. and O. niloticus
Ecuador
Ponds
Criterion Score (0-10) Rank Critical?
C1 Data 7.00 GREEN N/A
C2 Effluent 5.00 YELLOW NO
C3 Habitat 4.23 YELLOW NO
C4 Chemicals 7.00 GREEN NO
C5 Feed 8.25 GREEN NO
C6 Escapes 6.00 YELLOW NO
C7 Disease 8.00 GREEN NO
C8 Source 10.00 GREEN N/A
3.3X Wildlife mortalities 0.00 GREEN NO
6.2X Introduced species escape 0.00 GREEN N/A
Total 55.48
Final score 6.93
OVERALL RANKING
Final Score 6.93
Initial rank GREEN
Red criteria 0
Interim rank GREEN
Critical Criteria? NO
Final rank BEST CHOICE
Scoring note – scores range from zero to ten where zero indicates very poor performance and ten indicates the aquaculture operations have no significant impact.

3
Executive Summary
Ecuador is the main exporter of fresh (i.e. not frozen) tilapia fillets to the US market. Tilapia production in Ecuador began after the disease crisis in the Pacific White Shrimp industry during the 1990s. Tilapia was introduced into shrimp ponds to diversify aquaculture production, and currently 100% of Ecuadorian tilapia exported to the US is produced in integrated systems with shrimp stocked at low densities. Farm records provide the most up-to-date information on tilapia production in Ecuador, and are the main sources of detailed information on management practices and their potential environmental impacts. National level production statistics are publicly available, but research on the environmental impacts of tilapia production in Ecuador is very scarce (and mostly in Spanish). Nevertheless, due to the farm-level information, data availability is considered to be good overall. The level of nitrogen wastes (52.8 kg N) produced per ton of harvested fish is considered moderate, but only about 40% of this waste is finally discharged to the environment. It is estimated that about half of the wastes produced by the fish are broken down in the ponds, and then effluents are treated before its discharge. While the level of waste discharge from each farm is considered to be moderate-low, the enforcement of effluent regulations controlling the cumulative impact of multiple farms is weak. In Ecuador, tilapia is grown in shrimp ponds that were built in early 1980s, and abandoned after the crisis of the shrimp industry. These farms are located in the high grounds or “Tierras Altas,” occupying high-value environments (mostly salt flats). The use of these ponds for tilapia production impact on the supply of ecosystem services such as wildlife habitat. Licensing and siting regulations that limit aquaculture industry size and concentration have improved in Ecuador during the last decade, but its enforcement is still poor. Predators or other wildlife (especially waterbirds) may be attracted by the concentration of farmed animals in tilapia operations in Ecuador, but there are no records of mortality. Cormorants are the main predators that surround ponds stocked with tilapia, but ‘anti-bird’ polyethylene nets are used to isolate ponds from birds. Control systems are non-lethal, and thus it is considered that tilapia production in Ecuador does not involve any risk of wildlife and predator mortality. Tilapia farming in Ecuador has a low need of chemical use due to the relatively low stocking densities and the appropriate monitoring of water quality. Chemicals are applied, on average, less than once per production cycle, and there is no evidence of chemical use impact on non-target organisms or the emergence of treatment resistance. Tilapia feeds on low trophic levels in nature, and thus, they can be raised successfully on vegetable-based feeds. In Ecuador, tilapia is fed a complete diet with a reduced fishmeal

4
inclusion level (~5%) and no fish oil. As the fishmeal used is made by fisheries wastes such as tuna offal, the use of wild fish is low. The relative high contribution of non-edible sources (30%), and edible crop-derived ingredients (70%) to protein in feeds, and the moderate Feed Conversion Ratio (1.7) determine a low level of protein inputs, and the use of non-edible tilapia wastes determine a moderate negative balance of edible protein during the tilapia production cycle (45.4%). The low level of marine ingredients and the high inclusion level of crop ingredients also determine a relatively low feed footprint (3 hectares). Tilapia has a high invasive potential due to its ability to tolerate a wide range of environmental conditions. The risk of escape in tilapia operations in Ecuador is considered to be moderate-low as Best Management Practices are performed in pond production, and tilapia populations are already established in the wild. However, tilapia escapees may have negative impacts on wild populations by competing for food and habitat. The risk of amplification of pathogens and/or parasites on the farm and their subsequent retransmission to wild fish populations in the surrounding ecosystem is considered to be low in Ecuadorian tilapia farms. Diseases outbreaks are infrequent, and there is no evidence of increased infections rates in wild fish. Low stock densities and the maintenance of water quality in tilapia production in Ecuador reduce the chance of pathogen amplification compared to natural populations. Tilapia production in Ecuador is fully independent from wild fisheries as all farms’ stocks (100%) are sourced from hatchery raised broodstock. Large scale tilapia farms are vertically integrated, having their own seed supply from self-operated hatcheries. Hence, tilapia production in Ecuador does not involve any international or trans-waterbody live animal shipments. Overall, Ecuadorian tilapia gets a relative high overall score of 6.93 out of ten, and is considered a green “Best Choice.”

5
Table of Contents Final Seafood Recommendation ..................................................................................................... 2
Executive Summary ......................................................................................................................... 3
Introduction .................................................................................................................................... 6
Scope of the analysis and ensuing recommendation ............................................................ 6
Analysis ........................................................................................................................................... 7
Scoring guide .......................................................................................................................... 7
Criterion 1: Data quality and availability ............................................................................... 8
Criterion 2: Effluents ............................................................................................................ 10
Criterion 3: Habitat .............................................................................................................. 12
Criterion 3.3X: Wildlife and predator mortalities ................................................................ 14
Criterion 4: Evidence or Risk of Chemical Use ..................................................................... 15
Criterion 5: Feed .................................................................................................................. 17
Criterion 6: Escapes ............................................................................................................. 19
Criterion 6.2X: Escape of unintentionally introduced species ............................................. 21
Criterion 7. Disease; pathogen and parasite interactions ................................................... 22
Criterion 8. Source of Stock – independence from wild fisheries ....................................... 23
Overall Recommendation ............................................................................................................. 24
Acknowledgements ....................................................................................................................... 25
References .................................................................................................................................... 25
About Seafood Watch® ................................................................................................................. 31
Guiding Principles ......................................................................................................................... 32
Data points and all scoring calculations........................................................................................ 34
6
Introduction Scope of the analysis and ensuing recommendation
- Species: Red hybrid tilapia (Oreochromis spp.) and Nile tilapia (O. niloticus). - Geographic coverage: Ecuador - Production Methods: Ponds Species Overview Tilapia is a prolific fast-growing tropical species, native to Africa, but introduced elsewhere as a valuable food fish. Tilapia is a common name applied to three genera: Oreochromis (maternal mouthbrooders), Sarotherodon (paternal mouthbrooders), and tilapia (substrate spawners). Most species are unable to survive at temperatures below 50 °F. Tilapia can live in either fresh or salt water. They are omnivores feeding mainly on algae, aquatic macrophytes, detritus, and associated bacterial films (Fitzsimmons and Watanabe 2010). Tilapia is the second most important group of farmed fish after carp. In 2010, farmed tilapia production exceeded 3.2 million metric tons. Tilapia is produced in more than 100 nations, surpassing any other farmed fish (Fitzsimmons et al. 2011). According to the National Fisheries Institute (2011), tilapia is the fourth most consumed fish in the United States after shrimp, tuna and salmon. During 2010, the average consumption of tilapia (1.5 pounds) increased 20% when compared to 2009. Tilapia is also known in the market as Saint Peter fish and Izumidai (Fitzsimmons 2006). The tilapia market can be divided into two segments: the frozen products and the fresh products (Norman-López and Bjørndal 2009). Chinese products dominated the frozen sector of the US market, providing about 68% of the whole tilapia and 86% of the tilapia fillets (USDA 2012). However, Latin American countries dominated the US market as suppliers of fresh products. In 2011, Honduras and Ecuador supplied 74% of imported fresh fillets to the US market. During that year, the United States imported more than 16,857,000 pounds of fresh tilapia fillets, valued at US$49.66 million from Ecuador (USDA 2012). By-products from tilapia are used for leather goods, gelatin, and medicines. In Ecuador, tilapia production was developed mainly due to the need for species diversification after the crisis in the shrimp industry caused by the spread of the Taura Syndrome Virus (TSV), and intensified after the white spot virus (WSSV) outbreak. Tilapia has been introduced as a mixed culture into shrimp ponds (tilapia-shrimp polyculture) (Schwarz 2007). These species can coexist in the same water body as the Pacific white shrimp (Litopenaeus vannamei); shrimp are located at the bottom of the pond, and tilapia swims in the water column. When tilapia is properly fed, no problems are detected in terms of cannibalism among shrimp. One of the benefits of this polyculture is the higher efficiency in feed use (Martínez-Porchas et al. 2010, Yuan et al. 2010). Currently, 100% of Ecuadorian tilapia exported to the US is farmed in an integrated culture with shrimp.
7
Analysis
Scoring guide With the exclusion of the exceptional criteria (3.3x and 6.2X), all scores result in a zero to
ten final score for the criterion and the overall final rank. A zero score indicates poor performance, while a score of ten indicates high performance. In contrast, the two exceptional criteria result in negative scores from zero to minus ten, and in these cases zero indicates no negative impact.
The full Seafood Watch Aquaculture Criteria that the following scores relate to are available here.
The full data values and scoring calculations are available in Annex 1.

8
Criterion 1: Data Quality and Availability Impact, unit of sustainability and principle Impact: poor data quality and availability limits the ability to assess and understand the
impacts of aquaculture production. It also does not enable informed choices for seafood purchasers, nor enable businesses to be held accountable for their impacts.
Sustainability unit: the ability to make a robust sustainability assessment. Principle: robust and up-to-date information on production practices and their impacts is
available to relevant stakeholders. Criterion 1 Summary
Data Category Relevance (Y/N) Data Quality Score (0-10)
Industry or production statistics Yes 5 5
Effluent Yes 10 10
Locations/habitats Yes 5 5
Predators and wildlife Yes 5 5
Chemical use Yes 7.5 7.5
Feed Yes 7.5 7.5
Escapes, animal movements Yes 5 5
Disease Yes 7.5 7.5
Source of stock Yes 10 10
Other – (e.g. energy us) Yes 7.5 7.5
Total 70.0
C1 Data Final Score 7.00 GREEN
National production statistics on tilapia production in Ecuador for export are available, and management practices and their potential environmental impacts are fairly well documented at the farm level. Although research on tilapia production in Ecuador is almost non-existent in peer-reviewed journals, information can be found in the proceedings of local meetings, theses, and FAO reports. The most important sources of information are farm records; they provide detailed data about the management during the production process and their associated environmental impacts. Updated farm-level records and independent monitoring data were the main sources of information used in this environmental assessment, but lack of research on the impacts outside the farm constrains the understanding of the consequences of the management practices on the environment. Justification of Ranking The aquaculture sector in Ecuador is dominated by shrimp farming, and thus tilapia production is often neglected in national reports and statistics. However, updated national production statistics on tilapia production in Ecuador for export are available (in Spanish) (BCE 2012).
9
Research on some aspects related to tilapia production has been conducted at the National Aquaculture and Marine Research Center (http://www.cenaim.espol.edu.ec). Research papers are available online, but mostly in Spanish. Tilapia production for export is performed on certified farms (e.g. Global Aquaculture Alliance), and therefore updated information on management practices and their potential impacts (although not publically available) can be accessed upon request. Farm-level records are up-to-date and present detailed information on effluents, chemical use, feeds, escapes, diseases, and source of stock. However, these records do not include aspects related to the potential impact of tilapia production outside the farm such as the impacts of escapes on the environment, the transference of diseases to wild stocks, and the change in the provision of ecosystem services as a result of the current land use.
10
Criterion 2: Effluents Impact, unit of sustainability and principle Impact: aquaculture species, production systems and management methods vary in the
amount of waste produced and discharged per unit of production. The combined discharge of farms, groups of farms or industries contributes to local and regional nutrient loads.
Sustainability unit: the carrying or assimilative capacity of the local and regional receiving waters beyond the farm or its allowable zone of effect.
Principle: aquaculture operations minimize or avoid the production and discharge of wastes at the farm-level in combination with an effective management or regulatory system to control the location, scale and cumulative impacts of the industry’s waste discharges beyond the immediate vicinity of the farm.
Criterion 2 Summary
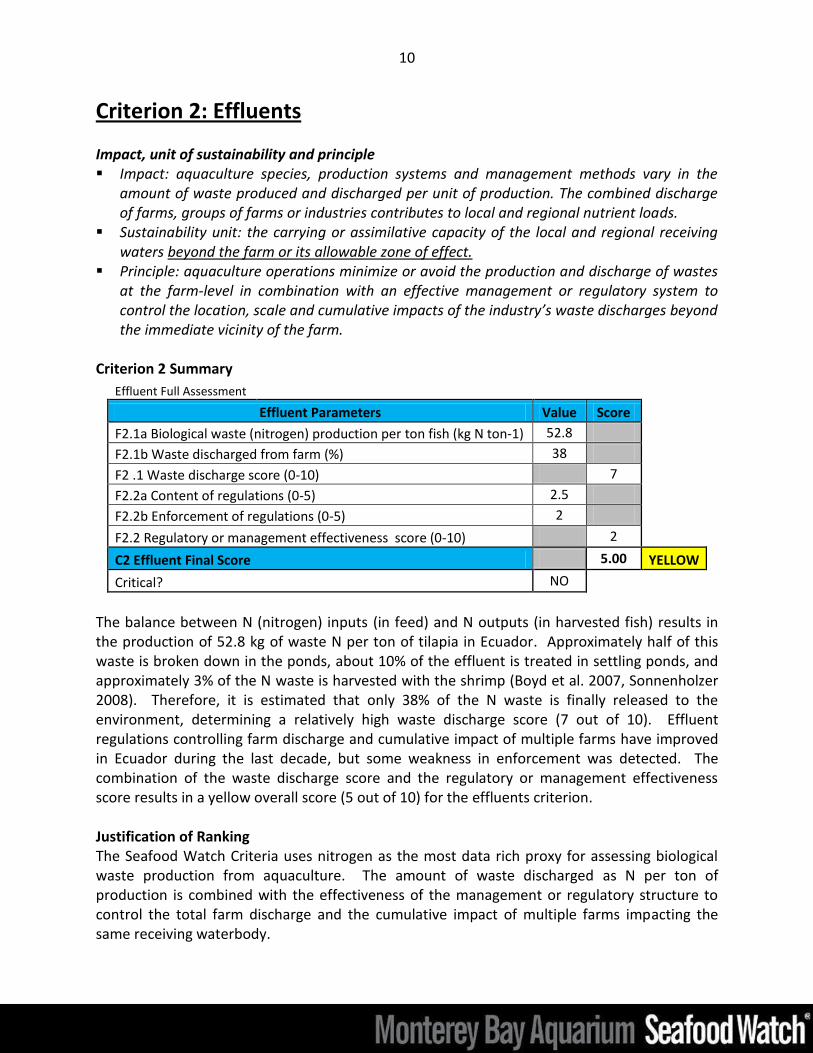
Effluent Full Assessment
Effluent Parameters Value Score
F2.1a Biological waste (nitrogen) production per ton fish (kg N ton-1) 52.8
F2.1b Waste discharged from farm (%) 38
F2 .1 Waste discharge score (0-10) 7
F2.2a Content of regulations (0-5) 2.5
F2.2b Enforcement of regulations (0-5) 2
F2.2 Regulatory or management effectiveness score (0-10) 2
C2 Effluent Final Score 5.00 YELLOW
Critical? NO
The balance between N (nitrogen) inputs (in feed) and N outputs (in harvested fish) results in the production of 52.8 kg of waste N per ton of tilapia in Ecuador. Approximately half of this waste is broken down in the ponds, about 10% of the effluent is treated in settling ponds, and approximately 3% of the N waste is harvested with the shrimp (Boyd et al. 2007, Sonnenholzer 2008). Therefore, it is estimated that only 38% of the N waste is finally released to the environment, determining a relatively high waste discharge score (7 out of 10). Effluent regulations controlling farm discharge and cumulative impact of multiple farms have improved in Ecuador during the last decade, but some weakness in enforcement was detected. The combination of the waste discharge score and the regulatory or management effectiveness score results in a yellow overall score (5 out of 10) for the effluents criterion. Justification of Ranking The Seafood Watch Criteria uses nitrogen as the most data rich proxy for assessing biological waste production from aquaculture. The amount of waste discharged as N per ton of production is combined with the effectiveness of the management or regulatory structure to control the total farm discharge and the cumulative impact of multiple farms impacting the same receiving waterbody.

11
Waste nitrogen production results from the balance of the N inputs and the N outputs. On average, Ecuadorian tilapia feed has 30% protein (28%–32%), the Feed Conversion Ratio (FCR) is about 1.7 (farm-level records are between 1.5 and 1.9), and almost no fertilizers are applied to the pond during the production cycle (some fertilization is still performed in nursery ponds). This results in the use of 81.6 kg N inputs per ton of harvested tilapia. On the other hand, N in outputs is estimated through the multiplication of the protein content of the harvested fish (it is considered to be 18% for tilapia), and the proportion of N per kg of protein (16%). The N in outputs is then 28.8 kg N/ton of harvested fish. The balance between N inputs and outputs results in the production of 52.8 kg N per ton of produced fish. Tilapia is produced in excavated ponds (on average over 5 hectares) with shrimp. It is estimated that about 50 kg of shrimp are harvested per ton of fish produced (Espinosa 2009), and thus 3.2% (1.68 kg N) of the produced N wastes are harvested with shrimp that has 21% protein content in its tissues (USDA 2012). Effluents released from ponds represent about half of the wastes produced as it is estimated that the rest remains in the pond sediments and ~3% are harvested as shrimp (Boyd et al. 2007, Sonnenholzer 2008). Pond effluents are then treated, resulting in the discharge of about 38% of the produced N wastes to the environment. This results in a high (good) waste discharge score (7 out of 10). This score is an estimation of effluents based on the most common type of facility in Ecuador, but it has to be mentioned that some farms have recirculation systems and only discharge water during the rainy season (January to April), to avoid the risk of flooding (Huerta Dorfman 2009). During the last decade, Ecuador has reviewed and updated its environmental laws. Effluents are regulated by the Unified Text of Secondary Legislation (TULAS in Spanish) from the Ministry of the Environment. This legislation does not specify regulations for aquaculture operations, but it establishes control measures for specific conditions and addresses the cumulative impacts of multiple farms. After performing an environmental impact assessment, a special permission is required to discharge effluents. The limits for effluents parameters are established in the First Annex of the sixth book of TULAS (Ministry of the Environment 2003b). Penalties include operating permission removal, and fines according to the scale of the impact. Fines go from 20 to 200 times basic salaries (FAO 2012). Monitoring and enforcement of regulations by the national authorities is scarce (Albán et al. 2009, USAID 2012), and there are no documented cases of applied fines. Therefore, overall, the high score achieved for the low effluent output per ton of tilapia production is reduced due to the limited ability of the regulations and enforcement to control the cumulative impacts from the production of many tons of tilapia in multiple farms. The final effluent score is a moderate 5 out of 10.

12
Criterion 3: Habitat Impact, unit of sustainability and principle Impact: Aquaculture farms can be located in a wide variety of aquatic and terrestrial habitat
types, and have greatly varying levels of impact to both pristine and previously modified habitats and to the critical “ecosystem services” they provide.
Sustainability unit: The ability to maintain the critical ecosystem services relevant to the habitat type.
Principle: aquaculture operations are located at sites, scales and intensities that cumulatively maintain the functionality of ecologically valuable habitats.
Criterion 3 Summary
Habitat Parameters Value Score
F3.1 Habitat conversion and function 4.00
F3.2a Content of habitat regulations 4.25
F3.2b Enforcement of habitat regulations 2.75
F3.2 Regulatory or management effectiveness score 4.68
C3 Habitat Final Score 4.23 YELLOW
Critical? NO
Tilapia production in Ecuador has moderate impacts on the supply of ecosystem services. Tilapia is grown in former shrimp ponds that were built in early 1980s. Most of them were abandoned after the crisis in the shrimp industry during the 1990s caused by diseases outbreaks such as the Taura syndrome. It is considered that tilapia farming in these ponds implies a loss in the provision of ecosystem services, but present use is not fully responsible for previous or historic habitat conversions (>10 years). Regulations regarding environmental licensing and siting have improved in Ecuador during the last decade (4.25 out of 5), but enforcement is still poor (2.75 out of 5). The combination of the habitat conversion and function (4.00) and the regulatory or management effectiveness (4.68) scores result in a 'yellow overall score (4.23 out of 10) for the habitat criterion. Justification of Ranking Factor 3.1. Habitat conversion and function Habitat conversion for aquaculture purposes is measured through the effect on the provision of ecosystem services (ES). Tilapia farming in Ecuador causes a change of ES supply in high-value habitats as ponds were built about 20 years ago for shrimp production. These ponds are mostly located in the Gulf of Guayaquil, and are built on the high grounds or “Tierras Altas,” occupying mostly former salt flats, and a small portion of mangroves along the country's southern coastline (CLIRSEN 2007). Both salt flats and mangroves are considered high-value habitats as they provide critical ES such as wildlife habitat and water purification (Barbier et al. 2011, Ellison 2008). However, tilapia production is taking place in ponds that were constructed

13
15-25 years ago (Hamilton and Stankwitz 2011). As tilapia farming must not be penalized from former land use change, it is considered that the use of abandoned shrimp ponds represent a potential risk for ES supply, and thus, the habitat conversion and function score is 4 (out of 10). Factor 3.2. Habitat and farm siting management effectiveness (appropriate to the scale of the industry) Environmental regulations related to aquaculture farm siting and licensing were improved in Ecuador during the last decade, and more funds have been oriented towards the Ministry of the Environment (Ministry of the Environment 2010). Furthermore, in 2008 the new Constitution was approved, incorporating environmental concerns, including the rights of nature (Becker 2011). Environmental regulations are published in the second annex of the Sixth Book of Environmental Quality (Ministry of the Environment 2003a). Environmental Impact Assessment (EIA) and a Management Plan are required for each farm. An environmental license is issued by the Ministry of the Environment, and applicants must pay an annual insurance policy for each hectare of surface on production (FAO 2012, Saborido Coze and Flores Nava 2009). The Ministry of the Environment has the responsibility of controlling and monitoring aquaculture operations. However, the monitoring and enforcement of the regulations is limited (Albán et al. 2008, NCA 2011, Saborido Coze and Flores Nava 2009, Zapata 2010). The score for habitat management effectiveness (which combines the quality of regulations with their enforcement) is 4.68 (out of ten).

14
Criterion 3.3X: Wildlife and Predator Mortalities This measures the effects of deliberate or accidental mortality on the populations of affected species of predators or other wildlife. This is an “exceptional” criterion that may not apply in many circumstances. It generates a negative score that is deducted from the overall final score. A score of zero means there is no impact. Criterion 3.3X Summary
Wildlife and Predator Mortality Parameters Score
F3.3X Wildlife and predator mortality Final Score 0.00 GREEN
Critical? NO
Aquaculture operations can directly or indirectly cause the death of predators or other wildlife that are attracted by the concentration of farmed animals in aquaculture operations. Although there are wild populations (especially of waterbirds) that may be attracted by fish farms in the Gulf of Guayaquil (Alava et al. 2009, Guevara et al. 2011), there are no records of wildlife and predator mortality in tilapia farms in Ecuador. Cormorants are the main predators that surround ponds stocked with tilapia, but ‘anti-bird’ polyethylene nets are used to isolate ponds from birds. These screens are used in ponds stocked with small fish (under 200 g) (Delfini 2006). Other reported control measure by farm managers is the use of a radio-controlled aircrafts. Both systems are non-lethal, and thus it is considered that tilapia production in Ecuador does not involve any risk of wildlife and predator mortality.
15
Criterion 4: Evidence or Risk of Chemical Use Impact, unit of sustainability and principle Impact: Improper use of chemical treatments impacts non-target organisms and leads to
production losses and human health concerns due to the development of chemical-resistant organisms.
Sustainability unit: non-target organisms in the local or regional environment, presence of pathogens or parasites resistant to important treatments.
Principle: aquaculture operations by design, management or regulation avoid the discharge of chemicals toxic to aquatic life, and/or effectively control the frequency, risk of environmental impact and risk to human health of their use.
Criterion 4 Summary
Chemical Use Parameters Score
C4 Chemical Use Score 7.00
C4 Chemical Use Final Score 7.00 GREEN
Critical? NO
Tilapia farming in Ecuador has a low need of chemical use due to the relatively low stocking densities during the grow-out phase (0.9-1.4 fish/m2) and the maintenance of water quality. The only recorded chemical treatment is the application of oxytetracycline (permitted) that is used on average less than once per production cycle. No evidence was found in terms of the impact of chemical use on non-target organisms or evidence of resistance to treatments. Androgenic hormones are included in fingerling feeds for sex reversal in hatcheries (Schwarz 2007), but these facilities are closed recirculating systems, and thus, hormones are not released into the environment. The infrequent use of chemicals during the grow-out stage, and the inexistence of evidence of impacts on non-target organisms or resistance to key treatments determine a high overall score for the chemical use criterion (7 out of 10). Justification of Ranking The use of chemicals that may present risks to wild stocks is infrequent, and there is no evidence of impact on non-target organisms. Tilapia is stocked in relatively low densities, which reduces the risk of diseases. Oxytetracycline is used on average less than once per production cycle. Oxytetracycline is a permitted wide spectrum antibiotic, but its repeated use can increase the selective pressure on bacteria populations, determining the increase in the frequency of resistance genes (Seyfried et al. 2010) that may lead to human health concerns (Guglielmetti et al. 2009). Other potential impacts to farmed and wild fish associated with the use of oxytetracycline are bacteria that may alter biogeochemical processes (Kümmerer 2009). However, the low usage of chemicals reduces the probability of these risks, and there is no evidence of impact on non-target organisms in Ecuador. Hydrogen peroxide, calcium carbonate, calcium hydroxide, and salt are applied for pond disinfection and to regulate water pH . It is considered that their use does not involve any risk to the environment (Valencia 2009). Finally,
16
the hormone 17-alpha-methyltestosterone is included in feeds during the first 20 days of the production cycle. Sex reversal is induced in female tilapia by applying these androgenic hormones to get all-male populations. The stocking of all-male tilapia seeks to avoid the unwanted reproduction (and the resulting overpopulation) due to the early maturation and frequent breeding that characterize tilapia population, and to achieve the faster growth of males compared to females (Phelps 2006). Tilapia hatcheries in Ecuador are recirculating closed systems, and thus hormones and other chemical treatments used in early stages are not discharged into the environment (Gaibor et al. 2008).

17
Criterion 5: Feed Impact, unit of sustainability and principle Impact: feed consumption, feed type, ingredients used and the net nutritional gains or losses
vary dramatically between farmed species and production systems. Producing feeds and their ingredients has complex global ecological impacts, and their efficiency of conversion can result in net food gains, or dramatic net losses of nutrients. Feed use is considered to be one of the defining factors of aquaculture sustainability.
Sustainability unit: the amount and sustainability of wild fish caught for feeding to farmed fish, the global impacts of harvesting or cultivating feed ingredients, and the net nutritional gains or losses from the farming operation.
Principle: aquaculture operations source only sustainable feed ingredients, convert them efficiently and responsibly, and minimize and utilize the non-edible portion of farmed fish.
Criterion 5 Summary
Feed Parameters Value Score
F5.1a Fish In: Fish Out ratio (FIFO) 0.00 10.00
F5.1b Source fishery sustainability score 0.00
F5.1: Wild Fish Use 10.00
F5.2a Protein IN 25.48
F5.2b Protein OUT 13.91
F5.2: Net Protein Gain or Loss (%) -45.4 5
F5.3: Feed Footprint (hectares) 3.00 8
C5 Feed Final Score 8.25 GREEN
Critical? NO
Although tilapia is a low trophic level species, commercial operations use complete diets that usually include marine ingredients (Huntington and Hasan 2009). Tilapia farming in Ecuador is based on pelleted and extruded feeds with relatively low levels of marine ingredients (5% of fishmeal and no fish oil) and intermediate levels of protein (30%) (Flores Nava 2007). Additionally, it takes 1.7 kg of feed to get 1 kg of fish (i.e. FCR is equal to 1.7). Although some marine ingredients are included in tilapia feeds, the fact that they are made by fisheries wastes unsuitable for human consumption results in the highest possible score for Wild Fish Use (10). Similarly, the relative high proportion of edible crop sources of protein in the feed drives a moderate loss (-45.4%) of edible protein in the production system as a whole, and a moderate score of 5 for the net protein factor. In the case of the feed footprint, the low level of marine ingredients and high inclusion level of crop ingredients determine a relatively low footprint (3.00 hectares) and a high score (8 out of 10). The combination of the three partial scores (wild fish use, net protein gain or loss, and feed footprint) determines a high final score for the feed criterion (8.25 out of 10).
18
Justification of Ranking C5.1. Wild Fish Use The inclusion level of marine ingredients in tilapia production in Ecuador is low. Fishmeal is included at 5%, and there is no fish oil in fish feeds. The average FCR in tilapia farming is 1.7 (reported values are between 1.5 and 1.9). These values are lower than the ones reported by Tacon and Metian (2008) (FCR = 2.36; fishmeal ~10%; and fish oil 3%). This shows the trend towards the reduction of marine ingredients that is observed for several aquaculture species (Naylor et al. 2009). The reported source of fishmeal is a fisheries by-product (tuna offal), and thus it is not accounted in the Fish In: Fish Out ratio calculation. Therefore, the FIFO ratio (i.e. the amount in kg of wild fish needed to produce 1 kg of tilapia) is zero, and the score for wild fish use is 10 (out of 10). C5.2. Net Protein Gain or Loss Tilapia production in Ecuador results in a net loss of edible protein, i.e. the balance between the edible protein inputs and protein outputs is negative. This result is mostly driven by the moderate protein level of tilapia feeds (30%) (Velasco and Freire 2008), and the proportion of the protein provided by crop edible sources (70%) such as rice, soybean, wheat, and sorghum meal. The rest of the protein (30%) is obtained from non-edible sources such as tuna offal, wheat middlings, palm oil cake, Distiller's Dried Grains with Solubles (DDGS), camelina oil cake, cottonseed oil cake, and non-edible land animal by-products. Furthermore, even though the tilapia fillet yield is relatively low (35%), a high proportion (61%) of the remainder is re-used for fishmeal production (Delfini 2005). The negative balance (-45.4%) between protein inputs and outputs during the tilapia production cycle in Ecuador determines a moderate score (5) for this factor. C5.3. Feed Footprint
The footprint of tilapia feed is relatively low (3.00 hectares) in Ecuador. In this calculation, all ingredients are included, even by-products or other processing wastes. Most of the ingredients used in tilapia feeds are crop-derived (80%). This group of ingredients presents the lowest footprint per unit, and leads to the low overall footprint score. In contrast, marine ingredients account for the highest area per unit, but they are included at a low level (5%) in the feed. The remaining ingredients are sourced from terrestrial animals (15%). Each proportion of these groups of ingredients in feeds is multiplied by an average footprint, and then, the partial footprints are added to get the overall feed footprint. The average footprint values only consider the production stage, but do not take into account the footprint derived from processing and transportation of feed ingredients. In this case, the partial feed footprints per ton of harvested fish are 2.21 ha for marine ingredients, and 0.79 for land ingredients (both crop and animal-derived), and finally, the low feed footprint receives a high score (8 out of 10).
19
Criterion 6: Escapes Impact, unit of sustainability and principle Impact: competition, genetic loss, predation, habitat damage, spawning disruption, and
other impacts on wild fish and ecosystems resulting from the escape of native, non-native and/or genetically distinct fish or other unintended species from aquaculture operations.
Sustainability unit: affected ecosystems and/or associated wild populations. Principle: aquaculture operations pose no substantial risk of deleterious effects to wild
populations associated with the escape of farmed fish or other unintentionally introduced species.
Criterion 6 Summary
Escape Parameters Value Score
F6.1 Escape risk 7.00
F6.1a Recapture and mortality (%) 0
F6.1b Invasiveness 6
C6 Escape Final Score 6.00 YELLOW
Critical? NO
The escape of farmed species can threaten ecosystems integrity, but the specific impacts of escapes are usually hard to predict because of the difficulty of knowing the number of escapes and of assessing their impacts (Naylor et al. 2001, Simberloff 2005). Therefore, the escapes criterion provides only a crude estimate of the “biological pollution.” The criterion score results from the combination of the escape risk and the invasiveness of the farmed species. Tilapia has high potential to become an invasive species (Diana 2009, Zambrano et al. 2006). The risk of escape in tilapia operations in Ecuador is considered to be moderate-low as Best Management Practices are performed, such as the use of filters in inlet and outlet pipes and weekly monitoring. Furthermore, special water management is applied during the rainy months to avoid the risk of floods. Although there is a potential risk of escape due to unexpected extreme events, no evidence of escapes was registered in the monitoring performed by farms. Regarding the invasiveness, tilapia populations are already established in the wild from deliberate introductions and from aquaculture. Although the presence of tilapia in the wild contributes to a low invasiveness score, the potential ecological impacts of this species, such as the competition for food and habitat if significant escapes did occur, result in a moderate score for invasiveness (6 out of 10). Finally, the combination of the risk of escape score (7) and the invasiveness score (6) results in a ‘yellow’ score for the escapes criterion (6 out of 10) for tilapia production in Ecuador. Justification of Ranking Factor 6.1a. Escape risk Aquaculture production systems have an intrinsic risk of escape based on their degree of openness. Systems which have a direct connection to natural ecosystems, such as cages or
20
ponds with high water exchange, present higher escape risk than recirculating systems, where more robust barriers can be effectively installed and managed. In addition to the intrinsic risk of each system, the farm’s management also contributes to determining the risk of escape in each system (Jensen et al. 2010). The risk of escape in ponds is considered to be moderate, but the presence of multiple fail-safe escape prevention is rewarded, and thus the risk of escape in tilapia farms in Ecuador is considered to be low-moderate. The escape risk of broodstock and fry is also low as Ecuadorian tilapia hatcheries are closed facilities. Furthermore, weekly monitoring is performed around farms to assess the amount of escapes and there is no evidence of escape from tilapia operations in Ecuador. Hence, the recapture and mortality score is zero. Factor 6.1b. Invasiveness Invasiveness is defined as “…the degree to which an organism is able to spread from the site of primary introduction, to establish a viable population in the ecosystem, to negatively affect biodiversity on the individual, community, or ecosystem level and cause adverse socioeconomic consequence” (Panov et al. 2008). According to its definition, invasiveness considers the phases of the invasion process that follow the escape itself: establishment and ecological impacts. Tilapia is a non-native species in Ecuador, but tilapia populations are already established in the wild. Red tilapia was introduced to Ecuador in 1993, being present even before the development of its commercial farming, and other strains, such as Nile tilapia, were introduced in the 1970s for aquaculture purposes (Gaibor 2008). Tilapia has a high invasive potential, mainly due to the presence of many traits that favor invasion such as broad environmental tolerance, and rapid growth (Diana 2009). Therefore, as tilapia is already established, the risk of establishment of new populations and the risk of further negative impacts in the wild is low. However, there is increasing evidence of the negative impacts of tilapia escapes on native biodiversity (Canonico et al. 2005). These impacts are mostly related to competition and habitat alteration. Experimental results support the idea that the proliferation of tilapia affects the structure of food webs in coastal habitats (Martin et al. 2010). Hence, tilapia gets a moderate score for potential ecosystem impacts (3.5 out of 5). Finally, a moderate invasiveness score (6 out of 10) results from adding the risk of establishment factor (2.5), and the potential ecological impacts factor (3.5).
21
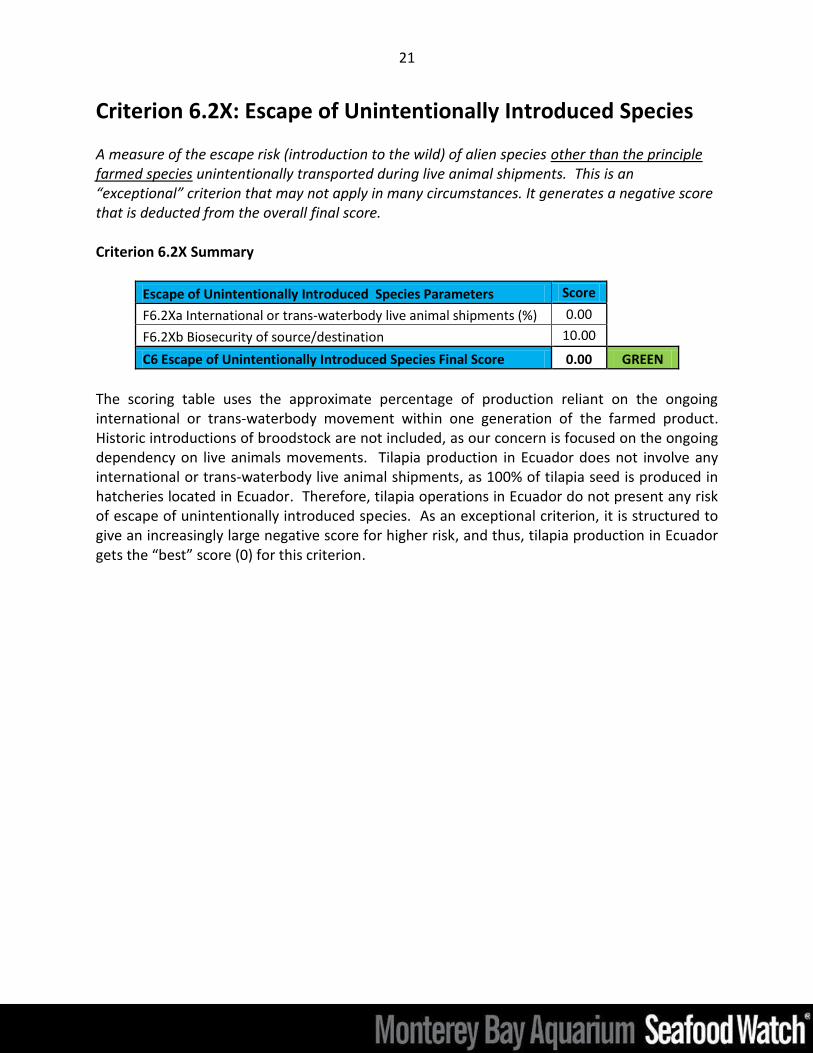
Criterion 6.2X: Escape of Unintentionally Introduced Species A measure of the escape risk (introduction to the wild) of alien species other than the principle farmed species unintentionally transported during live animal shipments. This is an “exceptional” criterion that may not apply in many circumstances. It generates a negative score that is deducted from the overall final score. Criterion 6.2X Summary
Escape of Unintentionally Introduced Species Parameters Score
F6.2Xa International or trans-waterbody live animal shipments (%) 0.00
F6.2Xb Biosecurity of source/destination 10.00
C6 Escape of Unintentionally Introduced Species Final Score 0.00 GREEN
The scoring table uses the approximate percentage of production reliant on the ongoing international or trans-waterbody movement within one generation of the farmed product. Historic introductions of broodstock are not included, as our concern is focused on the ongoing dependency on live animals movements. Tilapia production in Ecuador does not involve any international or trans-waterbody live animal shipments, as 100% of tilapia seed is produced in hatcheries located in Ecuador. Therefore, tilapia operations in Ecuador do not present any risk of escape of unintentionally introduced species. As an exceptional criterion, it is structured to give an increasingly large negative score for higher risk, and thus, tilapia production in Ecuador gets the “best” score (0) for this criterion.

22
Criterion 7: Disease; Pathogen and Parasite Interactions Impact, unit of sustainability and principle Impact: amplification of local pathogens and parasites on fish farms and their
retransmission to local wild species that share the same waterbody. Sustainability unit: wild populations susceptible to elevated levels of pathogens and
parasites. Principle: aquaculture operations pose no substantial risk of deleterious effects to wild
populations through the amplification and retransmission of pathogens or parasites. Criterion 7 Summary
Pathogen and parasite parameters Score
C7 Biosecurity 8.00
C7 Disease; pathogen and parasite Final Score 8.00 GREEN
Critical? NO
Aquaculture operations may increase the likelihood of pathogen and parasites amplification depending on the nature of the production system. The amplification of pathogens and/or parasites on the farm and their subsequent retransmission to the same (or other) populations of wild fish can potentially affect the abundance of those wild populations in the surrounding ecosystem (Johansen 2011, Tucker et al. 2008). Diseases outbreaks are infrequent in tilapia farms in Ecuador, and there is no evidence of increased infections rates in wild fish. Low stocking densities (0.9-1.4 fish/m2) and the maintenance of water quality in tilapia production in Ecuador reduce the chance of pathogen amplification. The risk of disease transmission from farmed to wild fish populations through the amplification and potential retransmission of pathogens or parasites in tilapia production in Ecuador is considered to be low, and the overall score for the diseases criterion is 8 (out of 10). Justification of Ranking There is no evidence of transfer of pathogens and/or parasites from farmed tilapia to wild populations in Ecuador. The relative low stocking densities (0.9–1.1 kg fish/m2) and the maintenance of water quality determine that the occurrence of diseases are infrequent, and therefore production practices are not considered to significantly increase the likelihood of pathogen amplification. Low mortalities are registered, but only as a consequence of the rapid change in weather conditions from the warm to the cold season. Gill parasites were reported, but these cases are not considered to be a major reported disease (Romero and Jimenez 2010). Furthermore, the risk of transfer is considered to be low, as ponds are relatively closed systems.

23
Criterion 8: Source of Stock–Independence from Wild Fisheries Impact, unit of sustainability and principle Impact: the removal of fish from wild populations for on-growing to harvest size in farms. Sustainability unit: wild fish populations. Principle: aquaculture operations use eggs, larvae, or juvenile fish produced from farm-
raised broodstocks thereby avoiding the need for wild capture. Criterion 8 Summary
Source of stock parameters Score
C8 % of production from hatchery raised broodstock or natural (passive) settlement
100
C8 Source of stock Final Score 10.00 GREEN
Tilapia production in Ecuador is fully independent from wild fisheries. All farm’s stocks (100%) are sourced from hatchery raised broodstock. Large scale tilapia farms are vertically integrated, having their own seed supply from self-operated hatcheries (Schwarz 2007). Hence, the source of stock final score is the highest (10).
24
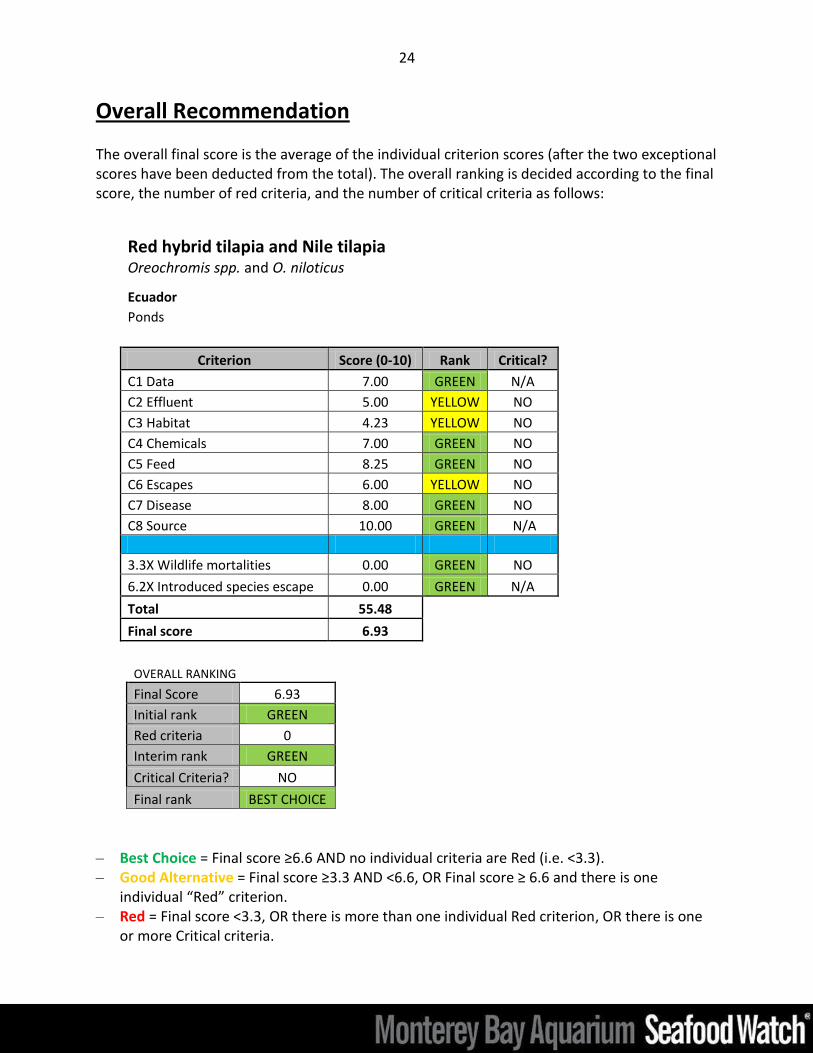
Overall Recommendation The overall final score is the average of the individual criterion scores (after the two exceptional scores have been deducted from the total). The overall ranking is decided according to the final score, the number of red criteria, and the number of critical criteria as follows:
Red hybrid tilapia and Nile tilapia
Oreochromis spp. and O. niloticus
Ecuador
Ponds
Criterion Score (0-10) Rank Critical?
C1 Data 7.00 GREEN N/A
C2 Effluent 5.00 YELLOW NO
C3 Habitat 4.23 YELLOW NO
C4 Chemicals 7.00 GREEN NO
C5 Feed 8.25 GREEN NO
C6 Escapes 6.00 YELLOW NO
C7 Disease 8.00 GREEN NO
C8 Source 10.00 GREEN N/A
3.3X Wildlife mortalities 0.00 GREEN NO
6.2X Introduced species escape 0.00 GREEN N/A
Total 55.48
Final score 6.93
OVERALL RANKING
Final Score 6.93
Initial rank GREEN
Red criteria 0
Interim rank GREEN
Critical Criteria? NO
Final rank BEST CHOICE
– Best Choice = Final score ≥6.6 AND no individual criteria are Red (i.e. <3.3). – Good Alternative = Final score ≥3.3 AND <6.6, OR Final score ≥ 6.6 and there is one
individual “Red” criterion. – Red = Final score <3.3, OR there is more than one individual Red criterion, OR there is one
or more Critical criteria.
25
Acknowledgements Scientific review does not constitute an endorsement of the Seafood Watch® program, or its seafood recommendations, on the part of the reviewing scientists. Seafood Watch® is solely responsible for the conclusions reached in this report. We thank Fabrizio Marcillo and Lorena Schwarz for constructive reviews. Seafood Watch® would like to thank three anonymous reviewers for graciously reviewing this report for scientific accuracy.
References
Alava, J.J., M. Costantino, E. Astudillo, X. Arosemena and M. Peñafiel (2009) Population, Seasonality and Conservation Threats of the Horned Screamer (Anhima cornuta) in Southwestern Ecuador. Waterbirds 32(1):81-86. 2009 Albán, M.A., J. Martínez-Allier and C. Vallejo (Eds.) (2008) Aportes para una estrategia ambiental alternativa: indicadores de sustentabilidad y políticas ambientales. Notas para la discusión Estrategia Nacional de Desarrollo Humano. Secretaría Nacional de Desarrollo (SENPLADES), Quito. http://www.bibliotecaonu.org.ec/files/estrategia%20ambiental.pdf Albán, M.A., C. Espinosa, M. Albán, G. Muñoz, M. Gross and M. Torres (2009) Rapid Trade and Environment Assessment (RTEA) - Evaluación rápida sobre comercio y ambiente: Informe Nacional de Ecuador. Instituto Internacional para el Desarrollo Sostenible (IISD), Manitoba. http://www.iisd.org/tkn/pdf/rtea_ecuador.pdf Barbier, E.B., S.D. Hacker, C. Kennedy, E.W. Koch, A.C. Stier and B.R. Silliman (2011) The value of estuarine and coastal ecosystem services. Ecological Monographs 81 (2): 169-193. BCE (2012) Banco Central del Ecuador: Comercio Exterior. http://www.portal.bce.fin.ec/vto_bueno/ComercioExterior.jsp Becker, M. (2011) Correa, Indigenous Movements, and the Writing of a New Constitution in Ecuador. Latin American Perspectives 176 (38): 47-62. Boyd, C.E., C. Tucker, A. McNevin, K. Bostick and J. Clay (2007) Indicators of Resource Use Efficiency and Environmental Performance in Fish and Crustacean Aquaculture. Reviews in Fisheries Science 15: 327-360.
26
Canonico, G.C., A. Arthington, J.K. McCrary and M.L. Thieme (2005) The effects of introduced tilapias on native biodiversity. Aquatic conservation: marine and freshwater ecosystems 15: 463–483. CLIRSEN (2007) Actualización del Estudio Multitemporal de manglares, camaroneras y áreas salinas en la Costa Continental Ecuatoriana al año 2006. Programa de Manejo de Recursos Costeros, Ministerio del Ambiente, Guayaquil. Delfini, A. (2005) Compounded Fish Meal Based on Tilapia Process Waste. Presentation at the First Tilapia Dialogue, 27-28 August 2005, Washington DC. http://www.worldwildlife.org/what/globalmarkets/aquaculture/WWFBinaryitem5360.pdf Delfini, A. (2006) Cultivo de Tilapia en Estanques de Tierra en Ecuador. Presented at ISTA 7, 6-8 September, Veracruz, Mexico. http://ag.arizona.edu/azaqua/ista/ISTA7/Memorias/alfonso_delfini.pdf Diana, J.S. (2009) Aquaculture Production and Biodiversity Conservation. Bioscience 59 (1): 27-38. Ellison, A.M. (2008) Managing mangroves with benthic biodiversity in mind: Moving beyond roving banditry Journal of Sea Research 59: 2-15. Espinosa, C.R.Z. (2009) Análisis de viabilidad de una empresa de policultivo de tilapia roja y camarón para su comercialización. Master thesis, Universidad de Guayaquil. http://repositorio.maeug.edu.ec/bitstream/123456789/124/1/Tesis%20de%20Grado%20Carlos%20Zambrano.pdf FAO (2012) National Aquaculture Legislation Overview Ecuador. FAO, Rome. http://www.fao.org/fishery/legalframework/nalo_ecuador/en Fitzsimmons, K. (2006) Prospect and potential for global production: Chapter 2. In: C. Lim and C.D. Webster (Eds.) Tilapia: Biology, Culture and Nutrition. Food Product Press, New York, pp. 51-72. Fitzsimmons, K. and W.O. Watanabe (2010) Tilapia (Family: Cichlidae). In: N.R. Le Francois, M. Jobling, C. Carter and P.U. Blier (Eds.) Finfish Aquaculture Diversification. CABI, Wallingford, UK, pp. 374-396. Fitzsimmons, K., R. Martinez-Garcia and Pablo Gonzalez-Alanis (2011) Why Tilapia is becoming the most Important Food Fish on the Planet. In: L. Liping and K. Fitzsimmons (Eds.) Proceedings of the 9th International Symposium on Tilapia in Aquaculture. Shanghai Ocean University, Shanghai, China, April 22-25, 2011.
27
Flores-Nava, A. (2007) Feeds and fertilizers for sustainable aquaculture development: a regional review for Latin America. In M.R. Hasan, T. Hecht, S.S. De Silva and A.G.J. Tacon (Eds.) Study and analysis of feeds and fertilizers for sustainable aquaculture development. FAO Fisheries Technical Paper 497. FAO, Rome, pp. 49–75. Gaibor, MGC, MA Espinosa-Fernandez and AFP Villacres (2008) Estudio técnico financiero de una granja de 100 hectáreas de policultivo (tilapia – camarón) en la zona de Taura. Espol, Facultad de Ingenieria Maritima y Ciencias del Mar, Undergraduate thesis.
Guevara, E.A., T. Santander, T. Mueces, K. Terán and P.-Y. Henry (2011) Population Growth and
Seasonal Abundance of the Neotropic Cormorant (Phalacrocorax brasilianus) at Highland Lakes in Ecuador. Waterbirds 34(4): 499-503.
Guglielmetti, E., J.M. Korhonen, J. Heikkinen, L. Morelli and A. Von Wright (2009), Transfer of
plasmid-mediated resistance to tetracycline in pathogenic bacteria from fish and aquaculture environments. FEMS Microbiology Letters 293: 28–34.
Hamilton, S.E. and C. Stankwitz (2011) Examining the relationship between international aid and mangrove deforestation in coastal Ecuador from 1970 to 2006. Journal of Land Use Science DOI:10.1080/1747423X.2010.550694 Huerta Dorman, F. (2009) New Recirculating Systems Offer Efficient, Responsible Tilapia/Shrimp Production. Global Aquaculture Advocate (September-October): 76-78. Huntington, T.C. and M.R. Hasan (2009) Fish as feed inputs for aquaculture – practices, sustainability and implications: a global synthesis. In M.R. Hasan and M. Halwart (Eds.) Fish as feed inputs for aquaculture: practices, sustainability and implications. FAO Fisheries and Aquaculture Technical Paper 518. FAO, Rome, pp. 1–61. Jensen, Ø., T. Dempster, E.B. Thorstad, I. Uglem and A. Fredhei (2010) Escapes of fishes from Norwegian sea-cage aquaculture: causes, consequences and prevention. Aquaculture Environment Interactions 1: 71-83. Johansen, L.-H., I. Jensen, H. Mikkelsen, P.-A. Bjørn, P.A. Jansen and Ø. Bergh (2011) Disease interaction and pathogens exchange between wild and farmed fish populations with special reference to Norway. Aquaculture 315 (3–4): 167–186. Kümmerer, K. (2009) Antibiotics in the aquatic environment – A review – Part I. Chemosphere 75: 417–434. Martin, C.W., M.M. Valentine and J.F. Valentine JF (2010) Competitive Interactions between Invasive Nile Tilapia and Native Fish: The Potential for Altered Trophic Exchange and Modification of Food Webs. PLoS ONE 5(12): e14395. doi:10.1371/journal.pone.0014395

28
Martínez-Porchas, M., L.R. Martínez-Córdova, M.A. Porchas-Cornejo, M. A. and J.A. López-Elías (2010) Shrimp polyculture: a potentially profitable, sustainable, but uncommon aquacultural practice. Reviews in Aquaculture 2: 73–85. Ministry of the Environment (2003a) Norma de Calidad Ambiental del Recurso Suelo y Criterios de Remediación para Suelos Contaminados. http://www.ambiente.gob.ec/sites/default/files/archivos/normativa/libro6_anexo2.pdf Ministry of the Environment (2003b) Norma de Calidad Ambiental y de Descarga de Efluentes: Recurso Agua. http://www.ambiente.gob.ec/sites/default/files/archivos/normativa/libro6_anexo1.pdf Ministry of the Environment (2010) Cuarto Informe Nacional para el Convenio sobre la Diversidad Biológica. Ministerio del Ambiente del Ecuador, Quito. http://www.cbd.int/doc/world/ec/ec-nr-04-es.pdf National Fisheries Institute (2011) Top 10 consumed seafood. http://www.aboutseafood.com/about/about-seafood/top-10-consumed-seafoods NCA (2011) The regularization process steps on the gas. http://www.cna-ecuador.com/ Naylor, R.L., S.L. Williams and D.R. Stron (2001) Aquaculture—A Gateway for Exotic Species. Science 294: 1655-1656. Naylor, R.L., R.W. Hardy, D.P. Bureau, A. Chiu, M. Elliott, A.P. Farrell, I. Forster, D.M. Gatlin, R.J. Goldburg, K. Hua and P.D. Nichols (2009) Feeding aquaculture in an era of finite resources. PNAS 106 (36): 15103-15110. Norman-López, A. and T. Bjørndal (2009) Is tilapia the same product worldwide or are markets segmented? Aquaculture Economics & Management 13(2). DOI:10.1080/13657300902885360 Panov, V.E., B. Alexandrov, K. Arbaciauskas, R. Binimelis, F. Lucy, R.S.E.W. Leuven, S. Nehring, M. Paunovic, V. Semenchenko and M.O. Son (2008) Assessing the Risks of Aquatic Species Invasions via European Inland Waterways: From Concepts to Environmental Indicators. Integrated Environmental Assessment and Management 5 (1): 110–126. Phelps, R.P. (2006) Hormone Manipulation of Sex. In: C. Lim and C.D. Webster (Eds.) Tilapia- Biology, Culture, and Nutrition. Food Product Press, New York, pp. 211-252. Romero, X. and R. Jimenez (2010) Histopathological Survey of Diseases and Potential Pathogens Present in Cultured Tilapia, Oreochromis spp. in Ecuador.
29
Saborio Coze, A. and Flores Nava, A (2009) Review of environmental impact assessment and monitoring of aquaculture in Latin America. In: FAO. Environmental impact assessment and monitoring of aquaculture. FAO Fisheries and Aquaculture Technical Paper. No. 527. Rome, FAO. pp. 395–454. Schwarz, L. (2007) Freshwater fish seed resources in Ecuador, pp. 233–240. In: M.G. Bondad-Reantaso (ed.). Assessment of freshwater fish seed resources for sustainable aquaculture. FAO Fisheries Technical Paper. No. 501. Rome, FAO. 628p. Seyfried E.E., R.J. Newton, K.F. Rubert, J.A. Pedersen and K.D. McMahon (2010) Occurrence of tetracycline resistance genes in aquaculture facilities with varying use of oxytetracycline. Microbial Ecology 59(4):799-807. Simberloff, D. (2005) Non-native species do threaten the natural environment! Journal of Agricultural and Environmental Ethics 18 (6): 595-607. Sonnenholzer, S. (2008) Effluent impact assessment: water quality monitoring vs nutrient budget. WWF Shrimp Aquaculture Dialogue, Guayaquil, Ecuador. Tacon, A.G.J. and M. Metian (2008) Global overview on the use of fish meal and fish oil in industrially compounded aquafeeds: Trends and future prospects. Aquaculture 285: 146–158. Tucker, C.S., J.A. Hargreaves and C.E. Boyd (2008) Aquaculture and the Environment in the United States. In: C.S. Tucker and J.A. Hargreaves (Eds.) Environmental Best Management Practices for Aquaculture. Blackwell Publishing, Ames, pp. 3-54. Tveteras, R. and R. Nystoyl (2011) Fish Production Estimates & Trends 2011-2012. Global Outlook for Aquaculture Leadership Conference, November 6-9 2011 Santiago, Chile. http://www.gaalliance.org/update/GOAL11/Tveteras_Nystoyl.pdf USDA (2012) USDA National Nutrient Database for Standard Reference. http://ndb.nal.usda.gov/ USAID (2012) Manual de Buenas Prácticas para Adaptación al Cambio Climático en Zona Costera. USAID Ecuador. http://www.ciifen-int.org/stories/Herramientas_y_Recursos/ Manual_de_Buenas_Practicas_de_Adaptacion_Costera.pdf Valencia, A.L. (2009) Proyecto de factibilidad para la creación de una microempresa dedicada al cultivo y comercialización de tilapia- Oreochromis spp.- al Mercado de los Estados Unidos ubicada en la Parroquia de Mindo, Canton San Miguel de los Bancos. Escuela Politécnica Nacional, Facultad de Ciencias.
30
Velasco, M. and G. Freire (2008) Tilapia Culture in Ecuador-- Resilient Industry Coexists With Shrimp. Global Aquaculture Advocate (November-December): 49-50. Yuan, D., Y. Yi, A. Yakupitiyage, K. Fitzsimmons and J.S. Diana (2010) Effects of addition of red tilapia (Oreochromis spp.) at different densities and sizes on production, water quality and nutrient recovery of intensive culture of white shrimp (Litopenaeus vannamei) in cement tanks. Aquaculture 298 (3-4): 226-238. Zambrano, L., E. Martínez-Meyer, N. Menezes and A. Townsend Peterson (2006) Invasive potential of common carp (Cyprinus carpio) and Nile tilapia (Oreochromis niloticus) in American freshwater systems. Canadian Journal of Fisheries and Aquatic Sciences 63: 1903–1910 Zapata, O. (2010) Biodiversity and Ecosystems: Why These are Important for Sustained Growth and Equity in Latin America and the Caribbean. Ecuador Country – Case Study. UNDP Regional Report. http://www.undp.org/latinamerica/biodiversity-superpower/Power_Centers_Ecuador/National_Economist_Report_Ecuador.pdf
31
About Seafood Watch® Monterey Bay Aquarium’s Seafood Watch® program evaluates the ecological sustainability of wild-caught and farmed seafood commonly found in the United States marketplace. Seafood Watch® defines sustainable seafood as originating from sources, whether wild-caught or farmed, which can maintain or increase production in the long-term without jeopardizing the structure or function of affected ecosystems. Seafood Watch® makes its science-based recommendations available to the public in the form of regional pocket guides that can be downloaded from www.seafoodwatch.org. The program’s goals are to raise awareness of important ocean conservation issues and empower seafood consumers and businesses to make choices for healthy oceans. Each sustainability recommendation on the regional pocket guides is supported by a Seafood Report. Each report synthesizes and analyzes the most current ecological, fisheries and ecosystem science on a species, then evaluates this information against the program’s conservation ethic to arrive at a recommendation of “Best Choices”, “Good Alternatives” or “Avoid”. The detailed evaluation methodology is available upon request. In producing the Seafood Reports, Seafood Watch® seeks out research published in academic, peer-reviewed journals whenever possible. Other sources of information include government technical publications, fishery management plans and supporting documents, and other scientific reviews of ecological sustainability. Seafood Watch® Research Analysts also communicate regularly with ecologists, fisheries and aquaculture scientists, and members of industry and conservation organizations when evaluating fisheries and aquaculture practices. Capture fisheries and aquaculture practices are highly dynamic; as the scientific information on each species changes, Seafood Watch®’s sustainability recommendations and the underlying Seafood Reports will be updated to reflect these changes. Parties interested in capture fisheries, aquaculture practices and the sustainability of ocean ecosystems are welcome to use Seafood Reports in any way they find useful. For more information about Seafood Watch® and Seafood Reports, please contact the Seafood Watch® program at Monterey Bay Aquarium by calling 1-877-229-9990. Disclaimer Seafood Watch® strives to have all Seafood Reports reviewed for accuracy and completeness by external scientists with expertise in ecology, fisheries science and aquaculture. Scientific review, however, does not constitute an endorsement of the Seafood Watch® program or its recommendations on the part of the reviewing scientists. Seafood Watch® is solely responsible for the conclusions reached in this report. Seafood Watch® and Seafood Reports are made possible through a grant from the David and Lucile Packard Foundation.

32
Guiding Principles
Seafood Watch defines sustainable seafood as originating from sources, whether fished1 or farmed, that can maintain or increase production in the long-term without jeopardizing the structure or function of affected ecosystems. The following guiding principles illustrate the qualities that aquaculture must possess to be considered sustainable by the Seafood Watch program: Seafood Watch will:
Support data transparency and therefore aquaculture producers or industries that make
information and data on production practices and their impacts available to relevant
stakeholders.
Promote aquaculture production that minimizes or avoids the discharge of wastes at the
farm level in combination with an effective management or regulatory system to control
the location, scale and cumulative impacts of the industry’s waste discharges beyond the
immediate vicinity of the farm.
Promote aquaculture production at locations, scales and intensities that cumulatively
maintain the functionality of ecologically valuable habitats without unreasonably penalizing
historic habitat damage.
Promote aquaculture production that by design, management or regulation avoids the use
and discharge of chemicals toxic to aquatic life, and/or effectively controls the frequency,
risk of environmental impact and risk to human health of their use.
Within the typically limited data availability, use understandable quantitative and relative
indicators to recognize the global impacts of feed production and the efficiency of
conversion of feed ingredients to farmed seafood.
Promote aquaculture operations that pose no substantial risk of deleterious effects to wild
fish or shellfish populations through competition, habitat damage, genetic introgression,
hybridization, spawning disruption, changes in trophic structure or other impacts associated
with the escape of farmed fish or other unintentionally introduced species.
Promote aquaculture operations that pose no substantial risk of deleterious effects to wild
populations through the amplification and retransmission of pathogens or parasites.
Promote the use of eggs, larvae, or juvenile fish produced in hatcheries using domesticated
broodstocks thereby avoiding the need for wild capture.
Recognize that energy use varies greatly among different production systems and can be a
major impact category for some aquaculture operations, and also recognize that improving
1 “Fish” is used throughout this document to refer to finfish, shellfish and other invertebrates.

33
practices for some criteria may lead to more energy intensive production systems (e.g.
promoting more energy-intensive closed recirculation systems).
Once a score and rank has been assigned to each criterion, an overall seafood recommendation is developed on additional evaluation guidelines. Criteria ranks and the overall recommendation are color-coded to correspond to the categories on the Seafood Watch pocket guide: Best Choices/Green: Are well managed and caught or farmed in environmentally friendly ways. Good Alternatives/Yellow: Buy, but be aware there are concerns with how they’re caught or farmed. Avoid/Red: Take a pass on these. These items are overfished or caught or farmed in ways that harm other marine life or the environment.
34
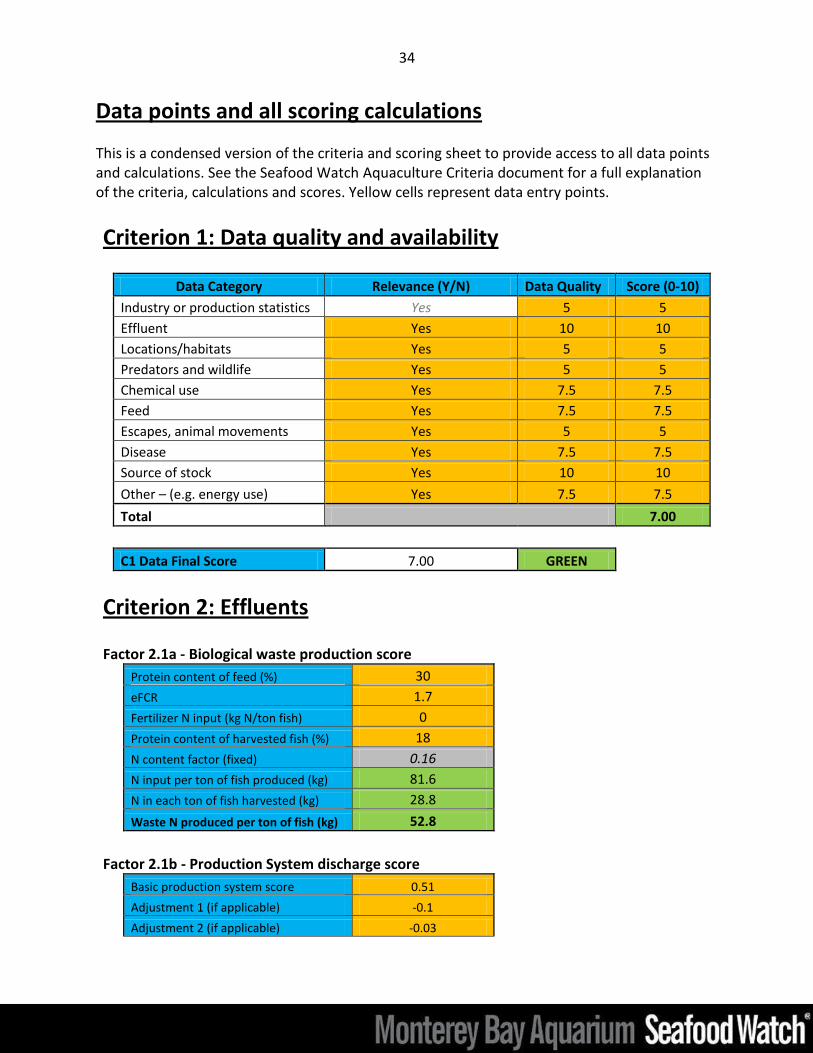
Data points and all scoring calculations
This is a condensed version of the criteria and scoring sheet to provide access to all data points and calculations. See the Seafood Watch Aquaculture Criteria document for a full explanation of the criteria, calculations and scores. Yellow cells represent data entry points.
Criterion 1: Data quality and availability
Data Category Relevance (Y/N) Data Quality Score (0-10)
Industry or production statistics Yes 5 5
Effluent Yes 10 10
Locations/habitats Yes 5 5
Predators and wildlife Yes 5 5
Chemical use Yes 7.5 7.5
Feed Yes 7.5 7.5
Escapes, animal movements Yes 5 5
Disease Yes 7.5 7.5
Source of stock Yes 10 10
Other – (e.g. energy use) Yes 7.5 7.5
Total 7.00
C1 Data Final Score 7.00 GREEN
Criterion 2: Effluents
Factor 2.1a - Biological waste production score
Protein content of feed (%) 30
eFCR 1.7
Fertilizer N input (kg N/ton fish) 0
Protein content of harvested fish (%) 18
N content factor (fixed) 0.16
N input per ton of fish produced (kg) 81.6
N in each ton of fish harvested (kg) 28.8
Waste N produced per ton of fish (kg) 52.8
Factor 2.1b - Production System discharge score
Basic production system score 0.51
Adjustment 1 (if applicable) -0.1
Adjustment 2 (if applicable) -0.03
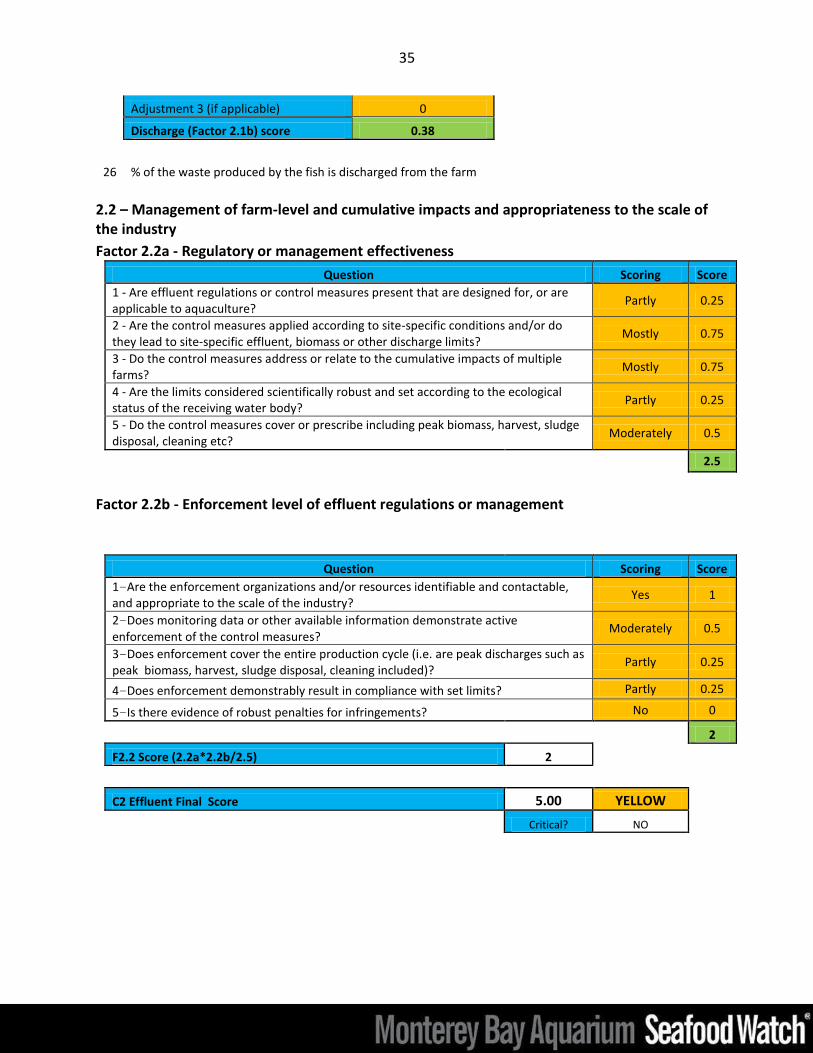
35
Adjustment 3 (if applicable) 0
Discharge (Factor 2.1b) score 0.38
26 % of the waste produced by the fish is discharged from the farm
2.2 – Management of farm-level and cumulative impacts and appropriateness to the scale of the industry
Factor 2.2a - Regulatory or management effectiveness Question Scoring Score
1 - Are effluent regulations or control measures present that are designed for, or are applicable to aquaculture?
Partly 0.25
2 - Are the control measures applied according to site-specific conditions and/or do they lead to site-specific effluent, biomass or other discharge limits?
Mostly 0.75
3 - Do the control measures address or relate to the cumulative impacts of multiple farms?
Mostly 0.75
4 - Are the limits considered scientifically robust and set according to the ecological status of the receiving water body?
Partly 0.25
5 - Do the control measures cover or prescribe including peak biomass, harvest, sludge disposal, cleaning etc?
Moderately 0.5
2.5
Factor 2.2b - Enforcement level of effluent regulations or management
Question Scoring Score
1–Are the enforcement organizations and/or resources identifiable and contactable, and appropriate to the scale of the industry?
Yes 1
2–Does monitoring data or other available information demonstrate active enforcement of the control measures?
Moderately 0.5
3–Does enforcement cover the entire production cycle (i.e. are peak discharges such as peak biomass, harvest, sludge disposal, cleaning included)?
Partly 0.25
4–Does enforcement demonstrably result in compliance with set limits? Partly 0.25
5–Is there evidence of robust penalties for infringements? No 0
2
F2.2 Score (2.2a*2.2b/2.5) 2
C2 Effluent Final Score 5.00 YELLOW
Critical? NO
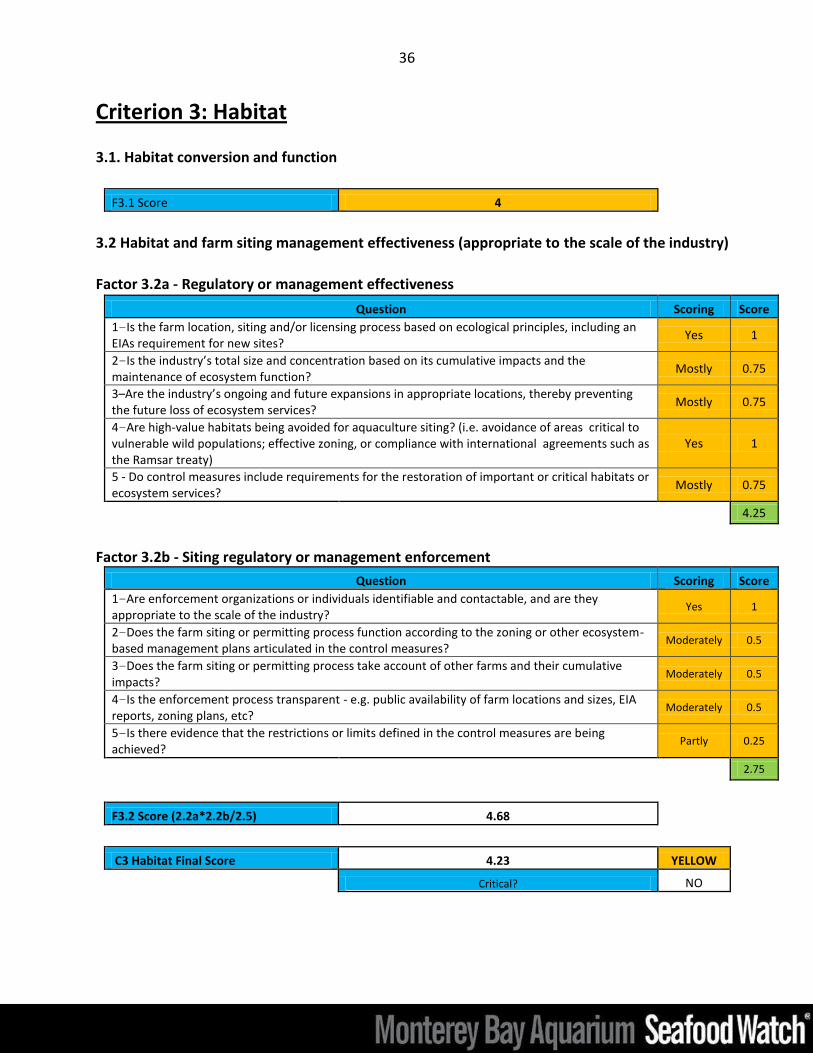
36
Criterion 3: Habitat
3.1. Habitat conversion and function
F3.1 Score 4
3.2 Habitat and farm siting management effectiveness (appropriate to the scale of the industry)
Factor 3.2a - Regulatory or management effectiveness
Question Scoring Score
1–Is the farm location, siting and/or licensing process based on ecological principles, including an EIAs requirement for new sites?
Yes 1
2–Is the industry’s total size and concentration based on its cumulative impacts and the maintenance of ecosystem function?
Mostly 0.75
3–Are the industry’s ongoing and future expansions in appropriate locations, thereby preventing the future loss of ecosystem services?
Mostly 0.75
4–Are high-value habitats being avoided for aquaculture siting? (i.e. avoidance of areas critical to vulnerable wild populations; effective zoning, or compliance with international agreements such as the Ramsar treaty)
Yes 1
5 - Do control measures include requirements for the restoration of important or critical habitats or ecosystem services?
Mostly 0.75
4.25
Factor 3.2b - Siting regulatory or management enforcement
Question Scoring Score
1–Are enforcement organizations or individuals identifiable and contactable, and are they appropriate to the scale of the industry?
Yes 1
2–Does the farm siting or permitting process function according to the zoning or other ecosystem-based management plans articulated in the control measures?
Moderately 0.5
3–Does the farm siting or permitting process take account of other farms and their cumulative impacts?
Moderately 0.5
4–Is the enforcement process transparent - e.g. public availability of farm locations and sizes, EIA reports, zoning plans, etc?
Moderately 0.5
5–Is there evidence that the restrictions or limits defined in the control measures are being achieved?
Partly 0.25
2.75
F3.2 Score (2.2a*2.2b/2.5) 4.68
C3 Habitat Final Score 4.23 YELLOW
Critical? NO
37
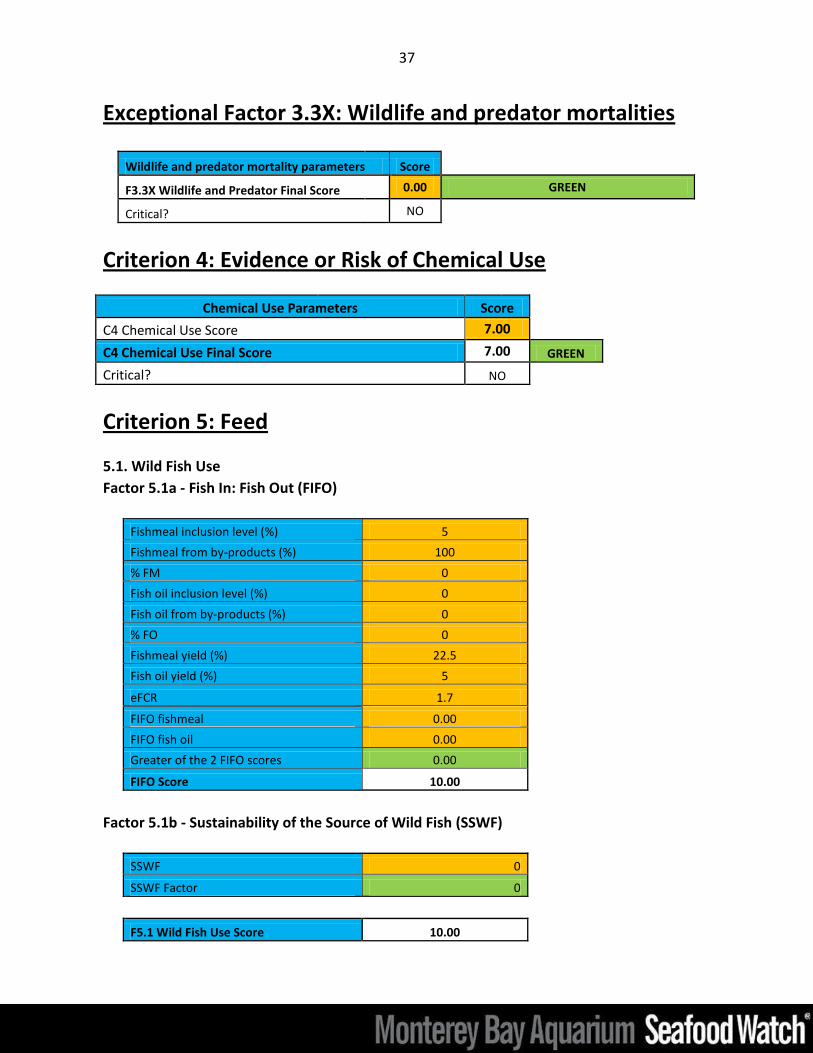
Exceptional Factor 3.3X: Wildlife and predator mortalities
Wildlife and predator mortality parameters Score
F3.3X Wildlife and Predator Final Score 0.00 GREEN
Critical? NO
Criterion 4: Evidence or Risk of Chemical Use
Chemical Use Parameters Score
C4 Chemical Use Score 7.00
C4 Chemical Use Final Score 7.00 GREEN
Critical? NO
Criterion 5: Feed
5.1. Wild Fish Use
Factor 5.1a - Fish In: Fish Out (FIFO)
Fishmeal inclusion level (%) 5
Fishmeal from by-products (%) 100
% FM 0
Fish oil inclusion level (%) 0
Fish oil from by-products (%) 0
% FO 0
Fishmeal yield (%) 22.5
Fish oil yield (%) 5
eFCR 1.7
FIFO fishmeal 0.00
FIFO fish oil 0.00
Greater of the 2 FIFO scores 0.00
FIFO Score 10.00
Factor 5.1b - Sustainability of the Source of Wild Fish (SSWF)
SSWF 0
SSWF Factor 0
F5.1 Wild Fish Use Score 10.00

38
5.2. Net protein Gain or Loss
Protein INPUTS
Protein content of feed 30
eFCR 1.7
Feed protein from NON-EDIBLE sources (%) 30
Feed protein from EDIBLE CROP sources (%) 70
Protein OUTPUTS
Protein content of whole harvested fish (%) 18
Edible yield of harvested fish (%) 35
Non-edible by-products from harvested fish used for other food production 65
Protein IN 25.49
Protein OUT 13.905
Net protein gain or loss (%) -45.44
Critical? NO
F5.2 Net protein Score 5.00
5.3. Feed Footprint
5.3a Ocean area of primary productivity appropriated by feed ingredients per ton of farmed seafood
Inclusion level of aquatic feed ingredients (%) 5
eFCR 1.7
Average Primary Productivity (C) required for aquatic feed ingredients (ton C/ton fish) 69.7
Average ocean productivity for continental shelf areas (ton C/ha) 2.68
Ocean area appropriated (ha/ton fish) 2.21
39
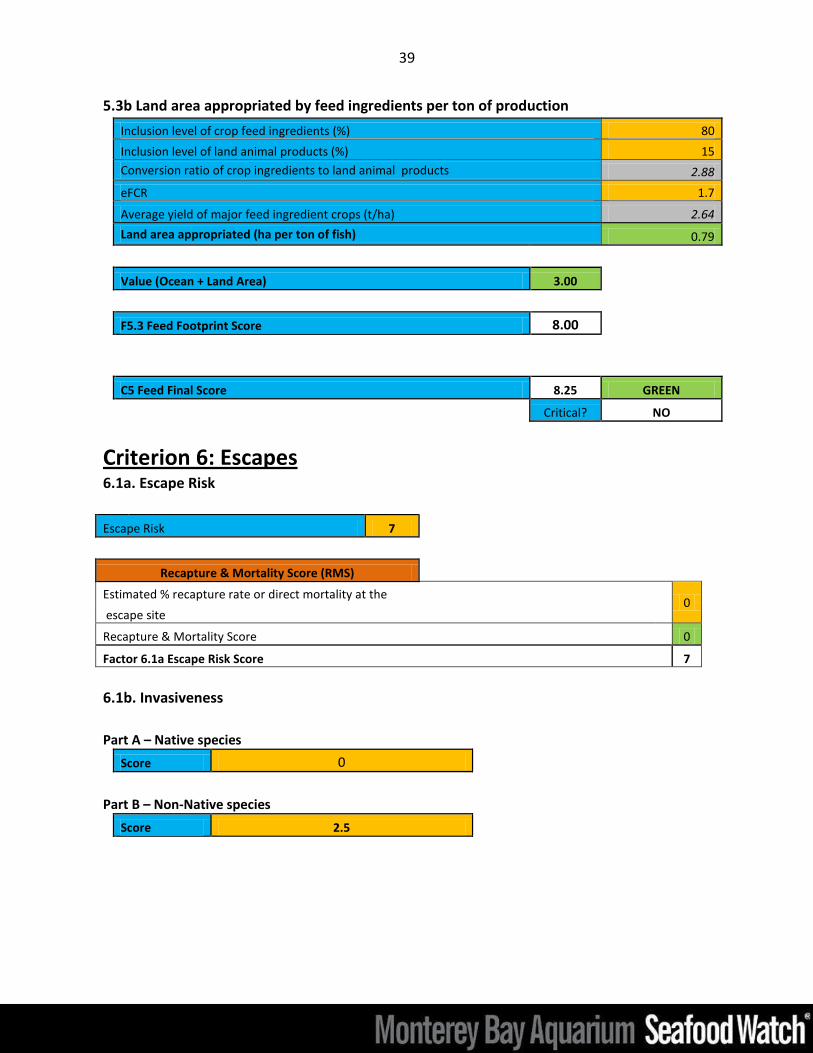
5.3b Land area appropriated by feed ingredients per ton of production
Inclusion level of crop feed ingredients (%) 80
Inclusion level of land animal products (%) 15
Conversion ratio of crop ingredients to land animal products 2.88
eFCR 1.7
Average yield of major feed ingredient crops (t/ha) 2.64
Land area appropriated (ha per ton of fish) 0.79
Value (Ocean + Land Area) 3.00
F5.3 Feed Footprint Score 8.00
C5 Feed Final Score 8.25 GREEN
Critical? NO
Criterion 6: Escapes 6.1a. Escape Risk
Escape Risk 7
Recapture & Mortality Score (RMS)
Estimated % recapture rate or direct mortality at the 0
escape site
Recapture & Mortality Score 0
Factor 6.1a Escape Risk Score 7
6.1b. Invasiveness
Part A – Native species
Score 0
Part B – Non-Native species
Score 2.5

40
Part C – Native and Non-native species
Question Score
Do escapes compete with wild native populations for food or habitat?
To some extent
Do escapes act as additional predation pressure on wild native populations?
No
Do escapes compete with wild native populations for breeding partners or disturb breeding behavior of the same or other species?
To some extent
Do escapes modify habitats to the detriment of other species (e.g. by feeding, foraging, settlement or other)?
To some extent
Do escapes have some other impact on other native species or habitats?
No
3.5
F 6.1b Score 6
Final C6 Score 6.00 YELLOW
Critical? NO
Exceptional Factor 6.2X: Escape of unintentionally introduced species
Escape of unintentionally introduced species parameters Score
F6.2Xa International or trans-waterbody live animal shipments (%) 0.00
F6.2Xb Biosecurity of source/destination n/a
F6.2X Escape of unintentionally introduced species Final Score 0.00 GREEN
Criterion 7: Diseases
Pathogen and parasite parameters Score
C7 Biosecurity 8.00
C7 Disease; pathogen and parasite Final Score 8.00 GREEN
Critical? NO
41
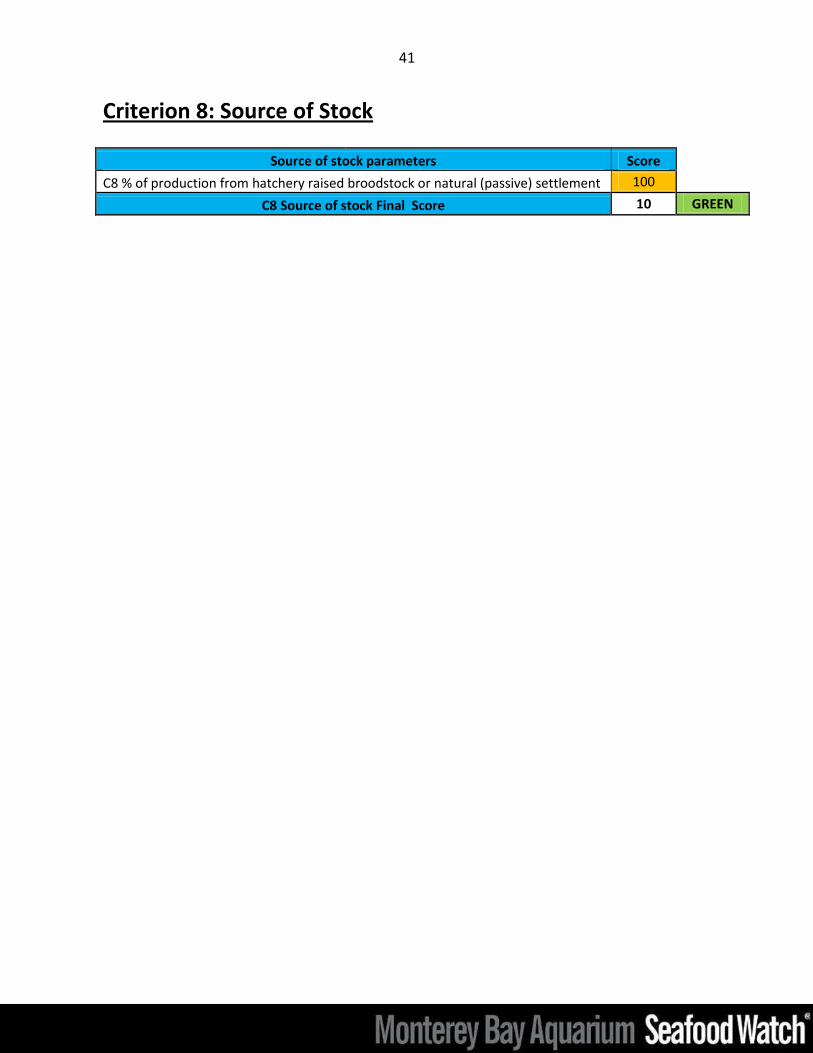
Criterion 8: Source of Stock
Source of stock parameters Score
C8 % of production from hatchery raised broodstock or natural (passive) settlement 100
C8 Source of stock Final Score 10 GREEN