Farm Wind Energy - David Roe (IEP)
23
Sustainable Energy Overview Wind Energy Sustainable Energy & Water Presented by: David Roe CEnv IEng MIAgrE Chartered Environmentalist and Consulting Engineer IEP Ltd david.roe@iep‐environment.com
-
Upload
farming-futures -
Category
Documents
-
view
264 -
download
2
Transcript of Farm Wind Energy - David Roe (IEP)

Sustainable Energy Overview
Wind Energy
Sustainable Energy & Water
Presented by: David Roe CEnv IEng MIAgrEChartered Environmentalist and Consulting EngineerIEP Ltddavid.roe@iep‐environment.com

Why Renewable Energies?
• Sustainable development
• Attenuate climate change
• A step into the low carbon economy

Why Wind Energy?
Large amounts of wind are delivered free of carbon and financial cost. The UK is the windiest part of Europe.
“Farmers with wind turbines have a new attitude to the weather. When the wind is blowing they are smiling. When it is not blowing they are spraying.”

To Own or Not to Own?
Options to self install turbine/s, receive a fee from a developer, or joint venture.
• Own turbine/s – You pay enabling, installation and maintenance costs. You receive full income, carbon offset & financial.
• Owned by others – You surrender access and the ground for others to install, low cost, low risk, may have no carbon offset, receive nominal fee.

Project ConsiderationsAvailable SitesWind Speed – matching turbine to available windDistance from ‘hurdles’ and blockersGrid connectionPlanningEcologyHeritageAccessFinancial

The Social Landscape
• 75‐80% of UK population are in favour of wind turbines
• Tourism has increased in areas with wind farms
• 5‐7% of UK population are against wind turbine, they make a lot of noise and try to recruit the neutrals and weaker in favours
• Strong political commitment
Consult neighbours early in the project

Available Sites – location?
• Ideally on high ground, open to prevailing and other winds, surrounded by short grass, water or level paving
• For the rest of us avoid screening and turbulence to the prevailing winds
• Land owned or permission needed?
• Permission needed for access or cable routes?
• Distance to connection point?

Wind Speed
• National database for smaller projectNOABL is recognised for MCS certified installations
• Bench mark monitoring for medium scale 3 months mast results compared with local database
• Full monitoring12 – 24 months mast monitoring at multi levels
The performance of wind turbines is impossible to predict with certainty due to the variability of wind from location to location and from year to year. This estimate is given as guidance only and should not be considered as a guarantee. For a greater level of certainty it is recommended that on site wind speed monitoring is carried out and results are compared to a local reference site.

Distance from Hurdles and Blockers
• Nearest independent dwelling? Acceptable noise and shadow levels. 110m, 300m, 500m, 2km?
• Hedgerows and habitats, usually 50m min.
• Roads, pipelines, overhead & underground cables?
• Airports, Radar, Low flying aircraft?
• Grade 1 listed and heritage sites?
• Transmission masts and stations?

Which Wind Turbine?
• Matching output to requirement
• Energy, Carbon Offset or Financial criteria?
• Own use plus export connects your side of the meter
• Export only from larger turbines
• Specify kWhrs/year not kW rating!!!!!!!!

Maximum Yield – The Basics
• Wider rotor diameter = more swept area = more energy
• Taller mast = higher wind speed = more energy
• Durable design = more time at work = more energy
• Match turbine/s to wind speeds
• More energy = more income

Grid Connection
• Smaller projects connect client side of meter
Save on what is used, remainder sold to the grid,
Zero or low connection charge, 3 phase assumed
• Larger projects connect direct to grid
District network operator gives permission and passes on cost ofadditional infrastructure

Project Costs & BenefitsCosts
• Feasibility and Enabling
• Installation and Capital
• Upkeep
Benefits
• Energy used ‐ costs saved
• ROC’s & FIT’s
• Export
• Reduced carbon levy
• Being in the low carbon supply chain

Proposed Generation Tariff DECC, February 2010
Technology Scale Proposed FIT Rate ‐ July 09
Annual Degression
Wind <1.5kW 30.5 4Wind 1.5–15kW 23 3Wind 15–50kW 20.5 3Wind 50–250kW 18 0Wind 250–500kW 16 0Wind 500kW–5MW 4.5 0
Technology Scale Proposed FIT Rate April 2010 ‐2013
Tariff lengthYears
Wind <1.5kW 34.5 20Wind >1.5–15kW 26.7 20Wind >15–100kW 24.1 20Wind >100–500kW 18.8 20Wind >500–1,500kW 9.4 20Wind >1,500kW–5MW 4.5 20
Guaranteed export price 3p until reviewed in 2013.May review choice of fixed or market price annually.
Minimum payment frequency, quarterly.Register with supplier or FIT agent.

Feasibility & Enabling Costs
• Initial desk study to identify probable sites and possible limitations
• Formal site survey report to inform all stakeholders
• Preparation and submission of planning case
• Informing communities and officials
• Answering issues arising from consultations
• Grid connection protocols

Grants – RDPE & OthersWhere FIT’s or RHI subsidies are claimed it is improbable that grants can also be claimed.
The clearest statement so far is:
“Where a project is otherwise eligible for RHI support but has received or receives a central Government grant, we may require that such grant monies be paid back in order for the project to be eligible for RHI support. As stated in the RES, we will not require this for grants received at the domestic level before the start of the RHI. At this level, householders will not have to pay back central Government grants in order to receive RHI support. RHI eligibility will also not be limited where grants other than those funded by central Government (i.e. European or local grants) are taken up. However, in all these situations, State Aid limitations may nevertheless restrict the extent to which generators would be able to combine RHI support with grant support.”
RHI Consultation 1st Feb 2010 ‐ Page 64

Feasibility & Enabling Costs
Guide to risk cost that increases with the size of the project:
• Small turbine £2 – 5,000
• Medium turbine £ 5 – 25,000
• Larger turbines £25 – 250,000
Planning decision appeal from £2,500

Financial Income Comparison
Owned or by Others?
• Utility wind farm owned by others:
£15‐25,000 /turbine/annum
• Single 250kW turbine owned by landowner:
£73,000 /turbine/ annum (less cost of capital)
• Income from 3 or 4 wind farm turbines belonging to others = income from 1 x 250kW turbine belonging to land owner

Financial Illustrations ‐ Small
11kW Turbine
Guide price for project ‐ £60,000
Output estimate ‐ example:• 30,000kWhrs/year from 5.5m/s average annual wind
speed at 18.3m hub height saving around 17t of CO2
emissions.
• Savings generated for own use: 12p/kWhr
• Income from export to grid: 3p/kWhr
• FIT: 26.7p/kWhr
• Annual maintenance cost : £600

Output Budget – SmallAll exported:
30,000 x £0.297 = £8,910 /year
All used:
30,000 x £0.387 = £11,610 /year
Subtract £600/year maintenance
Simple Payback: (no inflation or Interest)
Exported: £60,000/£8,910 = 6.75 yrs
Used: £60,000/£11,010 = 5.5 yrs
Income during 20 years:
Exported: £118,200
Used: £160,200

Output Budget – Medium
250kW Turbine • Guide cost £500,000 installed
• 352,000kw/hrs/year from 5.4m/s at hub. Saving 197t CO2
Export: 352,000 x (18.8p + 3p) = £76,736
Used: 352,000 x (18.8 + 10p) = £101,376
Subtract maintenance : est. £3,500/yr
Simple payback: 5.2 to 6.9 years
Income during 25 years:
Export: £1,830,900
Used: £2,446,900
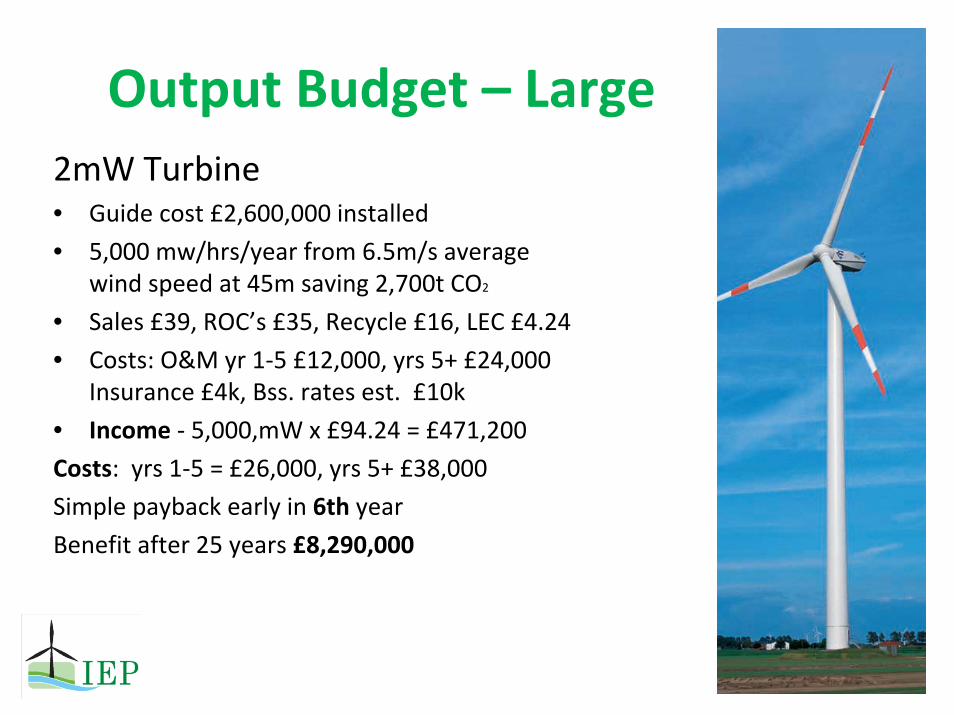
Output Budget – Large2mW Turbine • Guide cost £2,600,000 installed
• 5,000 mw/hrs/year from 6.5m/s average wind speed at 45m saving 2,700t CO2
• Sales £39, ROC’s £35, Recycle £16, LEC £4.24
• Costs: O&M yr 1‐5 £12,000, yrs 5+ £24,000 Insurance £4k, Bss. rates est. £10k
• Income ‐ 5,000,mW x £94.24 = £471,200
Costs: yrs 1‐5 = £26,000, yrs 5+ £38,000
Simple payback early in 6th year
Benefit after 25 years £8,290,000
Strategy & Enabling ServicesIEP LtdCentre Of Renewable EnergyManor Business ParkEast DraytonNottinghamshireDN22 0LG
service@iep‐environment.comwww.iep‐environment.co.uk
0115 7142459