Mobile Number Portability (MNP) : Report card 2016 : Idea biggest gainer, RCom biggest loser
Upload
brad-wilsonCategory
view
357download
0
Farm Bill
Net ImpactsMaps and Charts
showing farm subsidies in context

Iowa is the biggest
farm bill loser.
Read my blog: “First Ever? Map of
Farm Bill NET Impacts,”
http://zcomm.org/zblogs/first-ever-map-
of-farm-bill-net-impacts-by-brad-
wilson/

Subsidies in context:
Rice
The horizontal line is the traditional fair
price standard. Price Floors, originally at
90%, were lowered and eliminated. Prices
fell. Even with subsidies, farmers got less.

Reductions +
Subsidies = Net
As crop prices fell, farmers saw large
reductions in value, but then got subsidies
to compensate for part of it. The cornbelt
was reduced by $500 billion, net impact.

The Cornbelt nets
down $500 billion.
The regions that got the biggest subsidies, as
shown on USDA’s “Farm Program Atlas,”
http://www.ers.usda.gov/data-products/farm-
program-atlas/go-to-the-atlas.aspx#.U-
q8kyh0HCE also got the biggest reductions, for
the huge net reductions shown here.

dairy reductions: State
rankings
Dairy subsidies were even smaller than
crop subsidies, in comparison to value
reductions. Dairy is the canary in the mine
of the Farm Bill.

5 big dairy states:
Regional losers
When the five biggest dairy states are
combined, they net down $162 billion for
dairy alone. When you eat, farmers
subsidize you, net result. “Got milk!”

5 big dairy states:
Regional losers
When five big dairy states are combined,
they net down $162 billion for dairy alone.

The northeast: 9
smaller states
The states of the northeast grow fewer field
crops and are smaller in size and therefore
smaller in total impacts. They can have
large net impacts per capita or per farm.

Appalachia: 5 Farm
Bill Net Losers
Farm subsidies are just the tip of the
iceberg. What gets you is hidden below the
surface. It can be “titantic!”

7 Southeast and Delta
States
States and regions vary in the field crops
(farm bill program crops) that they raise.
Arkansas is a large rice producer.
Mississippi is known for cotton.

Commodity Crops in
context
These maps show the lie implied in USDA’s
Farm Program Atlas, which ignores the
huge reductions in prices and overall value
for the major field crops.

Crops only: New Farm
Bill Losers
Farm Bill ImpactsThe regions that are best
suited for raising field crops are also the
places that are most exploited by the food
and feed mills, CAFOs, exporters & others.
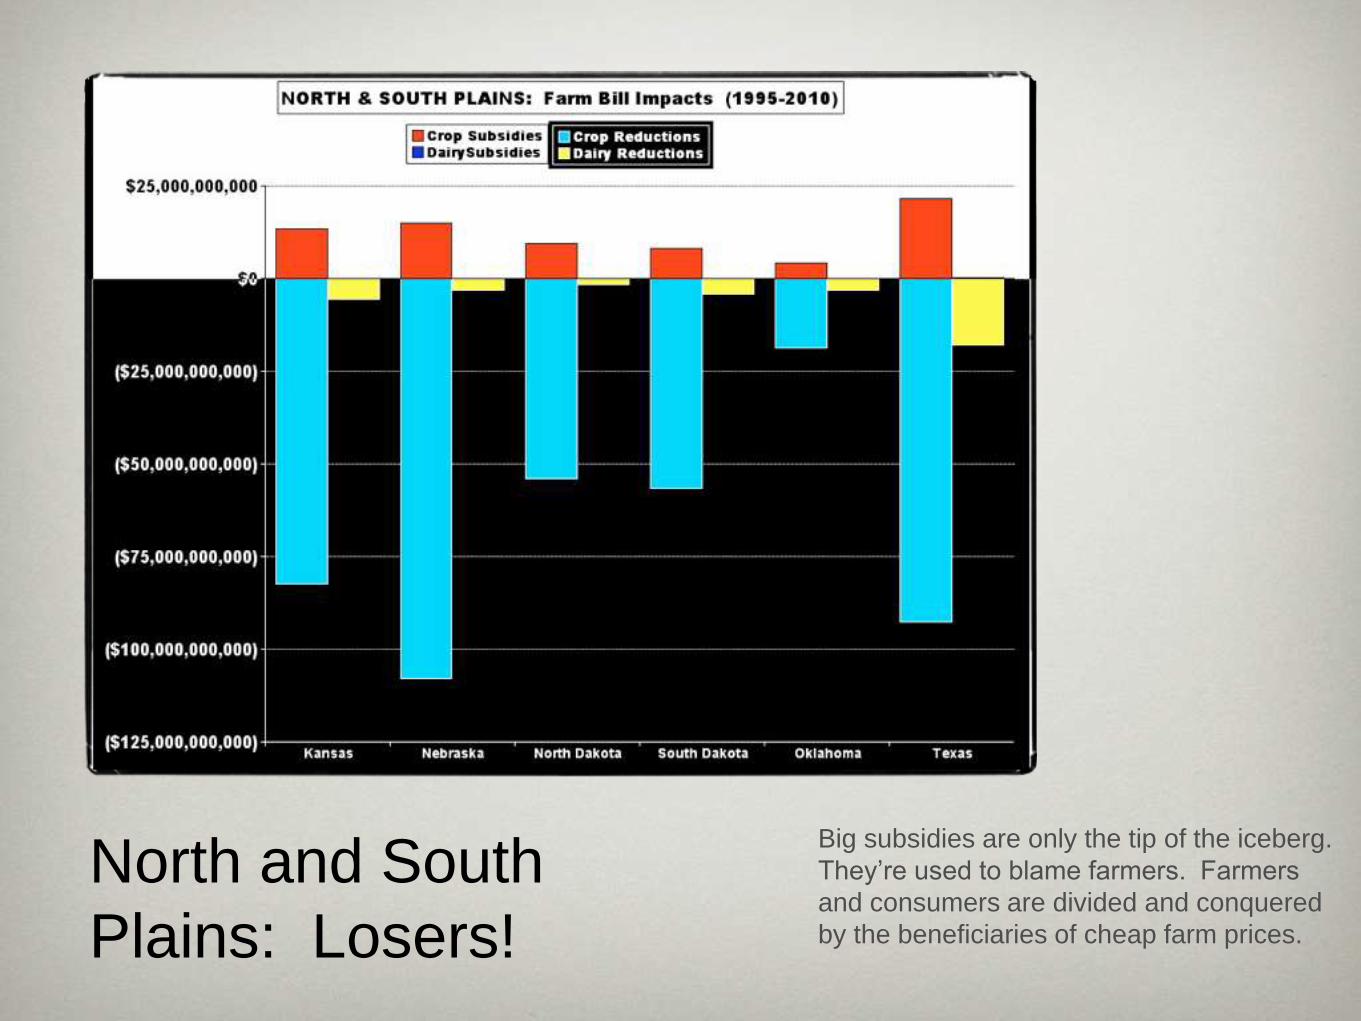
North and South
Plains: Losers!
Big subsidies are only the tip of the iceberg.
They’re used to blame farmers. Farmers
and consumers are divided and conquered
by the beneficiaries of cheap farm prices.

MOuntain states: farm
bill losers
Congress has hurt mountain regional states
too, by lowering and eliminating Price
Floors. Subsidies compensate farmers for
only a small fraction of the reductions.

Pacific states: Net
Farm Bill Losers
California is the biggest dairy net loser.

Even Alaska and
Hawaii are losers
Dairy is what registers in these states.
(Data comes from USDA-NASS:
Agricultural Statistics Annuals, various
years.

Subsidy reforms:
A False Solution
Erasing the yellow line does nothing to raise
farm prices. There is zero correlation
between rice subsidies and lower prices prior
to 1977. Restore Price Floors! (No subsidies
needed.)

Support
Farm JusticeMere Subsidy reforms
fail. They cause cheap
prices for junk food, cafos
& export dumping The
only proposals to fix
cheap food are those of
NFFC and NFU.