far1 a - library.wur.nl · The first rains start at about the end of March, ... Kiambü, Embu and...
101
!!•«•<•- f1 ara
Transcript of far1 a - library.wur.nl · The first rains start at about the end of March, ... Kiambü, Embu and...

! ! • « • < • -
f1
ara

Ministry of Agricul
1ST a t d_ o n a. X A g r i c u l ies
ilizer Use Recommendation
Project (Phase X)
Annex XXX
Description of tln^ FdLirsti: P r io r i t y
Sites in tln.̂ Various Distiricrts
Volume 21
Murang'a District
District No.: 21
Nairobi, June 1987

i l i z e r TUse ion
Pro j
Pro j
Team of Consultants1)
Tee», in
ProfessionalStaff fromNAL2)
H. Strobel (ed.)Project Coordinator
Project CoordinationG.HingaDirector NAL
S.W.NandwaCounterpartCoordinator
R. JätzoldR. Rötter
Aaro-ClimatoloaistsJ.W. Onyango
R.F. van de WegE.M.A. Smaling
Soil Scientists / SurveyorsF.N. MuchenaC.K.K. GacheneJ.M. Kibe
P. PietrowiczSoil Chemists
J.N. QureshiP.O.S. Oduor
A.Y. AllanAgronomists
J.O. Owuor
H. MayrR. DölgerA. Muliro
R. Rötter
Data Processing
Land Surveyors
R.L. MilikauD.K. Wamae
B. MwangiS. Wataka
W. BayerAnimal Production
1) German Agency for Technical Cooperation (GTZ) (German AgriculturalTeam (GAT))
2) National Agricultural Laboratories

F e r - t i X d_ zeur Use Recommendation
P r o j e c t C Phase X )
R e p o r t : M e t h o d o l o g y and Inventory of Existing Information
: Compilation of results from Former Fertilizer TrialsIn Kenya (2 Volumes)
. 1 : Inventory of Farming Systems Research in Kenya
X . 2 : Influence of Fertilizer Application on RuminantProduction
A n n e x X X . 3 : Maintaining Soil Fertility with Little or No Use ofFertilizers
Detailed Description of the First Priority Sites in theVarious Districts :
1. Kisii 17. Narok2. South Nyanza 18. Samburu3. Kisumu 19. Nyandarua4. Siaya 20. Kiambu5. Busia 21. Muranga6. Bungoma 22. Nyeri7. Kakamega 23. Kirinyaga^8. Nandi 24. Embu9. Kericho 25. Meru
10. Trans Nzoia 26. Machakos11. Uasin Gishu 27. Kitui12. West Pokot 28. Lamu13. Keyo Marakwet 29. Kilifi14. Baringo 30. Taita Taveta15. Laikipia 31. Kwale16. Nakuru 32. Nairobi
Annex XV : Description of Computer Programmes Establishedin Phase I
Scanned from original by ISRIC - World Soil Information, as ICSUWorld Data Centre for Soils. The purpose is to make a safedepository for endangered documents and to make the accruedinformation available for consultation, following Fair UseGuidelines. Every effort is taken to respect Copyright of thematerials within the archives where the identification of theCopyright holder is clear and, where feasible, to contact theoriginators. For questions please contact soil.isrictBwur.nlindicating the item reference number concerned.

District: Murang'a General Aspects 21.0
Gontents
Annex XXI- Volume 2X
Page
Chapter 2X - O s
General Aspects 0.1
Legend of the Soil Map of Murang'a District 0.27
Chapter 2X - X s
Description of the Kandara-Kareti Trial Site 1.1
ar 2 X - 2 =
Description of the Makuyu Trial Site 2.1
Please note the following numbering mode of Tables and Maps:First NumberSecond NumberThird Number
District NumberTrial Site NumberNumber of Table or Ma,p within Chapter.
- 0.1 -

District: Murang'a General Aspects 21.0
Contents of Chapter 21.0:
General Aspects
1. Climate and Soils of the District
2. Location of the Trial Sites and Criteria for their Final Position
3. Names and Addresses of Government Officers Involved in FURPActivities
4. Trial Design and Execution Plan
5. Areas in Murang'a District Represented by FURP Trial Sites
Page
0.3
0.13
0.15
0.16
0.17
List of Tables
Table 21.0.1 Climate in the Agro-Ecological Zones of Murang'aDistrict 0.6
Table 21.0.2 Agro-Ecological Zone and Soil Classification of the Trial
Sites 0.9
Table 21.0.3 Ratings of Criteria Used for Trial Site Selection 0.14
Table 21.0.4 Names and Addresses of Government Officers in the
District 0.15Table 21.0.5 Major Soil Properties and Climatic Conditions of the
Agro-Ecological Units in Murang'a District 0.23
List of Maps'
Map 21.0.1 66% Reliability of Rainfall in First Rains 0.4
Map 21.0.2 66% Reliability of Rainfall in Second Rains 0.5
Map 21.0.3 Agro-Ecological Zones and Trial Sites of the District 0.7
Map 21.0.4 Soils and Trial Sites in Murang'a District 0.11
Map 21.0.5 Groupings of Soil Mapping Units Represented by Trial
Sites in Murang'a District 0.21
Map 21.0.6 Agro-Ecological Units in Murang'a District 0.25
Legend of the Soil Map of Murang'a District 0.27
- 0.2 -

District: Murang'a General Aspects 21.0
1. Climate and Soils of the District
Murang'a District, situated on the eastern slopes of the Nyandarua Range,has due to the south eastern Trade Winds a climate which is typical forincreasing altitudes in the area and which is characterized by highrainfall and distinctive agro-humid periods.
The average annual rainfall in the District is variable, ranging from>800 mm in the south-east (Zone UM and LM 4) to >2600 mm in the north-west(Zone UH 0). The rainfall pattern is bimodal and rainy seasons are clearlyseparated. The first rains start at about the end of March, with theirpeaks in April and May while the second rains start any time from thebeginning of October with the peak in November, as shown in Figures 21.1.5and 21.2.5.The 66% reliability of rainfall, i.e. amount surpassed in 20 out of 30years, is shown in Map 21.0.1 for the first rains and in Map 21.0.2 for thesecond rains.Evaporation, varying with altitude, ranges between 1800 mm. at 1400 m, and1300 mm. at 2500 m.The mean annual temperature is about 20°C at 1400 m and 12.5°C at 2500 m.A summary of climatic data is compiled in Table 21.0.1, which can be usedas a key to the Agro-Ecological Zones Map 21.0.3.
The annual average rainfall reaches a maximum of 2700 mm at 2500 m. Fromthis altitude up to the forest line and down to about 2150 m, it is so wet,cold and steep that the area is not recommended for agriculture (UH 0). Astrip of UH 1 extends further down to the frost line and the 15° Cisotherm, (here due to heavy cloud cover exceptionally low at about 2050 m)and is generally known as the Sheep and Dairy Zone, though in view of thepopulation pressure, vegetable cultivation would be more appropriate.
The next zones are found in descending order on the eastern slopes of theNyandarua Range: the Tea-Dairy Zone LH 1, the Coffee-Tea Zone UM 1, theMain Coffee Zone UM 2, the Marginal Coffee Zone UM 3, and the Sunflower-Maize Zone (UM 4) which is actually partly a sisal and pineapple zone dueto the presence of large estates. A strip of UM 3-4 occurs towards the eastin the Kakuzi Hills, although on less suitable soils which are verymarginal for coffee. Additional irrigation is essential here.
Down on the plains where cotton production is feasible - the limit isreached at about 1300 m where a decrease in cloudiness leads to reducedinsulation - the climate becomes so dry within short distances (annualaverage 800-900 mm) that the Cotton Zone LM 3 is little more than a smalltransitional strip to the Marginal Cotton Zone LM 4.
Agro-Ecological Zones UM 2 and UM 4 are represented by the Kareti (21.1)and Makuyu (21.2) Trial Sites, as shown on Map 21.0.3.. Zones LH 1, UM 1 andLM 3-4 are represented by Trial Sites in Nyeri, Kiambü, Embu and MeruDistricts.The Marginal Coffee Zone (UM 3) is not yet represented by any of the FURPfirst priority trial sites.
- 0.3 -

37°|E
Map 21.0.1 MURANG'A
66% RELIABILITY OF RAINFALLIN AGROHUMID PERIOD
OF FIRST RAINS(March-Sept. or less)
Amounts in mm, surpassed 9Nnorm. in 20 out of 30 years
Broken boundaiies are uncertain
because ol lack ol rainlall records
Nal Agr Labi. German Agr Team. R Jaeliotd
- 0.4 -

Map 21.0.2
37°|E
MURANG'A
66% RELIABILITY OF RAINFALLIN AGROHUMID PERIOD
OF SECOND RAINS(Oct.-Feb. or less)
Amounts in mm, surpassednorm, in 20 out of 30 years
f
THIKAV
Broken boundaries arc uncertain
because ol lack of rainlall records
Nai Agr Labs German Agr Team. R JaeUold
- 0 . 5 -

Table 21.0.1 : climate in the Agro-Ecological Zones of Muranga District
Agro-Ecological
Zone
Subzone
TA I + 11
Tropical
Alpine Zones
UMO
Forest Zone
Uli 1Sheep andDairy Zone
LH 1
Tea - Dairy
Zone
UM 1
Coffee - Tea
Zone
UM 2
Main Coffee
Zone
UM 3MarginalCoffee Zone
UM 4
Sunflower -
Maize Zone
LM 3
Cotton Zone
LM4
Marginal
Cotton Zone
3 or 1/vl " m
p or 1/vl - m
p or f 1 ^ m
f l i m
m/l i m/s
m + s/m
m/s + ss/m + s/m
s/m + ss + s
s + s/vs
s/m + ss + s
s + s/vss/vs + s/vss/vs + vj/s
Altitudein m
Annual meantemperature
in°C
National Park
Forest Reserve
2 130-2 430
1 730-2 130
1 670-1 800
1 500-1 670
1 340-1 500
1 340-1 520
1 160-1 340
1060-1 160
14.9-13.0
18.0-15.0
18.8-18.0
19.7-18.8
20.7-19.7
20.7-19.5
21.7-20.8
22.3-21.7
Annual av.rainfallin mm
2 200-2 500
1 700-2 400
1 700-1 9001 500-1 700
1 300-1 6201 180-1 400
900-1 350900- 950
900-1 100850- 950800- 850
66 % reliabilityof rainfall1'
1st rains 2nd rainsin mm in mm
1 100-1
850-1
800-1700-
550-450-
350-350-
320-280-200-
400
300
100900
820650
650410
450380280
650-700
480-680
500-580400-520
320-480280-400
230-380260-310
230-300220-280200-230
Very small, see Kirinyaga District980-1 100 390- 490 270-320
900-1 000 350- 450 230-280790- 980 320- 400 250-300
Very small, see Kirinyaga District
66 % reliabilityof growing period
1st rains2' 2nd rains Total^'in days in days in days
210 or more
210 or more
210 or more180 or more
160 or more130-160
110-130105-115
100-11090-10585-100
85-105
85-10075- 85
140-155 350-365
140-155 350-365
140-155 350-365130-140 310-340
110-130 270-300105-115
90-100100-110
90-10090-10075- 85
85-100
75- 8575- 85
Amounts surpassed normally in 6 out of 10 years, falling during the agro-humid period which allows growing of most cultivated plants.More if growing cycle of cultivated plants continues into the period of second rains.Only added if rainfall continues at least for survival (> 0.2 Eo) of most long term crops.
Source: Jaetzold R., and H. Schmidt, eds. (1982): FarmManagement Handbook of Kenya, Volume Il/BCentral Kenya, page 568.
- 0.6 -

MAP 21.0.3 AEZS AND TRIAL SITES IN MURANGÄ DISTRICT
37° E
• Site of first priority21.1 Kareti
21.2 Makuyu
ofl
LM3mts
S
AGRO-ECOLOGICALZONES
Forest Reserve
Unsuitablesteep slopes(only marked outsideNat. Parks or Forest Res.)
Nat Park
soil boundary, see Map 4
Belt of A. E. ZonesA. E. ZonesSubzones
• " » ^ Broken zonal boundariesare uncertain or
— — — mean transitional strips
Climatic data for AEZ formulas see tables II. 1-2 ||. 1. 4 and 21.0.1
üAS
FERTILIZER USE RECOMMENDATION PROJECT (19871Ministry of AgricultureNational Agricultural LaboratoriesGerman Agricultural Team
15 20 25 km

m
euger
V*»-C\)

District: Murang'a General Aspects 21.0
The soils of Murang'a District are shown in Map 21.0.4.
Apart from the eastern-most part, the soils of Murang'a District corres-pond entirely with the typical Aberdares-Mount Kenya Toposequence, whichoccurs in all districts from Meru down to Kiambu and Nyandarua.The mountain unit MV2 (humic Andosols, partly lithic phase) graduallygives way to extensive volcanic footridges (units RB 1,2 and 3), whichaccount for more than 50% of the area of the District.
East of the Murang'a-Makuyu line, the plateaus and high-level structuralplains (units LB 1, 2 and 8) occur. All these soils are developed on basicigneous rocks.
The major mapping units are given below.
=== Soils developed on basic igneous rocks.
- Unit RBI: ando-humic Nitisols, with humic Andosols (Trial Site 22.1.Nyeri District);
- Unit RB2: humic Nitisols (Trial Site 21.1):- Unit RB3: eutric Nitisols, with shallower inclusions (Trial Site 21.2'):- Unit LB1: nito-rhodic Ferralsols (Trial Site 24.2. Embu District).
In the eastern-most part of the District shallow Regosols and Cambisols(unit HUC), deep Arenosols and Luvisols (unit FUC) and moderately deep todeep orthic and rhodic Ferralsols (unit UU1) prevail.
The basic climatic and soil designations referring to trial sites inMurang'a District are summarized in Table 21.0.2.
Table 21.0.2: Agro-Ecological Zone and Soil Classification of Trial Sitesin Murang'a District
SiteNo.
21.1
21.2
SiteName
Kareti
Makuyu
Agro-EcologicalZone
Main CoffeeZone (UM 2)
Sunflower-MaizeZone (UM 4)
Soil Classification
humic NITISOL
eutric NITISOL
- 0.9 -

MAP 21.0.4 SOILS AND TRIAL SITES IN MURANG'A DISTRICT
37° E
• Site of first priority
21.1 Kareti
21.2 Makuyu
0°30'
rABERDARNATIONAL/PARKI ,'MVI,
S
SOURCE
El Exploratory Soi l Map of Kenya,1980(sca le 1:1,000,000)
KEYLB1 soil mapping code
— soil boundary
W# towns and major villages
— -=: tarmac road
•==r other all-weather roads
district boundary
national park'boundary
river
Fox LEGEND See APPENDIX
F E R T I L I Z E R USE RECOMMENDATION P R O J E C T ( 1 9 8 7 ) Ministry of AgricultureNational Agricultural LaboratoriesGerman Agricultural Team
_
10 15 20 25 km

District: Murang'a General Aspects 21.0
2. Location of the Trial Sites and Criteria for their Final Position
In Murang'a District, two first priority sites were selected as shown inMap 21.0.4.
Site selection in Murang'a District turned out to be rather time-consuming.Since farmers specialize in cash crop farming, it is uncommon to find aportion of land as large as two acres set aside for food crops only.
Trial Site 21.1 was scheduled to be in the area around Kangema, but lack ofsuitable sites made the team shift to Kandara Division. The District CropsOfficer managed to lease two acres from the Kareti Secondary School. Arectangular plot was demarcated. Although the upper part has a steep slopeof 14%, and the lower part is gently undulating (5%), extremely deep humicNitisols were encountered over the entire trial plot.
Accessibility of this site is good if approached from the Nairobi-Murang'amain road, but poor if approached from the Kandara Divisional Office. Thesite has a very high demonstration effect.Farmers' fields are representative and within close range of the trialplot. The nearest suitable long-term rainfall station Thika, Kajuga Farm,is located 10 km SW of the Kareti Trial Site.
Trial Site 21.2 was established near Makuyu. A rectangular two acre plotwas surveyed. Soils in both the trial site and farmers' fields areuniformly extremely deep eutric Nitisols. They are situated within walkingdistance from the main plot. The nearest long-term rainfall station:09037143, Makuyu Divisional Office is just 1.3 km S of the Makuyu TrialSite.
The site has good accessibility and a very high demonstration effect. Thesite is situated close to a major dust road, and is close to Makuyutownship. Unfortunately, the farmer does not live on the plot, which mayimply a high risk of theft.
The criteria for the final position of the trial sites are listed in Table21.0.3, which is self-explanatory. Criteria have been rated very good (1),good (2), moderate (3), poor (4) or non-relevant (nr).
- 0.13 -

District: Murang'a General Aspects 21.0
Table 21.0.3: Ratings of Criteria Used for Trial Site Selection inMurang'a District
Criterion
1. Representativeness of Agro-Ecological Zones2. Representativeness of soils3. Representativeness of topography
4. Adequacy of size and shape of the trial plot5. Absence of trees and hedges6. Absence of rocks and boulders7. Absence of termite mounds8. Uniformity of previous land use
9. Accessibility10. Demonstration effect11. Proximity to a long-term rainfall station
12. Availability of storage facilities13. Availability of sturdy fences14. Availability of housing facilities for T.A.s
15. Farmer's willingness to cooperate16. Security - theft17. Security - intruding animals
18. Proximity of on-farm trials19. Representativeness of soils at on-farm trials
Sitenumber
21.1
112
32112
2-313
241
122
21
21.2
111
22112
211
441
242
21
- 0,14 -

District: Murang'a General Aspects 21.0
3. Names and Addresses of Government Officers Involved in FURP Activitiesin Murang'a District
The names and addresses of the agricultural staff members in the Districtare listed in Table 21.0.4.
Table 21.0.4: Names and Addresses of Government Officers in the District
OFFICER
DISTRICTD.C.D.A.O.D.C.O.D.E.C.
DIVISIONDiv. Ext.OfficerSoil ConsOfficer
Loc. Ext.Officer
TechnicalAssistant
SITE
21.121.2
21.1
21.121.2
21.121.2
NAME
Joel ole Waupari*J.K. KanjaguaJohn .K. KamanuMiss A. Onyango*
Bernard OndanyiKithingi Inoti
D.G. Kiritu
not metnot met
K. Wanyururunot met
P.O. BOX
7-Murang'a68-Murang'a68-Murang'a68-Murang'a
1-Kandara28-Makuyu
1-Kandara
TEL. NO.
22606226042260422604
13-Kandara
13-Kandara
* not met during site selection
Period of site selection in the District: August 1986.
- 0.15 -

District: Murang'a General Aspects 21.0
4. Trial Design and Execution Plan, Murang'a.
(Full details of the methodology for carrying out the trials are shown inChapter IV of the main report).
Selection of crops for each of the three modules at the two Murang'a TrialSites:
Site 21.1 Kandara-Kareti.
RAINY SEASONS1st, Long, March 2nd rains Aug-Oct
51 Standard Maize52 Maize & Peas53 Pot./Cabbages;Beans
Hybrid 512H.512+ Beans GLP 2Anett/Copenhagen
Hybrid 512H.512+ Beans GLP 2Beans, GLP 1004
The 1st sequence or module is continuous, pure maize, once/year.The 2nd is intercropped maize and beans, also once/year.The 3rd is potatoes or cabbages in the first rains, and beans, GLP 1004 inthe second rains.
Site 21.2 Makuyu. RAINY SEASONS1st, Long, March 2nd, Short, Oct.
51 Standard Maize52 Maize & Beans53 Maize & Pigeon Peas
Hybrid 511H.511+ GLP 92 BeansKatumani P.P.
Katumani C.B.K.C.B.+GLP 92K.C.B.+ K.P.P
The 1st sequence or module' is continuous, pure maize, twice/year.The 2nd is intercropped maize and beans in both rains.The 3rd is intercropped maize and pigeon peas in the October rains, withthe pigeon peas remaining for the March rains.
Each module contains 2 experiments, namely Experiment 1 and Experiment 2.Experiment 1 is a 4N x 4P factorial, with 2 replications in each module.The standard design for Experiment 2 is a 2NP x 2K x 2L x 2 FYM factorial,also with 2 replications in each module. This is the design for the site atMakuyu, 21.2, but for the Kandara-Kareti Trial Site (21.1), the design willbe modified by dropping lime, and will thus be: 2N x 2P x 2K x 2 FYM.
Each module thus consists of 64 plots, and the total for the 3 modules is192 plots.
Fertilizers will be applied during both rains, except for FYM, which willbe applied only to the crops during the first rains. The ratoon crop ofpigeon peas will not receive fertilizer in its second season, namely theMarch rains. Where beans, peas or pigeon peas are intercropped with maize,the fertilizer will go on the maize. The intercropped beans, peas or pigeonpeas will not receive any fertilizer directly, but will "scavenge" from themaize, and from residual fertilizer left in the relevant plots after thefirst season.
- 0.16 -

District: Murang'a General Aspects 21.0
5. Areas in Murang'a District Represented by FURP Trial Sites
The aim of FURP Phase I is to select trial sites which, as far as possible,are representative of the agriculturally high and medium potential areas ofKenya. This consideration constituted the backbone for making decisions asto where to establish these FURP trial sites.
Two representativeness maps are drawn per district. One refers to the soilsonly (Map 21.0.5: Groupings of Soil Mapping Units), and in the second (Map21.0.6) Agro-Ecological Units (AEUs) are shown in which, according to theinformation available, the soils and the climate can be consideredhomogeneous.
Map 21.0.5 shows the representativeness of FURP trial sites for theMurang'a District only as far as soils are concerned.The explanation for this Map shows 9 generalized "Groupings of Soil MappingUnits". These Groupings have the same or similar soil properties and, assuch, they represent a specific soil environment, typified by one of theFURP trial sites. i."
The codes in the explanation to Map 21.0.5 refer to a specific trial site(21.1, 21.2, etc.) and to a specific degree of representativeness of soils(A, B+, B-). The combination of both forms a "Soil RepresentativenessCode". Unit 21.1.A, for instance, covers an area which is highlyrepresented (A) by the Kareti Trial Site (21.1). Unit 22.1.B- covers anarea which is moderately represented (B) by the Muirungi Trial Site inNyeri District (22.1), although information on soil properties revealsslightly less favourable conditions in the represented area in the Murang'aDistrict than at Muirungi itself (B-).
The explanation to Map 21.0.5 also lists those units of the Soil Map (Map21.0.4) which are considered in the various groupings.A breakdown of soil properties referring to the Groupings of Soil MappingUnits is given as part of Table 21.0.5.
The soils of the Murang'a District are well represented by the FURP trialsites. This is testified by Map 21.0.5 which shows a very high A-cover(highly representative).
The different soils of the Aberdares-Mount Kenya Toposequence, discussed inSub-Section 21.0.1, are represented in the following Groupings:
Volcanic Footridges:
upper slopes : humic Andosols (Grouping 22.1.B-) and ando-humic Nitisols(Grouping 22.1.A);middle »lopes: humic Nitisols (Grouping 21.1.A);lower slopes: eutric Nitisols (Grouping 21.2.A);
Plateaus and High-Level Structural Plains:
Well drained, red, nito-rhodic Ferralsols (Grouping 24.2.A) and imperfectlydrained, black, pellic Vertisols (Grouping (23.2).A).Trial Site 23.2 is put in brackets, as it has not yet been identified. It
- 0.17 -

District: Murang'a General Aspects 21.0
is, however, advisable to have a site on the rather extensive Vertisol areaoccurring in Central Province and Embu District. As long as the site is notoperational, the area should be considered as C (not represented by a trialsite).
Areas which are not represented by any one trial site with respect to soilsare coded C. This involves some hills and footslopes in the area borderingMachakos District and the highest parts of the Aberdares.
The second representativeness map, Map 21.0.6, shows the integratedrepresentativeness of FURP trial sites involving both soils and climate.The map units are named "Agro-Ecological Units", and they represent aspecific soil-climate environment, typified by FURP trial sites.
All combinations of the different soil-climate environments occurring inMurang'a District are shown in the Agro-Ecological Unit Map (Map 21.0.6)and are explained in Table 21.0.5. The codes for the Agro-Ecological Unitsconsist of three parts: site, soil representativeness and climaticrepresentativeness. Site and soil representativeness are taken from Map21.0.5. In addition, Map 21.0.6 and Table 21.0.5 indicate the codes whichrefer to the representativeness of the climatic environment (smallletters).
Several degrees of representativeness are given according to the prevailingtemperature regime and the rainfall in the agro-humid period of the longrains.
All areas in Map 21.0.6 which are marked with code "a" (highlyrepresentative) are within the same temperature belt and receive the sameamount of rainfall (± 10%) in the agro-humid period of the long rains asthe trial site to which the code refers.
The map units marked with code "b" (e.g.: b++, b+- ,b+*) are only modera-tely represented by trial sites. In the AEU 21.1.A.b++, for instance, thesoils are highly represented by the Kareti Trial Site (21.1.A), but theclimate (b++) indicates that this Agro-Ecological Unit belongs to the nextwarmer temperature belt and receives 10-20% more rainfall than the KaretiTrial Site.
Areas which are not represented by any one trial site, i.e. soils and/orclimate not represented by any site, are coded 0.
The criteria set for sub-division of the various degrees of represen-tativeness with respect to soils and climate are further elaborated upon inChapter IV.2 of the main report.
- 0.18 -

E X P L A N A T I O N T O M A P 21.0.5
I
o
o
Degree of representativeness
A highly representative
B+ moderately representative(soils of map unit are slightly morefavourable than soils at the trial site)
B- moderately representative(soils of 'map unit are slightly lessfavourable than soils at the trial site)
C non-representative
Trial sites
21.1 Kareti - Murang'a District21.2 Makuyu - Murang'a District22.1 Muirungi - Nyeri District(23.2) 2> Mwea-Tebere - Kirinyaga District24.2 Gachoka - Embu District
Groupings of soil mapping
Soil RepresentativenessCode (Map 21.0.5) 1»
21.1.A
21.2.A
21.2.B+
22.1.A
22.1.B-
(23.2).A
24.2.A
24.2.B-
C
units
Soil Map UnitsIncluded (Map 21.0.4) •
RB2
RB3
LB2
RB1
MV2
LB8
LB1
UU1
othersLegend see Appendix
1 ) Digits show trial site number; letters indicate degree of representativeness.For cartographic reasons, Soil Representativeness Code C is not indicated for the many scattered hills,_bottomlands, and floodplains. These areas should be considered inclusions of units with Representativeness Codes A, B , and B .
2) Site has not yet been identified. See Subsection 21.0.5 for explanation.

MAP 21.0.5 GROUPINGS OF SOIL MAPPING UNITS REPRESENTED BY TRIAL SITES
IN MURANG'A DISTRICT37° E
• Site of first priority
21.1 Kareti
21.2 Makuyu
soil groupings mapping code
soil groupings boundary
For EXPLANATION see PREVIOUS PAGF
Ö .30'
ABERDARE,/
NATIONAL/
PARK) ,'MVL
±S
SOURCE
El Exploratory Soil Map of Kenya,1980(scale 1:1,000,000)
KEYLB1 soil mapping code
— soil boundary
9# towns and major vi liages
—. " tarmac road
-̂ -"̂ other all-weather roads
district boundary
national park boundary
—---• river
For LEGEND See APPENDIX
F E R T I L I Z E R USE RECOMMENDATION P R O J E C T ( 1 9 8 7 ) Ministry of AgricultureNational Agricultural LaboratoriesGerman Agricultural Team
10 15 20 25 km

Table 21.0.5: Hajor Soil Properties and Cliaatic Conditions of the Agro-Ecological Units in the Kurang'a District
Agro-Ecological Unit
Site Soil CliaateHo. Code Code
21.1. Aa
b*t
b*xb<ab*-
21.2. A
a
b*t
btib*-
21.2. Btabtt
22.1. Aab»tb*ib»a
bt*b*-bt-
22.1. B-ab*tb-tb-xb-a
(23.2).A
24.2. Ab-*
b-t
24.2. B-
26.4. A b*ibti
c-a
0
Soil properties
drai- eff. nutr. top- aoist. classi-nage depth avail, soil st.cap. fication
v ed h Iah vh hu Hi
v ed a-h 0 vh eu Hi (t ni-ch Cat ch Ac t ch Lu|
v vd h 0(-lh) vh ve-eu Ni (t ao Hi)
v ed h lab vh an-hu Hi (t hu An)
v vd a-h 2ah vh hu An
i vd h 0 b-vh pe Ve
v vd 1 0 . h-vh ni-rh Fe
v ad-d 1 0 a-h rh t o'r Fe
Cliaatic Conditions
teap.l) teap. 1) rainfall Agro-Ec. Agro-Ec.aean ann. aean ain. 66X prob,2) Subtone Zone 3)
18-21 11-14 560-680 a/1 i a/s UH 2to ats/a
18-21 11-14 560-740 f 1 i a to UH 1-2a/1 i a/s
18-21 11-14 740-800 f 1 i a UH 118-21 11-14 800-960 p or fl-a UH 118-21 11-14 500-560 ats/a to UH 2-3
a/stB18-21 11-14 440-500 a/sts UK 3
18-21 11-14 370-450 a/sts to UH 3-4s/ats
18-21 11-14 450-490 a/sts UH 3-418-21 11-14 490-530 a/sts UH 321-24 14-17 (90-530 s/ats to sts LK 318-21 11-14 330-370 a/sts to sts UH 3-4
21-42 14-17 370-450 sts/vs LH 421-24 14-17 450-490 sts (H 3
15-18 8-11 880-1080 p or 1/vl-a LH 115-18 8-11 1080-1180 p or 1/vl-a LH 115-18 8-11 1180-1280 p or 1/vl-a LH 118-21 11-14 530-610 a/1 i a/s UH 2-3
to a/sts18-21 11-14 880-1080 p or f l-a UH 115-18 8-11 780-880 p or 1/vl-a LH 118-21 Il-H 780-880 p or f l-a UH 1
15-18 8-11 880-1080 p or 1/vl-a LH 115-18 8-11 1080-1180 p or 1/vl-a LH 110-15 3-8 1080-1180 p or 1/vl-a UH 110-15 3-8 1180-1280 p UH 0-110-15 3-8 1280-1480 p UH 0-1
18-21 11-14 depending on situation of the site 618-21 11-14 depending on situation of the site 6
depending on situation of the site 6
18-21 11-14 320-400 4) sts to UH 4sts/vs
18-21 11-14 400-440 4) a/sts to UH 3-4s/ats
18-21 11-14 280-305 5) sts UH 418-21 11-14 280-305 5) s/vsts/vs LH 4
soil not representative
soil and/or cliaate are not representative
ley:
Effective toil depth Nutrient availabiliti
ed eitreaely deep > 180 ca. h highvd very deep 120-180 ca. a aoderated deep 80-120 ca. 1 lovad aoderately deep 50- 80 ca. vl very lovsh shallov 25- 50 ca. Specification givenvsh very shallov < 25 ca. in Chapter IV.2
(aain report)
TOPSOLI properties Soil classification
h huaic (base Ni Nitisols ao aollic ni-ch nito-chroaicsaturation >50 X) An Andosols hu huaic ni-rh nito-rhodic
ah acid huaic (base Ca Caabisols or orthic an-hu ando-buaicsaturation <50X| Lu Luvisols rh rhodic ve-eu verto-eutric
2 thick (30-60 ca.) Ac Acrisols ch chroaic pe pellic1 thin ((30 ca.) Fe Ferralsols eu eutric0 noh-huaic Ve Vertisols
Drainale HoisUre storafe capaciti
se soaevhat eicessive vh very high > 160 aa.v veil h high 120-160 aa.a* aoderately veil a aoderate 80-120 aa.i iaperfect 1 lov < 80 aa.p poor
1) Teaperature (*C)(differentiated according to ABZ belts)
2) Rainfall 66X probability (in aa.)-referring to agro-huaid period oflong rains only;
•for definition of rainfall ranges seeexplanation to Hap 21.0.6;-66X probability aeans that aaount ofrainfall vill be exceeded in at least20 out of 30 years.
3) Agro-Ecological Subtone-approiiaalive indication only, sincesuosones are not directlj related toaaount of rainfall;-"--" in foraula aeans "folloved by";-for further explanation of subtonessee Chapter IV on aethodology;
-Agro-ecological tones and subtonesare shovn in Hap 21.0.3.
4) Coaparable tiae: end of March-beginning of July.
5) Coaparable tiae: end of Harch-beginning of June.
6) Hear the 350 aa-isobyete recoaaended.
- 0.23 -

E X P L A N A T I O N TO M A P 21.0.6
Soil Codes Climatic Codes
= A =
= B+ =
= B- =
i
o(M
Trial sites
highly representative
moderately representative(soils of map unit are slightly morefavourable than soils at the trial site)
moderately representative(soils of map unit are slightly lessfavourable than soils at the trial site)
highly representative,i.e. same Agro-Ecol.ZonesBelt and long rains (+/-10%) as at trial site
moderately representative
long rains 10-20% higherlong rains similar (+/-10%)long rains 10-20% lowerlong rains 10-20% higherlong rains similar (+/-10%)long rains 10-20% lowerlong rains 10-20% higherlong rains 10-20% lowerlong rains 20-30% higherlong rains 20-30% lower
+• =4— =
-+ =— * r
=•+ =
*- =XX =
XX. =
m =
111111
AEZAEZAEZAEZAEZAEZ
BeltBeltBeltBeltBeltBelt
warmer,warmer,warmer,cooler,cooler,cooler,
AEZ Belt the same,AEZ Belt the same,221<
AEZAEZ
BeltsBelts
one. rains
warmer,cooler,
30-50% h
21.1 Kariti (Muranga District)21.2 Makuyu (Muranga District)22.1 Muirungi (Nyeri District)(23.2) Mwea-Tebere (Kirinyaga District)24.2 Gachoka (Embu District)
Areas not represented
= not represented by soils and/or climate
For further explanation see Table 21.0.5

MAP 21.0.6 AGRO-ECOLOGICAL UNITS REPRESENTED BY TRIAL SITES
IN MURANG'A DISTRICT
37° E
• Site of first priority21.1 Kareti21.2 Makuyu
agro-ecological units boundary
For EXPLANATION see PREVIOUS PAGE
and TABLE 21.0.5
22 1 b
ABERDARNATIONAL/PARK*
22.1
22 1 b
0',30"
THIKA
SOURCE
El Exploratory Soil Map of Kenya,1980(sca±e 1 :1,000,000)
KEYLB1 soil mapping code
— soil boundary
O# towns and major villages
•-= tarmac road
:===: other all-weather roads
— district boundary
national park boundary
— - - river
., boundary of Forest Reserve
For LEGEND See APPENDIX
F E R T I L I Z E R USE RflCOMMENDATTON P R O J E C T ( 1 9 8 7 ) Ministry of AgricultureNational Agricultural LaboratoriesGerman Agricultural Team
10 15 20 25 Km

District: Murang'a General Aspects 21.0
LEGEND TO THE SOIL MAP OF MURANG'A DISTRICT
1—Explanation of first character (physiography)
H Mountains and Major ScarpsH Hills and Minor ScarpsL Plateaus and High-Level Structural PlainsR Volcanic FootridgesF FootslopesU Uplands, Upper, Middle and Lower LevelsA Floodplains
2—Explanation of second character (lithology):
À Alluvial Sediments fron Various SourcesB Basic and Ultra-Basic Igneous Socks (basalts, nepheline phonolites; older basic tuffs included)U Undifferentiated Basement System Rocks (predominantly Gneisses)V Undifferentiated or Various Igneous Rocks
3 — S o i l descriptions
MV1 Imperfectly drained, shallow to moderately deep, dark greyish brown, very friable, acidhumic to peaty, loam to clay loam, with rock outcrops and ice in the highest partsdystric HISTOSOLS, lithic phase; with LITHOSOLS and Rock Outcrops
MV2 ' Well drained, very deep, dark reddish brown to dark brown, very friable and smeary, clayloam to clay, with a thick acid humic topsoil; in places shallow to moderately deep androckyhumic AHDOSOLS, partly lithic phase
HU1 Somewhat excessively drained, moderately deep, red, very friable, sandy clay loam to sandyclay; in places rockyferralic CAMBISOLS; with rhodic or orthic FERRALSOLS and Rock Outcrops
HUC Complex of:excessively drained to well drained, shallow, dark red to brown, friable, sandy clay loam toclay; in many places rocky, bouldery and stony and in places with an acid humic topsoildystric REGOSOLS, lithic phase; with LITHOSOLS, humic CAMBISOLS, lithic phase and RockOutcrops
LB1 Well drained, very deep, dark red, very friable claynito-rhodic FERRALSOLS
LB2 Well drained, very deep, dark reddish brown to dark brown, friable to firm, clay; in placeswith a humic topsoilverto-eutric NITISOLS; with mollic NITISOLS
LB8 Imperfectly drained, very deep, dark grey to black, firm to very firm, bouldery and stony,cracking clay; in places with a calcareous, slightly saline deeper subsoilpellic VERTISOLS, stony phase and partly saline phase
- 0.27 -

District: Murang'a General Aspects 21.0
LBC Complex of:noderately veil drained, shallow, yellowish red to dark yellowish brown, friable, gravellyclay over petroplinthite or rock (50-701)IROHSTOHE SOILS; vith LITHOSOLSand:poorly drained, deep to very deep, dark brown to very dark greyish brown, Bottled, firn tovery firn, cracking clay; in places noderately deep to very deep over petroplinthite©differentiated VERTISOLS and vertic GLEYSOLS
RBI Hell drained, extrenely deep, dark reddish brown to dark brown, friable and slightly snearyclay, vith an acid hunic topsoilando-hunic HITISOLS; vith hunic ANDOSOLS
RB2 Hell drained, extrenely deep, dusky red to dark reddish brown, friable clay, vith an acidhunic topsoilhunic NITISOLS
RB3 Hell drained, extrenely deep, dusky red to dark reddish brown, friable clay; vith inclusionsof veil drained, noderately deep, dark red to dark reddish brown, friable clay over rock,pisoferric or petroferric materialeutric NITISOLS; vith nito-chronic CAMBISOLS and chronic ACRISOLS and LDVISOLS, partlylithic, pisoferric or petroferric phase
FDC Conplex of:sonevhat excessively drained to veil drained, deep to very deep, dark red to dark yellowishbrown soils of varying consistence and texture; in places gravellyferralic ARENOSOLS; vith ferralo-chronic/orthic LUVISOLS and ACRISOLS
DD1 Hell drained, noderately deep to deep, dark red to yellowish red, friable, sandy clay loanto clay
-r- rhodic and orthic FERRALSOLS; vith ferralo-chronic/orthic/ferric ACRISOLS
AA1 Hell drained to imperfectly drained, very deep, brown to dark brown, friable, micaceous,slightly calcareous, sandy loan to clay loan; in places vith a saline-sodic deeper subsoileutric FLOVISOLS
HOTES:
1. nollic Nitisols and. chrono-luvic Phaeozens: soils are equally important2. nollic Nitisols, with, chrono-luvic Phaeozens: Hitisols are prevalent3. in places: in <30% of the area4. in nany places: in 30-501 of the area5. predominantly: in >50% of the area6. deeper subsoil: below 80 en.
- 0.28 -

District: Murang'a Trial Site 21.1: Kandara-Kareti
Contents of Chapter 21.1:
Detailed Description of the Kandara-Kareti Trial Site
Page
1. Geographical and Additional Technical Information 1.41.1 Final Position of the Trial Site 1.41.2 Sketch of the Trial Site 1.51.3 Physiography 1.71.4 Vegetation, Past and Present Land Use 1.81.5 Names and Addresses of Government Officers from the Division
and Farmers Involved in FURP Activities 1.9
2. Climate 1.102.1 Prevailing Climatic Conditions 1.10
2.1.1 Agro-Climatic Classification of the Area Represented 1.102.1.2 Relevant Meteorological Data 1.112.1.3 Crop Suitability from the Climatic Point of View 1.16
2.2 Proposal for the Monitoring of Agro-Climatic Conditions inPhase II 1.20
3. Soils 1.213.1 Survey Data 1.21
3.1.1 Brief Soil Description and General Information onthe Soil 1.21
3.1.2 Detailed Profile Description and Soil Classification 1.223.1.3 Soil Sampling 1.24
3.2 Laboratory Data 1.243.3 Evaluation of Soil Data 1.28
3.3.1 Literature References and Soil Correlation 1.283.3.2 Representativeness 1.283.3.3 Variability of Soil Properties within the Trial Site 1.293.3.4' Fertility Status of the Soil 1.29
3.3.4.1 Soil Profile and Global Fertility Rating 1.303.3.4.2 Soil Fertility Assessment of Composite Samples 1.30
3.4 Sampling Programme for Laboratory Analysis 1.323.4.1 Soil Samples 1.323.4.2 Plant Samples 1.333.4.3 Other Samples 1.33
4. Conclusions from the Analyses of Climate and Soils 1.334.1 Moisture Availability 1.334.2 Nutrient Availability in Relation to Possible Fertilizer
Requirement 1.344.3 Other Relevant Land Qualities 1.35
5. Trial Design and Execution Plan 1.36
-1.1 -

District: Murang'a Trial Site 21.1: Kandara-Kareti
List of Tables l)
Page
Table 21.1.1 Physiography of the Kandara-Kareti Trial Site 1.7
Table 21.1.2 .Vegetation, Past and Present Land Use 1.8
Table 21.1.3 Names and Addresses of the Divisional Staff Members and
Farmers of the Kandara-Kareti Trial Site 1.9
Table 21.1.4a Data óf the Nearest Long-Term Rainfall Station 1.12
Table 21.1.4b Data of the Nearest Long-Term Rainfall Station 1.13
Table 21.1.5 Temperature 1.14
Table 21.1.6 Potential Evaporation (Eo) 1.14
Table 21.1.7 Agro-Climatological Crop List for Kandara-Kareti 1.16
Table 21.1.8 Crop Development Stages and Crop Coefficients 1.18
Table 21.1.9 Detailed Profile Description of the Kandara-Kareti
Trial Plot 1.23
Table 21.1.10 Analytical Results (physical and chemical analyses) 1.25
Table 21.1.11 Analytical Results (chemical analyses, trial plot) 1.26
Table 21.1.12 Analytical Results (chemical analyses,farmers' (No Samplesfields) Taken)
Table 21.1.13 Soil Correlation with Respect to the Kandara-KaretiTrial Site 1.28
Table 21.1.14 Evaluation of Mehlich Analysis Data According to NALStandards 1.32
1) See Footnote next page.
- 1.2 -

District: Murang'a Trial Site 21.1: Kandara-Kareti
List of Figures x)
Page
Figure 21.1.1 Demarcation of the Kandara-Kareti Trial Site 1.4
Figure 21.1.2 Access Map of the Kandara-Kareti Trial Site 1.5
Figure 21.1.3 Map of the Kandara-Kareti Trial Plot 1.6
Figure 21.1.4 Location of Farmers' Fields for On-Farm Trials,
Kandara-Kareti 1.7
Figure 21.1.5 Rainfall and Potential Evaporation 1.15
Figure 21.1.6 Water Requirement and Availability for Maize H 511,
First Rains 1.19Figure 21.1.7 Location of Composite Sampling Blocks and Profile Pit
at the Kandara-Kareti Trial Plot 1.24
1) Numbering mode of Tables and Figures:First Number: District NumberSecond Number: Trial Site NumberThird Number: Number of Table or Figure within Chapter.
- 1.3 -

District: Murang'a Trial Site 21.1: Kandara-Kareti
1. Geographical and Additional Technical Information
1.1 Final Position of the Trial Site
The position of the site at Kandara-Kareti is shown in Figure 21.1.1, ex-tracted from Map No. 135/3 - Makuyu. Its UTM grid coordinates are E 79.7and N 04.2. The elevation is 1640 m. Further details on the final positionare shown in Figure 21.1.2 and the sketch map of the trial plot in Figure21.1.3.
»9Q7
9904
«03
"02
Figure 21.1.1: Demarcation of the Kandara-Kareti Trial Site on the 1:50,000Topographic Map
- 1.4 -

District: Murang'a Trial Site 21.1: Kandara-Kareti
1.2 Sketch of the Trial Site.
The location of and the access route to the Kandara -Kare ti site are shownin Figure 21.1.2 and the map of the trial plot in Figure 21.1.3.
Machengecha
v Ngurueini
3Km
Figure 21.1.2: Access Map of the Trial Site, Kandara-Kareti
- 1.5 -

District: Murang'a Trial Site 21.1: Kandara-Kareti
Coffee
Plantation
FURP pins. _j. + .,_ +
Cultivation edge
Tree, 4 * * 4
10 20 30 40 50m.
Figure 21.1.3: Map of the Trial Plot, Kandara-Kar'eti
- 1.6 -

District: Murang'a Trial Site 21.1: Kandara-Kareti
The approximate location of the on-farm trials is indicated in Figure21.1.4.
Since the selection of farmers' fields has not yet been finalized,Figure 21.1.4 has not been drawn.
Figure 21.1.4: Location of Farmers' Fields for On-Farm Trials, Kandara-Kareti
1.3 Physiography
Information on the physiography of the trial site and its surroundings issummarized in Table 21.1.1 below.
Table 21.1.1: Physiography of the Kandara-Kareti Trial Site
Elevation
Landform
Physiographic position of
Topography of surrounding
Slope on which trial plot
Aspect
Microtopography
the site
country
is sited
1640 m.
volcanic footridges
middle and lower slope
undulating to hilly(steepest slopes 16-30%)
5-15%
S
convex-concave slopesequence
- 1.7 -

District: Murang'a Trial Site 21.1: Kandara-Kareti
1.4 Vegetation, Past and Present Land Use
Information on vegetation and on past and present land use is summarized inTable 21.1.2 below:
Table 21.1.2: Vegetation, Past and Present Land Use of the Kandara-KaretiTrial Site
Vegetation
Cropping system,
(a) cleared since:(b) crops grown:(c) fallow periods:(d) present land use:
Inputs
(a) mineral fertilizers:(b) organic manure :(c) means of land preparation:(d) means of weeding:(e) frequency of weeding:(f) other capital inputs:(g) level of know-how:
Produce
(a) maize
Livestock
Undifferentiated clearingsand cultivations fromlower moist intermediateforests
more than 20 yearsmaize, beans, potatoesnonemaize (2 crops a year)H 511, H 512
20:20:0 or DAPnot appliedmanualmanualtwice per crop standdipterex (stalk borer)moderate
12 bags/acre(90 kg bags)
none
Remarks
- 1.8 -

District: Murang'a Trial Site 21.1: Kandara-Kareti
1.5 Names and Addresses of Government Officers Involved in FURPActivities
Names and addresses of the divisional staff members and of all farmersinvolved are given in Table 21.1.3.
The codes used for the additional "on-farm" farmers refer to the locationof their farms as indicated in Figure 21.1.4.
Table 21.1.3: Names and Addresses of Divisional Staff Members and ofFarmers at the Kandara-Kareti Trial Site
DivisionalStaff
D.E.O.L.E.O.T.A.
Farmers
Trial plot(HeadmasterKareti Sec.School)
On-Farm trials
21.1.A21.1.B21.1.C21.1.D21.1.E21.1.F21.1.G21.1.H
Name
Bernard Ondanyinot metKimani Wanyururu
Name
P.N. Njoroge
LOCATION:SUB-LOCATION:
Name
P. Muiruri MurathaKenyoho Primary Sch.Kinyanjui KiguruNjoroge KiraguMûrio WongwariMwangi K. MuthukuJulia MukuhiChege Kigotho
Address
Box 1 - Kandara
Kareti Sec. School
Address
Box - Thika
GaichanjiruKagumo-ini
Remarks
KihekoIt
Kagundu-ini
KaretiKaruhiuMacegechaKareti
Period of site selection: August 1986.
- 1.9 -

District: Murang'a Trial Site 21.1: Kandara-Kareti
2. Climate
2.1 Prevailing Climatic Conditions
2.1.1 Agro-Climatic Classification of the Area Represented by theKandara-Kareti Trial Site
The following brief climatic description refers to existing information:
ACZ : 114 (H.M.H. BRAUN, 1982)1)
AEZ : UM 2, m/1 i m/s (R. JÄTZOLD, 1983)2)
Next long-term rainfall station: 09036220, Thika, Kajuga Farm.
Agro-Climatic Zone (ACZ):
Moisture availability Zone II (r/Eo): annual average precipitation is >65-80% of the potential evaporation (Eo).
Temperature Zone 4: mean annual temperature is 18-20°C
Agro-Ecological Zone (AEZ):
UM 2 = Main Coffee Zone
UM = Upper Midland Zone: mean annual temperature is 18-21°C, meanminimum 11-14°C
2 = sub-humid; annual average precipitation is >65-80% of the potent-ial evaporation (Eo)
Sub-zone according to growing periods for annual crops (calculated for a"normal" crop in 60% probability)
m/1 i m/s = with a medium to long cropping season, intermediate rains,and a medium to short cropping season.
1) According to H.M.H. BRAUN in: W.G. SOMBROEK, et al. (1982):Exploratory Soil Map and Agro-Climatic Zone Map of Kenya, scale1:1,000,000 - Rep. El, Nairobi
2) According to R. JÄTZOLD and H. SCHMIDT, eds. (1983): FarmManagement Handbook of Kenya, Vol. II/B CENTRAL KENYA - Nairobiand Trier.
- 1.10 -
District: Murang'a Trial Site 21.1: Kandara-Kareti
Formula Cropping season Lengths of growing period(exceeded in 6 out of 10 years)
m/1 medium to long 155 - 174 daysm/s medium to short 115 - 134 days
i = intermediate rains (at least 5 decades more than 0.2 Eo); whichmeans moisture conditions are above wilting point for most crops.
2.1.2 Relevant Meteorological Data for the Kandara-Kareti Trial Site
In this Section a breakdown is given of the following climatic parameters:rainfall, potential evaporation and temperature.
Rainfall :
Rainfall data are obtained from the long-term rainfall recording stations:09036052, Githumu Secondary School (elevation: 2130 m), 10 km NW, and09037005, Gethumbwini Estate (elevation: 1520 m), located 10 km SE of theKandara-Kareti Trial Site (elevation: 1640 m ) . The data are listed inTables 21.1.4a and 21.1.4b. Data from the nearest suitable long-termrainfall station: 09036220, Thika Kajuga Farm, could not be made available,since the final selection of the Kandara-Kareti Site was not carried out intime to allow for the processing of data. At the trial site, rainfallamounts are lower than at Githumu and higher than at Gethumbwini. In 20 outof 30 years the precipitation at Kandara-Kareti is more than 620 mm duringthe agro-humid period of the first rains (see Map 21.0.1), and more than360 mm during the second rains (see Map 21.0.2). The methods of rainfalldata analysis are described in Chapter IV.2.2 of the main report.
Temperature and potential evaporation(Eo):
Temperature data are extrapolated from the Jacaranda Coffee ResearchMeteorological Station (elevation: 1610 m), 25 km NE of the trial site. Thetemperature gradient in this area is on average 0.6°C per 100 m. Potentialevaporation (Eo) is calculated using the PENMAN formula, modified by MCCULLOCH (1965). The input parameters employed - windrun, sunshine hours andrelative humidity - are obtained from 09136084, Jacaranda Coffee ResearchMeteorological Station.
Temperature and evaporation data for the Kandara-Kareti Trial Site aregiven in Tables 21.1.5 and 21.1.6, and the rainfall pattern and potentialevaporation are shown in Figure 21.1.5.
For more detailed information on the methodology of climatic descriptionsee Chapter IV.2.2 of the main report.
- 1.11 -

Table 21.1.4a : Data of the Nearest Long-Term Rainfall Station
Station No.: 09036052Githumu Sec. School.Elevation: 1550 m
Total years for calculation: 18First year included: 1955Last year included: 1985
Average annual rainfall: 1798 mm
Rainfall surpassed in 20 out of 30 years (-66% Probability):
1st rains: 850 mm(beg. of Mar. - beg. of Jul.)
2nd rains: 480 mm(end of Oct. - mid Jan.)
Decadesand
Month
1 JAN234 FEB567 MAR8910 APR1 11213 MAY141516 JUN171819 JUL202122 AUG232425 SEP262728 OCT293031 NOV323334 DEC3536
ArithmeticMean(mm)
14.516.440. 134.519.427.214.260.363.7
110.1137.7146.0136.8119.260. 420.717.629.722. 22 1 . 41 2 . 915.021 .613.810.910.125.251 .344.392.889.087.570.844.046.050.6
Average Number of RainyDays with Rainfall>= 1 mm
1 .01 .02.21 . 91 .20.81 .42.54.04.56.36.56.85.94.52.62.53.32.22.92. 12.62.92.21 .81.8 •2. 12.63.04. 14.65.04.03.02.21 .7
> = 5 m m
1 .00.92.21.81 .20.81.42.54.04.56.36.46.75. 94.52.52.53.02.22.92.02.52.82.01 .71 .61 .92.63.04.04.65.04.02.92. 11 .7
-66% Probabi-lity of ex-
ceeding ... mm
2.02. 18.8
13.95.50.05.9
19.939.366.0
105.289. 195.678.238.511.58.6
13.77.38.57.47.28.26.34. 75.82.7
31 .523.058.566.249. 941 .530.729.017. 5
Yearsanal-ized
1717171616161717171717171818181818181717171 7171716161614141 41616161 11 11 1
- 1.12 -

Table 21.1.4b : Data of the Nearest Long-Term Rainfall Station
Station No.: 09037005Thika, Gethumbuini Est.Elevation: 1500 m
Total years for calculation: 56First year included: 1926Last year included: 1985
Average annual rainfall: 1016 mm
Rainfall surpassed in 20 out of 30 years (^66% Probability):
1st rains: 460 mm(beg. of Mar. - beg.of Jul.)
2nd rains: 270 mm(end of Oct. - mid Jan.)
Decadesand
Month
1 JAN234 FEB567 MAR8910 APR111213 MAY141516 JUN171819 JUL202122 AUG232425 SEP262728 OCT293031 NOV323334 DEC3536
ArithmeticMean(mm)
11.110.712.514.813.017.529.928.453.359.892.093.866.551 .528.616.210.18.75.36.27.56.37.96.17.84.9
11.08.3
23.951 .953.660.449.739.824. 122.5
Average Number of RainyDays with Rainfall>= 1 mm
1 .11 .11 .01.11 .31 .42.22. 14.04.75.95.44.84.02.61 .91 .51 .91 .21 .51 .51 .51 .71 .81 .41 .01 .41 .42.34.44.65.45.03.82.62.0
> = 5 mm
1 .11 .11 .01 .11 .21 .32.22.03.94.55.85.34.83.92.61 .81 .41 .81 . 11 .51 .41 .41 .61 .51 .30.91 .41 .42.24.34.55.24.83.72.51 .9
=66% Probabi-lity of ex-
ceeding . . .mm
2.62.63.52.83.54.0
12.111.333.940.563. 164.439.928.511.26.33.64.40.02.22.01 .8-3.82.71 .90.03.52.5
11.231 .636.042.031 .621 .712.58.0
Yearsanal-ized
535353545454545454545454525252535353545454535353555555565656555555555555
- 1 . 1.3 -

District: Murang'a Trial Site 21.1: Kandara-Kareti
Table 21.1.5:
MeanMeanMean
MeanMeanMean
temp.max.temp.min.temp.
temp.max.temp.min.temp.
Temperature (c
JAN.
19.025.912.1
JUL.
16.522.111.0
FEB.
19.727.412.1
AUG.
16.822.311.4
annual mean: 18.6 mean max.
O
MAR.
20.126.913.4
SEPT.
18.124.611.6
: 24.6
APR.
19.825.114.6
OCT.
19.425.813.1
mean
MAY
19.023.914.1
NOV.
18.924.013.8
min. :
JUN.
17.422.912.0
DEC.
18.524.112.9
12.7
Table 21.1.6: Potential Evaporation
1st decade2nd decade3rd decadeTotal :
1st decade2nd decade3rd decadeTotal :
average annual
JAN.
4646J51143
JUL.
28283187
FEB.
525241145
AUG.
31313496
MAR.
505055155
SEPT.
40404_0_120
(Eo) in
APR.
414141123
OCT.
4545Jtl139
potential evaporation: 1450
mm per
MAY
353538108
NOV.
3939
_3J?117
mm.
Decade :
JUN.
30303090
DEC.
414145127
For all the climatic data published in this Section, a data bank has beenestablished by FURP on Personal Computers at the National AgriculturalLaboratories in Nairobi.
- 1.14 -

UI
I
200
190
180
170
160
150
140
130
120
110
100
90
80
70
60
50
40
30
20
10
0
(mm)
Eo
Rainfall Station: 09036052 Githumu Sec. School
Meteorological Station:
09136084 Ruiru, Jacaranda
66% Probability
1 2 3
JAN4 5 6 8 9 10 11 12 13 14 15 16 17 18 19 20 21 22 23 24 25 26 27 28 29 30 31 32 33
FEB MAR APR MAY JUN JUL AUG SEP OCT NOV34 35 36
DEC
Figure 12.1.5: Rainfall and Potential Evaporation

District: Murang'a Trial Site 21.1: Kandara-Kareti
2.1.3 Crop Suitability from the Climatic Point of View
A summary of the agro-climatic suitability of the most important seasonalcrops is given in Table 21.1.7 below. Additional information on othercrops, considered suitable from the agro-climatic viewpoint is given in theFarm Management Handbook, Vol. II/B, Central Kenya * ) .
Table 21.1.7: Agro-Climatological Crop List for Kandara-Kareti
Crop/variety(or place ofbreeding)e = earlym = medium1 - late
Sunflowers/HS 301 A
Maize/m.mat.like H 511
Beans/e.mat.like GLP 92=Mwitemania
Beans/e.matlike GLP 2=Rosecoco
Potatoes/m.mat.
Av.No.ofdays tophysiol.maturity
120-135
130-160
90-110
80-100
140-170
Altitudes2)accordingto growingperiod
(m.)
0 - 1800
1000-1700
700-1800
700-1800
1800-2900
Requirem.ofwell distri-buted rain-fall 3) ingrow.period
(mm. )
350-650
500-750
300-500
250-450
450-750
Yieldpotential ace.to water avai-lability 4)a — 1st rainsb = 2nd rains
a)good tovery good
a) goodb) fair
a) good
b) good
a) good
b) good
a) goodb) fair
1) R. JÄTZOLD and H. SCHMIDT, eds.(1983): Farm Management Handbook ofKenya, Vol. II/B, Central Kenya - Nairobi and Trier.
2) Most suitable altitudes; the length of the growing periodincreases with altitude; growth is also possible beyond theindicated altitude range, as long as the ecological limits havenot been reached.
3) Lower figure for fair results, higher for very good results withsome corrections due to rainfall distribution, evaporation andrun-off losses.
4) Estimated yield potential: very good >80%, good - 60-80%, fair -40-60X and poor <40% of the expected yield under optimum wateravailability adapted from R. JÄTZOLD and H. SCHMIDT, eds. (1982):Farm Management Handbook of Kenya, Vol. II/A, West Kenya.
- 1.16 -

District: Murang'a Trial Site 21.1: Kandara-Kareti
For the most important food crops in the area around the Kandara-KaretiTrial Site, the crop coefficients (kc) are shown in Table 21.1.8,differentiated according to decades (10 day periods) of the growing seasonwhich is the time between planting or sowing and the physiologicalmaturity. Furthermore, four crop development stages are distinguished inTable 21.1.8.
The crop coefficients for the climatic conditions at the Kandara-KaretiTrial Site were estimated on the basis of data obtained from DOORENBOS andPRUITT (1977)1) and DOORENBOS and KASSAM (1979)2). The data on the durationof each of the growing seasons and on the various development stages ofeach crop were assessed on the basis of local observations made underaverage climatic conditions.
The crop coefficients estimated for the various decades of the growingseasons were used to estimate the maximum (potential) evapotranspiration(ETm) under the prevailing climate, assuming that water is not a limitingfactor for plant growth. For this calculation the following approximativeformula was employed:
ETm = kc * Eo
whereby: ETm= maximum (potential) evapotranspirationkc = crop coefficientEo = potential evaporation (climatic evaporative demand)
In Figure 21.1.6, the ETm-values are used to indicate the estimated maximumwater requirements of an important food crop for optimum growth.Furthermore, the rainfall data at 66% reliability are shown in Figure21.1.6 to give an indication of the water availability. However, whenreading these figures, it must be borne in mind that the actual availabi-lity of water for the plants also depends, to a large degree, on factorssuch as the run-off, the moisture storage capacity of the soil, the deeppercolation of water etc.
The placement of the growing seasons of the various crops on the time axisas presented in Figure 21.1.6 was mainly based on the pattern of rainfall,whereby the peak water requirements of the plants should be met by high,reliable rainfall.
Detailed information on the calculation procedures and references are givenin Chapter IV.2.2 of the main report. The interpretation of the diagramsmentioned above follows in Section 4 of this Volume (Conclusions from theAnalyses of Climate and Soils).
1) FAO (1977): Crop Water Requirements - (= Irrigation and DrainagePaper, 24), Rome
2) FAO (1979): Yield Response to Water - (= Irrigation and DrainagePaper, 33), Rome
- 1.17 -

Table 21.I.S : Crop development stages 1) and crop coefficients (Kc) 2) for approx. naxinun (potential) crop evapotranspiration of the most importantseasonal crops grown at Kareti (site no. 21.1)
Crop/Variety
Number of decades from seeding resp. planting to (physiological) maturity1 2 3 4 5 6 7 8 9 10 11 12 13 14 15 16 17 19 20 21 22 23 24
HAIZEH511
0.6 0.7 0.8 0.83 0.89 0.96 1.02 1.05 1.05 1.05 1.05 1.05 0.9 0.79 0.63I I I II II II II III III III III III IV IV IV
POTATOES 0.6 0.7 0.8 0.84 0.92 1.0 1.05 1.05 1.05 1.05 0.98 0.87 0.76I I I II II II III III III III IV IV IV
00
I
BEANSRose coco
0.6 0.7 0.77 0.88 0.99 1.05 1.05 1.05 1.05 0.82 0.49I I II II II III III III III IV IV
BEANSGLP 92
0.6 0.7 0.77 0.88 0.99 1.05 1.05 1.05 1.05 1.05 0.82 0.49I I II II • II III III III III III IV IV
SUNFLOWERHS 301 A
0.6 0.7 0.76 0.85 0.95 1.05 1.1 1.1 1.1 1.1 1.1 0.92 0.52I I II II II II III III III III III IV IV
1) Crop development stages as defined in chapter IV 2.2 (main report)I : initial stage II : development stage III = mid season IV : late season
2) Kc : crop coefficient as defined in chapter IV 2.2 (main report)

Figure 21.1.6: Water requirementsand availability for cropMaize H 511, first rains
Rainfall Station: 09036052Githumu Sec. School
I
mm
120i
100-
80-
60-
Trial Site 21.1 Kareti
40-
20-
Decade 8
Probability
10 11 12 13 14 15 16 17 18 19 20 21 22
MAR APR MAY JUN JUL AU G

District: Murang'a Trial Site 21.1: Kandara-Kareti
2.2 Proposal for the Monitoring of Agro-Climatic Conditions in PhaseII
For Phase II the agro-climatic recording programme should include:
1) Rainfall records :
A raingauge has to be installed at the Kandara-Kareti Trial Site to measurethe actual precipitation on the spot. Subsequently, data can be comparedwith both rainfall for a particular year and the interpolated long-termaverage from the two nearby rainfall recording stations of the Meteoro-logical Department: 09036052, Githumu Secondary School and 09037005, ThikaGethumbwini Estate.
2) Records on other relevant meteorological parameters :
Data on temperature, windrun, sunshine hours and relative humidity can beobtained from 09136084, Jacaranda Coffee Research Meteorological Station(elevation: 1610 m) in order to calculate Eo (climatic evaporative demand).
For this purpose, a computerized PENMAN formula, modified by MC CULL0CH(1965) is available on PC.
3) Phenological records :
Dates of planting or sowing of each crop, emergence, start of tasselling(for maize crop), budding (for bean crop), flowering, ripeness orphysiological maturity and harvest have to be recorded. Additionally, theleaf area index (LAI) has to be determined every week (at least for thecereal crops) in order to provide a sound basis for water balancecalculations. Other important features should also be recorded above all,rolling and wilting leaves, which indicate water stress and wilting pointrespectively before physiological maturity has been reached.
Moreover, soil moisture checks and observations on rooting depth at theabove-mentioned growing stages and run-off measurements would be needed toestimate the actual evapotranspiration of the various-crops correctly.
For most of the data to be recorded, official forms from the MeteorologicalDepartment are available.
Detailed information on calculation procedures, as proposed for themonitoring of agro-climatic conditions, is given in Chapter IV.2.2 of themain report.
- 1.20 -

District: Murang'a Trial Site 21.1: Kandara-Kareti
3. Soils
In this Section, survey and laboratory data concerning the trial site and,more specifically, the soil profile are given.The evaluation of these data is shown in Sub-Section 3.3.
3.1 Survey Data
3.1.1 Brief Soil Description and General Information on the Soil
The brief description of the soils of the trial plot is followed by arating of relevant soil-related land factors. The classes for these factorshave been adapted from Andriesse and van der Pouw (1985), and a key forthem is to be found in Chapter IV.2.3 of the main report.
Brief soil description
The soils are extremely deep, dark reddish brown in colour, and consist offriable clay, with an acid humic topsoil. Prevailing soil structure is weakto moderate, sub-angular to angular blocky, and bioporosity is very highthroughout the profile.
Rating of soil-related land factors
- Parent rock
- Drainage
- Effective soil depth
- Inherent fertility
- Topsoil properties
1 rich:basic igneous rocks
2 moderately rich3 poor
1 (somewhat) excessively drained2 well drained3 moderately well drained4 imperfectly drained5 (very) poorly drained
1 extremely deep2 very deep3 deep4 moderately deep5 shallow6 very shallow
1 high2 moderate3 poor4 very poor
0 non-humic1 humic2 thick humicla acid humic2a thick acid humic
- 1.21 -

District: Murang'a Trial Site 21.1: Kandara-Kareti
- Salinity
- Södicity
0 non-saline1 slightly saline2 saline
0 non-sodic1 slightly sodic2 sodic
- Stoniness
- Rockiness
- Consistency (moist)
- Moisture storage capacity
0 non-stony1 slightly stony2 stony3 very stony
0 non-rocky1 slightly rocky2 rocky3 very rocky
1 half-ripe2 loose3 very friable4 friable5 firm6 very firm
1 very high2 high3 moderate4 low
- Excess surface water 0 none1 occasional2 seasonal3 permanent
3.1.2 Detailed Profile Description and Soil Classification
Detailed information on the various soil properties as they occur in thedifferent horizons is given in Table 21.1.9.The location of the profile near the trial plot is shown in Figure 21.1.7.
The soil profile is classified according to two systems, which areexplained in Chapter II.2.2 of the main report.
1. Legend to the Soil Map of the World (FAO-Unesco, 1974), with adjustmentsaccording to the Kenya Concept (Siderius and van der Pouw, 1980): humicNitisol.
2. USDA Soil Taxonomy (Soil Survey Staff, 1975): typic Palehumult. veryfine-clavev family.
- 1.22 -

Table 21.1.9: Detailed Profile Description of the Kareti Trial Plot
CO
I
[Profile nuaber:jDate of examination:Authors:
! Saiplej No.
1 21.1.1
1 21.1.2
1 21.1.3
1} 21.1.4
11 21.1.5
111 21.1.6
21.110-10-1986Sialing/Doelger
H o r i z o n
Genetic j Depth | Boundary
Ahl
Ah2
AB
Btl
6t2
Ahl(controlsaaple)
0 - 2 0
20-37
37-65
65-90
90-120
clearwavy
gradualsaooth
clearsaooth
diffuse
Colour(Hoist)
5 YR 3/3dark redd,
browi
2.5 YR2.5/4
dark redd,browi
5 YR 3/4dark redd,
brow
5YR3/4dark redd,
browi
5YR3/4dark redd,
brow
Mottling
...
...
Texture
clay
clay
clay
clay
clay
Cutans
—
—
patchythinclay
brokenaoderately
thickclay
brokenthickclay
Structure
weakfine
subangularblocky
•oderateaediua
subangularblocky
weakaediua
subangularblocky
weakKdiuiangularblocky
•oderateaediuaangularblocky
Biopores
•any v.f.•any f.•any i.•any c.
•any v.f.•any f.•any i.coaaon c.
•any v.f.•any f.•any a.•any c.
•any v.f.•any f.•any s.coaaon c.
•any v.f.•any f.•any a.coMon c.
Consistence
hard;friable;sl.sticky-sl.plastic
hard;fir«;sticky-plastic
sl.hard;friable;sticky-plastic
sl.hard;friable;si.sticky-si.plastic
sl.hard;friable;si.sticky-si.plastic
fj5 w
n.d.
n.d.
n.d.
n.d.
n.d.
Concretions
...
...
ft,few, soft,stall,rounded
ft,fen, softSMll,roundedft,
fen, soft,small,rounded
Other !Features
I
11I
cotpactiondue totractorploughing
1
11
Reaarks: Colour: dark redd. : dark reddishBiopores: v.f. - very fine; f : fine; • : aediua; c : coarseConsistence: si.: slightlyField pH: n.d. = not determined

District: Murang'a Trial Site 21.1: Kandara-Kareti
3.1.3 Soil Sampling
Soil samples (profile, composite, farmers' fields, pF rings) are listed inSub-Section 3.2.Figure 21.1.7 shows the location of the composite sampling Blocks (I to IV)as well as the location of the profile pit.
r
o3
•z
srDfD
>
50 m
Q.reeI
I I
I I I
IV
65m
35m
55m
* p i
i/
//
111
1
F/it
Figure 21.1.7: Location of Composite Sampling Blocks and Profile Pit at theKandara-Kareti Trial Plot
3.2 Laboratory Data
The soil samples from the profile and the composite samples from thevarious blocks of the main trial site and from the farmers' fields wereanalyzed in the laboratory. The results are compiled in Tables 21.1.10 to21.1.12. The methodology applied for obtaining these results is describedin detail in Chapter IV.2 of the main report.
-1.24 -

District: Kuranga Trial Site: 21.1 Kandara-Kareti
Table 21.1.10 : Analytical Results (physical and chenical analysis, results on air dry soil basis)Profile Samples fron Trial Site
12345a6
7
Horizon
AhiAh2ABBtiBt2
Ahi
Depthen.
0-2020-3737-«65-9090-120
0-20
FieldNo.
21.1.121.1.221.1.321.1.421.1.5
21.1.6
Lab. ) 2 n.No. X
8767/868768876987708771
8772
SandI
9111399
13
SiltX
1824261816
16
ClayX
7365617375
71
TextureClass
CCCCC
c
pHKC1
4.95.05.35.45.5
5.2
PHH2O
5.35.45.86.05.8
5.4
Diff.PH
0.40.40.50.60.3
0.2
Cond.H20
0.120.100.110.120.14
0.10
Saturation ExtractX water pH El.Cond.
Na K Kg Cane./IOOgn. A g T U —
Hn ECK BasesX
Al AIX ne.
H+AlKC1
1 NA2 NA3 NA4 NA5 NA67 NA
NANANANANA
NA
NANANANANA
NA
0.06 0.29 2.45 5.80 1.60 15.7b 54.78 0.890.08 0.38 2.75 9.00 1.82 13.00 93.92 0.77
0.140.100.100.100.08
0.340.200.220.220.22
0.10 0.24
12365D78
Na
0.140.140.400.120.17
0.13
KR
0.490.350.350.390.15
0.60
Ng5./100gn.
2.402.561.952.802.40
2.48
Moisture Retention Capacity
1234
Horizon
AhiAh2/AB
DepthCD.
15-2035-40
CaAcetati
4.353.954.693.222.88
4.14
Vol.Xbar 0pFO
56.656.9
CEC pH8.2
21.8019.0019.5023.3024.50
22.30
Moisture1/10
2
40.139.7
BasesX
33.8536.8437.9028.0322.86
32.96
1/32.5
38.637.3
Bases+Alne./100gi.
7.527.107.496.635.68
7.45
53.7
31.334.8
AlX
1.861.411.341.511.41
1.34
154.2
29.833.6
Org. CX
2.282.041.971.261.18
2.17
NX
0.190.170.140.120.09
0.19
C/N POliPI
12.012.014.110.513.1
11.4
Avail. MoistureCapacitynt./10cn.
10.36.1
105 deg.Csen in rel.to». air dry
0.940.930.930.930.93
0.94
Bulk Densgn./cc.105 deg.C
1.081.01
NA : not applicablene./IOOgi. : lilliequivalents per 100 gi. of soilAgTU : Silver Thio Urea ExtractionAcetate : Bases by Annniun Acetate pH 7, CEC by Sodiun Acetate 8.2 pHpH and conductivity in suspension 1:2.5 v/v
- 1 .25 -

District: Huranga Trial Site:21.1 Kandara-Kareti
Table 21.1.11 : Analytical Results (clwrical analysis, results on air dry soil basis)Trial Site Coqiosite Sanples
; ,
I 2! 4! 5! 6! 7! 8: 9! to! il! 121 i«
! 14! 15! 16! 17! 18: 19! 20! 21! 22! 23! 24! 25! 26
! 28! 29! 30! 31! 32! 33! 34! 35! 36! 37! 381 «a
! 40: 4i: 42: 43! 44! 45! 46! 47! 48! 49
; so: si! 52! 53! 54! 55! 56! 571 KO, 08
Depth
Lab. No. /86
Fine earth X
Vol.might gn./cc.
105 deg.C /air dry
PHH20 1/1
pH H20 1/2.5
pH N KCI 1/2.5
Corg. X
N tot. X
C/N
Nod.Olsen Abs. 260m(1/1000)
S04 soluble ppi.
P Heh.1/5 ppr.
P Olsen pp.
P nd.Olsen pp.
P Citric ac. ppr.
ECEC AgTU M./lOOp.Bases XAIX
Hp BaC12 n./IOOgn.
Ht Al KCI n./IOOp
Al 3- KCI K./lOOgB.
AI 3- AgTU ne./100gn
Sat.Ext. X H20
Sat.Ext. El.Cond.
Sat.Ext. pH
en.
2050
205020502050
205020502050
205020502050
2050
2050
2050205020502050
202020
20502050205020
205020502050
BJock nutterI II
8773 87758774 8776
100 100100 1001.01 1.040.99 1.000.94 0.940.94 0.93
5.7 5.86.1 6.25.5 5.65.4 5.34.6 4.74.4 4.4
2.22 2.031.36 1.160.28 0.260.18 0.08
8 88 15
7 117 3
4.008.0013.30 16.508.00 6.80
14.80 15.3070.54 70.20
NA NA
not applicablenot applicablenot applicablenot applicablenot applicablenot applicablenot applicable
not applicablenot applicablenot applicablenot applicablenot applicablenot applicable
III
87778778
1001001.040.990.930.93
5.65.95.65.34.84.4
2.011.380.180.141110
7Trace
16.405.30
IV V
87798780
1001001.040.980.930.93
5.65.65.75.44.74.3
2.081.590.260.10
816
113
13.305.40
VI VIIx
1001001.030.990.940.93
5.685.955.605.354.704.38
2.091.370.250.138.7311.95
9.003.25
14.886.38
S
0.000.000.020.010.010.00
0.100.260.080.060.080.05
0.090.180.040.041.633.91
2.312.87
1.821.28
Hax. !diff. !
0.00 !0.00 !0.03 !0.02 !0.01 !0.01 :
0.200.60 !0.200.100.200.10 !
0.21 ;0.43 !0.10 !0.10!3.36 !8.34
4.007.00
3.202.70

District: Kuranga Trial Site:21.1 Kandara-Kareti
Table 21.1.11 : Analytical Results (chwical analysis, results on air dry soil basis)Trial Site Conosite Sanies
; !! 2
! 59! 60! 61! 62! 63! 64! 65I 66! 671 CÛ1 Do
; 69! 70! 71! 72! 73! 74! 75! 76! 77! 78! 791 AAI flu
! 81! 82! 83! 84! 85! 86! 871 88I 89! 90! 91! 92! 93! 94! 95! 96! 97! 98! 99: looMm1 lUI1102|103!1O4
nos
Depth
Lab. No. /86
Na Heh.1/5 ne./IOOgn
Na Ag-TU ne./IOOgn.
K Ken. 1/5 ne./IOOgn.
K nd.OI. ne./IOOgn.
K Ag-TU ne./IOOgn.
Hg Heh.t/5 ne./IOOgn
Hg nod.Ol. ne./IOOgn
Hg Ag-TU ne./IOOgn.
CaKeh. 1/5 ne./IOOgn
Ca md.Ol. ne./IOOgn
Ca Ag-TU re./IOOgn.
KnKeh. 1/5 ne./IOOgn
Hn nd.OI. ne./IOOgn
Hn Ag-TU n./IOOp.
Zn HC1 ppn.
Zn nd. 01. ppn.
Cu HC1 ppn.
Cu nd. 01. ppn.
FeHCl ppn.
Fe nd. 01. ppn.
FeOxalate S
Al Oxalate 1
en.
2050
205020
2050205020
2050205020
2050205020
2050205020
20502050
20502050
20502050
20502050
Block nunberI
8773«8774
0.070.210.08
0.250.110.580.130.76
1.201.702.843.442.60
2.801.5010.006.707.00
0.610.410.650.321.38
22.8011.1524.8011.50
7.807.7527.4018.70
a91010087
0.600.671.001.00
II
87758776
0.070.110.08
0.110.070.230.180.36
1.201.802.003.422.70
2.803.7010.0011.607.60
0.530.430.460.421.24
21.8021.30
27.0024.90
10995
III
87778778
0.070.11
0.070.070.130.08
1.701.702.623.05
2.803.709.907.20
0.50.0.770.510.64
22.7018.60
24.3022.30
104136
IV V VI
87798780
0.070.07
0.070.030.080.10
1.301.202.382.75
2.301.907.607.20
0.650.530.600.56
18.8010.00
21.7025.00
109107
VII
•
X
0.070.13
0.130.070.260.12
1.351.602.463.17
2.682.709.388.18
0.570.540.560.49
22.0315.35
26.1022.73
105.50106.25
S
0.050.06
0.090.030.230.04
0.240.270.360.33
0.251.171.182.30
0.070.170.090.14
2.495.46
2.652.96
4.3621.47
Hax. !diff. !
0.000.14 !
0.180.08 ,0.50 !0.10
0.500.60 !0.840.69
0.502.20!2.40 I4.90
0.150.36 !0.19 !0.32
6.0011.30 !
5.706.30 !
9.0049.00 !
NA : not applicablene./IOOgn. : nilliequivalents per 100 gn. of soilHen. : Kehl ich Analysisnd. 01. : Modified Olsen ExtractionAgTU : Silver Thio Urea Extraction
- 1.27 -

District: Murang'a Trial Site 21.1: Kandara-Kareti
3.3 Evaluation of Soil Data
3.3.1 Literature References and Soil Correlation
Since 1972 the Kenya Soil Survey has carried out many soil surveys and siteevaluations and, in addition, some surveys were conducted by otheragencies.
A complete list of soil survey reports is given in Chapter II.2 (mainreport). A report referring to the area in which the trial site issituated is listed below.
Literature references:
ElW.G. Sombroek, H.M.H. Braun and B.J.A. van der Pouw(1982). Exploratory Soil Map and Agro-Climatic ZoneMap of Kenya, 1980, scale 1:1,000,000.
In order to correlate existing information with findings at the trial site,the map units and classification units in the above-mentioned reports havebeen grouped in Table 21.1.13. Moreover, the FURP soil map unit (Map21.0.4) and the classification of the soil of the profile at the trial plotare given.
Table 21.1.13: Soil Correlation with Respect to the Kandara-KaretiTrial Site
Reference
El
FURP
Map unit
R2
RB2
Trial plot profile
Soil Classification
humic Nitisols
humic Nitisols
humic NITISOL
The only source for the area around Kareti is El. It indicates humicNitisols for this area, which was confirmed at the trial site.
3.3.2 Representativeness
For two reasons, statements about the representativeness of the soils ofthe trial site should be made with care.
Firstly, soil classification units are mainly based on properties of arelatively permanent nature, i.e. those of the sub-surface horizons and notthose of the topsoil.Secondly, the generally high variability of topsoil properties within shortdistances is not reflected in relatively small- scale reconnaissance soilmaps (1:100,000 to 1:1,000,000).
- 1.28 -

District: Murang'a Trial Site 21.1: Kandara-Kareti
In this report, soils of a map unit considered to be within the "area ofrepresentativeness" must meet the following requirements:
(a) the soil-related land factors must have the same or similarratings ;
(b) soil classification must be the same or similar.
The extent to which all FURP trial sites are representative of the soils ofMurang'a District is shown in Map 21.Q.5: "Groupings of Soil Mapping UnitsRepresented by Trial Sites in Murang'a District". This map is discussed inSub-Section 21.0.5.Distinction is made between high representativeness - code A - and moderaterepresentativeness - code B if soil conditions are slightly morefavourable than at the trial site and code B- if soil conditions areslightly less favourable than at the trial site. Code C is applied for theremaining parts of the District, where none of the FURP trial sites arerepresentative.
Within Murang'a District, the Kandara-Kareti Trial Site has high represen-tativeness (Grouping 21.1.A) for the humic Nitisols of soil map unit RB2,which includes the Kandara, Kigumo and Kangema areas.
The Kandara-Kareti Trial Site is also representative of large areas outsideMurang'a District. Only in Nyeri District, however, is Grouping 21.1.Aindicated, as Trial Sites 20.1 (Githunguri, Kiambu District), 23.1 (Keru-goya, Kirinyaga District), 24.3 (Embu A.R.S., Embu District), and 25.1(Kaguru F.T.C., Meru District) also represent soil map unit RB2 in theserespective districts.Grouping 21.1.A covers a large part of Central Nyeri District. It includesKaratina, Nyeri and Mweiga areas.
3.3.3 Variability of Soil Properties within the Trial Site
The trial plot is situated on an irregular slope, convex and sloping in theupper part and concave to straight and very gentle in the lower part.
The analytical data, however, showed a narrow range for pH and organiccarbon content of the topsoils of the different composite blocks.
pH-KCl: profile: 5.1composite blocks: 4.6 - 4.8
organic carbon content: profile: 2.1%composite blocks: 2.0 - 2.2%
A comprehensive breakdown of soil analytical data is given in Tables21.1.10 to 21.1.12.
3.3.4 Fertility Status of the Soil
The criteria applied for the interpretation of the analytical data areoutlined in Chapter IV.2 of the main report.
- 1.29 -

District: Nurang'a Trial Site 21.1: Kandara-Kareti
3.3.4.1 Soil Profile
The analytical data of the soil samples taken from the profile pit,situated on the side of the trial site between Block II and the road (seeFigure 21.1.7), are presented in Table 21.1.10 and are interpreted in thefollowing paragraphs.
There is no presence of physical obstacles or extreme acidity in thesubsoil which would limit the rooting depth of the soil. The capacity forplant available moisture in the upper 100 cm. of the profile may be roughlyestimated from the pF analysis carried out for the Ahl horizon and thetransition Ah2/AB: the figure is just below 80 mm. As plant roots mayexploit a considerably deeper soil volume down to below 180 cm., thisestimate is not apt to ratify the effective moisture storage capacity. Theincrease in micro-pores from the Ahl to the Ah2/AB reflects the reportedcompaction of the soil through tractor ploughing. The low availablemoisture capacity of the topsoil (10 mm. per 10 cm. depth) is furtherreduced (6.1 mm. per 10 cm. depth) in the compact horizons.
The entire profile down to a depth of 120 cm. (maximum sampling depth) hasa moderate CEC (pH 8.2) of 18 to 24 me./100 gm., decreasing somewhat fromthe Ahl to the Ah2, and increasing again with depth. The CEC appearsclosely related to the clay content with exceptionally little influencefrom the organic matter. The indicated base saturation is moderate down to90 cm. and is low in the Bt2 horizon.
With reference to the moderate CEC, exchangeable K is medium in the upper90 cm. (Ah to Btl, 0.49 - 0.35 me./100 gm.) and decreases suddenly belowthe Btl to the low value of 0.15 me./100 gm. Mg is very high throughout(>2 me./100 gm.), showing a distinct minimum in the AB horizon. Ca is lowin comparison to the other bases and in the low range (<5 me./100 gm.). Theparticularly low Ca by Ammonium-Acetate is neither confirmed by the Cavalue obtained from the Silver-Thiourea extraction nor by the data from thetrial site composite samples. Exchangeable bases are well balanced withrespect to plant nutrition.
The soil reaction increases with depth and is in the slightly acid range(pH KC1 5 - 5.5). The trial site composite samples show pH values ofapproximately 0.5 units lower (moderately acid), which appear morereasonable for the profile also. At this pH only negligible amounts of Alare exchangeable or soluble.
The organic matter content of the three upper horizons down to a depth of65 cm. is high (>2 % C) and decreases rather slowly with depth. The Bt2below 90 cm. shows a medium humus" content of 1.2 % C. The N content of thesoil covers the medium range and N decreases from 0.19 % in the Ahl to 0.09% in the Bt2. The C/N ratios appear wide.
3.3.4.2 Soil Fertility Assessment of Composite Samples
The analytical results for the composite samples from the trial site(depths 0-20 cm. and 20-50 cm.) are presented in Table 21.1.11. No sampleswere taken from the farmers' fields selected around this trial site andconsequently Table 21.1.12 has been omitted.
- 1.30 -

District: Murang'a Trial Site 21.1: Kandara-Kareti
The composite samples were analyzed to assess the chemical fertility statusof the soil, with special emphasis on the availability of the importantnutrient elements to the plants. The "available nutrients" were estimatedby means of two complementary methods, the "Mehlich" diluted double-acidmethod (NAL routine) and a "modified Olsen" bicarbonate + EDTA extraction.
The interpretation of the analytical data presented is in so far tentativefor both methods as the validity of the applied ratings (ranges for Low,Medium, High) has not yet been verified by field trials in the variousregions of Kenya.
The very humic soil (2 - 2.2 % C in the topsoil composite samples) containshigh amounts of total N (0.18-0.28 % N) in the topsoil and medium (0.08-0.18 X N) amounts in the subsoil. The medium C/N ratios and other pre-vailing soil factors indicate that the N availability is probably moderate.
According to the Mehlich analysis, "available" P is in the low range(<11 ppm.), the differences between the blocks being insignificant. In thesubsoils Mehlich-P is extremely low in Blocks II to IV. In contrast, themodified Olsen method shows moderate to high P values (>13 ppm. in thetopsoil). Block II in particular is very high in P. The subsoil has a lowto moderate P status.
The P availability, as indicated by the Mehlich analysis, is certainlyinadequate to the N supplying capacity of the soil. The considerably highermodified Olsen-P might be slightly low in respect to the N availability inBlocks I, III and IV. This is indicated by the ratios of C/P (m.01.) andN/P (m.01.), which are on average 1500 and 100. This is approximatelydouble the suggested level for optimum plant growth.
The K status of the soil decreases considerably down slope, from Block I toBlock IV. This change is much more pronounced in the topsoil than in thesubsoil. "Available" K as determined by the Mehlich analysis is low to verylow; in the topsoil it ranges from 0.25 me./100 gm. (Block I) to 0.07me./100 gm. (Blocks III and IV). These K values are in the same magnitude asthe reported Na levels. This decrease from Block I to IV is even morepronounced in the results obtained by the modified Olsen method: While K ishigh in Block I (0.58 me./100 gm.), it is as low as Mehlich-K in Block IV(0.08 me./100 gm.). The analytical data provide no good reason for thesechanges in K, which are not observed with any other element analyzed.
The "available" quantities of Mg are fairly constant over the entire trialsite and high to very high throughout. The subsoil shows higher Mg levelsthan the topsoil. The Ca status of the soil as indicated by both methods(Mehlich analysis and modified Olsen method) is almost uniform in thetopsoil and in the moderate to high range; the subsoil data are slightlymore erratic.
According to the Mehlich analysis, "available" Mn is well within theadequate range, the modified Olsen method shows almost identical data.
- 1.31 -

District: Murang'a Trial Site 21.1: Kandara-Kareti
According to the modified Olsen method, Zn and Cu are available in veryhigh amounts (Zn: 22 ppm., Cu: 25 ppm.) throughout. The HC1 extractable Znand Cu determined in Block I are similarly high.
The amount of Fe extracted by the modified Olsen method is high. Theoxalate extraction for amorphous oxides and hydroxides yielded only lowquantities of Fe and Al.
The trial site composite samples are moderately to strongly acid (pH KC14.6 - 4.3). The soil pH is very uniform over the entire plot—pH (KC1) 4.6 -4.8 in the topsoil and pH (KC1) 4.3 - 4.4 in the subsoil. In the moderatelyacid soils, the exchangeable acidity and especially exchangeable Al are toolow to have any meaningful adverse effects on crop production.
The evaluation of the Mehlich Analysis data according to NAL standards isgiven in Table "21.1.14.
Table 21.1.14: Evaluation of the Mehlich Analysis Data According to NALStandards
Parameter
Soil reaction (pH)Acidity (Hp)
Available nutrientsSodiumPotassiumCalciumMagnesiumManganesePhosphorus
Total NitrogenOrganic Carbon
C / N RatioCa / Mg RatioCa / K RatioK / Mg Ratio
Trial Site
Moderately acidLow
LowLowAdequateAdequateAdequateVery low
ModerateModerate
FavourableFavourableNot favourableNot favourable
Farmers' Fields
Remarks on Trial Site:Soil reaction is favourable. Positive yield responses to K, P, manure, andN applications are expected. Responses to lime applications are unlikely.
- 1.32 -

District: Murang'a Trial Site 21.1: Kandara-Kareti
3.4 Sampling Programme for Laboratory Analyses
3.4.1 Soil Samples
Soil samples will be collected once a year at the beginning of the longrains in February/March just after ploughing and before the fields areplanted. The samples will be taken individually from two depths (0 - 20 cmand 20 - 50 cm) for each replication of the selected fertilizer treatments,and only from the plots in Module 2 with maize/beans mixed cropping.
The treatments to be sampled are :
Trial I: N0:P0 N75:P75 N0:P75 N75:P0
Trial II: 0 N+P FYM FYM+P FYM+N+P ' N+P+K
3.4.2 Plant Samples
Harvest samples from the maize/beans mixed crop include individual samplesof grain and straw from maize and beans respectively. Samples will becollected separately from each replication of the treatments where soilsamples were collected, i.e.:
Trial I: N0:P0 N75:P75 N0:P75 N75:P0
Trial II: 0 N+P FYM FYM+P FYM+N+P N+P+K
3.4.3 Other Samples
From every batch of applied FYM three representative samples will be taken.
4. Conclusions from the Analyses of Climate and Soils
4.1 Moisture Availability
The amount of rainfall which is surpassed in 20 out of 30 years (i.e. 66%probability) constitutes the basis for estimating moisture availabilityduring the growing periods. Other parameters of the water balance such asmoisture storage capacity, run-off, and deep percolation also have to beconsidered in order to obtain a comprehensive picture of the moistureavailability.For example, the water requirements and the water availability for maizeH 511, first rains, at the Kandara-Kareti Trial Site, can be interpreted asfollows :
Figure 21.1.6 shows that the maximum water requirements (ETm) of themaize crop are not in line with the rainfall pattern at the 66%probability level, but on the prevailing deep soils, the surplus ofwater (peak in April/May) can be stored to a large extent. It must beborne in mind, however, that rainfall amounts at the trial site are 10-15% lower than shown in the diagram (rainfall station: 09036052, GithumuSecondary School).
- 1.33 -

District: Murang'a Trial Site 21.1: Kandara-Kareti
Run-off is considered to be high: the upper part of the trial site islocated on considerably sloping land (13-14%) and the crop does notprovide adequate ground cover at the time of maximum rainfall intensityin April and May.
Deep percolation and lateral sub-surface flow could be estimated, butcan be omitted, since they are generally very low, except during theperiod of high rainfall intensity in April/May. Since lateral sub-surface flow and run-off are mainly concentrated on the upper parts ofthe plot, the water "lost" from here flows mainly as additional water(as run-on and sub-surface flow) to the lower Block.
For the Kandara-Kareti Trial Site, the moisture storage capacity is veryhigh (i.e. >160 mm.). Therefore, the water surplus of April and May can,to a large extent, be stored and used to offset the rainfall deficitslikely to occur from June onwards.
Summarizing the evaluation of the climatic factors, the yield potentialcan, from the climatic point of view, generally be rated as good on a"20 out of 30 year" basis for the maize crop planted during the firstrains. It must, however, be stressed again, that water availabilityconditions are less favourable in the upper block than in the lower blockof the trial site.In the second rains, conditions are generally less favourable than in thefirst rains.
4.2 Nutrient Availability in Relation to Possible Fertilizer Requirement
The soil is characterized by a high humus content: probably the mineral-ization of the organic matter is slow and retarded. The natural N supplyfrom the soil is probably moderate. P availability is very low according tothe Mehlich analysis. In contrast, the modified Olsen method indicates amoderate to high P status. According to the latter method, Block II isparticularly high in P. K decreases considerably from Block I to Block IV.The Mehlich analysis indicates low to very low K in the entire trial site,whereas K by the modified Olsen method ranges from high to very low. Themoderately acid soil reaction is favourable for the growth of most crops.
Fertilizer applications should first of all involve N and P, but in thelower parts of the trial site, K is equally important.
P as TSP will probably be more efficient than SSP or rock phosphate in thefirst season. P from rock phosphate is less subject to fixation than P fromTSP, and under the moderately acid soil conditions a reasonable avail-ability of P from soft, finely ground rock phosphate may be expected. Therisks of P fixation into non-available forms are probably only low tomoderate. The efficiency of P applications may be enhanced by the additionof small amounts of fresh FYM to stimulate soil biological activity. Thistreatment can also have a positive effect on the release of N and S fromthe soil.
- 1.34 -

District: Murang'a Trial Site 21.1: Kandara-Kareti
Superphosphate contains about 12% S and therefore may act as a two-elementfertilizer. Under farmers' conditions this might be very useful whenlimited S availability is suspected.
The efficiency of mineral N applications will probably be enhanced whencombined with adequate P supply. Top dressings may prove more efficientthan broadcast applications at planting time. The N supply from the soilwill probably be sufficient to make starter N unnecessary.
High mineral N applications at planting time may lead to losses throughdenitrification, especially if high rainfall occurs and the aeration of thecompact topsoil is (even slightly) restricted. During the high rainfall inApril and May this may be expected in places with a weakly structuredtopsoil. For a more reliable estimate of the extent to which denitrifica-tion may occur, precise data on the soil air and moisture regime and itseffects on N losses are required.
K applications are probably not needed in the upper part (Block I) of thetrial site and response to K may not be obtained there. However, in thelower parts, N and P applications will have to be supplemented with K. InBlock IV response to K alone may also be obtained. The K fertilizer shouldat least replace the amounts of K removed with the harvests. The analyticaldata give no estimate of the reserves of K beyond the exchangeable pool,but its limitations are indicated by the rather low K levels found in thesubsoil.
As K fertilizer, K2S04 should generally be preferred to KC1 (both contain50% K20) as the S04-ion enhances P availability. The form in which K isapplied should also take into account crop requirements (e.g. KC1 tocabbages, but not to Irish potatoes).
Under the present soil conditions liming is not needed and the acidifyingeffects of the applied mineral or organic fertilizers will be sufficientlybuffered by the soil for the duration of the trials over five years.However, soil acidity and exchangeable Al should be closely monitored. Overlonger periods of fertilizer use, the increasing soil acidity should becounterbalanced by liming. N fertilizers have particularly high limerequirements, i.e. approximately 1.8 Kg. of CaC03 per Kg. of applied N. Inthe case of CAN, which contains Ca, only about 0.8 Kg. CaCO3 per Kg. N or0.2 Kg. lime per Kg. of CAN will be needed. TSP does not contribute sub-stantially to the Ca budget of the soil; soft rock phosphate (30% P205)contains about 2.7 Kg. CaCO3 equivalents per Kg. of P2O5.
4.3 Other Relevant Land Qualities
In addition to an assessment of moisture and nutrient availability, thefollowing land qualities are relevant in the context of fertilizer use:
a) Oxygen availability.In general, the topsoils of the humic Nitisols have good physical proper-ties. High porosity and stable structure maintain an environment in whichno impeded gas exchange is to be expected.
- 1.35 -

District: Murang'a Trial Site 21.1: Kandara-Kareti
b) Rootability.The extremely deep soils with their stable blocky structures and highporosity provide a very good environment for unhampered root developmentand tuber expansion.
c) Resistance to erosion.The area has a moderate to high resistance to erosion. The negativeinfluence of high rainfall intensity and the undulating to rollingtopography is largely offset by the high structure stability (lowerodibility) of the surface soil.
d) Ease of cultivation and scope for agricultural implements.Although the soils impose no serious limitations to manual land preparationand oxen ploughing, areas with a rolling topography are less suitable fortractor ploughing. Moreover, tractor ploughing generally leads to thedeterioration of physical properties of the topsoil (compaction).
5. Trial Design and Execution Plan, Kandara-Kareti
(Full details of the methodology for carrying out the trials are shown inChapter IV of the main report.)
Selection of crops for each of the three modules at the Kandara site:
Site 21.1 Kandara-Kareti.
RAINY SEASONS1st, Long, March 2nd rains Aug-Oct
51 Standard maize52 Maize & peas53 Pot./Cabbages;Beans
Hybrid 512H.512+ Beans GLP 2Anett/Copenhagen
Hybrid 512H.512+ Beans GLP 2Beans, GLP 1004
The 1st sequence or module is continuous, pure maize, once/year.The 2nd is intercropped maize and beans, also once/year;The 3rd is potatoes or cabbages in the first rains, and Beans, GLP 1004 inthe second rains.
Each module contains 2 experiments, namely Experiment 1 and Experiment 2.Experiment 1 is a 4N x 4P factorial, with 2 replications in each module.Experiment 2 is a 2N x 2P x 2K x 2 FYM factorial, also with 2 replicationsin each module.
Each module thus consists of 64 plots, and the total for the 3 modules is192 plots.
Fertilizer will be applied during both seasons. FYM will be applied only tothe crops during the first rains. Where maize and beans are intercropped,the fertilizer will go on the maize. The peas will not receive anyfertilizer directly, but will "scavenge" from the maize, and from residualfertilizer left in the relevant plots after the first season.
- 1.36 -

District: Murang'a Trial Site 21.2: Hakuyu
Contents of Chapter 21.2:
Detailed Description of the Makuyu Trial Site
Page
1. Geographical and Additional Technical Information 2.41.1 Final Position of the Trial Site 2.41.2 Sketch of the Trial Site 2.51.3 Physiography 2.71.4 Vegetation, Past and Present Land Use 2.81.5 Names and Addresses of Government Officers from the Division
and Farmers Involved in FURP Activities 2.9
2. Climate 2.102.1 Prevailing Climatic Conditions 2.10
2.1.1 Agro-Climatic Classification of the Area Represented 2.102.1.2 Relevant Meteorological Data 2.112.1.3 Crop Suitability from the Climatic Point of View 2.15
2.2 Proposal for the Monitoring of Agro-Climatic Conditions inPhase II . 2.19
3. Soils 2.203.1 Survey Data 2.20
3.1.1 Brief Soil Description and General Information on theSoil . 2.20
3.1.2 Detailed Profile Description and Soil Classification 2.213.1.3 Soil Sampling 2.23
3.2 Laboratory Data 2.233.3 Evaluation of Soil Data 2.28
3.3.1 Literature References and Soil Correlation 2.283.3.2 Representativeness 2.293.3.3 Variability of Soil Properties within the Trial Site 2.293.3.4 Fertility Status of the Soil 2.30
3.3.4.1 Soil Profile and Global Fertility Rating 2.303.3.4.2 Soil Fertility Assessment of Composite Samples 2.31
3.4 Sampling Programme for Laboratory Analysis 2.333.4.1 Soil Samples 2.333.4.2 Plant Samples 2.343.4.3 Other Samples 2.34
4. Conclusions from the Analyses of Climate and Soils 2.344.1 Moisture Availability 2.344.2 Nutrient Availability in Relation to Possible Fertilizer
Requirement 2.354.3 Other Relevant Land Qualities 2.36
5. Trial Design and Execution Plan 2.37
- 2.1 -

District: Murang'a Trial Site 21.2: Makuyu
List of Tables1)
Page
Table 21.2.1 Physiography of the Makuyu Trial Site 2.7
Table 21.2.2 Vegetation, Past and Present Land Use 2.8
Table 21.2.3 Names and Addresses of the Divisional Staff Members and
Farmers of the Makuyu Trial Site 2.9
Table 21.2.4 Data of the Nearest Long-Term Rainfall Station 2.12
Table 21.2.5 Temperature 2.13
Table 21.2.6 Potential Evaporation (Eo) 2.13
Table 21.2.7 Agro-Climatological Crop List for Makuyu 2.15
Table 21.2.8 Crop Development Stages and Crop Coefficients 2.17
Table 21.2.9 Detailed Profile Description of the Makuyu Trial Plot 2.22
Table 21.2.10 Analytical Results (physical and chemical analyses) 2.24
Table 21.2.11 Analytical Results (chemical analyses, trial plot) 2.25
Table 21.2.12 Analytical Results (chemical analyses, farmers' fields) 2.27
Table 21.2.13 Soil Correlation with Respect to the Makuyu Trial Site 2.28
Table 21.2.14 Evaluation of Mehlich Analysis Data According to NAL
Standards 2.33
1) See Footnote next page.
: - 2.2 -
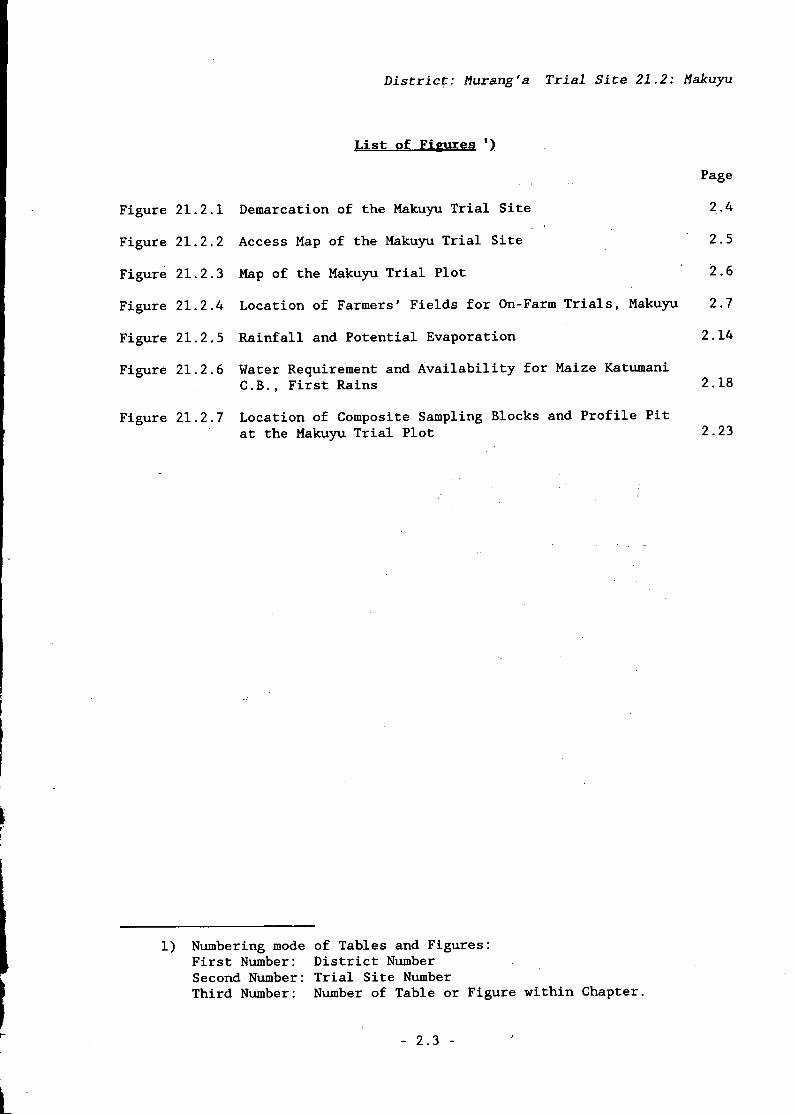
District: Murang'a Trial Site 21.2: Makuyu
List of Figures *)
Page
Figure 21.2.1 Demarcation of the Makuyu Trial Site 2.4
Figure 21.2.2 Access Map of the Makuyu Trial Site 2.5
Figure 21.2.3 Map of the Makuyu Trial Plot 2.6
Figure 21.2.4 Location of Farmers' Fields for On-Farm Trials, Makuyu 2.7
Figure 21.2.5 Rainfall and Potential Evaporation 2.14
Figure 21.2.6 Water Requirement and Availability for Maize Katumani
C.B., First Rains 2.18
Figure 21.2.7 Location of Composite Sampling Blocks and Profile Pitat the Makuyu Trial Plot 2.23
1) Numbering mode of Tables and Figures:First Number: District NumberSecond Number: Trial Site NumberThird Number: Number of Table or Figure within Chapter.
- 2.3 -

District: Murang'a Trial Site 21.2: Makuyu
1. Geographical and Additional Technical Information
1.1 Final Position of the Trial Site
The position of the site at Makuyu is shown in Figure 21.2.1, extractedfrom Map No. 135/3 - Makuyu. Its UTM grid coordinates are E 98.4 and N01.5. The elevation is 1430 m. Further details on the final position areshown in Figure 21.2.2 and the sketch map of the trial plot in Figure21.2.3.
Figure 21.2.1: Demarcation of the Makuyu Trial Site on the 1:50,000Topographic Map
- 2.4 -

District: Murang'a Trial Site 21.2: Makuyu
1.2 Sketch of the Trial Site.
The location of and the access route to the Makuyu site are shown in Figure21.2.2 and the map of the trial plot in Figure 21.2.3.
KamahuT.C. •'. Falls
3Km.
Figure 21.2.2: Access Map of the Trial Site, Makuyu
- 2.5 -

District: Murang'a Trial Site 21.2: Makuyu
Fence
Trees '4
O 10 20 30 40 50m
Figure 21.2.3: Map of the Trial Plot, Makuyu
- 2.6 -

District: Murang'a Trial Site 21.2: Makuyu
The approximate location of the on-farm trials is indicated in Figure21.2.4.
T
major dust road
vallevbotton
major idust j»
?.enark: funen' field K is situated closeto the Divisional Office.
Figure 21.2.4: Location of Farmers' Fields for On~Farm Trials, Makuyu
1.3 Physiography
Information on the physiography of the trial site and its surroundings issummarized in Table 21.2.1 below.
Table 21.2.1: Physiography of the Makuyu Trial Site
Elevation
Landform
Physiographic position of the site
Topography of surrounding country
Slope on which trial plot is sited
Aspect
Microtopography
1430 m.
volcanic sheets weakly dis-sected or peneplain-like
slightly concave middleslope
gently undulating to undu-lating (slopes 2-8%)
2-3%
NE
forming gully crossing theeastern plot-boundary
- 2.7 -

District: Murang'a Trial Site 21.2: Makuyu
1.4 Vegetation, Past and Present Land Use
Information on vegetation and on past and present land use is summarized inTable 21.2.2 below:
Table 21.2.2: Vegetation, Past and Present Land Use of the Makuyu TrialSite
Vegetation
Cropping system
(a) cleared since:(b) crops grown:(c) fallow periods:(d) present land use:
Inputs
(a) mineral fertilizers:(b) organic manure:(c) means of land preparation:(d) means of weeding:(e) frequency of weeding:(f) other capital inputs:(g) level of know-how:
Produce
(a) maize
Livestock
Undifferentiated Combretumtypes
more than 20 yearsmaize, beans, potatoesoccasionalmaize (2 crops a year)H 511
20:20:0appliedmanualmanualtwice per crop standdipterex (stalk borer)moderate
25 bags/acre(90 kg bags)
none
Remarks
- 2.8 -
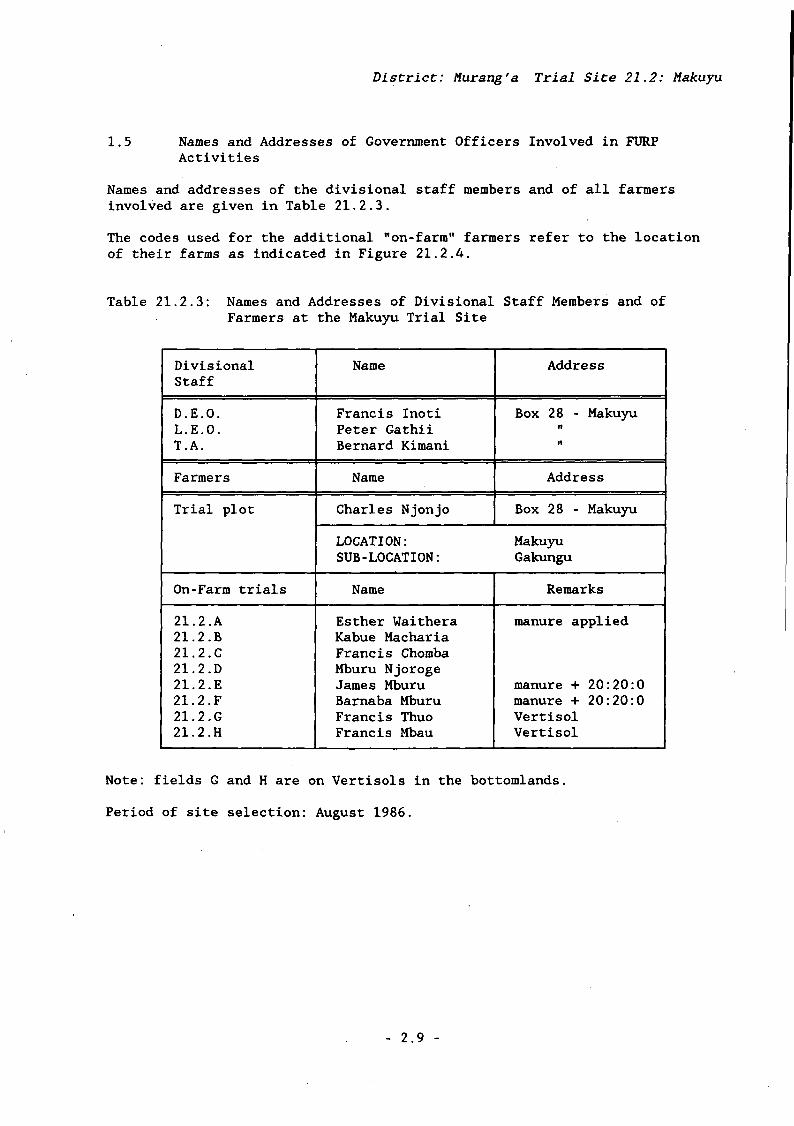
District: Murang'a Trial Site 21.2: Makuyu
1.5 Names and Addresses of Government Officers Involved in FURPActivities
Names and addresses of the divisional staff members and of all farmersinvolved are given in Table 21.2.3.
The codes used for the additional "on-farm" farmers refer to the locationof their farms as indicated in Figure 21.2.4.
Table 21.2.3: Names and Addresses of Divisional Staff Members and ofFarmers at the Makuyu Trial Site
DivisionalStaff
D.E.O.L.E.O.T.A.
Farmers
Trial plot
On-Farm trials
21.2.A21.2.B21.2.C21.2.D21.2.E21.2.F21.2.G21.2.H
Name
Francis InotiPeter GathiiBernard Kimani
Name
Charles Njonjo
LOCATION:SUB-LOCATION:
Name
Esther WaitheraKabue MachariaFrancis ChombaMburu NjorogeJames MburuBarnaba MburuFrancis ThuoFrancis Mbau
Address
Box 28 - Makuyun
n
Address
Box 28 - Makuyu
MakuyuGakungu
Remarks
manure applied
manure + 20:20:0manure + 20:20:0VertisolVertisol
Note: fields G and H are on Vertisols in the bottomlands.
Period of site selection: August 1986.
- 2.9 -

District: Hurang'a Trial Site 21.2: Makuyu
2. Climate
2.1 Prevailing Climatic Conditions
2.1.1 Agro-Climatic Classification of the Area Represented by the MakuyuTrial Site
The following brief climatic description refers to existing information:
ACZ : IV4 (H.M.H. BRAUN, 1982)1)
AEZ : UM 4, s/m + s (R. JÄTZOLD, 1983)2)
Next long-term rainfall station: 09037143, Makuyu Divisional Office.
Agro-Climatic Zone (ACZ):
Moisture availability Zone IV (r/Eo): annual average precipitation is 40-50% of the potential evaporation (Eo).
Temperature Zone 4: mean annual temperature is 18-20°C
Agro-Ecological Zone (AEZ):
UM, 4 = Sunflower-Maize Zone
UM = Upper Midland Zone: mean annual temperature is 18-21°C, meanminimum 11-14°C
4 = transitional; annual average precipitation is 40-50% of thepotential evaporation (Eo)
Sub-zone according to growing periods for annual crops (calculated for a"normal" crop in 60% probability)
s/m + s = with a short to medium and a short cropping season.
Formula Cropping season Lengths of growing period(exceeded in 6 out of 10 years)
s/m short to medium 105 - 114 dayss short 85 - 104 days
+ «= distinct arid period between growing periods
1) According to H.M.H. BRAUN in: W.G. SOMBROEK, et al. (1982):Exploratory Soil Map and Agro-Climatic Zone Map of Kenya, scale1:1,000,000 - Rep. El, Nairobi
2) According to R. JÄTZOLD and H. SCHMIDT, eds. (1983): FarmManagement Handbook of Kenya, Vol. II/B Central Kenya - Nairobiand Trier.
- 2.10 -

District: Murang'a Trial Site 21.2: Makuyu
2.1.2 Relevant Meteorological Data for the Makuyu Trial Site
In this Section a breakdown is given of the following climatic parameters:rainfall, potential evaporation and temperature.
Rainfall :
Rainfall data are obtained from the nearest long-term rainfall station:09037143, Makuyu Divisional Office (elevation: 1400 m), 1.3 km S of theMakuyu Trial Site (elevation: 1430 m). The data are listed in Table 21.2.4.At the trial site rainfall amounts are similar: in 20 out of 30 years theprecipitation at the Makuyu Trial Site is more than 410 mm. during theagro-humid period of the first rains and more than 270 mm. in the agro-humid period of the second rains. The methods of rainfäll data analysis aredescribed in Chapter IV.2.2 of the main report.
Temperature and potential evaporation(Eo):
Temperature data were obtained from 09037018: Punda Milia Estatetemperature recording station (operating up to 1940, 8 recorded years),(elevation: 1370 m ) , 3 km NE of the trial site (elevation:•1430 m ) . Pote- .ntial evaporation (Eo) is calculated using the PENMAN formula, modified byMC CULLOCH (1965). The input parameters employed - windrun, sunshine hoursand relative humidity - are obtained from: 09137048, Thika Agro-Mete-orological station (elevation: 1500 m ) , 18 km SW of the trial site.
Temperature and evaporation data for the Makuyu Site are given in Tables21.2.5 and 21.2.6, and the rainfall pattern and potential evaporation areshown in Figure 21.2.5.
For more detailed information on the methodology of climatic descriptionsee Chapter IV.2.2 of the main report.
- 2.11 -

Table 21.2.4 Data of the Nearest Long-Term Rainfall Station
Station No.: 09037143Makuyu D.O.Elevation: 1400 m
Total years for calculation: 18First year included: 1967Last year included: 1985
Average annual rainfall: 1009 mm
Rainfall surpassed in 20 out of 30 years (=66% Probability):
1st rains: 410 mm(beg. of Mar. - end of June)
2nd rains: 270 mm(mid Oct. - end of Dec.)
Decadesand
Month
1 JAN234 FEB567 MAR8910 APR1 11213 MAY141516 JUN171819 JUL202122 AU6232425 SEP262728 OCT293031 NOV323334 DEC3536
ArithmeticMean(mm)
8.99.9
13.97.9
15.522.624.031 . 153.679.272.6
108.292. 138.027.18.87.9
12.45.72.62.71 .02.63.02.91.57.77.2
25.275.262.870.557.027.713.36.4
Average Number of RainyDays with Rainfall>= 1 mm
0.90.61 .20.71 .01 .21 .31 .73.34.44.24.23.62.21 .80.70.70.90.60.60.90.30.30.40.30.40.71 . 11 .63.93.54.13.11 .41 .30.9
>= 5 mm
0.90.61 .20.71 .01 . 11 .31 .73.34.44. 14. 13.62.21 .80.70.60.90.50.60.80.30.20.40.30.40.71 . 11 .63.93.44. 13. 11 .31 .30.8
=66% Probabi-lity of ex-
ceeding . . .mm
1 .52.23.61 .21 .32.57.912.535.649.954.276.952.613.911.52.92.72.71 .00.81 .10.00.00.20.00.50.52. 16.942.540.449.036.67.86.51 .9
Yearsanal-ized
171717181818171717171717181818171717181818171717171717181818161616141414
- 2.12 -

District: Murang'a Trial Site 21.2: Makuyu
Table 21.2.5:
MeanMeanMean
MeanMeanMean
temp,max.temp.min.temp.
temp,max.temp,min.temp.
Temperature (°
JAN.
20.227.912.5
JUL.
18.124.012.2
FEB.
21.529.313.7
AUG.
18.324.012.5
annual mean: 20.3 mean max.
C)
MAR.
22.429.315.4
SEPT.
20.227.313.1
: 26.6
APR.
21.527 .315.6
OCT.
21.227.6o
14.8
mean
MAY
20.625.915.2
NOV.
20.526.014.9
min. :
JUN.
18.824.413.1
DEC.
19.925.813.9
13.9
Table 21.2.6: Potential Evaporation
1st decade2nd decade3rd decadeTotal :
1st decade2nd decade3rd decadeTotal :
average annual
JAN.
575763177
JUL.
333337103
FEB.
606048168
AUG.
3939Jil121
MAR.
5858
Je.170
SEPT
535353159
(Eo) in
APR.
484848144
OCT.
5858Jtk180
potential evaporation: 1778
mm per
MAY
424246130
NOV.
515151153
mm.
Decade :
JUN.
3838_3_8114
DEC.
525257159
For all the climatic data published in this Section, a data bank has beenestablished by FURP on Personal Computers at the National AgriculturalLaboratories in Nairobi.
- 2.13 -

Figure 21.2.5: Rainfall and Potential Evaporation
(mm)
Rainfall Station: 09037143 Makuyu D. 0.
Meteorological Station:
09137048 Thika Agromet; St.
66% Probability
8 9 10 11 12 13 14 15 16 17 18 19 20 21 22 23 24 25 26 27
JAN FEB MAR APR MAY JUN JUL AUG SEP28 29 30
OCT31 32 33 34 35 36
NOV DEC

District: Murang'a Trial Site 21.2: Makuyu
2.1.3 Crop Suitability from the Climatic Point of View
A summary of the agro-climatic suitability of the most important seasonalfood crops is given in Table 21.2.7 below. Additional information on othercrops, considered suitable from the agro-climatic viewpoint is given in theFarm Management Handbook, Vol. II/B, Central Kenya 1 ) .
Table 21.2.7: Agro-Climatological Crop List for Makuyu
Crop/variety(or place ofbreeding)e = earlym = medium1 = late
Maize/e.mat.Katumani C.B
Sorghum/e.mat.Serena
Sunflowers/e. mat. 1 ikeIssanka
Beans/e.matlike (GLP 2)Rosecoco
Beans/e.mat.GLP 1004
Av.No.ofdays tophysiol.maturity
85-110
85-110
80-100
80-110
70-90
Altitudes2)accordingto growingperiod
(m.)
700-1600
0 - 1500
0 - 1500
700-1800
700-1600
Requirem.ofwell distri-buted rain-fall 3) ingrow.period
( mm. -) ,
260-500
220-480
200-400
250-450
230-420
Yieldpotential ace.to water avai-lability 4)a = 1st rainsb = 2nd rains
a) good/fair,b) fair/poor
a) goodb) fair
a) goodb) fair
a) good/fair,b) fair/poor
a) goodb) fair
1) R. JÄTZOLD and H. SCHMIDT, eds. (1983): Farm Management Handbookof Kenya, Vol. II/B, Central Kenya - Nairobi and Trier.
2) Most suitable altitudes; the length of the growing periodincreases with altitude; growth is also possible beyond theindicated altitude range, as long as the ecological limits havenot been reached.
3) Lower figure for fair results, higher for very good results withsome corrections due to rainfall distribution, evaporation andrun-off losses.
4) Estimated yield potential: very good >80%, good = 60-80%, fair =40-60% and poor <40% of the expected yield under optimum wateravailability adapted from R. JÄTZOLD and H: SCHMIDT, eds. (1982):Farm Management Handbook of Kenya, Vol. II/A, West Kenya.
- 2.15 -

District: Murang'a Trial Site 21.2: Makuyu
For the most important food crops in the area around the Makuyu Trial Site,the crop coefficients (kc) are shown in Table 21.2.8, differentiatedaccording to decades (10 day periods) of the growing season which is thetime between planting or sowing and physiological maturity. Furthermore,four crop development stages are distinguished in Table 21.2.8.
The crop coefficients for the climatic conditions at the Makuyu Trial Sitewere estimated on the basis of data obtained from DOORENBOS and PRUITT(1977)1) and DOORENBOS and KASSAM (1979)2). The data on the duration of eachof the growing seasons and on the various development stages of each cropwere assessed on the basis of local observations made under averageclimatic conditions.
The crop coefficients estimated for the various decades of the growingseasons were used to estimate the maximum (potential) evapotranspiration(ETm) under the prevailing climate, assuming that water is not a limitingfactor for plant growth. For this calculation the following approximativeformula was employed:
ETm = kc * Eo
whereby: ETm= maximum (potential) evapotranspirationkc = crop coefficientEo = potential evaporation (climatic evaporative demand)
In Figure 21.2.6, the ETm-values are used to indicate the estimated maximumwater requirements of the maize crop for optimum growth. Furthermore, .therainfall data at 66% reliability are shown in Figure 21.2.6 to give anindication of the water availability. However, when reading these figures,it must be borne in mind that the actual availability of water for theplants also depends, to a large degree, on factors such as the run-off, themoisture storage capacity of the soil, the deep percolation of water etc.
The placement of the growing seasons of the various crops on the time axisas presented in Figure 21.2.6 was mainly based on the pattern of rainfall,whereby the peak water requirements of the plants should be met by high,reliable rainfall.
Detailed information on the calculation procedures and references are givenin Chapter IV.2.2 of the main report. The interpretation of the diagramsmentioned above follows in Section 4 of this Volume (Conclusions from theAnalyses of Climate and Soils).
1) FAO (1977): Crop Water Requirements - (= Irrigation and DrainagePaper, 24), Rome
2) FAO (1979): Yield Response to Water - (= Irrigation and DrainagePaper, 33), Rome
- 2.16 -

Figure 21.2.6: Water requirementsand availability for cropMaize /Katumani, first rains
Rainfall Station: 09037143Makuyu D. 0.
00
I
mm
Trial Site 21.2 Makuyu
14 15 16 17 18
MAR APR MAY JUN

Table 21.2.8 : Crop development stages 1) and crop coefficients (Kc) 2) for approx. aaxiBua (potentiat) crop evapotranspiration of the aost importantseasonal crops grovn at Hakuyu (site no. 21.2)
Crop/Variety
NuBber of decades froi seeding resp. planting to (physiological) laturity1 2 3 4 5 6 7 8 9 10 11 12 13 14 15 16 17 19 20 21 22 23 24
HAIZEKATUKANI
0.5 0.65 0.73 0.86 0.97 1.05 1.05 1.05 1.05 0.9 0.66I I II II II III III III III IV IV
S0R6HUHSERENA
BEANSRose coco
BEANS6LP 1004
0.5 0.65 0.73 0.86 0.97 1.0 1.0 1.0 1.0 0.89 0.63I I II II II III III III III IV IV
0.5 0.65 0.73 0.86 0.97 1.05 1.05 1.05 0.82 0.49I I II II II III III III IV IV
0.5 0.65 0.73 0.97 1.05 1.05 1.05 0.82 0.49I I II II III III III IV IV
SUNFLOVERISSANKA
0.5 0.65 0.74 0.89 1.03 1.1 1.1 1.1 0.92 0.52I I II II II III III III IV IV
1) Crop developaent stages as defined in chapter IV 2.2 (aain report)I : initial stage II : development stage III = aid season IV = late season
2) Kc : crop coefficient as defined in chapter IV 2.2 (aain report)
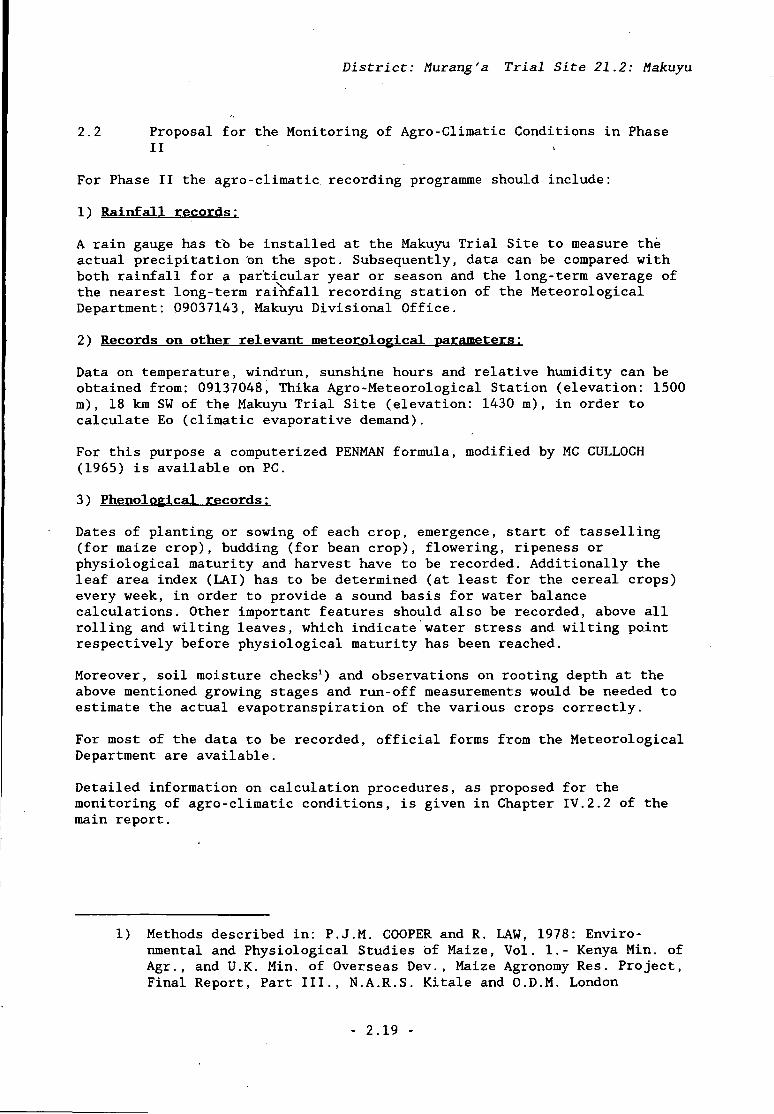
District: Murang'a Trial Site 21.2: Makuyu
2.2 Proposal for the Monitoring of Agro-Climatic Conditions in PhaseII
For Phase II the agro-climatic recording programme should include:
1) Rainfall
A rain gauge has to be installed at the Makuyu Trial Site to measure theactual precipitation on the spot. Subsequently, data can be compared withboth rainfall for a particular year or season and the long-term average ofthe nearest long-term rainfall recording station of the MeteorologicalDepartment: 09037143, Makuyu Divisional Office.
2) Records on other relevant meteorological parameters:
Data on temperature, windrun, sunshine hours and relative humidity can beobtained from: 09137048, Thika Agro-Meteorological Station (elevation: 1500m), 18 km SW of the Makuyu Trial Site (elevation: 1430 m ) , in order tocalculate Eo (climatic evaporative demand).
For this purpose a computerized PENMAN formula, modified by MC CULLOCH(1965) is available on PC.
3) Phenological records :
Dates of planting or sowing of each crop, emergence, start of tasselling(for maize crop), budding (for bean crop), flowering, ripeness orphysiological maturity and harvest have to be recorded. Additionally theleaf area index (LAI) has to be determined (at least for the cereal crops)every week, in order to provide a sound basis for water balancecalculations. Other important features should also be recorded, above allrolling and wilting leaves, which indicate water stress and wilting pointrespectively before physiological maturity has been reached.
Moreover, soil moisture checks1) and observations on rooting depth at theabove mentioned growing stages and run-off measurements would be needed toestimate the actual evapotranspiration of the various crops correctly.
For most of the data to be recorded, official forms from the MeteorologicalDepartment are available.
Detailed information on calculation procedures, as proposed for themonitoring of agro-climatic conditions, is given in Chapter IV.2.2 of themain report.
1) Methods described in: P.J.M. COOPER and R. LAW, 1978: Enviro-nmental and Physiological Studies of Maize, Vol. 1.- Kenya Min. ofAgr., and U.K. Min. of Overseas Dev., Maize Agronomy Res. Project,Final Report, Part III., N.A.R.S. Kitale and O.D.M. London
- 2.19 -

District: Murang'a Trial Site 21.2: Makuyu
3. Soils
In this Section, survey and laboratory data concerning the trial site and,more specifically, the soil profile are given.The evaluation of these data is shown in Sub-Section 3.3.
3.1 Survey Data
3.1.1 Brief Soil Description and General Information on the Soil
The brief description of the soils of the trial plot is followed by arating of relevant soil-related land factors. The classes for these factorshave been adapted from Andriesse and van der Pouw (1985), and a key forthem is to be found in Chapter IV.2.3 of the main report.
Brief soil description
The soils are extremely deep, dark reddish brown to dusky red in colour,and consist of friable clay.They have a predominantly moderate angular blocky structure and a very highbioporosity.
General information on the soil
- Parent rock
- Drainage
- Effective soil depth
- Inherent fertility
- Topsoil properties
1 rich:basic igneous rocks
2 moderately rich3 poor
1 (somewhat) excessively drained2 well drained3 moderately well drained4 imperfectly drained5 (very) poorly drained
1 extremely deep2 very deep3 deep4 moderately deep5 shallow6 very shallow
1 high to2 moderate3 poor4 very poor
0 non-humic1 humic2 thick humicla acid humic2a thick acid humic
- 2.20 -

District: Murang'a Trial Site 21.2: Makuyu
- Salinity 0 non-saline1 slightly saline2 saline
- Sodicity 0 non-sodic1 slightly sodic2 sodic
- Stoniness
- Rockiness
- Consistency (moist)
- Moisture storage capacity
0 non-stony1 slightly stony2 stony3 very stony
0 non-rocky1 slightly rocky2 rocky3 very rocky
1 half-ripe2 loose3 very friable4 friable5 firm6 very firm
1 very high2 high3 moderate4 low
- Excess surface water 0 none1 occasional2 seasonal3 permanent
3.1.2 Detailed Profile Description and Soil Classification
Detailed information on the various soil properties as they occur in thedifferent horizons is given in Table 21.2.9.The location of the profile near the trial plot is shown in Figure 21.2.7.
The soil profile is classified according to two systems, which areexplained in Chapter II.2.2 of the main report.
1. Legend to the Soil Map of the World (FAO-Unesco, 1974), with adjustmentsaccording to the Kenya Concept (Siderius and van der Pouw, 1980):dystric
2. USDA Soil Taxonomy (Soil Survey Staff, 1975): "oxic" Paleustult. veryfine-clavev family.
- 2.21 -

Table 21.2.9: Detailed Profile Description of the Kakuyu Trial Site
i
ru
'.Profile nurter: 21.2Date of exanination: 2-10-1986Author: Suai ing
SaopleHo.
21.2.1
21.2.2
21.2.3
21.2.4
21.2.5
21.2.6
H o r i z o n
Genetic j Depth | Boundary
Ah
BA
Bti
Bt2
Bt3
Ah(controlsanple)
0 - 12
12-40
40-77
77 - 106
106 - 125
clearwavy
gradualsnooth
gradualsnooth
diffuse
Colour ! Mottling ! Texture ! Cutans ! Structure ! Biopores Insistence(Hoist) ' ' ' ' '
5 YR 3/4dark redd,
brown
2.5 YR2.5/4
dark redd.brown
2.5 YR3/4
dark redd,brown
10 R 3/4duskyred
2.5 YR 3/4dark redd.
brown
clay
clay
clay
clay
clay
patçhythinclay
patçhythinclay
brokennoderately
thickclay
brokenthinclay
crumb
moderatered i un
subangularblocky
moderatemediumangularblocky
moderatemediumangularblocky
weakfine
subangularblocky
many v.f,many f.many m.many c.
many v.f.many f.many m.common c.
many v.f.many f.many m.common c.
many v.f.many f.many m.common c.
many v.f.many f.many m.common c.
si.hard;friable;si,sticky-si.plastic
si.hard;friable;si.sticky-si.plastic
si.hard;friable;
si.sticky-si.plastic
si.hard;friable;si.sticky-si.plastic
soft;friable;
si.sticky-si.plastic
Remarks: Colour: redd. : reddishBiopores: v.f. = verv fine; f. = fine; m. = medium; c. - coarseConsistence: si. - slightlyField pH: n.d. : not deternined
FieldPH
n.d.
n.d.
n.d.
n.d.
n.d.
Concretions
Hnvery few
Hn.very few
Hn,very few
Hnvery few
OtherFeatures

District: Murang'a Trial Site 21.2: Makuyu
3.1.3 Soil Sampling
Soil samples (profile, composite, farmers' fields, pF rings) are listed inSub-Section 3.2.
Figure 21.2.7 shows the location of the composite sampling Blocks (I to IV)as well as the location of the profile pit.
major dust road
Fig.StTht.
•profile nit
II III IV
-»Makuyu
Figure 21.2.7: Location of Composite Sampling Blocks and Profile Pit at theMakuyu Trial Plot
3.2 Laboratory Data
The soil samples from the profile and the composite samples from thevarious blocks of the main trial site and from the farmers' fields wereanalyzed in the laboratory. The results are compiled in Tables 21.2.10 to21.2.12. The methodology applied for obtaining these results is describedin detail in Chapter IV.2 of the main report.
- 2.23 -

District: Nuranga Trial Site: 21.2 Hakuyu
Table 21.2.10 : Analytical Results (physical and dmical analysis, results on air dry soil basis)Profile Sanies froi Trial Site
12345•078
12345to78
12345ft
0
78
Horizon
AhBABtlBt2Bt3
Ah
Deptha.
0-1212-4040-7777-106
106-125
Control
Saturation Extractluster
NANANANANA
NA
Na
0.110.120.110.150.16
0.12
PH
NANANANANA
NA
K
0.600.290.070.080.07
0.53
Field Lab.to. No.
8666/868667866886698670
8671
; NaPI frmH . . . . .CI.MMHI.
NA 0.06NA 0.06NANANA
NA
Ng Ca•mt /MM« Irstatf
1.76 1.151.20 0.961.04 0.751.37 0.831.56 0.76
1.92 1.02
Moisture Retention Capacity
1234
Horizon
Ah/BABtl
DepthCi.
10-1560-65
Vol.Xbar 0PFO
57.060.5
) 2 m .
*
_————
—
K
0.850.40
CEC pHB.2
22.3019.5018.8016.3018.00
22.00
Moisture1/10
2
38.942.0
SandX
99979
9
MgB./IOOp.
2.251.80
Bases iX •
16.2313.1810.4814.9114.17
16.32
1/32.5
35.035.7
SiltX
1311119
11
15
Ca
5.805.80
ÄS68+A1./100p.
4.543.893.072.672.69
4.69
53.7
28.529.0
ClayX
7680848080
78
Mn
AlX
20.2633.9335.838.995.20
23.45
154.2
27.027.5
TextureClass
CCCCC
C
ECK
13.4013.00
Org. CX
1.461.020.750.630.45
1.65
PHKC1
4.04.04.24.75.0
3.9
BasesX
65.3762.00
NX
0.120.080.080.070.07
0.10
PHH2O
5.35.75.65.25.1
5.2
AlX
6.8710.15
C/N
12.1712.759.389.006.43
16.50
Avail. MoistureCapacity• . / 1 0 a .
9.914.5
Oiff.PH
1.31.71.40.50.1
1.3
Al
Cond.H2O
0.120.080.050.020.03
0.09
H+AlM./ IOOp. KC1
0.921.321.100.240.14
1.10
P OlsenPP.
1.422.201.400.460.24
1.48
105deg.Cin rel.toair dry
0.950.950.950.950.94
0.95
Bulk D mp./cc.
105deg.C
1.071.00
NA = not applicableB./100gi. : lilliequivalents per 100 p . of soilAgTU : Silver Thio Urea ExtractionAcetate - Bases by A r n i m Acetate pH 7, CEC by Sodim testate pH 8.2pH and conductivity in suspension 1:2.5 v/v
- 2.24 -

District: Kuranga Trial Site: 21.2 Hakuyu
Table 21.2.11 : Analytical Results (chenical analysis, results on air dry soil basis)Trial Site Conposite Samples
; ,2
! 4! 5: 6i 7! 8! 9! 10! H! 12! 13! 14! 15! 16
! 18: 191 20! 21! 22! 23! 24! 25! 261 571 *'
! 28! 29! 30! 31! 32! 33! 34! 35i 36! 37! 38
40! 41: 42! 43!44! 45! 46! 47! 48! 49! 50! 511 52i 53! 54! 55! 56! 57i en, 08
Depth
Lab. No. /86
Fine earth X
Vol.weight gn./cc.
105 deg.C / air dry
pH H2O 1/1
pH H20 1/2.5
pH N KC1 1/2.5
C org. %
N tot. X
C/N
.Kod.Olsen Abs. 260nn
(1/1000)
S04 soluble ppn.
•
P Keh.1/5 ppm.
P Olsen ppn.
P nod.Olsen ppn.
P Citric ac. ppn.
ECEC AgTU ne./100gn.Bases XA1X
Hp BaC12 ne./100gn.
H 4 Al KO ne./100gn
AI 3- KC1 ne./100gn.
Al 3- AgTU ne./100gn
Sat.Ext. X H20
Sat.Ext. El.Cond.
Sat.Ext. pH
CD.
2050
205020502050
205020502050
205020502050
2050
2050
2050205020502050
202020
20502050205020
205020502050
Block numberI
86728673
100100
0.930.940.940.95
5.45.15.04.84.24.0
1.571.430.090.101714
44
1315
4.004.008.006.80
11.6058.363.97
0.501.200.661.600.461.22
II
86748675
1001000.980.870.950.94
5.04.74.74.53.93.8
1.441.030.130.081113
2323
14.808.00
13.0055.157.54
1.002.001.422.400.981.90
not applicablenot applicablenot applicablenot applicablenot applicablenot applicable
Ill
86768677
100100
0.950.880.940.94
5.34.94.94.74.03.9
1.321.150.090.091513
1919
13.308.00
0.501.100.641.860.481.38
IV V
86788679
100100
0.970.910.960.95
5.35.04.84.84.04.0
1.361.040.160.05
921
1419
12.00. 14.80
0.600.901.011.480.781.12
VI VIIX
100100
0.960.900.950.95
5.254.934.854.70.4.033.93
1.421.160.120.0812.9215.19
17.2519.00
10.429.40
0.651.300.931.840.681.41
s
0.000.000.020.030.010.01
0.170.170.130.140.130.10
0.110.190.030.023.943.81
4.653.27
4.393.64
0.240.480.370.410.250.35
Max. ;diff. ]
0.00 !
o.oo !0.05 I0.07 !0.02 i0.01 !
0.40 !0.40 !0.30 !0.30 !0.30 !0.20 !
0.25 !0.40 ;0.07 !0.05 !8.94 ;8.02 !
10.00 !8.00 :
10.808.00 !
0.50 !1.10 i0.78 !0.92 !0.52 !0.78 !
- 2.25 -

District: Huranga Trial Site: 21.2 Kakuyu
Table 21.2.11 : Analytical Results (chemical analysis, results on air dry soil basis)Trial Site Composite Samples
! i! 2l si *
\ 59! 60! 61! 62! 63! 64! 65! 66! 671 fiOi D o
! 69! 70! 71! 72! 73! 74! 75! 76! 77! 78! 79
: ai! 82! 83! 84! 85! 86! 87! 88I 89! 90! 91! 92! 93! 94! 95! 96! 97! 98! 99|100; loi! 102! 103; 104
; los
!Lab. No.
!
! Na Heh.1/5[[Ha Ag-TU ne11
IK Heh.1/5 si
|K nod.01. oj|K Ag-TU me.
Hg Heh.1/5jiHgnd.01.
!Hg Ag-TU M11
! Ca Heh.1/5
|Ca nod.01.jiCa Ag-TU ffi
!Hn Heh.1/5
|Kn nod.01.j|Hn Ag-TU n>11
!Zn KC1 ppn[!Zn nod. 01|11
|Cu HC1 ppn[[Cu nod. 01|ii
!Fe HCI ppn
!Fe nod. 01j11
!Fe Oxalate
|A1 Oxalate!
Depth
/86
ne./100gn
./lOOgn.
e./100gn.
e./100gn.
/lOOgn.
ne./100gn
ne./100gn
./lOOgn.
ne./100gn
me./IOOgn
!./100gn.
ne./IOOgn
ne./IOOgn
!./100gn.
ppn.
ppn. .
ppn.
X
X
en.
2050
205020
2050205020
2050205020
2050205020
2050205020
20502050
20502050
20502050
20502050
Block numberI
86728673
0.090.090.06
0.610.390.660.440.76
2.101.802.501.751.95
1.300.905.004.004.00
0.920.831.721.261.24
11.702.703.502.50
2.451.80
10.209.20
6.005.00132160
II
86748675
0.090.070.06
I
0.350.130.460.260.56
1.901.301.751.252.15
1.30Trace5.504.304.40
0.760.751.671.031.38
2.502.00
10.39.00
134188
III
86768677
0.070.07
0.540.200.690.31
1.901.502.421.42
0.90Trace6.304.30
0.860.671.031.28
3.001.30
10.3011.40
200158
IV V
66788679
0.090.07
0.540.230.640.20
1.901.602.001.40
0.90Trace5.002.70
0.750.801.710.61
2.501.50
9.2010.20
141108
VI VIIX
0.090.08
0.51. 0.24
0.610.30
1.951.552.171.46
1.100.235.453.83
0.820.761.531.05
2.881.83
8.369.98
151.63153.25
;
s
0.010.01
0.110.110.100.10
0.100.210.350.21
0.230.450.610.76
0.080.070.340.31
0.480.54
3.700.80
32.5033.09
Hax. !diff. i
0.02 !0.02 !
0.26 !0.26 !0.23 !0.24 !
0.20 I0.50 10.75 I0.50 I
0.40 ;0.90 !1.30 ;1.60 !
0.17 !0.16 i0.69 !0.67 !
j
LOO !1.20 !
8.502.40 !
68.5079.50
NA : not applicablene./IOOgn. = nilliequivalents per 100 gn. of soilHeh. : Hehl ich Analysisnod. 01. = Hodified Olsen ExtractionAgTU : Silver Thio Urea Extraction
- 2.26 -

Table 21.2.12 : Analytical Results (chemical'analysis, resultsFarmers' Fields Composite Sanpies
District: Huranga Trial Site: 21.2 Kakuyu
on air dry soil basis)
1234
678
101112
14
1617181920212223242526272829303132333435363738394041
Lab. No. /MFine earth XVol.weight gm./cc.105 deg. C / air dry
pH H2O 1/1'pH H2O 1/2.5pH N KCI 1/2.5
C org. XN tot. XC/N
Kod.Olsen Abs.260nn.
P Heh. 1/5 ppm.P mod.Olsen ppm.
Na Heh.1/5 me./100gm.
K Heh.1/5 me./100gm.K mod.01. me./IOOgm.
Hg Heh.1/5 ne./100gm.Hg mod.01. ne./100gm.
Ca Heh.1/5 ne./IOOgm.Ca mod.01. ne./IOOgm.
HnKeh. 1/5 ne./IOOgm.Kn mod.OI. ne./IOOgm.
Zn mod.01. ppm.
Cu mod.01. ppm.
Fe mod.01. ppn.
Hp BaC12 me./IOOgm.H 1 Al KCI ne./IOOgm.Al KCI ne./IOOgm.
Depthcm.
20202020
202020
202020
20
2020
20
2020
2020
2020
2020
20
20
20
202020
FarmersA
8680
too0.940.95
5.605.104.20
1.680.1313
23.004.00
0.09
1.00
2.703.35
2.206.00
0.800.65
4.90
12.10
115
0.340.22
1 fields (code)B C
8681100
0.980.95
5.204.803.90
1.360.0623
31.006.80
0.07
0.58
1.701.72
0.403.80
0.730.96
3.70
97.60
94
1.320.86
8682100
0.950.95
5.104.703.90
1.290.0718
23.009.30
0.07
0.310.93
1.901.65
Trace3.60
0.880.95
2.80
12.50
107
1.721.24
D
8683100
0.960.95
5.805.504.60
1.760.10
18
25.006.80
0.09
0.730.55
2.803.25
4.0010.30
0.970.78
4.30
10.30
77
0.2211.12
E
8684
too0.930.94
5.905.404.80
1.920.13
15
13.0010.60
0.13
1.380.33
3.504.83
5.5012.90
0.830.88
5.60
11.00
61
0.260.18
F
8685100
0.950.95
5.305.304.50
1.500.1015
19.0012.00
0.33
0.550.68
1.502.87
4.005.80
0.380.92
3.70
11.60
62
0.420.28
6
8686100
0.940.93
5.405.204.30
1.950.0633
13.0013.30
0.25
0.431.33
2.305.24
6.9013.30
0.310.85
4.10
11.70
128
0.320.20
H
86871001.100.93
5.505.204.40
1.800.0536
11.008.00
0.15
0.150.73
2.305.45
6.5012.60
0.150.40
1.80
6.00
197
0.280.16
Trial siteaverage
1000.960.95
5.254.854.03
1.420.1213
17.2510.42
0.09
0.510.61
1.952.17
1.105.45
0.821.53
2.88
8.36
152
0.650.930.68
X
100.000.970.94
5.455.124.29
1.630.0920.31
19.479.02
0.14
0.630.74
2.293.39
3.408.19
0.650.88
3.75
20.13
110.29
0.650.44
S
0.000.050.01
0.270.280.31
0.250.038.51
6.612.91
0.09
0.370.32
0.631.47
2.604.04
0.290.30
1.15
29.13
44.31
0.550.40
Hax. idiff. !
0.00 i0.17 !0.02 !
0.80 !0.80 !0.90 !
0.66 !0.08 i23.08 !
20.00 !9.30 !
0.26 !
1.23 I1.00 Ï
2.00 J3.80 !
6.90 !9.70 !
0.82 !1.13 !
3.80 |x
91.60 !
136.00 :
1.50 !1.12 i
NA : not applicableme./tOOgm. : milliequivalents per 100 gm. of soilppm. : parts per'miliionHeh. : Hehl ich AnalysisHod. 01. : Modified Olsen Extraction
- 2.27 -

District: Murang'a Trial Site 21.2: Makuyu
3.3 Evaluation of Soil Data
3.3.1 Literature References and Soil Correlation
Since 1972 the Kenya Soil Survey has carried out many soil surveys and siteevaluations and, in addition, some surveys were conducted by otheragencies.
A complete list of soil survey reports is given in Chapter II.2 of the mainreport. A report referring to the area in which the trial site is situatedis listed below.
Literature references :
ElW.G. Sombroek, H.M.H. Braun and B.J.A. van der Pouw(1982). Exploratory Soil Map and Agro-Climatic ZoneMap of Kenya, 1980, scale 1:1.000,000.
In order to correlate existing information with findings at the trial site,the map units and classification units in the above-mentioned reports havebeen grouped in Table 21.2.13. Moreover, the FURP soil map unit (Map21.0.4) and the classification of the soil of the profile at the trial plotare given.
Table 21.2.13: Soil Correlation with Respect to the Makuyu Trial Site
Reference
El
FURP
Map unit
R3
RB3
Trial plot profile
Soil Classification
eutric Nitisols; with nito-chromic Cambisols and chromicAcrisols, partly pisoferric orpetroferric phase
eutric Nitisols; with nito-chro-mic Cambisols and chromic Acri-sols and Luvisols, partly lithicpisoferric or petroferric phase
dystric NITISOL
Map unit R3 of the Exploratory Soil Map refers to a range of soilclassification units. At the trial site, the soils key out as dystricNitisols, although "eutric" is indicated by El as the prevailingclassification unit.
- 2.28 -

District: Murang'a Trial Site 21.2: Makuyu
3.3.2 Repre s entât ivene s s
For two reasons, statements about the representativeness of the soils ofthe trial site should be made with care.
Firstly, soil classification units are mainly based on properties of arelatively permanent nature, i.e. those of the subsurface horizons and notthose of the topsoil. Secondly, the generally high variability of topsoilproperties within short distances is not reflected in relatively small-scale reconnaissance soil maps (1:100,000 to 1:1,000,000). In this report,soils of a map unit considered to be within the "area ofrepresentativeness" must meet the following requirements:
(a) the soil-related land factors must have the same or similarratings ;
(b) soil classification must be the same or similar.
The extent to which all FURP trial sites are representative of the soils ofMurang'a District is shown in Map 21.0.5: "Groupings of Soil Mapping UnitsRepresented by Trial Sites in Murang'a District". This map is discussed inSub-Section 21.0.5.Distinction is made between high representativeness - code A - and moderaterepresentativeness - code B if soil conditions are slightly morefavourable than at the trial site and code B- if soil conditions areslightly less favourable than at the trial site. Code C is applied for theremaining parts of the District, where none of the FURP trial sites arerepresentative.
Within Murang'a District, the Makuyu Trial Site has high representativeness(Grouping 21.2.A) for the lower slopes of the Aberdares including Murang'a,Saba Saba and Makuyu. It refers to soil map unit RB3.
The Makuyu Trial Site is also representative of vast areas outside Murang'aDistrict. It is highly representative (Grouping 21.2.A) of all eutric anddystric Nitisols around the Aberdares and Mount Kenya, which are the mainsoils in l«rge parts of Kiambv*,, Kirinyaga, Embu and particularly MeruDistricts. " *
The verto-eutric Nitisols of soil map unit LB2, which extends intoKirinyaga and Embu Districts, are moderately represented by the MakuyuTrial Site (Grouping 21.2.B+).
3.3.3 Variability of Soil Properties within the Trial Site
The trial plot has a uniform appearance and has extremely deep soilsthroughout. A breakdown on the soil properties pH-KCl and organic carboncontent of the topsoils is given in this section.
pH-KCl: profile: 4.0composite samples: 3.9-4.2farmers' fields: 3.9 (fields B and C) - 4,8 (field E)
- 2.29 -

District: Hurang'a Trial Site 21.2: Makuyu
organic carbon content : profile: 1.5%composite samples: 1:3% - 1.6%farmers' fields: 1.3% - 1.5% (B,C,F)
1.7% - 1.9% (A.D.E.G.H)
The ranges appear to be narrow. A comprehensive listing of soil test valuesis to be found in Tables 21.2.10 to 21.2.12.
3.3.4 Fertility Status of the Soil
The criteria applied for the interpretation of the analytical data areoutlined in Chapter IV.2 of the main report.
3.3.4.1 Soil Profile
The analytical data of the soil samples taken from the profile pit,situated on the side of the trial site between Block I and the road (seeFigure 21.2.7), are presented in Table 21.2.10 and are interpreted in thefollowing paragraphs.
There is no presence of physical obstacles or extreme acidity in the sub-soil which would limit the rooting depth of the soil.The capacity for plantavailable moisture in the upper 100 cm. of the profile may be roughly esti-mated from the pF analysis carried out for the transition Ah/BA and the Btlhorizons; it attains approximately 120 mm. As plant roots may exploit aconsiderably .deeper soil volume down to below 180 cm., this estimate is notapt to ratify the effective moisture storage capacity, which should be veryhigh. The portion of very coarse pores decreases from the top to the sub-soil, leading to a considerable increase of available moisture capacityfrom 9.6 mm. per 10 cm. depth in the Ah/BA to 14.5 mm. per 10 cm. depth inthe Btl. The porosity of the topsoil facilitates rapid infiltration ofheavy rains.
The entire profile down to a depth of 125 cm. (maximum sampling depth) hasa moderate CEC (pH 8.2) of 16 to 22 me./100 gm., decreasing with depth. Theindicated base saturation is low (<16 %) and decreases with depth. However,exchangeable bases (particularly Ca) by Silver-Thiourea are considerablyhigher. Consequently, the base saturation calculated with these dataappears moderate (40 % ) . The cations determined from the trial sitecomposite samples support these higher values.
With reference to the moderate CEC, exchangeable K is high to medium in thetopsoil (Ah: 0.6 me./100 gm., BA: 0.3 me./100 gm.) and decreases sharplybelow the BA to very low values of 0.7 me./100 gm. Mg appears highthroughout (1-2 me./100 gm.). It shows a distinct minimum in the Btlhorizon. Ca is low in comparison to the other bases and in the medium tolow range (<6 me./100 gm.). The extremely low Ca status by Ammonium-Acetate(<1.2 me./100 gm.) is neither confirmed by the Ca value obtained from theSilver-Thiourea extraction nor by the data from the trial site compositesamples. Exchangeable bases are well balanced with respect to plantnutrition.
- 2.30 -

District: Murang'a Trial Site 21.2: Makuyu
The soil reaction increases with depth and covers the strongly andmoderately acid ranges (pH KC1 4 - 5 ) . Despite the low pH of the topsoil,the amounts of exchangeable Al are still within the low range.
The organic matter contents of the three upper horizons down to a depth of77 cm. cover the moderate range (1.5 - 0.75 % C) and decrease continuouslywith depth. The Bt3 below 90 cm. shows a low humus content of 0.45 % C.Total N is low to moderate in the Ah and low in the underlying soil. TheC/N ratios appear wide.
3.3.4.2 Soil Fertility Assessment of Composite Samples
The analytical results for the composite samples from the triai site(depths 0-20 cm. and 20-50 cm.) are presented in Table 21.2.11. The datafor the farmers' fields (depth 0-20 cm. only) selected around this trialsite are given in Table 21.2.12.
The composite samples were analyzed to assess the chemical fertility statusof the soil, with special emphasis on the availability of the importantnutrient elements to the plants. The "available nutrients" were estimatedby means of two complementary methods, the "Mehlich" diluted double-acidmethod (NAL routine) and a "modified Olsen" bicarbonate + EDTA extraction.
The interpretation of the analytical data presentee is in so far tentativefor both methods as the validity of the applied ratings (ranges for Low,Medium, High) has not yet been verified by field trials in the variousregions of Kenya.
The moderately to very humic soils (1.3 - 2 % C in the topsoil compositesamples) contain only low to moderate amounts of total N, and the reportedvalues are very erratic. In the topsoil of the trial site N ranges from0.09 % to 0.16 %; in the farmers' fields N ranges from 0.05 % to 0.13 %(low to moderate). The wide to very wide C/N ratios indicate a very low Nsupplying capacity and a hampered mineralization of organic matter in thesoil. However, on the basis of the humus content and other prevailing soiland climatic factors, a moderate N supply from the soil should be assumed.
The solubility of S04 was only tested in Block I of the trial site andappeared very low (4 ppm.), which supports the low estimate of the naturalN supply from the soil.
According to both the Mehlich analysis and modified Olsen method ,"available" P is in the low to moderate range (13-23 ppm. and 7-15 ppm.respectively) in the trial site. Block I appears lowest and Block IIhighest in P. In the farmers' fields the results of the two methods are notalways consistent. While the Mehlich analysis indicates a medium to high Pavailability for fields A to D, the values obtained by the modified Olsenmethod are low to moderate. For the fields G and E the results are inverse.P is moderate in field F and low in field H.
The K status of the trial site composite samples varies widely. In thetopsoil K is medium to high (0.35 - 0.61 me./100 gm. by the Mehlichanalysis, and 0.46 - 0.66 me./100 gm. by modified Olsen method), and the
- 2.31 -

District: Murang'a Trial Site 21.2: Makuyu
subsoil shows considerably lower K values (0.13 - 0.39 me./100 gm., and0.20 - 0.44 me./100 gm.). Block II shows a slightly lower K status than theother blocks. In the farmers' fields the K values are very erratic, butalmost always in the high range. Only field E shows a moderate K level bymodified Olsen method, and Mehlich analysis indicates low K in field H.
The "available" quantities of Mg are fairly constant over the entire trialsite, and high to very high in all samples. The Ca status of the soils, asindicated by both methods (Mehlich analysis and modified Olsen method),varies considerably from place to place. On average the Ca levels are lowto moderate. The trial site shows very uniform Ca values. The topsoil is atthe borderline to low (0.9 - 1.3 me./100 gm. by the Mehlich analysis, and 5- 6.3 me./100 gm. by the modified Olsen method) and the subsoil data are inthe low range. The farmers' fields B and C show very low Ca levels whilefields D, E, G and H are high in Ca. In fields A and F Ca is moderate.
According to both the Mehlich analysis and the modified Olsen method,available Mn is well within the adequate range.
According to the modified Olsen method, Zn is available only in low tomoderate amounts (1.8 - 5.6 ppm.). The trial site and particularly farmer'sfield H show low Zn levels (<4 ppm.). Cu is available in very high amounts( 6 - 1 2 ppm.) throughout. The HC1 extractable Zn and Cu determined in BlockI of the trial site are high in the topsoil and below the critical levelsin the subsoil.
The amount of Fe extracted by the modified Olsen method is moderate tohigh.
The trial site composite samples are strongly to very strongly acid (pH KC13.8 - 4.2). The pH in^the farmers' fields ranges from 3.9 to 4.8(moderately acid). While in the moderately acid soils, the exchangeableacidity and especially the exchangeable Al are too low to have anyimportant adverse effects on crop production, this may be the majorlimiting factor in the very strongly acid soils.
The evaluation of the Mehlich Analysis data according to NAL standards isgiven in Table 21.2.14.
- 2.32 -

District: Murang'a Trial Site 21.2: Makuyu
Table 21.2.14: Evaluation of the Mehlich Analysis Data According to NALStandards
Parameter
Soil reaction (pH)Acidity (Hp )
Available nutrientsSodiumPotassiumCalciumMagnesiumManganesePhosphorus
Total NitrogenOrganic Carbon
C / N RatioCa / Mg RatioCa / K RatioK / Mg Ratio
Trial Site
Moderately acidHigh
LowAdequateLowAdequateAdequateLow
LowModerate
FavourableNot favourableNot favourableFavourable
Farmers' Fields
Moderately acidModerate to high
LowAdequateAdequateAdequateAdequateLow to adequate
LowModerate
FavourableFavourableNot favourableFavourable
Remarks on Trial Site:Soil reaction is not very favourable. Positive yield responses to lime,manure, N and P applications are expected. Responses to K application maybe absent initially but are likely to occurlater.
Remarks on Farmers' Fields :Soil reaction is generally favourable. Positive yield responses to manure,N and P applications are expected. Responses to K and lime applicationsare unlikely.
3.4 Sampling Programme for Laboratory Analyses
3.4.1 Soil Samples
Soil samples will be collected once a year at the beginning of the longrains in February/March just after ploughing and before the fields areplanted. The samples will be taken individually from two depths (0 - 20 cmand 20 - 50 cm) for each replication of the selected fertilizer treatments,and only from the plots in Module 2 with maize/beans mixed cropping.
The treatments to be sampled are:
Trial I: N0:P0 N75:P75 N0:P75 N75:P0
Trial II: 0 FYMFYM+lime
- 2
FYM+NPFYM+NP+lime
.33 -
NP+KNP+K+lime

N75:P75
FYMFYM+lime
N0:P75
FYM+NPFYM+NP+lime
N75:P0
NP+KNP+K+lime
District: Murang'a Trial Site 21.2: Makuyu
3.4.2 Plant Samples
Harvest samples from the maize/beans mixed crop include individual samplesof grain and straw from maize and beans respectively. Samples will becollected separately from each replication of the treatments where soilsamples were collected, i.e.:
Trial I: N0:P0
Trial II: 0
3.4.3 Other Samples
From every batch of applied FYM three representative samples will be taken.
4. Conclusions from the Analyses of Climate and Soils
4.1 Moisture Availability
The amount of rainfall which is surpassed in 20 out of 30 years (i.e. 66%probability) constitutes the basis for estimating moisture availabilityduring the growing periods. Other parameters of the water balance such asmoisture storage capacity, run-off and deep percolation also have to beconsidered in order to obtain a comprehensive picture of the moistureavailability.
For example, the water requirements and the water availability formaize/Katumani planted during the first rains at the Makuyu Trial Site canbe interpreted as follows:
Figure 21.2.6 shows that the maximum water requirements (ETm) of themaize crop are only in line with the rainfall pattern at the 66%probability level up to beginning of May. The variability of rainfall,especially in May, is tremendously high, as shown in Figure 21.2.5 (seealso Table 21.2.4). The following distinct arid period leads to seriousyield reductions, since the crop is still at the stage of peak waterrequirements.
Run-off is considered to be moderate to low - the trial site is locatedon almost flat land (slope 2-3%). The soil has a stable structure(preventing crusting and surface-sealing), but the crop does not provideadequate ground cover at the time of high rainfall intensity inApril/May.
Deep percolation and lateral sub-surface flow could be estimated, butcan be omitted, since they are generally very low. Run-on is notrelevant for Makuyu Trial Site.
For the Makuyu Trial Site, the moisture storage capacity is very high(i.e. >160 mm.). Therefore, the possible water surplus of April and Maycould be stored to a large extent, but on the 66% probability level
- 2.34 -

District: Murang'a Trial Site 21.2: Makuyu
there is only little surplus in April/May. Hence, the distinct waterdeficits for the whole month of June cannot be compensated.
Summarizing the evaluation of the climatic factors, the yield potentialfrom the climatic point of view can, for the maize crop, first rains, berated good/fair on a "20 out of 30 year" basis.
In the second rains, water availability conditions are even lessfavourable. Crop failures often occur and only very early maturing,drought-tolerant crops such as sorghum, tepary beans, cowpeas or pigeonpeas can be cultivated successfully on a long-term basis.
4.2 Nutrient Availability in Relation to Possible Fertilizer Requirement
The N supplying capacity of the soils was only estimated globally andappears low to moderate. In most samples, available P is low to moderateand probably slightly inadequate to the expected N supply from the soil. Kappears medium to high in the upper part of the soil, but the deepersubsoil of the profile shows very low K values. All soils analyzed are veryrich in Mg. Ca was extracted in very erratic amounts covering the wholerange from low to high. In the very strongly acid soils exchangeable Al,might be the major limiting factor for successful crop production. Themicro-element Zn appeared low in some instances.
Fertilizer applications should first of all consider the most relevantplant nutrients which include N and P.
For sustained high yields regular N fertilization will be necessary, eitherfrom FYM or green manure or in mineral form. When mineral N is appliedregularly, it should be supplemented with mulch and other organicamendments. This is to protect the topsoil, particularly during the heavyrains in April/May, and to maintain its high humus content. Humus plays anessential role in stabilizing the structure of the topsoil and in prevent-ing applied nutrients from leaching too quickly.
N applications in whatever form will have to be supplemented with P. Thetrials will have to show whether a reasonable response to N can be obtainedwithout P. P may be applied as TSP, SSP or finely ground soft rockphosphate (e.g. Hyperphos or from Minjingu). Under the prevailing acid soilconditions rock phosphate will be readily available to plants and almost asefficient as TSP in the year of application. P from rock phosphate is lesssubject to fixation than P from water soluble fertilizers such as TSP. Pfixation by the soil is probably moderate. The efficiency of P applicationmay be enhanced by the addition of small amounts of fresh FYM to stimulatethe soil biological activity.
Superphosphate contains about 12% S and therefore may act as a two-elementfertilizer. Under farmers' conditions this might be very useful, since alimited S availability is likely in some fields.
Liberal applications of N and P may induce or intensify deficiencies ofmicro-elements, notably Zn in this trial site.
- 2.35 -

District: Hurang'a Trial Site 21.2: tiakuyu
K applications are not needed at the present stage and response to K may beonly erratic or not be obtained at all, at least in the first years.Considerable differences are expected within short distances. Theanalytical data provide no information on the reserves of K beyond theexchangeable pool, but the low K status of the subsoil indicates that the Kreserves are probably very limited. Permanent high applications of mineralN and P will, in the long run, need to be supplemented with K. FYM isnormally a good source of K.
If K fertilizer is to be applied, K2SO4 should generally be preferred toKC1 (both contain 50% K20), since the S04-ion enhances P availability. Theform in which K is applied should also take into account crop requirements(e.g. KC1 to cabbage, but not to Irish potatoes).
Under the present soil conditions, liming is not required immediately inthe trial site although it is advisable in farmers' fields B and C. Theamount of lime needed to neutralize excessive acidity may be roughlyestimated from the exchangeable Al. In general 2 t./ha. of agriculturallime should be applied for every milliequivalent (me./lOO gm.) of Al in thetopsoil. However, not more than 2 t./ha. should be used at any one time; ifthe lime requirement appears higher, the amount'needed should be split intoyearly applications of 2 t./ha. Soils should not be limed over pH (KC1) 5.
Liming enhances mineralization of organic matter in the soil. Care should,therefore, be taken to maintain the humus content at a high level for theabove-mentioned reasons.
In the trial site and the farmers' fields where immediate liming is notneeded, the acidifying effects of the applied mineral or organic ferti-lizers should be counterbalanced," i.e. .approximately 1.8 Kg. of CaC03 perKg. of. applied N: In.the caae of CAN, which contains Ca, only about 0.8 Kg.CaCOj per Kg.N, i.e. 0.2 Kg.lime per Kg. of CAN will be needed. TSP does notcontribute substantially to the.Ca budget of the soil; soft rock phosphates(30% P2O5) contain about 2.7 Kg. CaCO3 equivalents per Kg. of P2O5.
If lime is applied in excessive amounts, the availability of P and somemicro-nutrients may become critical. This applies mainly for Zn, but Cuavailability and plant uptake should also be monitored, at least fordemanding crops.
4.3 Other Relevant Land Qualities
In addition to an assessment of moisture and nutrient availability, thefollowing land qualities are relevant in the context of fertilizer use:
a) Oxygen availability.The topsoils of the eutric Nitisols have reasonable physical properties.High porosity and permeability are prevalent.
b) Rootability.The extremely deep soils with their high porosity provide a very goodenvironment for unhampered root development and tuber expansion.
- 2.36 -

District: Murang'a Trial Site 21.2: Makuyu
c) Resistance to erosion.The area has a moderate resistance to erosion. The negative influences ofhigh rainfall intensity and of the undulating to rolling topography can notalways be offset by the moderately high structure stability of the surfacesoil.
d) Ease of cultivation and scope for agricultural implements.Although the soils impose no serious limitations to manual land preparationand oxen ploughing, areas with a rolling topography are less suitable fortractor ploughing. Moreover, tractor ploughing generally leads to deteri-oration of the physical properties of the topsoil (compaction).
5. Trial Design and Execution Plan, Makuyu
(Full details of the methodology for carrying out the trials are shown inChapter IV of the main report).
Selection of crops for each of the three modules at the Makuyu site:
Site 21.2 Makuyu. RAINY SEASONS1st, Long, March 2nd, Short, Oct.
51 Standard Maize52 Maize & Beans.53 Maize & Pigeon Peas
Hybrid 511H.511+ GLP 92, BeansKatumani P.P.
Katumani C.B.K.C.B.+GLP 92K.C.B.+ K.P.P
The 1st sequence or module is continuous, pure maize, twice/year.The 2nd is intercropped maize and beans in both rains.The 3rd is intercropped maize and pigeon peas in the October rains, withthe pigeon peas remaining for the March rains.
Each module contains 2 experiments, namely Experiment 1 and Experiment 2.Experiment 1 is a 4N x 4P factorial, with 2 replications in each module.Experiment 2 is a 2NP x 2K x 2L x 2 FYM factorial, also with 2 replicationsin each module.
Each module thus consists of 64 plots, and the total for the 3 modules is192 plots.
Fertilizer will be applied in both rains, except for FYM, which will beapplied only to crops during the first rains. The ratoon crop of pigeonpeas will not receive fertilizer in its second season, namely the Marchrains. Where maize and beans or pigeon peas are intercropped, thefertilizer will go on the maize. The intercropped beans or pigeon peas willnot receive any fertilizer directly, but will "scavenge" from the maize,and from residual fertilizer left in the relevant plots after the firstseason.
- 2.37 -

EU
-1,000
1,000
3,000
5,000
7,000
9,000
11,000
13,000
999 KSh
2,999 KSh
4,999 KSh
£,999 KSh
8,999 KSh
10,999 KSh
12,939 KSh
14,999 KSh
MURANG'A DISTRICTMAIZE, FIRST RAINS:MEAN GROSS MAR6IN
EXPECTATION (KSh/ha)AT TREATMENT N50 P22
(BASED ON 1992 PRICES)
)
10 15 20 25 km
I I Not sui table for maize cu l t i va t ion by R.Rötter St C.Dreiser, 1992