Fantasy Ref 2020
42
800 Base PROJECTIONS + 20 Forecasters EVALUATED 100 200 300 RANKINGS Forecaster TOP HOCKEY Consumer REPORT FANTASY Fantasy Ref 2020
Transcript of Fantasy Ref 2020
800BasePROJECTIONS
+
20ForecastersEVALUATED
100 200 300
RANKINGSForecaster
TOP
HOCKEYConsumer REPORT
FANTASY
Fantasy Ref 2020

- Find more at FantasyRef.ca2
View more analysis at
FantasyRef.ca
Now with searchable database with past forecaster results.
Follow FantasyRef throughout the season on Twitter @Fantasy_Ref

Follow us throughout the year on Twitter @Fantasy_Ref - 3
ContentsForecaster Bios
2018/2019 Rankings Points Goals Assists PPG Wins Shutouts
Historical Rankings
Individual Forecaster Results To Be Updated
4-5
6789
101112
13-15
TBD
From the Editor
The main objective at FantasyRef.ca is to provide poolers with the tools and data to draft the best fantasy hockey team possible. This adventure started back in 2015 after viewing some advertising for a fantasy hockey guide that was clearly false. However, at the time there was no way to fact check the false claims as the forecaster didn’t post previous season results. Thus, I set out to create a website that tracks and even ranks fantasy hockey projections.
Needless to say, 2020 has been quite a year. Plans to go “BIGGER” at Fan-tasyRef were changed and instead things have been scaled back. That being said, Forecasters were still held accountable for their projections and I even added some more interactivity to the website.
Cheers to 2021!
Jeff Clubine Creator of FantasyRef.ca
2019/2020 Base Projections The Calculations
Skater Checklist Goalie Checklist Analysis Teams Ranking Calculations
16
17 - 34
35 - 37
3839 - 40
41 - 42
Last Updated: December 18th, 2020New Updates in Red
- Find more at FantasyRef.ca4
BIOSForecaster
Forecasters Info Skater Projections
Goaltender Projections Page
Cam Robinson
Cam Robinson was back again this season with more projections than in his first season. Cam is the managing editor of @Dob-berProspects and idirector of film scouting @EliteProspects.
314 Pts, G, A, and GP 0 N/A
CBSIf you sign up for fantasy hockey at CBS, you can find their fan-tasy hockey projections. This was the second season that they have been included in the rankings.
649Pts, G, A, GP, Plus Minus,
PPG, SHG, and PIM
65W, SO,
GAA, GA, S, and SPct
The Daily Faceoff
These projections are posted for free by Brock Seguin on daily-faceoff.com. 253
Pts, G, A, GP, SOG, PIM, PPG, PPA,
HIT, and BLK46 W, and SO
Dobber Hockey
One of the forecasters we have included in our rankings since the beginning. DobberHockey has been producing the “Best Damn Fantasy Hockey Guide” for the last 14 years.
779 Pts, G, A, PIM, HIT, and BS 88 GP, W, and
SO
Dom Luszczyszyn
Dom Luszczyszyn is a NHL analyst for The Athletic. On his projection spreadsheet you can customize fields for you pool, find advanced projections for up to 17 categories.
596
Pts, G, A, GP, TOI, SOG, PPG, PPP, SHP, BLK, HIT, +/-, PIM, GWG, FOW,
FOL, and FO%
60W, L, OTL,
SO, SV, SV%, GA,
and GP
ESPNTheir projections can be found by logging into the fantasy hock-ey site. Sean Allen and Victoria Matiash are the authors of the majority of their fantasy hockey articles.
278 Pts, G, and A 64 W
Hockey Le Magazine
Produced by Ovation Media in Montreal, this print hockey magazine produces a fantasy hockey guide each season. They are one of the original six forecasters to be evaluated.
460 Pts, G, and A 40 W, and SO
Left Wing Lock
After a 1 year hiatus, Left Wing Lock’s projections were included in the rankings this seaosn. The projections and more can be found at https://leftwinglock.com/
592
G, A, PTS, SOG, H, BS, FOW,
FOL, FOT, PIM, PPG, PPG, PPP,
GWG, ATOI, PM
62GS, W, L, OTL, SA, SV, GA, SV%, SO
Keeping Karlsson
Brian and Elan’s projections from the Keeping Karlsson Audio Almanac were included this season. They had independent skat-er projections and a combined projection for goaltenders.
283 Pts 64 W
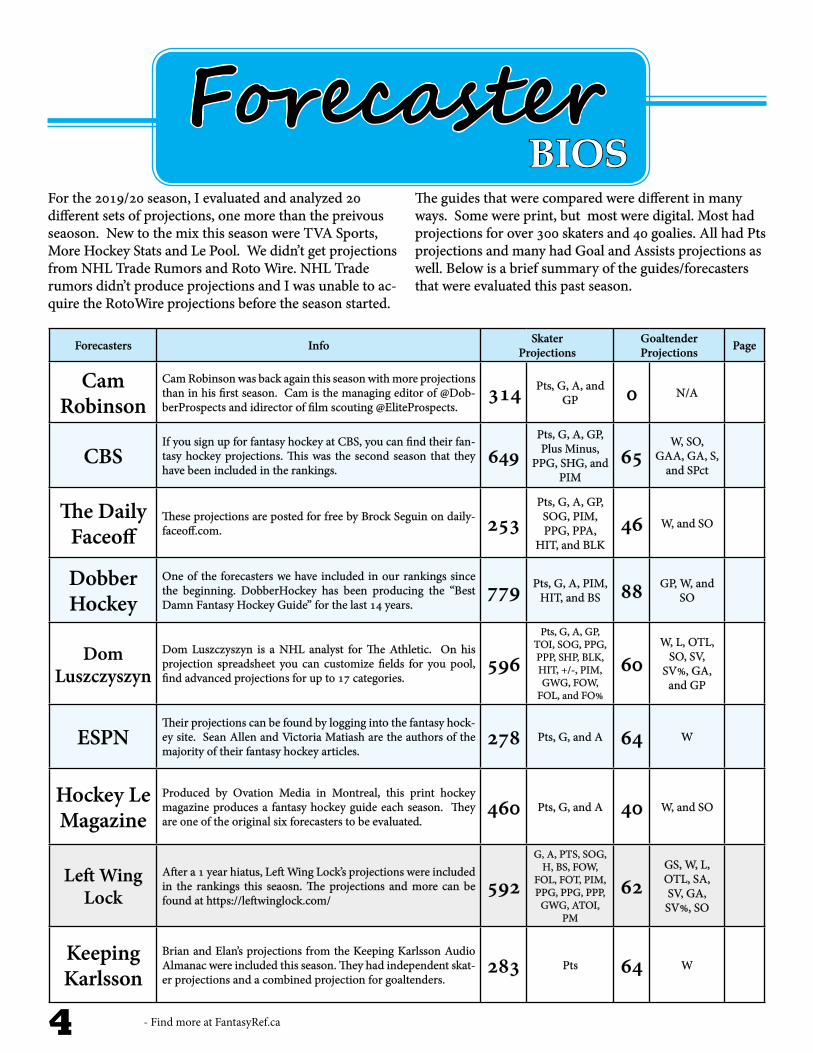
For the 2019/20 season, I evaluated and analyzed 20 different sets of projections, one more than the preivous seaoson. New to the mix this season were TVA Sports, More Hockey Stats and Le Pool. We didn’t get projections from NHL Trade Rumors and Roto Wire. NHL Trade rumors didn’t produce projections and I was unable to ac-quire the RotoWire projections before the season started.
The guides that were compared were different in many ways. Some were print, but most were digital. Most had projections for over 300 skaters and 40 goalies. All had Pts projections and many had Goal and Assists projections as well. Below is a brief summary of the guides/forecasters that were evaluated this past season.

Follow us throughout the year on Twitter @Fantasy_Ref - 5
Forecasters Info Skater Projections
Goaltender Projections Page
McKeens One of the originals, McKeens’ projections have been compared and evaluated since I started in 2015. 475 Pts, G, A, and
GP 51 W, SO, SV%, GAA
Le Pool This was the first year that their projections were included. The projections and more can be found at https://www.lepool.com/ 346 Pts, G, and A 6 W, SO, and
GP
Pete Jensen
This season Pete Jensen and the crew at NHL.com put together both skater and goaltender projections. This is the second sea-son that we have evaluated his projections.
225 Pts 34 W
More Hockey
Stats
This was the first year that their projections were included. The projections and more can be found at https://morehockeystats.com/
918 Pts, G, A, and GP 98
Everything but W and
SO
Rotoworld Rotoworld is part of the NBC family. Their comprehensive fan-tasy hockey site includes skater and goaltender projections. 657 Pts, G, A, and
GP 61 W, and SO
Scott Cullen
One of the original 6, Scott is a fantasy hockey contributor to all over the internet. He currently creates prop bets at MonkeyK-nifeFight.com
413 Pts, G, A, and GP 50 W, and SO
Sports Forecaster
One of three print fantasy hockey magazine that I compare. This magazine has been included in the rankings since the concep-tion in 2015.
430 Pts, G, A, and GP 40 W, and SO
Steve Laidlaw
A contributor at Dobber Hockey, Steve Laidlaw has been pro-ducing skater projections for three years. 406 Pts, G, A, and
GP 0 N/A
The Hockey News
A classic print projection magazine. These guys have been mak-ing fantasy hockey projections for about as long as I have been alive.
322 Pts,G, A, and PIM 61
W, SO, GAA, and
SV%
TVA Sports This was the first year that their projections were included. The projection were published in the magazine “Pool Pro”. 435 Pts,G, and A 50 GP, W, and
SO
View more analysis at FantasyRef.ca
Advertise With Us!

- Find more at FantasyRef.ca6
THE
2019/2020Rankings
What an unexpected end to the 19/20 season! Cut short due to the global pandemic, the shortened season final-ly wrapped up in September. This led to complications for the fantasy rankings and analysis due to the fact that teams played a different number of games. Some played 68 while others played up to 71. This made it a little bit more difficult to compare projections.
Instead of actual player totals being used to determine forecaster error, the players’ projected Pts, G, and A totals were used. This was calculated by taking the final stat for each category, dividing it by the number of games their team had played, and then multiplying by 82 (the total number of games in a full season). For example, Leon Draisaitl scored 110 Pts in 71 games and was on pace for 127 Pts in a full 82 games season. The Pts pace total was used to determine forecaster error, not the total at the end of his 71 games.
OVERVIEW
As always, the rankings were determined using the algorithm created by FantasyRef.ca. In this guide I have incuded a detailed description of how the calculations are made. Similar to previous years, rankings are creat-ed based on three characteristics: Statistical Category, Sample Size, and Total v. Rank. As all pools are set up differently, our rankings aim to meet the diverse needs of the many fantasy hockey pools.
For skater projections, rankings are provided for four statistical categories: Points, Points per Game, Goals, and Assists. For each of these categories, the forecasters’ Top 300, Top 200, and Top 100 projections were compared. If a forecaster had less than the required number of projec-tions, they were omitted from that category’s comparison. For example, some of the forecasters I evaluated had below 300 skater projections and were excluded from the Top 300 ranking calculations.
For goaltender projections, rankings are provided for two statistical categories: Wins and Shutouts. For each catego-ry, forecasters’ Top 40 projections were evaluated. Rank-ings of forecasters’ Top 20 and Top 10 projections were also ranked, but solely on order of increasing average error in the projections, not by the algorithm.
Finally, for each sample size and statistical category, fore-casters were ranked on their ability to project the players’ overall totals and the order (rank) that the players would finish.
THE TROPHIES
Each season I award the top three forecasters from each set of rankings with a trophy puck. First place is given the golden puck, second the silver, and third the bronze. With more and more sets of projections being released by forecasters each season, and more being included in the rankings, it is gettting tougher and tougher to earn a top three finish. Congratulations to all the winners!

Follow us throughout the year on Twitter @Fantasy_Ref - 7
Pts 2019/2020 Points Projection Rankings
TOTAL
RANK
Top 300 Top 200 Top 100
Top 300 Top 200 Top 100
The Pts Total Rankings, rank fore-casters’ abilties to project players Pts To-tals (the amount of Pts they accumulate
during the season)
The Pts Rank Rankings, rank forecasters’ abilties to project the order of players Pts Totals.
The points earned (for all rankings) are based on our rankings calculation outlined in this guide
Rank Forecaster Points
1 ScottCullen 79.60
2 SteveLaidlaw 76.30
3 Dom 76.25
4 TVASports 65.72
5 CamRobinson 65.72
6 Dobber 65.31
7 HockeyLeMagazine 63.55
8 TheHockeyNews 61.28
9 LePool 61.13
10 McKeens 60.80
11 LeftWingLock 57.87
12 SportsForecaster 54.80
13 KKElan 52.71
14 KKBrian 51.74
15 CBS 42.19
16 RotoWorld 41.04
17 MoreHockeyStats 29.03
Rank Forecaster Points
1 Dom 67.13
2 HockeyLeMagazine 60.70
3 ScottCullen 59.56
4 SteveLaidlaw 57.66
5 Dobber 56.85
6 TVASports 56.37
7 McKeens 56.27
8 CamRobinson 55.24
9 KKElan 54.18
10 LePool 54.09
11 KKBrian 52.60
12 TheHockeyNews 51.55
13 SportsForecaster 49.90
14 LeftWingLock 34.00
15 CBS 27.15
16 RotoWorld 24.11
17 MoreHockeyStats 10.13
Rank Forecaster Points
1 ScottCullen 82.17
2 SteveLaidlaw 78.54
3 Dom 74.80
4 DailyFaceOff 71.60
5 CamRobinson 68.92
6 TVASports 68.39
7 Dobber 67.34
8 ESPN 67.25
9 HockeyLeMagazine 66.66
10 LeftWingLock 64.12
11 PeteJensen 63.53
12 TheHockeyNews 62.86
13 LePool 62.45
14 McKeens 57.27
15 SportsForecaster 57.07
16 MoreHockeyStats 51.75
17 KKElan 51.74
18 KKBrian 50.83
19 RotoWorld 47.88
20 CBS 42.29
Rank Forecaster Points
1 HockeyLeMagazine 64.50
2 Dom 63.74
3 ESPN 58.77
4 SteveLaidlaw 58.55
5 ScottCullen 57.09
6 Dobber 57.00
7 PeteJensen 56.03
8 TVASports 55.74
9 CamRobinson 54.72
10 LePool 53.93
11 KKElan 53.62
12 McKeens 51.59
13 DailyFaceOff 50.13
14 TheHockeyNews 49.47
15 KKBrian 49.29
16 SportsForecaster 48.22
17 LeftWingLock 36.87
18 RotoWorld 34.56
19 CBS 28.86
20 MoreHockeyStats 26.44
Rank Forecaster Points
1 ScottCullen 88.78
2 Dom 81.53
3 SteveLaidlaw 80.74
4 DailyFaceOff 77.00
5 LeftWingLock 76.52
6 CamRobinson 71.13
7 LePool 67.80
8 PeteJensen 66.68
9 TVASports 66.46
10 HockeyLeMagazine 65.55
11 Dobber 65.34
12 ESPN 63.03
13 KKElan 61.27
14 MoreHockeyStats 60.77
15 SportsForecaster 60.64
16 TheHockeyNews 60.40
17 KKBrian 58.86
18 McKeens 57.89
19 RotoWorld 55.19
20 CBS 46.92
Rank Forecaster Points
1 Dom 75.27
2 HockeyLeMagazine 66.37
3 KKElan 62.78
4 ScottCullen 61.82
5 SteveLaidlaw 56.76
6 LePool 55.78
7 KKBrian 54.60
8 TVASports 54.30
9 PeteJensen 53.56
10 SportsForecaster 53.11
11 CamRobinson 52.79
12 ESPN 52.53
13 McKeens 51.80
14 Dobber 49.72
15 DailyFaceOff 48.38
16 RotoWorld 46.23
17 LeftWingLock 43.77
18 CBS 43.28
19 TheHockeyNews 40.75
20 MoreHockeyStats 24.28

- Find more at FantasyRef.ca8
G 2019/2020 Goal Projection Rankings
TOTAL
RANK
Top 300 Top 200 Top 100
Top 300 Top 200 Top 100
The Goal Total Rankings, rank fore-casters’ abilties to project players Goal Totals (the amount of Goals they accu-mulate during the season)
The Goal Rank Rankings, rank forecasters’ abilties to project the order of players Goal Totals.
The most possible points a forecaster can score on the rankings system is 100. Go to page 209 for more info on how the rankings are calculated.
Rank Forecaster Points
1 DailyFaceOff 70.86
2 CamRobinson 70.84
3 ScottCullen 69.02
4 ESPN 68.95
5 SteveLaidlaw 67.97
6 Dom 65.78
7 TVASports 62.32
8 TheHockeyNews 61.23
9 Dobber 60.94
10 LePool 59.01
11 McKeens 57.52
12 HockeyLeMagazine 56.98
13 LeftWingLock 48.30
14 SportsForecaster 47.92
15 CBS 44.52
16 RotoWorld 37.35
17 MoreHockeyStats 32.45
Rank Forecaster Points
1 McKeens 60.47
2 Dom 59.13
3 TheHockeyNews 57.47
4 HockeyLeMagazine 57.46
5 CamRobinson 56.83
6 SteveLaidlaw 55.95
7 TVASports 55.29
8 Dobber 54.30
9 ScottCullen 53.83
10 SportsForecaster 52.78
11 LePool 49.36
12 DailyFaceOff 49.30
13 ESPN 47.60
14 RotoWorld 43.30
15 LeftWingLock 36.55
16 MoreHockeyStats 18.64
17 CBS 14.87
Rank Forecaster Points
1 ScottCullen 83.68
2 SteveLaidlaw 80.09
3 ESPN 78.39
4 DailyFaceOff 77.43
5 Dom 77.30
6 CamRobinson 73.28
7 Dobber 72.89
8 HockeyLeMagazine 70.82
9 TheHockeyNews 69.10
10 LePool 68.76
11 TVASports 65.65
12 McKeens 65.45
13 LeftWingLock 59.24
14 SportsForecaster 57.81
15 MoreHockeyStats 54.18
16 RotoWorld 53.39
17 CBS 39.79
Rank Forecaster Points
1 CamRobinson 66.89
2 Dom 63.50
3 ScottCullen 60.76
4 HockeyLeMagazine 59.83
5 DailyFaceOff 54.69
6 SteveLaidlaw 54.67
7 SportsForecaster 53.97
8 Dobber 53.75
9 TheHockeyNews 53.26
10 ESPN 51.57
11 LePool 50.93
12 McKeens 48.65
13 TVASports 47.95
14 RotoWorld 42.99
15 LeftWingLock 25.72
16 MoreHockeyStats 14.08
17 CBS 13.05
Rank Forecaster Points
1 ScottCullen 93.29
2 SteveLaidlaw 83.43
3 Dom 82.58
4 CamRobinson 82.35
5 Dobber 80.20
6 ESPN 78.33
7 DailyFaceOff 77.41
8 LePool 74.83
9 TheHockeyNews 74.01
10 TVASports 73.14
11 LeftWingLock 71.74
12 MoreHockeyStats 71.20
13 HockeyLeMagazine 69.78
14 McKeens 69.13
15 SportsForecaster 58.41
16 RotoWorld 56.22
17 CBS 32.00
Rank Forecaster Points
1 McKeens 69.80
2 CamRobinson 65.78
3 TheHockeyNews 63.35
4 LePool 62.83
5 CBS 59.87
6 TVASports 55.60
7 SteveLaidlaw 54.02
8 Dom 50.49
9 Dobber 50.30
10 ESPN 49.26
11 LeftWingLock 44.79
12 RotoWorld 40.10
13 HockeyLeMagazine 40.03
14 ScottCullen 37.97
15 DailyFaceOff 36.80
16 SportsForecaster 35.88
17 MoreHockeyStats 12.13

Follow us throughout the year on Twitter @Fantasy_Ref - 9
A 2019/2020 Assist Projection Rankings
TOTAL
RANK
Top 300 Top 200 Top 100
Top 300 Top 200 Top 100
The Assist Total Rankings, rank fore-casters’ abilties to project players Assist Totals (the amount of Assists they ac-cumulate during the season)
The Assist Rank Rankings, rank forecasters’ abilties to project the order of players Assist Totals.
Rank Forecaster Points
1 ScottCullen 79.60
2 SteveLaidlaw 76.30
3 Dom 76.25
4 TVASports 65.72
5 CamRobinson 65.72
6 Dobber 65.31
7 HockeyLeMagazine 63.55
8 TheHockeyNews 61.28
9 LePool 61.13
10 McKeens 60.80
11 LeftWingLock 57.87
12 SportsForecaster 54.80
13 KKElan 52.71
14 KKBrian 51.74
15 CBS 42.19
16 RotoWorld 41.04
17 MoreHockeyStats 29.03
Rank Forecaster Points
1 McKeens 65.32
2 Dom 64.14
3 TVASports 63.09
4 ScottCullen 60.89
5 TheHockeyNews 59.45
6 HockeyLeMagazine 58.88
7 Dobber 58.43
8 LePool 58.06
9 SteveLaidlaw 57.43
10 CamRobinson 53.15
11 SportsForecaster 49.94
12 ESPN 49.19
13 DailyFaceOff 49.12
14 LeftWingLock 40.09
15 CBS 27.11
16 MoreHockeyStats 21.49
17 RotoWorld 5.88
Rank Forecaster Points
1 Dom 84.78
2 ScottCullen 82.76
3 SteveLaidlaw 80.83
4 TVASports 75.13
5 DailyFaceOff 73.31
6 TheHockeyNews 71.58
7 ESPN 70.45
8 HockeyLeMagazine 68.58
9 CamRobinson 67.59
10 McKeens 67.49
11 LePool 66.96
12 LeftWingLock 65.60
13 Dobber 64.06
14 SportsForecaster 59.43
15 RotoWorld 58.75
16 MoreHockeyStats 57.27
17 CBS 50.94
Rank Forecaster Points
1 Dom 66.68
2 TVASports 63.36
3 McKeens 62.74
4 SteveLaidlaw 60.87
5 ScottCullen 60.01
6 HockeyLeMagazine 59.87
7 LePool 59.36
8 ESPN 58.85
9 Dobber 56.65
10 TheHockeyNews 55.28
11 DailyFaceOff 52.45
12 CamRobinson 49.66
13 SportsForecaster 46.17
14 LeftWingLock 39.88
15 MoreHockeyStats 31.53
16 CBS 28.59
17 RotoWorld 1.62
Rank Forecaster Points
1 Dom 91.22
2 ScottCullen 87.46
3 LeftWingLock 85.70
4 SteveLaidlaw 82.79
5 DailyFaceOff 82.64
6 ESPN 81.36
7 LePool 79.32
8 HockeyLeMagazine 77.87
9 CamRobinson 76.86
10 RotoWorld 74.67
11 TVASports 74.49
12 TheHockeyNews 74.38
13 Dobber 72.27
14 McKeens 70.41
15 MoreHockeyStats 68.50
16 SportsForecaster 65.15
17 CBS 61.39
Rank Forecaster Points
1 HockeyLeMagazine 71.35
2 LePool 70.77
3 Dom 69.61
4 ESPN 65.90
5 Dobber 62.51
6 TVASports 60.40
7 LeftWingLock 60.35
8 McKeens 59.68
9 ScottCullen 59.16
10 SteveLaidlaw 56.03
11 DailyFaceOff 54.83
12 TheHockeyNews 52.91
13 CamRobinson 49.63
14 SportsForecaster 49.62
15 CBS 41.25
16 MoreHockeyStats 37.11
17 RotoWorld 31.64
- Find more at FantasyRef.ca10
PPG 2019/2020 Point Per Game Projection Rankings
TOTAL
RANK
Top 300 Top 200 Top 100
Top 300 Top 200 Top 100
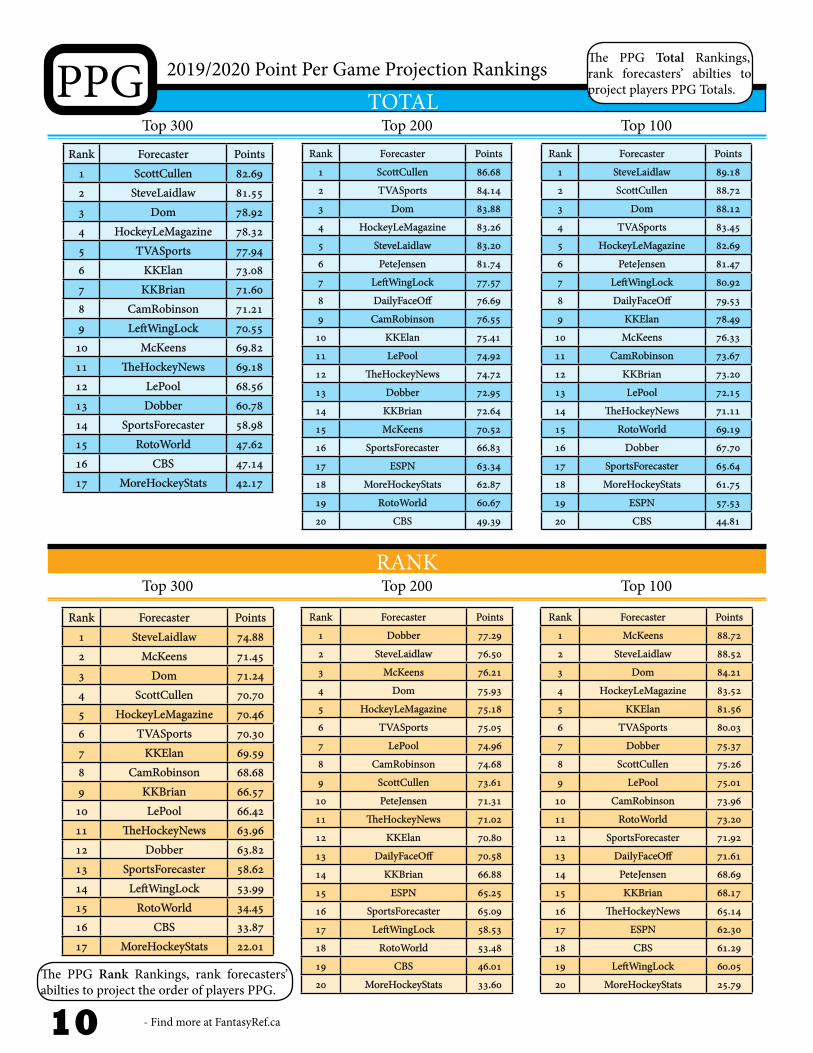
The PPG Total Rankings, rank forecasters’ abilties to project players PPG Totals.
The PPG Rank Rankings, rank forecasters’ abilties to project the order of players PPG.
Rank Forecaster Points
1 ScottCullen 82.69
2 SteveLaidlaw 81.55
3 Dom 78.92
4 HockeyLeMagazine 78.32
5 TVASports 77.94
6 KKElan 73.08
7 KKBrian 71.60
8 CamRobinson 71.21
9 LeftWingLock 70.55
10 McKeens 69.82
11 TheHockeyNews 69.18
12 LePool 68.56
13 Dobber 60.78
14 SportsForecaster 58.98
15 RotoWorld 47.62
16 CBS 47.14
17 MoreHockeyStats 42.17
Rank Forecaster Points
1 SteveLaidlaw 74.88
2 McKeens 71.45
3 Dom 71.24
4 ScottCullen 70.70
5 HockeyLeMagazine 70.46
6 TVASports 70.30
7 KKElan 69.59
8 CamRobinson 68.68
9 KKBrian 66.57
10 LePool 66.42
11 TheHockeyNews 63.96
12 Dobber 63.82
13 SportsForecaster 58.62
14 LeftWingLock 53.99
15 RotoWorld 34.45
16 CBS 33.87
17 MoreHockeyStats 22.01
Rank Forecaster Points
1 ScottCullen 86.68
2 TVASports 84.14
3 Dom 83.88
4 HockeyLeMagazine 83.26
5 SteveLaidlaw 83.20
6 PeteJensen 81.74
7 LeftWingLock 77.57
8 DailyFaceOff 76.69
9 CamRobinson 76.55
10 KKElan 75.41
11 LePool 74.92
12 TheHockeyNews 74.72
13 Dobber 72.95
14 KKBrian 72.64
15 McKeens 70.52
16 SportsForecaster 66.83
17 ESPN 63.34
18 MoreHockeyStats 62.87
19 RotoWorld 60.67
20 CBS 49.39
Rank Forecaster Points
1 Dobber 77.29
2 SteveLaidlaw 76.50
3 McKeens 76.21
4 Dom 75.93
5 HockeyLeMagazine 75.18
6 TVASports 75.05
7 LePool 74.96
8 CamRobinson 74.68
9 ScottCullen 73.61
10 PeteJensen 71.31
11 TheHockeyNews 71.02
12 KKElan 70.80
13 DailyFaceOff 70.58
14 KKBrian 66.88
15 ESPN 65.25
16 SportsForecaster 65.09
17 LeftWingLock 58.53
18 RotoWorld 53.48
19 CBS 46.01
20 MoreHockeyStats 33.60
Rank Forecaster Points
1 SteveLaidlaw 89.18
2 ScottCullen 88.72
3 Dom 88.12
4 TVASports 83.45
5 HockeyLeMagazine 82.69
6 PeteJensen 81.47
7 LeftWingLock 80.92
8 DailyFaceOff 79.53
9 KKElan 78.49
10 McKeens 76.33
11 CamRobinson 73.67
12 KKBrian 73.20
13 LePool 72.15
14 TheHockeyNews 71.11
15 RotoWorld 69.19
16 Dobber 67.70
17 SportsForecaster 65.64
18 MoreHockeyStats 61.75
19 ESPN 57.53
20 CBS 44.81
Rank Forecaster Points
1 McKeens 88.72
2 SteveLaidlaw 88.52
3 Dom 84.21
4 HockeyLeMagazine 83.52
5 KKElan 81.56
6 TVASports 80.03
7 Dobber 75.37
8 ScottCullen 75.26
9 LePool 75.01
10 CamRobinson 73.96
11 RotoWorld 73.20
12 SportsForecaster 71.92
13 DailyFaceOff 71.61
14 PeteJensen 68.69
15 KKBrian 68.17
16 TheHockeyNews 65.14
17 ESPN 62.30
18 CBS 61.29
19 LeftWingLock 60.05
20 MoreHockeyStats 25.79
Follow us throughout the year on Twitter @Fantasy_Ref - 11
W 2019/2020 Win Projection Rankings
TOTAL
RANK
Top 40 Top 20 (Average Error) Top 10 (Average Error)
Top 40 Top 20 (Average Error) Top 10 (Average Error)
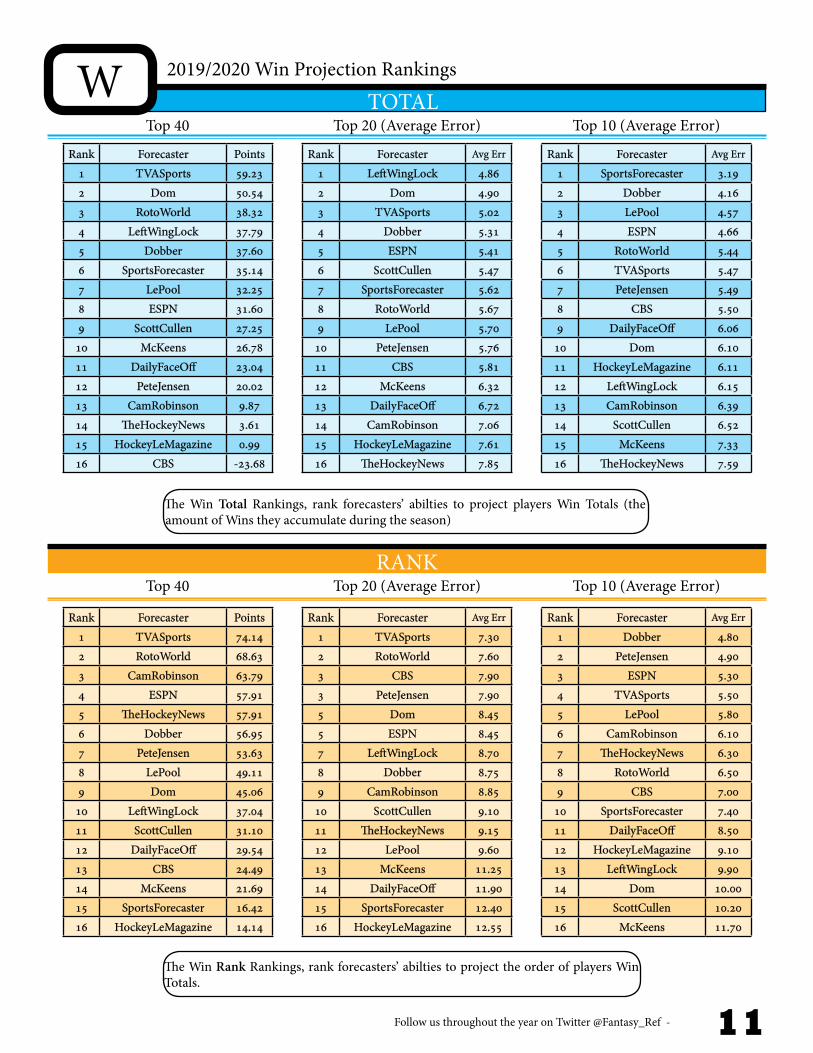
The Win Total Rankings, rank forecasters’ abilties to project players Win Totals (the amount of Wins they accumulate during the season)
The Win Rank Rankings, rank forecasters’ abilties to project the order of players Win Totals.
Rank Forecaster Points
1 TVASports 59.23
2 Dom 50.54
3 RotoWorld 38.32
4 LeftWingLock 37.79
5 Dobber 37.60
6 SportsForecaster 35.14
7 LePool 32.25
8 ESPN 31.60
9 ScottCullen 27.25
10 McKeens 26.78
11 DailyFaceOff 23.04
12 PeteJensen 20.02
13 CamRobinson 9.87
14 TheHockeyNews 3.61
15 HockeyLeMagazine 0.99
16 CBS -23.68
Rank Forecaster Avg Err
1 LeftWingLock 4.86
2 Dom 4.90
3 TVASports 5.02
4 Dobber 5.31
5 ESPN 5.41
6 ScottCullen 5.47
7 SportsForecaster 5.62
8 RotoWorld 5.67
9 LePool 5.70
10 PeteJensen 5.76
11 CBS 5.81
12 McKeens 6.32
13 DailyFaceOff 6.72
14 CamRobinson 7.06
15 HockeyLeMagazine 7.61
16 TheHockeyNews 7.85
Rank Forecaster Avg Err
1 SportsForecaster 3.19
2 Dobber 4.16
3 LePool 4.57
4 ESPN 4.66
5 RotoWorld 5.44
6 TVASports 5.47
7 PeteJensen 5.49
8 CBS 5.50
9 DailyFaceOff 6.06
10 Dom 6.10
11 HockeyLeMagazine 6.11
12 LeftWingLock 6.15
13 CamRobinson 6.39
14 ScottCullen 6.52
15 McKeens 7.33
16 TheHockeyNews 7.59
Rank Forecaster Points
1 TVASports 74.14
2 RotoWorld 68.63
3 CamRobinson 63.79
4 ESPN 57.91
5 TheHockeyNews 57.91
6 Dobber 56.95
7 PeteJensen 53.63
8 LePool 49.11
9 Dom 45.06
10 LeftWingLock 37.04
11 ScottCullen 31.10
12 DailyFaceOff 29.54
13 CBS 24.49
14 McKeens 21.69
15 SportsForecaster 16.42
16 HockeyLeMagazine 14.14
Rank Forecaster Avg Err
1 TVASports 7.30
2 RotoWorld 7.60
3 CBS 7.90
3 PeteJensen 7.90
5 Dom 8.45
5 ESPN 8.45
7 LeftWingLock 8.70
8 Dobber 8.75
9 CamRobinson 8.85
10 ScottCullen 9.10
11 TheHockeyNews 9.15
12 LePool 9.60
13 McKeens 11.25
14 DailyFaceOff 11.90
15 SportsForecaster 12.40
16 HockeyLeMagazine 12.55
Rank Forecaster Avg Err
1 Dobber 4.80
2 PeteJensen 4.90
3 ESPN 5.30
4 TVASports 5.50
5 LePool 5.80
6 CamRobinson 6.10
7 TheHockeyNews 6.30
8 RotoWorld 6.50
9 CBS 7.00
10 SportsForecaster 7.40
11 DailyFaceOff 8.50
12 HockeyLeMagazine 9.10
13 LeftWingLock 9.90
14 Dom 10.00
15 ScottCullen 10.20
16 McKeens 11.70

- Find more at FantasyRef.ca12
SO 2019/2020 Shutout Projection Rankings
TOTAL
RANK
Top 40 Top 20 (Average Error) Top 10 (Average Error)
Top 40 Top 20 (Average Error) Top 10 (Average Error)
The Shutout Total Rankings, rank forecasters’ abilties to project players Shutout To-tals (the amount of Shutouts they accumulate during the season)
The Shutout Rank Rankings, rank forecasters’ abilties to project the order of players Shutout totals.
The is no limit to how little points a forecaster can get on the ranking system. Sometimes a forecaster might even get negative points.
Rank Forecaster Points
1 LeftWingLock 58.54
2 CBS 43.50
3 Dom 39.32
4 ScottCullen 38.25
5 TheHockeyNews 35.09
6 TVASports 33.83
7 Dobber 33.15
8 HockeyLeMagazine 18.85
9 McKeens 9.44
10 RotoWorld 9.41
11 DailyFaceOff -1.64
12 LePool -11.83
13 SportsForecaster -11.91
Rank Forecaster Avg Err
1 CBS 1.46
2 LeftWingLock 1.71
3 ScottCullen 1.73
4 Dom 1.74
5 TVASports 1.94
6 TheHockeyNews 1.94
7 Dobber 2.02
8 HockeyLeMagazine 2.07
9 RotoWorld 2.26
10 McKeens 2.28
11 DailyFaceOff 2.40
12 LePool 2.51
13 SportsForecaster 2.54
Rank Forecaster Avg Err
1 CBS 1.38
2 Dom 1.68
3 LeftWingLock 1.80
4 Dobber 2.29
5 TheHockeyNews 2.40
6 HockeyLeMagazine 2.44
7 TVASports 2.51
8 McKeens 2.56
9 ScottCullen 2.56
10 RotoWorld 2.57
11 SportsForecaster 2.77
12 DailyFaceOff 2.87
13 LePool 3.46
Rank Forecaster Points
1 CBS 76.62
2 Dom 66.04
3 RotoWorld 62.36
4 TVASports 60.77
5 TheHockeyNews 60.70
6 McKeens 56.64
7 Dobber 53.70
8 LePool 49.00
9 SportsForecaster 43.00
10 ScottCullen 41.74
11 HockeyLeMagazine 40.95
12 LeftWingLock 38.76
13 DailyFaceOff 31.12
Rank Forecaster Avg Err
1 CBS 11.05
2 Dom 12.60
3 TVASports 13.00
4 RotoWorld 13.35
5 ScottCullen 13.50
6 McKeens 13.85
7 Dobber 14.10
7 TheHockeyNews 14.10
9 HockeyLeMagazine 15.30
10 LePool 15.55
11 DailyFaceOff 16.20
12 LeftWingLock 17.50
13 SportsForecaster 17.60
Rank Forecaster Avg Err
1 CBS 11.10
2 RotoWorld 11.50
3 TVASports 12.90
4 McKeens 13.40
5 TheHockeyNews 13.60
6 Dom 13.90
7 SportsForecaster 16.90
8 Dobber 17.00
9 ScottCullen 17.70
10 DailyFaceOff 18.40
11 HockeyLeMagazine 18.60
12 LePool 19.70
13 LeftWingLock 22.60
Follow us throughout the year on Twitter @Fantasy_Ref - 13
HISTORICAL
Rankings
18/19
18/19 Season Recap
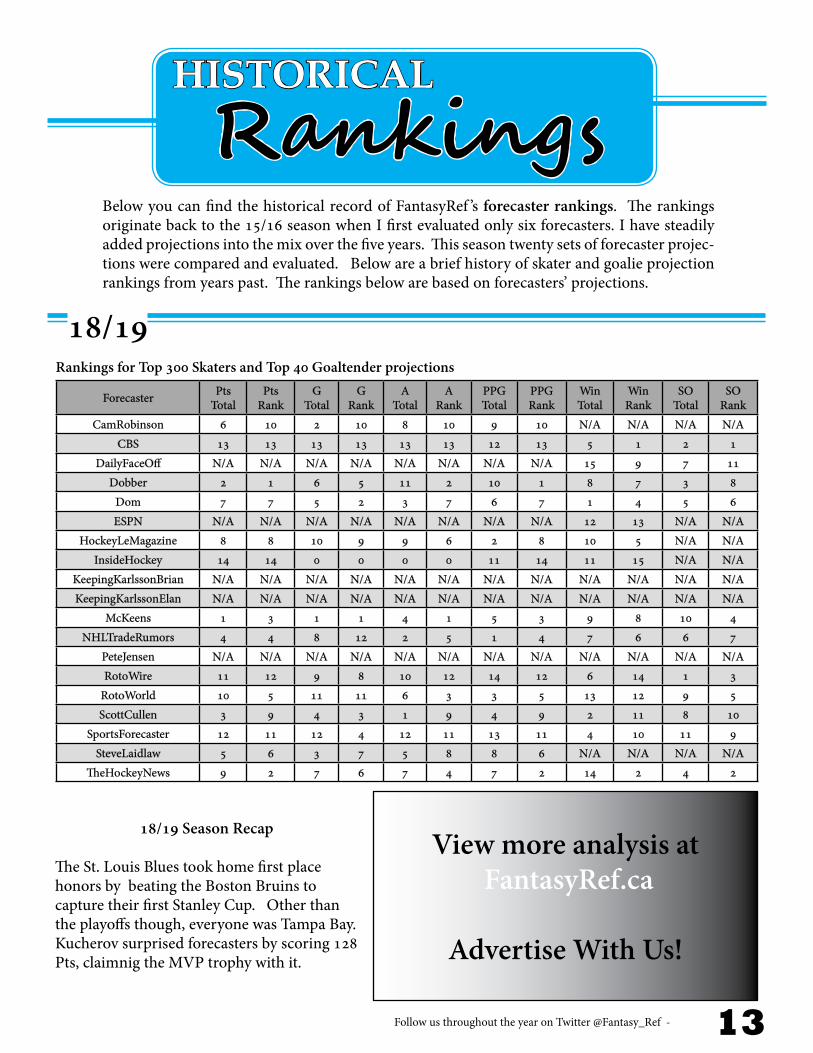
The St. Louis Blues took home first place honors by beating the Boston Bruins to capture their first Stanley Cup. Other than the playoffs though, everyone was Tampa Bay. Kucherov surprised forecasters by scoring 128 Pts, claimnig the MVP trophy with it.
Below you can find the historical record of FantasyRef ’s forecaster rankings. The rankings originate back to the 15/16 season when I first evaluated only six forecasters. I have steadily added projections into the mix over the five years. This season twenty sets of forecaster projec-tions were compared and evaluated. Below are a brief history of skater and goalie projection rankings from years past. The rankings below are based on forecasters’ projections.
Forecaster Pts Total
Pts Rank
G Total
G Rank
A Total
A Rank
PPG Total
PPG Rank
Win Total
Win Rank
SO Total
SO Rank
CamRobinson 6 10 2 10 8 10 9 10 N/A N/A N/A N/A
CBS 13 13 13 13 13 13 12 13 5 1 2 1
DailyFaceOff N/A N/A N/A N/A N/A N/A N/A N/A 15 9 7 11
Dobber 2 1 6 5 11 2 10 1 8 7 3 8
Dom 7 7 5 2 3 7 6 7 1 4 5 6
ESPN N/A N/A N/A N/A N/A N/A N/A N/A 12 13 N/A N/A
HockeyLeMagazine 8 8 10 9 9 6 2 8 10 5 N/A N/A
InsideHockey 14 14 0 0 0 0 11 14 11 15 N/A N/A
KeepingKarlssonBrian N/A N/A N/A N/A N/A N/A N/A N/A N/A N/A N/A N/A
KeepingKarlssonElan N/A N/A N/A N/A N/A N/A N/A N/A N/A N/A N/A N/A
McKeens 1 3 1 1 4 1 5 3 9 8 10 4
NHLTradeRumors 4 4 8 12 2 5 1 4 7 6 6 7
PeteJensen N/A N/A N/A N/A N/A N/A N/A N/A N/A N/A N/A N/A
RotoWire 11 12 9 8 10 12 14 12 6 14 1 3
RotoWorld 10 5 11 11 6 3 3 5 13 12 9 5
ScottCullen 3 9 4 3 1 9 4 9 2 11 8 10
SportsForecaster 12 11 12 4 12 11 13 11 4 10 11 9
SteveLaidlaw 5 6 3 7 5 8 8 6 N/A N/A N/A N/A
TheHockeyNews 9 2 7 6 7 4 7 2 14 2 4 2
Rankings for Top 300 Skaters and Top 40 Goaltender projections
View more analysis at FantasyRef.ca
Advertise With Us!

- Find more at FantasyRef.ca14
18/19 Continued
Rankings for Top 200 Skaters and Top 20 Goaltender projections
Forecaster Pts Total
Pts Rank
G Total
G Rank
A Total
A Rank
PPG Total
PPG Rank
Win Total
Win Rank
SO Total
SO Rank
CamRobinson 7 11 8 13 5 11 15 11 0 0 0 0
CBS 18 17 15 15 15 15 16 17 6 2 2 1
DailyFaceOff 11 13 1 8 10 10 10 13 15 10 7 9
Dobber 1 1 6 7 6 1 12 1 7 8 6 8
Dom 8 5 4 3 2 7 8 5 2 6 3 2
ESPN 14 12 10 2 14 12 6 12 10 14 0 0
HockeyLeMagazine 6 6 12 9 8 4 2 6 11 3 0 0
InsideHockey 19 19 0 0 0 0 18 19 1 5 0 0
KeepingKarlssonBrian 17 14 0 0 0 0 14 14 0 0 0 0
KeepingKarlssonElan 16 15 0 0 0 0 11 15 0 0 0 0
McKeens 2 4 3 1 9 3 7 4 8 11 11 11
NHLTradeRumors 3 3 7 10 1 6 1 3 4 4 8 10
PeteJensen 12 8 0 0 0 0 5 8 12 7 0 0
RotoWire 13 18 9 11 11 14 19 18 5 13 1 6
RotoWorld 10 7 13 14 3 2 4 7 13 12 9 7
ScottCullen 4 10 2 4 4 9 3 10 3 9 5 5
SportsForecaster 15 16 14 6 13 13 17 16 9 15 10 4
SteveLaidlaw 9 9 5 12 7 8 13 9 0 0 0 0
TheHockeyNews 5 2 11 5 12 5 9 2 14 1 4 3
Rankings for Top 100 Skaters and Top 10 Goaltender projections
Forecaster Pts Total
Pts Rank
G Total
G Rank
A Total
A Rank
PPG Total
PPG Rank
Win Total
Win Rank
SO Total
SORank
CamRobinson 12 12 8 10 4 8 15 12 0 0 0 0
CBS 19 17 15 13 15 7 19 17 3 2 1 1
DailyFaceOff 4 7 7 14 7 12 13 7 14 9 7 11
Dobber 1 1 6 4 3 10 4 1 8 8 4 8
Dom 16 10 5 3 8 6 10 10 2 5 3 5
ESPN 17 15 9 6 14 11 14 15 15 14 0 0
HockeyLeMagazine 9 11 11 8 9 2 7 11 9 7 0 0
InsideHockey 18 19 0 0 0 0 17 19 11 13 0 0
KeepingKarlssonBrian 7 4 0 0 0 0 5 4 0 0 0 0
KeepingKarlssonElan 11 9 0 0 0 0 8 9 0 0 0 0
McKeens 10 14 1 1 10 9 11 14 4 3 10 6
NHLTradeRumors 6 6 10 9 2 5 3 6 6 6 8 3
PeteJensen 5 3 0 0 0 0 2 3 1 1 0 0
RotoWire 13 18 2 7 12 15 18 18 7 15 2 7
RotoWorld 3 5 13 15 1 1 1 5 12 12 6 4
ScottCullen 14 13 3 2 5 4 6 13 5 10 9 10
SportsForecaster 15 16 14 12 11 14 16 16 10 11 11 9
SteveLaidlaw 8 8 4 11 6 13 12 8 0 0 0 0
TheHockeyNews 2 2 12 5 13 3 9 2 13 4 5 2

Follow us throughout the year on Twitter @Fantasy_Ref - 15
HISTORICAL
Rankings
Forecaster Pts Total
Pts Rank
Goal Total
Goal Rank
Assist Total
Assist Rank
Win Total
Win Rank
Shutout Total
Shutout Rank
Dobber 4 3 4 5 5 5 3 2 5 6Hockey Le Magazine 5 5 5 3 4 4 4 5 3 4
McKeens 2 1 2 1 2 1 2 4 6 4Scott Cullen 1 2 1 4 1 3 5 6 1 1
Sports Forecaster 6 4 6 6 6 2 3 6 2 5The Hockey News 3 6 3 2 3 6 1 1 3 1
15/16
16/17
17/18
Forecaster Pts Total
Pts Rank
Goal Total
Goal Rank
Assist Total
Assist Rank
Win Total
Win Rank
Shutout Total
Shutout Rank
Daily Face Off 10 10 5 9 8 8 8 4 10 11Dobber 4 1 4 2 6 6 11 2 3 3
Dom 5 6 7 7 4 5 2 7 2 1Hockey Le Magazine 6 5 9 6 5 4 7 6 1 2
Left Wing Lock 7 11 8 10 10 10 1 1 6 5McKeens 2 2 3 1 3 3 9 10 9 9
NHL Trade Rumors 3 4 1 3 2 2 6 3 7 6Roto World 9 8 10 8 9 9 10 12 8 4Scott Cullen 1 3 2 4 1 1 4 8 4 7
Sports Forecaster 11 9 11 11 11 7 5 11 11 10The Hockey News 8 7 6 5 7 11 12 9 5 8
Forecaster Pts Total
Pts Rank
Goal Total
Goal Rank
Assist Total
Assist Rank
Win Total
Win Rank
Shutout Total
Shutout Rank
Daily Face Off 12 12 1 3 12 12 8 4 10 11Dobber 5 1 6 5 9 5 11 2 3 3
Dom 9 11 12 13 10 11 2 7 2 1ESPN 8 5 8 6 7 7 N/A N/A N/A N/A
Hockey Le Magazine 6 3 7 2 3 3 7 6 1 2Left Wing Lock 7 9 2 4 11 13 1 1 6 5
McKeens 3 2 4 1 5 1 9 10 9 9NHL Trade Rumors 4 8 10 10 4 8 6 3 7 6
Pete Jensen N/A N/A N/A N/A N/A N/A 3 5 N/A N/ARoto World 11 13 11 9 8 4 10 12 8 4Scott Cullen 1 6 5 11 1 6 4 8 4 7
Sports Forecaster 13 7 13 7 13 9 5 11 10 11Steve Laidlaw 2 4 3 8 2 2 N/A N/A N/A N/A
The Hockey News 10 10 9 12 6 12 12 9 8 5
Patrick Kane led all scorers with 106 Pts, Braden Holtby recorded the most wins (35) and the
Penguins won their fourth the cup.
Connor McDavid led all scorers with 108 Pts, Connor Hellebuyck re-
corded the most wins (44) and the
Capitals won their first the cup.
Connor McDavid led all scorers with
100 Pts, Braden Holtby and Cam
Talbot recorded the most wins (42) and the Penguins won their fifth the cup.
In the first three seasons, rankings were only calculated for the Top 300 Skaters and Top 40 Goaltender projections. There were also less forecasters being evaluated. Originally in 15/16, the rankings included only six forecasters. It grew to eleven in 16/17, thirteen in 17/18 and this season nineteen forecasters were compared and evaluated. Below are a brief history of skater and goalie projection rankings from years past.
Continued

- Find more at FantasyRef.ca16
The first step of the process is to create a weighted average of the players’ Pts Totals for the three most recent seasons. In Stat Shot, Rob uses a 4 - 2 - 1 weighting which as-sumes “that every season’s data has twice the predictive power as the season previous” (pg. 29, Stat Shot). Another common ratio used to make predictions by Tom Tango is, 5-4-3. This ratio more evenly distributes the predictive power of past season results but is still skewed twoard the most recent season. The base projections in our guide use Rob’s 4 - 2 - 1 ratio. If you are interested in experimenting with your own projections and weightings, visit fantasyref.ca to create and manage your own projections.
20/21 Baseline ProjectionsThe 2020/2021 baseline Pts total projections were created using the 3 steps outlined by Rob Vollman in his book Stat Shot (a must read for all hockey fans). These baseline projections are to be used as a starting point on the journey to coming up with your fi-nal Pts total projections for each player. They are also good to use a reference point to see how your chosen forecaster feels about the players upcomnig season, for example, are they significantly over or under the baseline projections.
Summary of Steps to Create Base Projections
Not all players in the NHL are consistent from year to year. Players who have large swings in their Pts Totals from season to season are more likely to have been influenced by random events. Players who have consistent Pts Totals have less random variation. To account for and remove potential random variation, a correlation analysis is done. Compar-ing the weighted average (done in step 1) to the previous season’s Pts Total results, a correlation analysis will determine how strongly the weighted average matched the actual results. We did this by creating a weighted average of players’ Pts totals from the 2016/17 to 2019/20 season and then determining the correlation coefficient to the 2019/20 season.
Once the correlation coefficient is determined, the players’ weighted Pts Totals need to be regressed toward the league average. This is achieved by adding your weighted average (multiplied by the square root of the correlation coefficient) and the league’s average Pts Total (multiplied by one minus the square root of the correlation coefficient) to get a new Pts Total base without that random variation. Rob Vollman eloquently outlines the process on page 31 in his book.
Step 1 - Weighted Average
Step 2 - Remove Random Variation
The final step is to correct for the player’s age. An age regression is a trend in the player’s stat in reference to the play-er’s age. The age regression that we applied to our baseline projections is outlined on the following page. We used the Delta method using 10 years worth of Pts Total Data. For example, on average, 31 year olds produce 4.4 less points than they did the previous season. So 4.4 is then subtracted off any 31 year old’s baseline projection to adjust for the player’s age. For more details about our age regression read the following two pages.
Step 3 - Adjust for Age
In the tables on the following pages you can find Fanta-syRef ’s 20/21 baseline projections. Projections are only made for all players that played in the 18/19 regular sea-son. Players who are new to the league this season (i.e. 2019 Draft Picks) are not included in these projections.

Follow us throughout the year on Twitter @Fantasy_Ref - 17
20/21 Baseline Projection Player Information (from end of 19/20 season) Past Base Projection Results
Pts Total Pts Rank Player Team Age Pos Pts Total Error Pts Rank Error
72 1 Leon Draisaitl EDM 24 C 87 -40 3 -2
72 2 Connor McDavid EDM 23 C 106 -6 2 0
68 3 Nikita Kucherov TBL 26 RW 106 6 1 6
66 4 Nathan MacKinnon COL 24 C 82 -27 7 -2
63 5 David Pastrnak BOS 23 RW 74 -37 21 -18
61 6 Artemi Panarin NYR 28 LW 75 -36 18 -15
60 7 Brad Marchand BOS 31 LW 79 -23 12 -6
60 8 Patrick Kane CHI 31 RW 84 -14 5 3
56 9 Jonathan Huberdeau FLA 26 LW 75 -18 20 -10
55 10 Auston Matthews TOR 22 C 68 -26 28 -19
55 11 Jack Eichel BUF 23 C 70 -23 24 -14
54 12 Mitch Marner TOR 22 RW 82 4 6 14
52 13 Sebastian Aho CAR 22 F 75 -5 19
52 14 Steven Stamkos TBL 29 C 79 2 10 12
51 15 Aleksander Barkov FLA 24 C 76 2 15 13
51 16 Brayden Point TBL 23 C 79 4 11 15
50 17 Mark Scheifele WPG 26 C 67 -17 31 -15
50 18 Evgeni Malkin PIT 33 C 68 -20 29 -16
49 19 Johnny Gaudreau CGY 26 LW 80 12 8 38
49 20 Alex Ovechkin WSH 34 LW 76 -4 16 2
49 21 Mika Zibanejad NYR 26 C 59 -29 49 -36
48 22 Kyle Connor WPG 23 LW 60 -24 44 -28
48 23 Blake Wheeler WPG 33 RW 75 0 17 9
48 24 John Carlson WSH 30 D 58 -31 50 -38
47 25 Mathew Barzal NYI 22 C 69 -3 26 7
47 26 John Tavares TOR 29 C 77 7 14 22
46 27 Matthew Tkachuk CGY 22 LW 66 -5 33 2
46 28 Teuvo Teravainen CAR 25 F 61 -15 39 -15
45 29 Sean Couturier PHI 27 C 67 -3 30 6
45 30 Patrik Laine WPG 21 RW 59 -14 47 -17
44 31 Claude Giroux PHI 32 C 79 16 13 44
44 32 J.T. Miller VAN 26 C 47 -39 95 -80
44 33 Mark Stone VEG 27 RW 61 -12 40 -10
43 34 Sidney Crosby PIT 32 C 85 29 4 74
43 35 Ryan O’Reilly STL 28 C 60 -10 42 -6
43 36 Elias Pettersson VAN 21 C 47 -31 92 -72
43 37 Anze Kopitar LAK 32 C 58 -15 53 -23
42 38 Jonathan Toews CHI 31 C 56 -14 61 -25
42 39 Dylan Larkin DET 23 C 69 8 25 41
42 40 Evgeny Kuznetsov WSH 27 C 69 7 27 34
42 41 Mikko Rantanen COL 23 RW 80 32 9 121
42 42 Travis Konecny PHI 22 C 47 -25 100 -67
42 43 Ryan Nugent-Hopkins EDM 26 C 55 -15 65 -29
41 44 Tyler Seguin DAL 28 C 73 14 22 46
41 45 Roman Josi NSH 29 D 48 -29 89 -67
41 46 Jakub Voracek PHI 30 RW 62 -5 38 9
40 47 Patrice Bergeron BOS 34 C 59 -7 48 3
40 48 Alex DeBrincat CHI 22 RW 67 14 32 57
40 49 Nicklas Backstrom WSH 32 C 62 -2 37 17
40 50 Elias Lindholm CGY 25 C 57 -6 59 -2
Per 56 Game Season
2020/2021 Skater Baseline Projections
- Find more at FantasyRef.ca18
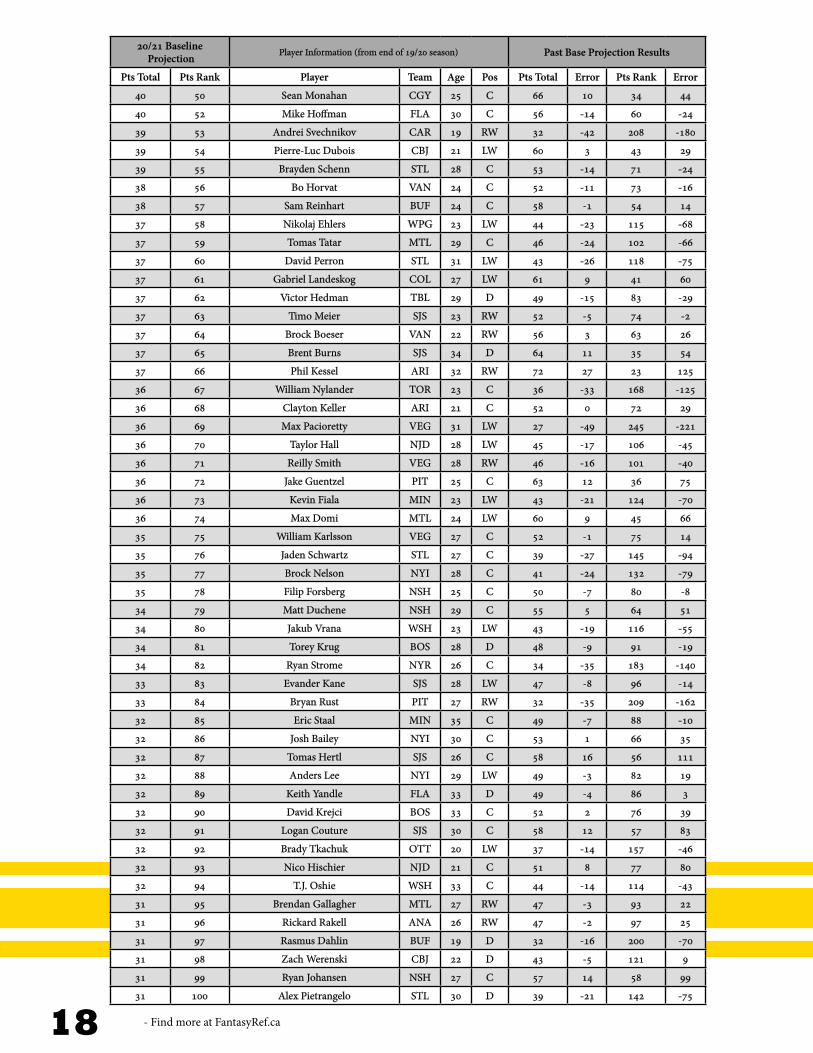
20/21 Baseline Projection
Player Information (from end of 19/20 season) Past Base Projection Results
Pts Total Pts Rank Player Team Age Pos Pts Total Error Pts Rank Error
40 50 Sean Monahan CGY 25 C 66 10 34 44
40 52 Mike Hoffman FLA 30 C 56 -14 60 -24
39 53 Andrei Svechnikov CAR 19 RW 32 -42 208 -180
39 54 Pierre-Luc Dubois CBJ 21 LW 60 3 43 29
39 55 Brayden Schenn STL 28 C 53 -14 71 -24
38 56 Bo Horvat VAN 24 C 52 -11 73 -16
38 57 Sam Reinhart BUF 24 C 58 -1 54 14
37 58 Nikolaj Ehlers WPG 23 LW 44 -23 115 -68
37 59 Tomas Tatar MTL 29 C 46 -24 102 -66
37 60 David Perron STL 31 LW 43 -26 118 -75
37 61 Gabriel Landeskog COL 27 LW 61 9 41 60
37 62 Victor Hedman TBL 29 D 49 -15 83 -29
37 63 Timo Meier SJS 23 RW 52 -5 74 -2
37 64 Brock Boeser VAN 22 RW 56 3 63 26
37 65 Brent Burns SJS 34 D 64 11 35 54
37 66 Phil Kessel ARI 32 RW 72 27 23 125
36 67 William Nylander TOR 23 C 36 -33 168 -125
36 68 Clayton Keller ARI 21 C 52 0 72 29
36 69 Max Pacioretty VEG 31 LW 27 -49 245 -221
36 70 Taylor Hall NJD 28 LW 45 -17 106 -45
36 71 Reilly Smith VEG 28 RW 46 -16 101 -40
36 72 Jake Guentzel PIT 25 C 63 12 36 75
36 73 Kevin Fiala MIN 23 LW 43 -21 124 -70
36 74 Max Domi MTL 24 LW 60 9 45 66
35 75 William Karlsson VEG 27 C 52 -1 75 14
35 76 Jaden Schwartz STL 27 C 39 -27 145 -94
35 77 Brock Nelson NYI 28 C 41 -24 132 -79
35 78 Filip Forsberg NSH 25 C 50 -7 80 -8
34 79 Matt Duchene NSH 29 C 55 5 64 51
34 80 Jakub Vrana WSH 23 LW 43 -19 116 -55
34 81 Torey Krug BOS 28 D 48 -9 91 -19
34 82 Ryan Strome NYR 26 C 34 -35 183 -140
33 83 Evander Kane SJS 28 LW 47 -8 96 -14
33 84 Bryan Rust PIT 27 RW 32 -35 209 -162
32 85 Eric Staal MIN 35 C 49 -7 88 -10
32 86 Josh Bailey NYI 30 C 53 1 66 35
32 87 Tomas Hertl SJS 26 C 58 16 56 111
32 88 Anders Lee NYI 29 LW 49 -3 82 19
32 89 Keith Yandle FLA 33 D 49 -4 86 3
32 90 David Krejci BOS 33 C 52 2 76 39
32 91 Logan Couture SJS 30 C 58 12 57 83
32 92 Brady Tkachuk OTT 20 LW 37 -14 157 -46
32 93 Nico Hischier NJD 21 C 51 8 77 80
32 94 T.J. Oshie WSH 33 C 44 -14 114 -43
31 95 Brendan Gallagher MTL 27 RW 47 -3 93 22
31 96 Rickard Rakell ANA 26 RW 47 -2 97 25
31 97 Rasmus Dahlin BUF 19 D 32 -16 200 -70
31 98 Zach Werenski CBJ 22 D 43 -5 121 9
31 99 Ryan Johansen NSH 27 C 57 14 58 99
31 100 Alex Pietrangelo STL 30 D 39 -21 142 -75
Follow us throughout the year on Twitter @Fantasy_Ref - 19
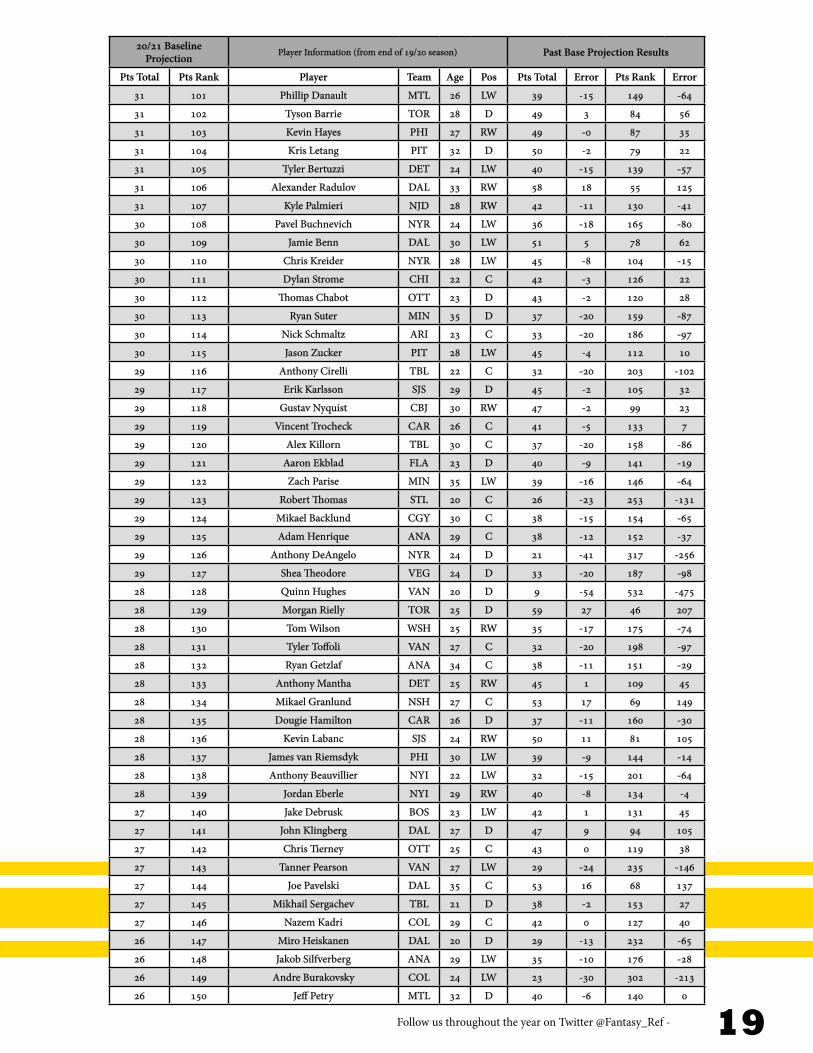
20/21 Baseline Projection
Player Information (from end of 19/20 season) Past Base Projection Results
Pts Total Pts Rank Player Team Age Pos Pts Total Error Pts Rank Error
31 101 Phillip Danault MTL 26 LW 39 -15 149 -64
31 102 Tyson Barrie TOR 28 D 49 3 84 56
31 103 Kevin Hayes PHI 27 RW 49 -0 87 35
31 104 Kris Letang PIT 32 D 50 -2 79 22
31 105 Tyler Bertuzzi DET 24 LW 40 -15 139 -57
31 106 Alexander Radulov DAL 33 RW 58 18 55 125
31 107 Kyle Palmieri NJD 28 RW 42 -11 130 -41
30 108 Pavel Buchnevich NYR 24 LW 36 -18 165 -80
30 109 Jamie Benn DAL 30 LW 51 5 78 62
30 110 Chris Kreider NYR 28 LW 45 -8 104 -15
30 111 Dylan Strome CHI 22 C 42 -3 126 22
30 112 Thomas Chabot OTT 23 D 43 -2 120 28
30 113 Ryan Suter MIN 35 D 37 -20 159 -87
30 114 Nick Schmaltz ARI 23 C 33 -20 186 -97
30 115 Jason Zucker PIT 28 LW 45 -4 112 10
29 116 Anthony Cirelli TBL 22 C 32 -20 203 -102
29 117 Erik Karlsson SJS 29 D 45 -2 105 32
29 118 Gustav Nyquist CBJ 30 RW 47 -2 99 23
29 119 Vincent Trocheck CAR 26 C 41 -5 133 7
29 120 Alex Killorn TBL 30 C 37 -20 158 -86
29 121 Aaron Ekblad FLA 23 D 40 -9 141 -19
29 122 Zach Parise MIN 35 LW 39 -16 146 -64
29 123 Robert Thomas STL 20 C 26 -23 253 -131
29 124 Mikael Backlund CGY 30 C 38 -15 154 -65
29 125 Adam Henrique ANA 29 C 38 -12 152 -37
29 126 Anthony DeAngelo NYR 24 D 21 -41 317 -256
29 127 Shea Theodore VEG 24 D 33 -20 187 -98
28 128 Quinn Hughes VAN 20 D 9 -54 532 -475
28 129 Morgan Rielly TOR 25 D 59 27 46 207
28 130 Tom Wilson WSH 25 RW 35 -17 175 -74
28 131 Tyler Toffoli VAN 27 C 32 -20 198 -97
28 132 Ryan Getzlaf ANA 34 C 38 -11 151 -29
28 133 Anthony Mantha DET 25 RW 45 1 109 45
28 134 Mikael Granlund NSH 27 C 53 17 69 149
28 135 Dougie Hamilton CAR 26 D 37 -11 160 -30
28 136 Kevin Labanc SJS 24 RW 50 11 81 105
28 137 James van Riemsdyk PHI 30 LW 39 -9 144 -14
28 138 Anthony Beauvillier NYI 22 LW 32 -15 201 -64
28 139 Jordan Eberle NYI 29 RW 40 -8 134 -4
27 140 Jake Debrusk BOS 23 LW 42 1 131 45
27 141 John Klingberg DAL 27 D 47 9 94 105
27 142 Chris Tierney OTT 25 C 43 0 119 38
27 143 Tanner Pearson VAN 27 LW 29 -24 235 -146
27 144 Joe Pavelski DAL 35 C 53 16 68 137
27 145 Mikhail Sergachev TBL 21 D 38 -2 153 27
27 146 Nazem Kadri COL 29 C 42 0 127 40
26 147 Miro Heiskanen DAL 20 D 29 -13 232 -65
26 148 Jakob Silfverberg ANA 29 LW 35 -10 176 -28
26 149 Andre Burakovsky COL 24 LW 23 -30 302 -213
26 150 Jeff Petry MTL 32 D 40 -6 140 0

- Find more at FantasyRef.ca20
20/21 Baseline Projection
Player Information (from end of 19/20 season) Past Base Projection Results
Pts Total Pts Rank Player Team Age Pos Pts Total Error Pts Rank Error
26 151 Alex Iafallo LAK 26 C 26 -24 257 -142
26 152 Jesper Bratt NJD 21 W 36 -2 162 37
26 153 Zach Hyman TOR 27 C 35 -8 172 -15
26 154 Viktor Arvidsson NSH 26 LW 47 14 97 147
26 155 Ryan Dzingel CAR 27 C 48 13 90 141
26 156 Yanni Gourde TBL 28 C 46 11 103 128
25 157 Dustin Brown LAK 35 RW 43 2 123 53
25 158 Connor Brown OTT 26 RW 22 -28 313 -198
25 159 Oliver Bjorkstrand CBJ 24 RW 33 -9 192 -25
25 160 Drew Doughty LAK 30 D 43 2 122 54
25 161 Seth Jones CBJ 25 D 45 10 109 122
25 162 Mark Giordano CGY 36 D 49 13 85 133
25 163 Jared McCann PIT 23 C 32 -10 199 -32
25 164 Mats Zuccarello MIN 32 LW 39 -5 148 6
25 165 Ivan Provorov PHI 23 D 33 -10 191 -34
25 165 Kasperi Kapanen TOR 23 RW 33 -9 189 -22
25 167 Ondrej Palat TBL 28 LW 31 -17 211 -81
25 168 Ryan Ellis NSH 29 D 35 -10 173 -25
25 169 Brandon Saad CHI 27 LW 36 -3 167 19
25 170 Neal Pionk WPG 24 D 20 -32 339 -238
25 171 Rasmus Ristolainen BUF 25 D 40 1 138 48
25 172 Anthony Duclair OTT 24 LW 26 -20 252 -112
25 173 Jeff Skinner BUF 27 LW 53 26 67 231
25 174 Paul Stastny VEG 34 C 37 -7 156 -2
25 175 Tyler Johnson TBL 29 C 45 9 108 110
25 176 Cam Atkinson CBJ 30 RW 53 23 70 196
24 177 Samuel Girard COL 21 D 30 -10 223 -43
24 178 Nino Niederreiter CAR 27 RW 42 7 125 106
24 179 Cale Makar COL 21 D 0 0 0 0
24 180 Charlie Coyle BOS 27 C 31 -12 216 -59
24 181 Brett Connolly FLA 27 RW 34 -5 182 4
24 182 Ryan Pulock NYI 25 D 35 -7 170 -3
24 183 Charlie McAvoy BOS 22 D 32 -5 207 -2
24 184 Erik Gustafsson CGY 27 D 43 9 117 121
24 185 Mattias Ekholm NSH 29 D 33 -6 188 -2
24 186 Darnell Nurse EDM 24 D 36 -2 166 33
24 187 Lars Eller WSH 30 C 29 -17 228 -88
24 188 Carl Soderberg ARI 34 C 36 -5 163 13
23 189 Zdeno Chara BOS 42 D 7 -9 589 -151
23 190 Pavel Zacha NJD 22 C 27 -11 250 -51
23 191 Jaccob Slavin CAR 25 D 27 -16 247 -90
23 192 Jake Virtanen VAN 23 RW 23 -20 297 -140
23 193 Adrian Kempe LAK 23 LW 31 -6 213 -8
23 194 Joonas Donskoi COL 27 RW 33 -6 194 -8
23 195 Oliver Ekman-Larsson ARI 28 D 40 5 135 96
23 196 Andreas Athanasiou EDM 25 C 42 12 128 138
23 197 Alexander Kerfoot TOR 25 C 42 9 129 115
22 198 Jean-Gabriel Pageau NYI 27 C 14 -37 429 -318
22 199 Nick Suzuki MTL 20 C 0 0 0 0
22 200 Vladislav Namestnikov NYR 27 C 32 -4 206 12
Follow us throughout the year on Twitter @Fantasy_Ref - 21
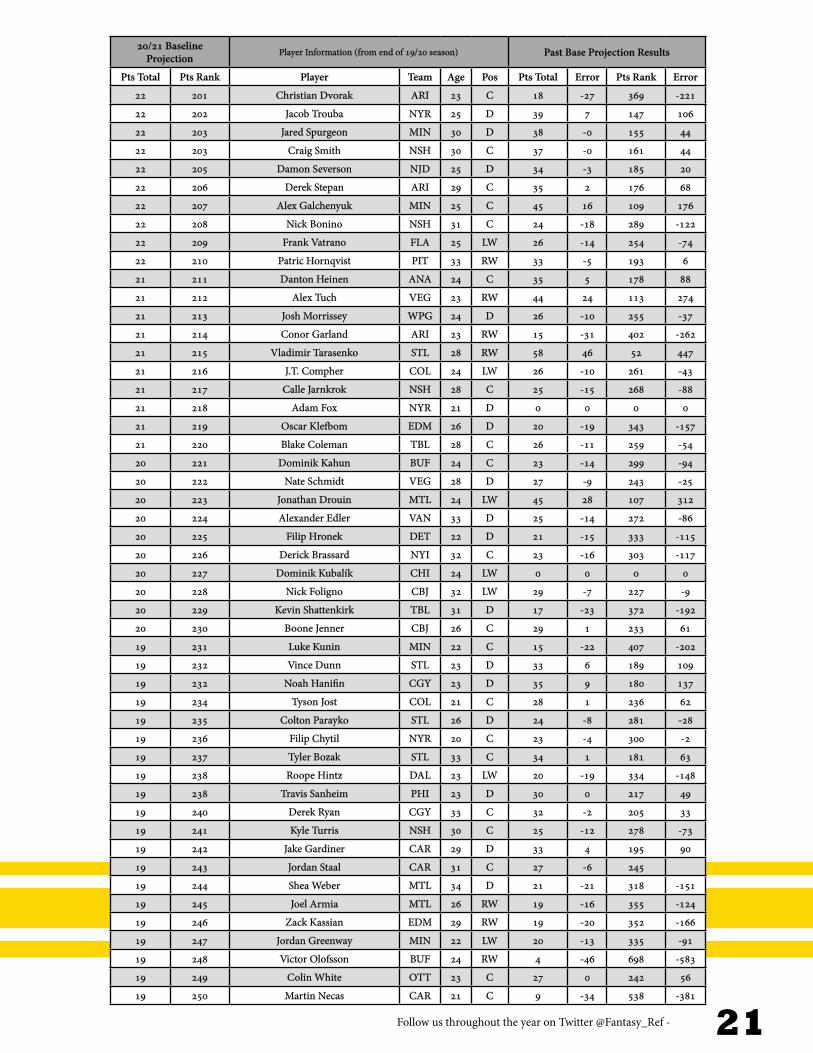
20/21 Baseline Projection
Player Information (from end of 19/20 season) Past Base Projection Results
Pts Total Pts Rank Player Team Age Pos Pts Total Error Pts Rank Error
22 201 Christian Dvorak ARI 23 C 18 -27 369 -221
22 202 Jacob Trouba NYR 25 D 39 7 147 106
22 203 Jared Spurgeon MIN 30 D 38 -0 155 44
22 203 Craig Smith NSH 30 C 37 -0 161 44
22 205 Damon Severson NJD 25 D 34 -3 185 20
22 206 Derek Stepan ARI 29 C 35 2 176 68
22 207 Alex Galchenyuk MIN 25 C 45 16 109 176
22 208 Nick Bonino NSH 31 C 24 -18 289 -122
22 209 Frank Vatrano FLA 25 LW 26 -14 254 -74
22 210 Patric Hornqvist PIT 33 RW 33 -5 193 6
21 211 Danton Heinen ANA 24 C 35 5 178 88
21 212 Alex Tuch VEG 23 RW 44 24 113 274
21 213 Josh Morrissey WPG 24 D 26 -10 255 -37
21 214 Conor Garland ARI 23 RW 15 -31 402 -262
21 215 Vladimir Tarasenko STL 28 RW 58 46 52 447
21 216 J.T. Compher COL 24 LW 26 -10 261 -43
21 217 Calle Jarnkrok NSH 28 C 25 -15 268 -88
21 218 Adam Fox NYR 21 D 0 0 0 0
21 219 Oscar Klefbom EDM 26 D 20 -19 343 -157
21 220 Blake Coleman TBL 28 C 26 -11 259 -54
20 221 Dominik Kahun BUF 24 C 23 -14 299 -94
20 222 Nate Schmidt VEG 28 D 27 -9 243 -25
20 223 Jonathan Drouin MTL 24 LW 45 28 107 312
20 224 Alexander Edler VAN 33 D 25 -14 272 -86
20 225 Filip Hronek DET 22 D 21 -15 333 -115
20 226 Derick Brassard NYI 32 C 23 -16 303 -117
20 227 Dominik Kubalík CHI 24 LW 0 0 0 0
20 228 Nick Foligno CBJ 32 LW 29 -7 227 -9
20 229 Kevin Shattenkirk TBL 31 D 17 -23 372 -192
20 230 Boone Jenner CBJ 26 C 29 1 233 61
19 231 Luke Kunin MIN 22 C 15 -22 407 -202
19 232 Vince Dunn STL 23 D 33 6 189 109
19 232 Noah Hanifin CGY 23 D 35 9 180 137
19 234 Tyson Jost COL 21 C 28 1 236 62
19 235 Colton Parayko STL 26 D 24 -8 281 -28
19 236 Filip Chytil NYR 20 C 23 -4 300 -2
19 237 Tyler Bozak STL 33 C 34 1 181 63
19 238 Roope Hintz DAL 23 LW 20 -19 334 -148
19 238 Travis Sanheim PHI 23 D 30 0 217 49
19 240 Derek Ryan CGY 33 C 32 -2 205 33
19 241 Kyle Turris NSH 30 C 25 -12 278 -73
19 242 Jake Gardiner CAR 29 D 33 4 195 90
19 243 Jordan Staal CAR 31 C 27 -6 245
19 244 Shea Weber MTL 34 D 21 -21 318 -151
19 245 Joel Armia MTL 26 RW 19 -16 355 -124
19 246 Zack Kassian EDM 29 RW 19 -20 352 -166
19 247 Jordan Greenway MIN 22 LW 20 -13 335 -91
19 248 Victor Olofsson BUF 24 RW 4 -46 698 -583
19 249 Colin White OTT 23 C 27 0 242 56
19 250 Martin Necas CAR 21 C 9 -34 538 -381

- Find more at FantasyRef.ca22
20/21 Baseline Projection
Player Information (from end of 19/20 season) Past Base Projection Results
Pts Total Pts Rank Player Team Age Pos Pts Total Error Pts Rank Error
19 251 Artturi Lehkonen MTL 24 LW 26 -5 255 7
19 252 Jack Roslovic WPG 23 C 22 -11 311 -67
19 253 Jakob Chychrun ARI 21 D 27 -3 249 17
18 254 Scott Laughton PHI 25 C 26 -6 262 -9
18 255 Wayne Simmonds BUF 31 RW 25 -5 267
18 256 Mathew Dumba MIN 25 D 30 1 224 61
18 257 Marcus Johansson BUF 29 C 20 -16 342 -124
18 258 Dmitry Orlov WSH 28 D 25 -7 268 -15
18 259 Jonathan Marchessault VEG 29 C 0 0 0 0
18 260 Nikita Gusev NJD 27 LW 0 0 0 0
18 261 Travis Zajac NJD 34 C 29 -1 229 37
18 262 Vinnie Hinostroza ARI 25 C 36 10 169 148
18 263 Alex Goligoski ARI 34 D 20 -17 338 -133
18 264 Matt Niskanen PHI 33 D 19 -20 350 -164
18 265 Tyler Ennis EDM 30 C 18 -25 365 -208
18 266 Conor Sheary PIT 27 LW 27 0 240 58
18 267 Lawson Crouse ARI 22 LW 23 -6 305 -20
18 268 James Neal EDM 32 LW 21 -15 330 -112
18 269 Will Butcher NJD 25 D 31 6 212 115
18 270 Adam Gaudette VAN 23 C 11 -28 495 -309
18 270 Joel Eriksson Ek MIN 23 C 16 -18 395 -157
18 272 Cam Fowler ANA 28 D 21 -12 329 -85
17 273 Jesper Fast NYR 28 RW 20 -14 345 -107
17 274 Ondrej Kase BOS 24 RW 23 -5 294 0
17 275 Evgenii Dadonov FLA 30 RW 0 0 0 0
17 275 Jake Muzzin TOR 30 D 30 3 222 76
17 277 Shayne Gostisbehere PHI 26 D 39 25 143 318
17 278 Esa Lindell DAL 25 D 27 0 241 57
17 279 Nick Ritchie BOS 24 LW 31 6 215 112
17 280 Warren Foegele CAR 23 LW 13 -23 444 -226
17 281 Duncan Keith CHI 36 D 29 -3 226 27
17 282 Jimmy Vesey BUF 26 LW 28 4 237 105
17 283 Andrew Copp WPG 25 C 22 -8 307 -41
17 284 Alex Chiasson EDM 29 RW 30 2 218 76
17 285 Miles Wood NJD 24 LW 28 1 239 59
17 286 Richard Panik WSH 28 RW 30 4 220 97
17 287 Andrew Mangiapane CGY 23 LW 11 -26 483 -278
17 288 Ivan Barbashev STL 24 C 21 -9 319 -53
17 289 Jonas Brodin MIN 26 D 21 -12 324 -80
17 289 Nick Cousins VEG 26 C 24 -5 290 -5
17 289 Radek Faksa DAL 26 C 26 2 266 76
17 292 Hampus Lindholm ANA 26 D 24 -1 290 37
17 293 Brady Skjei CAR 25 D 25 -4 280 5
16 294 Tyler Myers VAN 29 D 27 2 248 79
16 295 Alexander Wennberg CBJ 25 C 25 -1 273 44
16 295 Andreas Johnsson TOR 25 LW 29 4 230 97
16 297 Ryan Donato MIN 23 C 21 -6 326 -28
16 298 Brandon Tanev PIT 28 LW 24 -6 286 -20
16 299 Lucas Wallmark FLA 24 C 21 -9 331 -65
16 300 Brandon Montour BUF 25 D 30 9 225 147
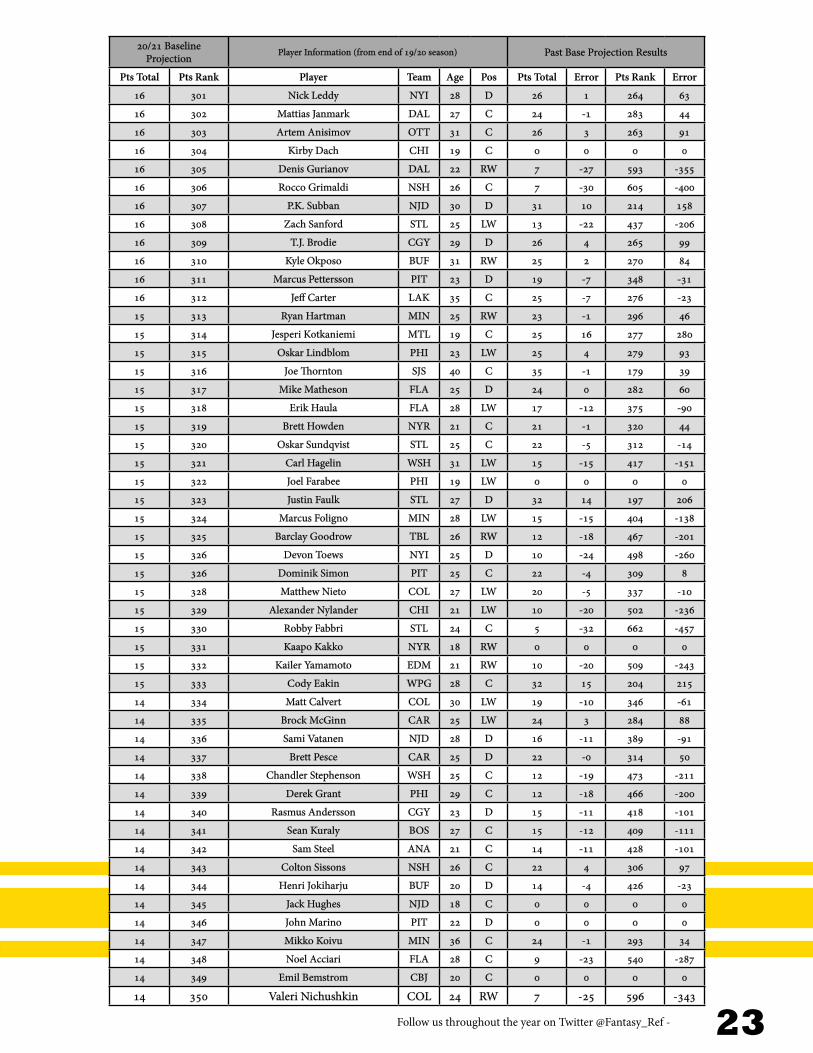
Follow us throughout the year on Twitter @Fantasy_Ref - 23
20/21 Baseline Projection
Player Information (from end of 19/20 season) Past Base Projection Results
Pts Total Pts Rank Player Team Age Pos Pts Total Error Pts Rank Error
16 301 Nick Leddy NYI 28 D 26 1 264 63
16 302 Mattias Janmark DAL 27 C 24 -1 283 44
16 303 Artem Anisimov OTT 31 C 26 3 263 91
16 304 Kirby Dach CHI 19 C 0 0 0 0
16 305 Denis Gurianov DAL 22 RW 7 -27 593 -355
16 306 Rocco Grimaldi NSH 26 C 7 -30 605 -400
16 307 P.K. Subban NJD 30 D 31 10 214 158
16 308 Zach Sanford STL 25 LW 13 -22 437 -206
16 309 T.J. Brodie CGY 29 D 26 4 265 99
16 310 Kyle Okposo BUF 31 RW 25 2 270 84
16 311 Marcus Pettersson PIT 23 D 19 -7 348 -31
16 312 Jeff Carter LAK 35 C 25 -7 276 -23
15 313 Ryan Hartman MIN 25 RW 23 -1 296 46
15 314 Jesperi Kotkaniemi MTL 19 C 25 16 277 280
15 315 Oskar Lindblom PHI 23 LW 25 4 279 93
15 316 Joe Thornton SJS 40 C 35 -1 179 39
15 317 Mike Matheson FLA 25 D 24 0 282 60
15 318 Erik Haula FLA 28 LW 17 -12 375 -90
15 319 Brett Howden NYR 21 C 21 -1 320 44
15 320 Oskar Sundqvist STL 25 C 22 -5 312 -14
15 321 Carl Hagelin WSH 31 LW 15 -15 417 -151
15 322 Joel Farabee PHI 19 LW 0 0 0 0
15 323 Justin Faulk STL 27 D 32 14 197 206
15 324 Marcus Foligno MIN 28 LW 15 -15 404 -138
15 325 Barclay Goodrow TBL 26 RW 12 -18 467 -201
15 326 Devon Toews NYI 25 D 10 -24 498 -260
15 326 Dominik Simon PIT 25 C 22 -4 309 8
15 328 Matthew Nieto COL 27 LW 20 -5 337 -10
15 329 Alexander Nylander CHI 21 LW 10 -20 502 -236
15 330 Robby Fabbri STL 24 C 5 -32 662 -457
15 331 Kaapo Kakko NYR 18 RW 0 0 0 0
15 332 Kailer Yamamoto EDM 21 RW 10 -20 509 -243
15 333 Cody Eakin WPG 28 C 32 15 204 215
14 334 Matt Calvert COL 30 LW 19 -10 346 -61
14 335 Brock McGinn CAR 25 LW 24 3 284 88
14 336 Sami Vatanen NJD 28 D 16 -11 389 -91
14 337 Brett Pesce CAR 25 D 22 -0 314 50
14 338 Chandler Stephenson WSH 25 C 12 -19 473 -211
14 339 Derek Grant PHI 29 C 12 -18 466 -200
14 340 Rasmus Andersson CGY 23 D 15 -11 418 -101
14 341 Sean Kuraly BOS 27 C 15 -12 409 -111
14 342 Sam Steel ANA 21 C 14 -11 428 -101
14 343 Colton Sissons NSH 26 C 22 4 306 97
14 344 Henri Jokiharju BUF 20 D 14 -4 426 -23
14 345 Jack Hughes NJD 18 C 0 0 0 0
14 346 John Marino PIT 22 D 0 0 0 0
14 347 Mikko Koivu MIN 36 C 24 -1 293 34
14 348 Noel Acciari FLA 28 C 9 -23 540 -287
14 349 Emil Bemstrom CBJ 20 C 0 0 0 0
14 350 Valeri Nichushkin COL 24 RW 7 -25 596 -343

- Find more at FantasyRef.ca24
20/21 Baseline Projection
Player Information (from end of 19/20 season) Past Base Projection Results
Pts Total Pts Rank Player Team Age Pos Pts Total Error Pts Rank Error
14 351 Sam Bennett CGY 23 C 29 15 234 227
13 352 Jason Dickinson DAL 24 C 14 -11 425 -98
13 353 Matt Grzelcyk BOS 26 D 18 -7 368 -41
13 354 Valtteri Filppula DET 35 C 21 -3 316 26
13 355 Jason Spezza TOR 36 C 15 -14 399 -114
13 356 Sonny Milano ANA 23 LW 11 -16 495 -197
13 357 Andrew Shaw CHI 28 C 35 23 171 328
13 358 Ryan McDonagh TBL 30 D 34 20 184 277
13 359 Milan Lucic CGY 31 LW 16 -7 384 -30
13 360 Christian Fischer ARI 22 RW 25 14 271 253
13 361 Josh Archibald EDM 27 RW 14 -10 420 -78
13 361 Marcus Sorensen SJS 27 RW 22 1 308 64
13 361 Colin Miller BUF 27 D 26 13 258 219
13 364 Ilya Kovalchuk WSH 36 LW 14 -17 424 -162
13 365 Pat Maroon TBL 31 LW 11 -16 478 -180
13 366 Josh Leivo VAN 26 LW 15 -8 414 -60
13 367 Zemgus Girgensons BUF 26 C 13 -10 435 -81
13 368 Michael Frolik BUF 31 LW 25 8 275 144
13 369 Devin Shore CBJ 25 C 27 13 251 210
13 370 Ian Cole COL 30 D 11 -19 480 -214
13 371 Blake Lizotte LAK 22 C 0 0 0 0
12 372 Mathieu Perreault WPG 32 C 25 8 274 145
12 373 Micheal Ferland VAN 27 LW 39 33 150 468
12 374 Josh Anderson CBJ 25 RW 40 35 136 503
12 375 Alex Steen STL 35 C 24 4 287 100
12 376 Casey Cizikas NYI 28 C 23 6 301 118
12 377 Ben Chiarot MTL 28 D 15 -9 415 -73
12 378 Brendan Lemieux NYR 23 LW 13 -8 433 -61
12 379 Casey Mittelstadt BUF 21 C 23 12 298 226
12 380 Filip Zadina DET 20 RW 9 -8 532 -113
12 381 Ryan Graves COL 24 D 4 -26 683 -417
12 382 Michael Raffl PHI 31 LW 11 -13 487 -145
12 383 Joel Edmundson CAR 26 D 9 -15 527 -185
12 384 Corey Perry DAL 34 RW 14 -11 431 -104
12 385 Tyler Pitlick PHI 28 C 12 -12 458 -116
12 386 Drake Caggiula CHI 25 LW 19 1 359 44
12 387 Ethan Bear EDM 22 D 0 0 0 0
12 388 Troy Stecher VAN 25 D 16 -4 390 -3
12 388 Olli Maatta CHI 25 D 16 -4 391 -4
12 390 Justin Williams CAR 38 RW 40 27 137 340
12 391 Erik Johnson COL 31 D 16 -3 398 -4
12 392 Michal Kempny WSH 29 D 18 -3 361 11
12 393 Brandon Carlo BOS 23 D 11 -11 483 -119
12 394 Evan Rodrigues PIT 26 C 23 11 304 195
12 395 Justin Braun PHI 32 D 15 -8 411 -57
12 396 Adam Boqvist CHI 19 D 0 0 0 0
11 397 Connor Murphy CHI 26 D 10 -12 514 -150
11 398 Marc-Edouard Vlasic SJS 32 D 26 8 260 143
11 399 Sean Walker LAK 25 D 6 -22 617 -323
11 400 Troy Terry ANA 22 C 12 -5 464 -45
Follow us throughout the year on Twitter @Fantasy_Ref - 25
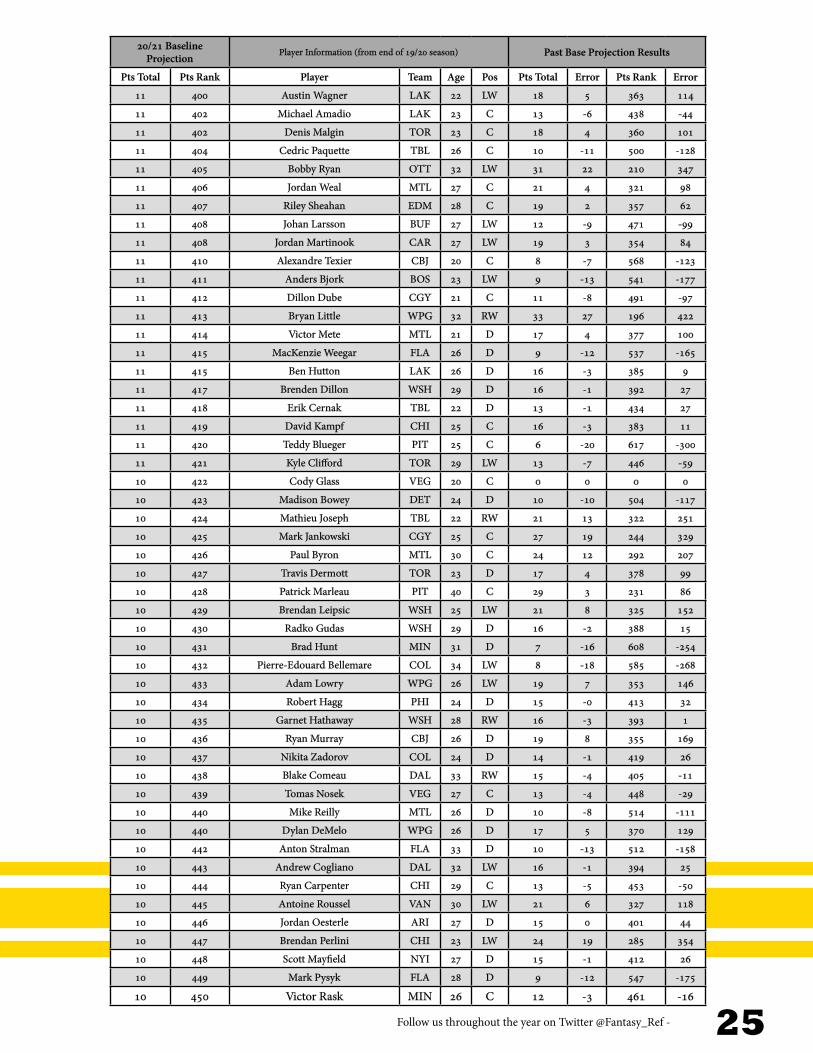
20/21 Baseline Projection
Player Information (from end of 19/20 season) Past Base Projection Results
Pts Total Pts Rank Player Team Age Pos Pts Total Error Pts Rank Error
11 400 Austin Wagner LAK 22 LW 18 5 363 114
11 402 Michael Amadio LAK 23 C 13 -6 438 -44
11 402 Denis Malgin TOR 23 C 18 4 360 101
11 404 Cedric Paquette TBL 26 C 10 -11 500 -128
11 405 Bobby Ryan OTT 32 LW 31 22 210 347
11 406 Jordan Weal MTL 27 C 21 4 321 98
11 407 Riley Sheahan EDM 28 C 19 2 357 62
11 408 Johan Larsson BUF 27 LW 12 -9 471 -99
11 408 Jordan Martinook CAR 27 LW 19 3 354 84
11 410 Alexandre Texier CBJ 20 C 8 -7 568 -123
11 411 Anders Bjork BOS 23 LW 9 -13 541 -177
11 412 Dillon Dube CGY 21 C 11 -8 491 -97
11 413 Bryan Little WPG 32 RW 33 27 196 422
11 414 Victor Mete MTL 21 D 17 4 377 100
11 415 MacKenzie Weegar FLA 26 D 9 -12 537 -165
11 415 Ben Hutton LAK 26 D 16 -3 385 9
11 417 Brenden Dillon WSH 29 D 16 -1 392 27
11 418 Erik Cernak TBL 22 D 13 -1 434 27
11 419 David Kampf CHI 25 C 16 -3 383 11
11 420 Teddy Blueger PIT 25 C 6 -20 617 -300
11 421 Kyle Clifford TOR 29 LW 13 -7 446 -59
10 422 Cody Glass VEG 20 C 0 0 0 0
10 423 Madison Bowey DET 24 D 10 -10 504 -117
10 424 Mathieu Joseph TBL 22 RW 21 13 322 251
10 425 Mark Jankowski CGY 25 C 27 19 244 329
10 426 Paul Byron MTL 30 C 24 12 292 207
10 427 Travis Dermott TOR 23 D 17 4 378 99
10 428 Patrick Marleau PIT 40 C 29 3 231 86
10 429 Brendan Leipsic WSH 25 LW 21 8 325 152
10 430 Radko Gudas WSH 29 D 16 -2 388 15
10 431 Brad Hunt MIN 31 D 7 -16 608 -254
10 432 Pierre-Edouard Bellemare COL 34 LW 8 -18 585 -268
10 433 Adam Lowry WPG 26 LW 19 7 353 146
10 434 Robert Hagg PHI 24 D 15 -0 413 32
10 435 Garnet Hathaway WSH 28 RW 16 -3 393 1
10 436 Ryan Murray CBJ 26 D 19 8 355 169
10 437 Nikita Zadorov COL 24 D 14 -1 419 26
10 438 Blake Comeau DAL 33 RW 15 -4 405 -11
10 439 Tomas Nosek VEG 27 C 13 -4 448 -29
10 440 Mike Reilly MTL 26 D 10 -8 514 -111
10 440 Dylan DeMelo WPG 26 D 17 5 370 129
10 442 Anton Stralman FLA 33 D 10 -13 512 -158
10 443 Andrew Cogliano DAL 32 LW 16 -1 394 25
10 444 Ryan Carpenter CHI 29 C 13 -5 453 -50
10 445 Antoine Roussel VAN 30 LW 21 6 327 118
10 446 Jordan Oesterle ARI 27 D 15 0 401 44
10 447 Brendan Perlini CHI 23 LW 24 19 285 354
10 448 Scott Mayfield NYI 27 D 15 -1 412 26
10 449 Mark Pysyk FLA 28 D 9 -12 547 -175
10 450 Victor Rask MIN 26 C 12 -3 461 -16
- Find more at FantasyRef.ca26
20/21 Baseline Projection
Player Information (from end of 19/20 season) Past Base Projection Results
Pts Total Pts Rank Player Team Age Pos Pts Total Error Pts Rank Error
10 451 Zack Smith CHI 31 C 22 9 310 167
9 452 Nic Dowd WSH 29 C 11 -7 479 -76
9 453 Cody Ceci TOR 26 D 19 10 351 206
9 454 Alec Martinez VEG 32 D 15 -3 416 -13
9 455 Rasmus Sandin TOR 19 D 0 0 0 0
9 456 Loui Eriksson VAN 34 LW 17 2 371 74
9 457 Leo Komarov NYI 33 C 18 1 367 52
9 458 Austin Watson NSH 28 LW 12 -5 458 -39
9 459 Dennis Cholowski DET 21 D 16 7 381 176
9 460 William Carrier VEG 25 LW 7 -15 612 -248
9 460 Markus Nutivaara CBJ 25 D 19 8 347 177
9 462 Carter Rowney ANA 30 RW 10 -12 497 -133
9 463 Nick Bjugstad PIT 27 C 28 26 238 460
9 464 Darren Helm DET 33 C 13 -5 440 -37
9 465 Ilya Mikheyev TOR 25 F 0 0 0 0
9 466 David Savard CBJ 29 D 21 8 323 154
9 467 Max Jones ANA 21 LW 11 -3 491 -30
9 467 Max Comtois ANA 21 LW 12 -1 468 9
9 467 Drake Batherson OTT 21 C 13 1 447 52
9 470 Nick Paul OTT 24 LW 3 -20 718 -364
9 471 Chris Tanev VAN 30 D 7 -17 590 -248
9 472 Brian Boyle FLA 35 C 14 -4 423 -20
9 472 Frans Nielsen DET 35 C 24 14 287 249
9 474 Mike Green EDM 34 D 21 8 328 149
9 475 Matt Roy LAK 24 D 5 -16 662 -290
9 476 Colton Sceviour FLA 30 C 12 -7 456 -62
9 477 Ryan Lindgren NYR 21 D 0 0 0 0
9 478 Jujhar Khaira EDM 25 LW 18 6 366 133
9 478 Adam Pelech NYI 25 D 19 8 349 175
9 480 Justin Schultz PIT 29 D 13 -1 441 20
9 481 Riley Nash CBJ 30 C 15 -1 403 35
9 482 Jake McCabe BUF 26 D 10 -5 514 -69
9 483 Mikkel Boedker OTT 30 RW 30 25 219 420
9 484 Michael Del Zotto ANA 29 D 9 -8 535 -116
9 485 Philippe Myers PHI 23 D 5 -14 644 -250
8 486 Josh Manson ANA 28 D 17 7 375 161
8 487 Zach Aston-Reese PIT 25 C 12 -3 473 -28
8 488 Marco Scandella STL 29 D 11 -4 490 -45
8 489 Jacob Larsson ANA 22 D 8 -5 584 -107
8 490 Haydn Fleury CAR 23 D 7 -10 599 -180
8 491 Melker Karlsson SJS 29 C 11 -3 477 -16
8 492 Gabriel Vilardi LAK 20 C 0 0 0 0
8 492 Morgan Frost PHI 20 C 0 0 0 0
8 492 Noah Dobson NYI 20 D 0 0 0 0
8 495 Michael Grabner ARI 32 RW 16 3 397 80
8 496 Travis Hamonic CGY 29 D 11 -3 481 -20
8 497 Dante Fabbro NSH 21 D 9 -4 552 -75
8 498 Brian Dumoulin PIT 28 D 23 13 295 241
8 499 Frederik Gauthier TOR 24 C 9 -5 525 -64
8 500 Barrett Hayton ARI 19 C 0 0 0 0
Follow us throughout the year on Twitter @Fantasy_Ref - 27
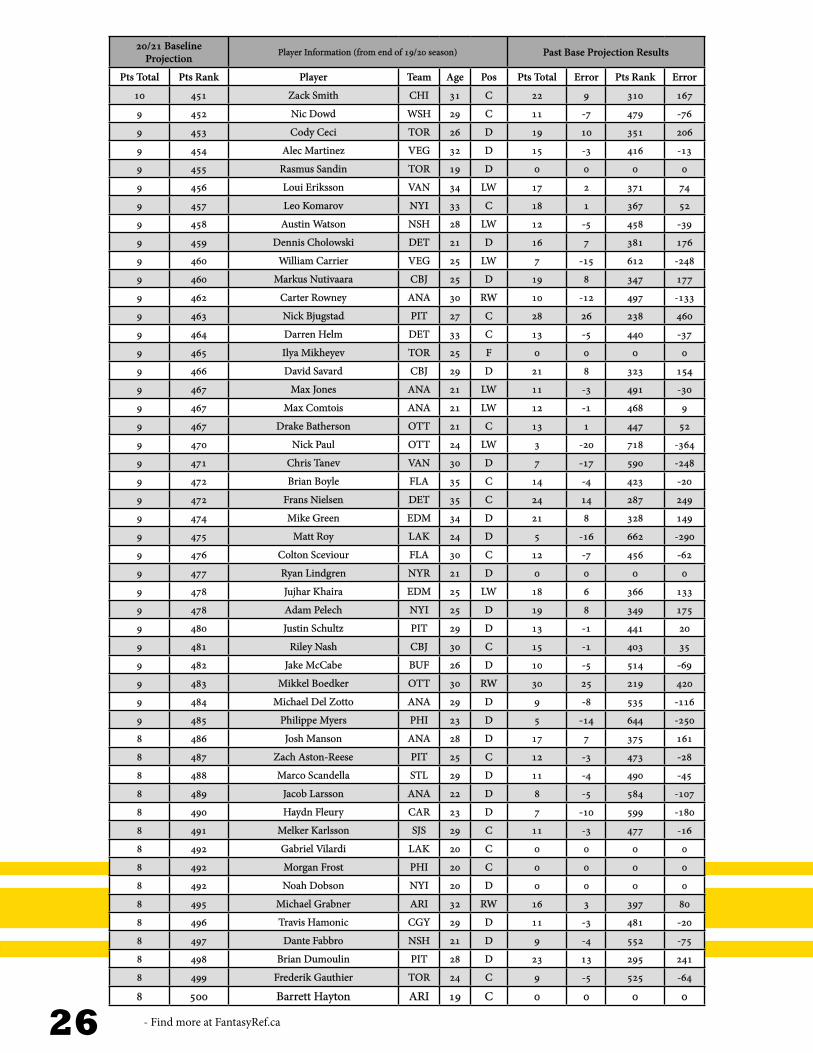
20/21 Baseline Projection
Player Information (from end of 19/20 season) Past Base Projection Results
Pts Total Pts Rank Player Team Age Pos Pts Total Error Pts Rank Error
8 501 Daniel Sprong ANA 22 RW 20 18 344 354
8 502 Tobias Rieder CGY 27 C 12 0 457 42
8 503 Vladislav Gavrikov CBJ 24 D 0 0 0 0
8 504 Brandon Sutter VAN 30 C 8 -12 563 -176
8 505 Pierre Engvall TOR 23 LW 0 0 0 0
8 505 Nicolas Aube-Kubel PHI 23 RW 4 -14 689 -286
8 507 Mario Ferraro SJS 21 D 0 0 0 0
8 507 Nicolas Hague VEG 21 D 0 0 0 0
8 509 Chris Wagner BOS 28 C 15 3 406 93
8 510 Travis Boyd WSH 26 C 11 -1 489 10
8 511 Sam Gagner DET 30 C 13 -2 439 6
8 512 Stefan Noesen PIT 26 RW 10 -1 500 24
8 513 Matt Benning EDM 25 D 15 6 400 157
8 514 Brad Richardson ARI 34 C 20 7 336 141
8 515 Isac Lundestrom ANA 20 C 9 4 550 89
7 516 Caleb Jones EDM 22 D 8 -2 560 -24
7 516 Jonas Siegenthaler WSH 22 D 7 -4 593 -69
7 518 Sammy Blais STL 23 LW 6 -9 615 -170
7 519 Ryan Reaves VEG 33 RW 11 -6 476 -57
7 520 Nick Holden VEG 32 D 10 -6 506 -68
7 521 Tyler Motte VAN 24 C 12 2 460 76
7 522 Jamie Oleksiak DAL 27 D 11 -1 494 5
7 523 Nikita Zaitsev OTT 28 D 10 -4 521 -60
7 524 Jordan Kyrou STL 21 C 10 -0 517 19
7 525 Nick Jensen WSH 29 D 15 5 408 128
7 526 Erik Brannstrom OTT 20 D 8 3 586 53
7 527 Ville Heinola WPG 18 D 0 0 0 0
7 528 Nicolas Roy VEG 22 C 0 0 0 0
7 528 Oliver Kylington CGY 22 D 9 1 530 43
7 530 Matt Luff LAK 22 RW 11 5 488 130
7 531 Michael Dal Colle NYI 23 LW 8 -4 576 -77
7 532 Joey Anderson NJD 21 RW 12 5 468 127
7 533 Martin Kaut COL 20 RW 0 0 0 0
7 534 Jayce Hawryluk OTT 24 C 8 -4 566 -67
7 535 Mark Borowiecki OTT 30 D 4 -17 706 -334
7 535 Luke Glendening DET 30 C 16 6 382 154
7 537 Brendan Guhle ANA 22 D 7 -2 601 -44
7 538 Adam Larsson EDM 27 D 16 9 396 199
7 539 Markus Granlund EDM 26 C 17 12 374 265
7 540 Jacob de La Rose DET 24 LW 10 -0 511 25
7 541 Justin Holl TOR 28 D -0 -21 796 -424
7 542 Scott Harrington CBJ 26 D 9 0 527 30
7 543 Brayden McNabb VEG 29 D 10 0 499 37
7 544 David Gustafsson WPG 19 C 0 0 0 0
7 544 Liam Foudy CBJ 19 C 0 0 0 0
7 546 Nate Thompson PHI 35 C 6 -12 623 -220
6 547 Logan Brown OTT 21 C 8 -1 558
6 548 Tucker Poolman WPG 26 D 0 0 0 0
6 548 Brett Kulak MTL 26 D 10 2 505 68
6 550 Adam Erne DET 24 LW 16 10 386 232

- Find more at FantasyRef.ca28
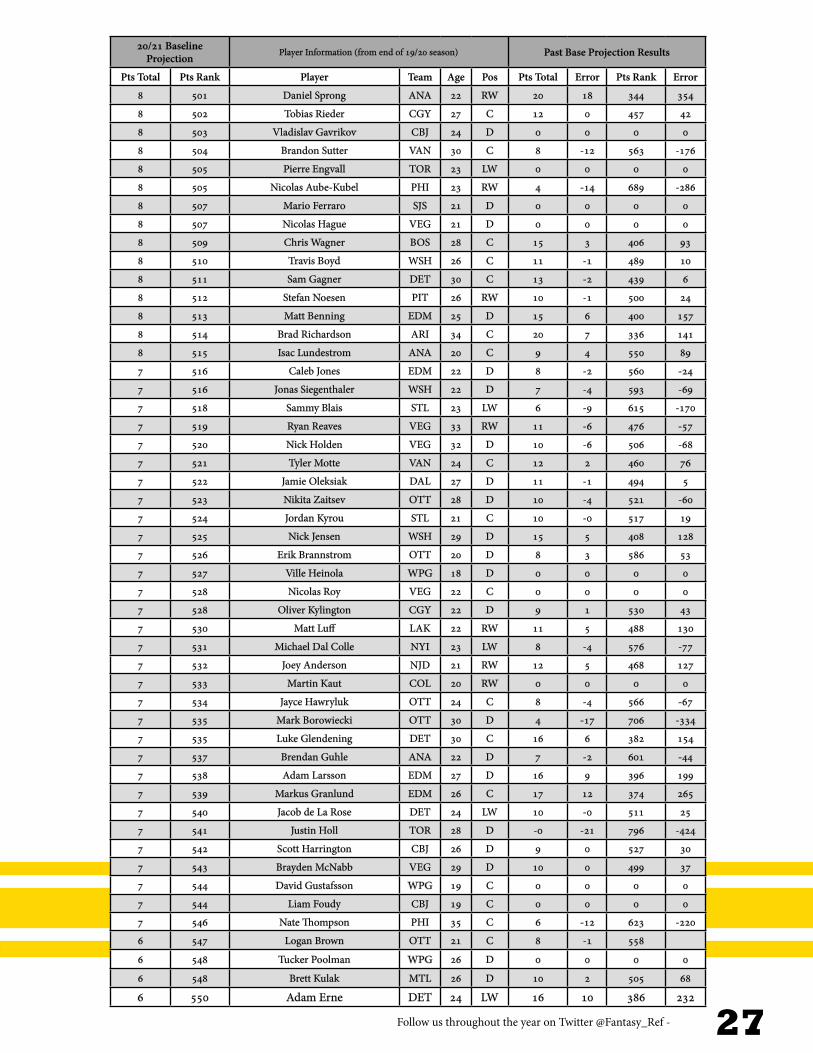
20/21 Baseline Projection
Player Information (from end of 19/20 season) Past Base Projection Results
Pts Total Pts Rank Player Team Age Pos Pts Total Error Pts Rank Error
6 550 Nikolay Goldobin VAN 24 LW 21 21 331 468
6 552 Rudolfs Balcers OTT 22 LW 12 9 455 234
6 553 Trevor Lewis LAK 33 C 9 -5 534 -73
6 554 Martin Frk LAK 26 RW 9 -0 546 11
6 555 Nicolas Deslauriers ANA 28 LW 5 -10 656 -211
6 555 Trevor van Riemsdyk CAR 28 D 10 0 503 33
6 557 Oliver Wahlstrom NYI 19 RW 0 0 0 0
6 558 Henrik Borgström FLA 22 C 16 16 387 412
6 559 Patrik Nemeth DET 27 D 9 -1 539 -3
6 560 Pontus Aberg TOR 26 LW 16 15 380 352
6 561 Cal Clutterbuck NYI 32 RW 18 10 362 211
6 562 Trevor Moore LAK 24 LW 6 -6 624 -125
6 563 Jason Demers ARI 31 D 5 -8 658 -181
6 564 Dylan Gambrell SJS 23 C 0 0 0 0
6 565 Filip Chlapik OTT 22 C 7 -0 610 -15
6 566 Brent Seabrook CHI 34 D 22 17 315 324
6 567 Josh Mahura ANA 21 D 11 6 491 148
6 568 Kris Russell EDM 32 D 12 2 472 64
6 569 Tage Thompson BUF 22 C 14 14 430 369
6 570 Michael Anderson LAK 20 D 0 0 0 0
6 570 Klim Kostin STL 20 C 0 0 0 0
6 570 Martin Fehervary WSH 20 D 0 0 0 0
6 570 Jason Robertson DAL 20 LW 0 0 0 0
6 570 Timothy Liljegren TOR 20 D 0 0 0 0
6 570 Jack Studnicka BOS 20 C 0 0 0 0
6 576 Carter Verhaeghe TBL 24 C 0 0 0 0
6 576 Sam Lafferty PIT 24 C 0 0 0 0
6 576 Curtis Lazar BUF 24 C 0 0 0 0
6 579 Jansen Harkins WPG 22 C 0 0 0 0
6 579 Carl Grundstrom LAK 22 RW 8 3 560 79
6 581 Kevin Stenlund CBJ 23 C 0 0 0 0
6 582 Greg McKegg NYR 27 C 7 -4 607 -83
6 583 Andy Greene NYI 37 D 10 -7 510 -91
6 584 Jordie Benn VAN 32 D 14 6 422 151
6 585 Nathan Beaulieu WPG 27 D 9 -0 555 2
6 586 Nikolai Prokhorkin LAK 26 LW 0 0 0 0
6 586 Kevin Rooney NJD 26 C 4 -7 685 -161
6 588 Jaret Anderson-Dolan LAK 20 C 8 8 568 231
6 589 Carson Soucy MIN 25 D 0 0 0 0
6 589 Slater Koekkoek CHI 25 D 6 -6 617 -118
6 591 Mirco Mueller NJD 24 D 9 1 549 24
6 592 Colin Wilson COL 30 C 20 15 341 298
6 593 Maxime Lajoie OTT 22 D 13 13 445 354
6 594 Vladislav Kamenev COL 23 LW 7 -2 599 -42
6 594 Taro Hirose DET 23 LW 8 -0 576 -3
6 596 Libor Hajek NYR 21 D 9 3 552 66
5 597 Johnny Boychuk NYI 36 D 9 -4 524 -47
5 598 Nicolas Beaudin CHI 20 D 0 0 0 0
5 598 Joshua Norris OTT 20 C 0 0 0 0
5 600 Eric Robinson CBJ 24 LW 0 0 0 0

Follow us throughout the year on Twitter @Fantasy_Ref - 29
20/21 Baseline Projection
Player Information (from end of 19/20 season) Past Base Projection Results
Pts Total Pts Rank Player Team Age Pos Pts Total Error Pts Rank Error
5 600 Mason Appleton WPG 24 C 7 -2 596 -39
5 602 Mitchell Stephens TBL 22 C 0 0 0 0
5 603 Noah Gregor SJS 21 C 0 0 0 0
5 603 Riley Stillman FLA 21 D 0 0 0 0
5 605 Jonathon Merrill VEG 27 D 9 1 555 18
5 605 Sven Baertschi VAN 27 LW 15 13 409 289
5 607 David Backes ANA 35 C 17 10 379 216
5 608 Danny DeKeyser DET 29 D 13 8 452 187
5 609 Justin Abdelkader DET 32 LW 19 16 358 331
5 610 Dmitry Kulikov WPG 29 D 4 -8 694 -195
5 610 Zach Bogosian TBL 29 D 9 1 526 47
5 612 Joakim Nordstrom BOS 27 C 8 -0 575 -2
5 613 Connor Carrick NJD 25 D 10 3 507 88
5 614 Tim Schaller LAK 29 LW 9 2 535 60
5 615 Tobias Bjornfot LAK 18 D 0 0 0 0
5 616 Dmytro Timashov DET 23 LW 0 0 0 0
5 617 Radim Simek SJS 27 D 5 -6 676 -152
5 618 Jesper Boqvist NJD 21 C 0 0 0 0
5 618 Morgan Geekie CAR 21 C 0 0 0 0
5 620 Jack Johnson PIT 33 D 6 -7 631 -154
5 621 Erik Gudbranson PIT 28 D 5 -6 641 -117
5 622 Jan Rutta TBL 29 D 7 -1 588 -15
5 623 Christoffer Ehn DET 23 C 9 4 541 98
5 624 Lias Andersson NYR 21 C 12 11 468 264
5 625 Calvin de Haan CHI 28 D 9 2 529 66
5 626 Brett Ritchie BOS 26 RW 6 -1 628 -33
5 627 Mackenzie MacEachern STL 25 LW 4 -8 707 -208
5 628 Alexander True SJS 22 F 0 0 0 0
5 629 Jay Beagle VAN 34 RW 8 -2 564 -28
5 630 Marc Staal NYR 33 D 5 -8 667 -190
5 631 Kieffer Bellows NYI 21 LW 0 0 0 0
5 631 Andrew Peeke CBJ 21 D 0 0 0 0
4 633 Dominic Toninato FLA 25 C 2 -11 742 -265
4 634 Matt Martin NYI 30 LW 9 -1 548 -12
4 635 Austin Czarnik CGY 27 C 11 7 486 182
4 636 Ryan Poehling MTL 21 C 10 8 517 181
4 636 Michael McLeod NJD 21 C 10 8 517 181
4 638 Sami Niku WPG 23 D 7 1 609 9
4 639 Joakim Ryan LAK 26 D 6 -0 628 -10
4 640 Rasmus Asplund BUF 22 F 0 0 0 0
4 640 Julien Gauthier CAR 22 RW 0 0 0 0
4 642 Christian Jaros OTT 23 D 10 7 523 166
4 643 Givani Smith DET 21 RW 0 0 0 0
4 644 Ron Hainsey OTT 38 D 12 -2 465 -4
4 645 Tim Heed SJS 29 D 8 2 580 38
4 646 John Hayden NJD 24 C 8 3 579 60
4 647 Taylor Fedun DAL 31 D 2 -9 760 -236
4 648 Colin Blackwell NSH 26 C -1 -13 803 -304
4 649 John Moore BOS 29 D 10 6 513 155
4 650 Zack MacEwen VAN 23 C 5 -2 670 -75

- Find more at FantasyRef.ca30
20/21 Baseline Projection
Player Information (from end of 19/20 season) Past Base Projection Results
Pts Total Pts Rank Player Team Age Pos Pts Total Error Pts Rank Error
4 650 Matthew Highmore CHI 23 LW 0 0 0 0
4 652 Vladimir Sobotka BUF 32 C 13 9 451 217
4 653 Dryden Hunt FLA 24 LW 7 2 591 48
4 654 Braydon Coburn TBL 34 D 13 8 442 197
4 655 Derrick Pouliot STL 26 D 11 11 482 317
4 656 Christian Djoos WSH 25 D 10 6 507 161
4 657 Brian Gibbons CAR 31 C 14 14 432 367
4 658 Yakov Trenin NSH 23 C 0 0 0 0
4 659 Derek Forbort CGY 27 D 12 11 462 270
4 660 Connor Bunnaman PHI 21 F 0 0 0 0
4 660 Nicholas Caamano DAL 21 RW 0 0 0 0
4 662 Josh Brown FLA 26 D 0 -10 793 -257
4 663 Antti Suomela SJS 25 C 5 -3 647 -74
4 663 Charles Hudon MTL 25 LW 12 10 473 225
4 665 Karson Kuhlman BOS 24 C 4 -3 683 -88
4 666 Jeremy Lauzon BOS 22 D 6 4 636 62
4 666 Zachary Senyshyn BOS 22 RW 6 4 636 62
4 668 Brett Seney NJD 23 LW 11 11 483 316
4 669 Gabriel Bourque WPG 29 LW 5 -2 650 -55
4 670 Valentin Zykov VEG 24 LW 6 1 620 19
4 671 Nick Shore TOR 27 C 0 0 0 0
4 672 Juuso Riikola PIT 26 D 2 -6 757 -184
4 673 Brendan Smith NYR 30 D 7 -2 595 -38
4 674 Nicholas Merkley NJD 22 RW 0 0 0 0
4 675 Vitaly Abramov OTT 21 RW 8 7 573 159
4 675 Cale Fleury MTL 21 D 0 0 0 0
4 675 Eetu Luostarinen CAR 21 C 0 0 0 0
4 675 Lean Bergmann SJS 21 F 0 0 0 0
4 675 Timothy Gettinger NYR 21 LW 0 0 0 0
4 675 Tyler Benson EDM 21 LW 0 0 0 0
4 675 Gustav Lindstrom DET 21 D 0 0 0 0
4 682 Tom Kuhnhackl NYI 28 RW 6 -1 633 -38
4 682 Par Lindholm BOS 28 C 6 -1 633 -38
4 684 Phillip Di Giuseppe NYR 26 LW 5 -0 675 -36
3 685 Dylan Sikura CHI 24 C 7 3 604 64
3 686 Michael Stone CGY 29 D 3 -5 715 -142
3 687 Dean Kukan CBJ 26 D 3 -3 721 -103
3 688 Kurtis MacDermid LAK 25 D 3 -6 723 -166
3 689 Carsen Twarynski PHI 22 F 0 0 0 0
3 689 Kyle Capobianco ARI 22 D 5 4 659 73
3 689 Mathieu Olivier NSH 22 F 0 0 0 0
3 689 Lucas Carlsson CHI 22 D 0 0 0 0
3 689 Alexander Volkov TBL 22 RW 0 0 0 0
3 689 J.C. Beaudin OTT 22 C 0 0 0 0
3 689 Jonathan Davidsson OTT 22 RW 0 0 0 0
3 696 Aleksi Saarela FLA 23 C 0 0 0 0
3 696 Mikhail Vorobyev PHI 23 C 5 1 644 24
3 698 Joachim Blichfeld SJS 21 W 0 0 0 0
3 698 Kale Clague LAK 21 D 0 0 0 0
3 698 Trent Frederic BOS 21 C 0 0 0 0

Follow us throughout the year on Twitter @Fantasy_Ref - 31
20/21 Baseline Projection
Player Information (from end of 19/20 season) Past Base Projection Results
Pts Total Pts Rank Player Team Age Pos Pts Total Error Pts Rank Error
3 698 Brandon Hagel CHI 21 LW 0 0 0 0
3 698 Nikolai Knyzhov SJS 21 D 0 0 0 0
3 698 Otto Koivula NYI 21 LW 0 0 0 0
3 698 Janne Kuokkanen NJD 21 C 0 0 0 0
3 698 Beck Malenstyn WSH 21 LW 0 0 0 0
3 698 German Rubtsov PHI 21 C 0 0 0 0
3 698 Conor Timmins COL 21 D 0 0 0 0
3 698 Urho Vaakanainen BOS 21 D 0 0 0 0
3 709 Luca Sbisa WPG 30 D 2 -10 733 -234
3 710 Dale Weise MTL 31 RW 3 -3 713 -95
3 711 Joakim Nygard EDM 27 F 0 0 0 0
3 712 Jay Bouwmeester STL 36 D 5 -5 657 -121
3 713 Gaetan Haas EDM 28 F 0 0 0 0
3 714 Alex Biega DET 31 D 6 3 614 75
3 715 Stephen Johns DAL 27 D 0 0 0 0
3 716 Brandon Pirri VEG 28 C 10 8 521 177
3 717 Kiefer Sherwood ANA 24 RW 8 7 566 166
3 718 Keegan Kolesar VEG 22 RW 0 0 0 0
3 718 Otto Leskinen MTL 22 D 0 0 0 0
3 718 Joona Luoto WPG 22 F 0 0 0 0
3 718 Brennan Menell MIN 22 D 0 0 0 0
3 718 Calvin Thurkauf CBJ 22 C 0 0 0 0
3 718 Colton White NJD 22 D 0 0 0 0
3 718 Danil Yurtaykin SJS 22 F 0 0 0 0
3 725 Dennis Gilbert CHI 23 D 0 0 0 0
3 725 Adam Brooks TOR 23 C 0 0 0 0
3 727 Troy Brouwer STL 34 RW 13 12 450 282
3 728 Matthew Peca MTL 26 C 6 4 632 66
3 729 Anthony Bitetto WPG 29 D 0 -9 781 -224
3 730 Christian Wolanin OTT 24 D 9 9 545 254
3 731 Robert Bortuzzo STL 30 D 7 -0 602 -7
3 732 Oscar Fantenberg VAN 28 D 3 -4 716 -121
3 733 Greg Pateryn MIN 29 D 5 1 650 18
3 734 Ross Johnston NYI 25 LW 5 -0 673 -34
3 735 Nic Petan TOR 24 C 4 -0 698 -30
2 736 Jake Evans MTL 23 C 0 0 0 0
2 737 Boo Nieves NYR 26 C 7 7 605 194
2 738 Joe Hicketts DET 23 D 0 0 0 0
2 739 Joel Kellman SJS 25 F 0 0 0 0
2 740 Clark Bishop CAR 23 C 6 5 630 102
2 741 Niklas Hjalmarsson ARI 32 D 5 -1 643 -25
2 742 Miikka Salomaki NSH 26 RW 5 4 668 64
2 743 Logan O’Connor COL 23 RW 0 0 0 0
2 744 Martin Marincin TOR 27 D 2 -3 729 -90
2 745 Logan Shaw WPG 28 RW 0 0 0 0
2 746 Chad Ruhwedel PIT 29 D 0 -7 781 -186
2 746 Zac Rinaldo CGY 29 C 1 -5 764 -146
2 746 Kevin Connauton COL 29 D 8 8 580 219
2 749 Jakob Lilja CBJ 26 F 0 0 0 0
2 750 Ilya Lyubushkin ARI 25 D 3 -2 717 -78

- Find more at FantasyRef.ca32
20/21 Baseline Projection
Player Information (from end of 19/20 season) Past Base Projection Results
Pts Total Pts Rank Player Team Age Pos Pts Total Error Pts Rank Error
2 751 Peter Cehlarik BOS 24 LW 5 4 640 92
2 751 Steven Santini NSH 24 D 6 6 613 186
2 753 Scott Sabourin OTT 27 F 0 0 0 0
2 753 Scott Wilson BUF 27 C 5 3 653 45
2 755 Andrej Sekera DAL 33 D 0 -10 790 -254
2 756 Fredrik Claesson NJD 27 D 5 3 669 29
2 757 Carl Gunnarsson STL 33 D 2 -6 748 -175
2 758 Nick Seeler CHI 26 D 4 3 705 27
2 759 Nathan Gerbe CBJ 32 C 0 0 0 0
2 760 Anthony Angello PIT 23 C 0 0 0 0
2 760 David Kase PHI 23 RW 0 0 0 0
2 760 Joel Kiviranta DAL 23 F 0 0 0 0
2 760 Egor Korshkov TOR 23 F 0 0 0 0
2 760 Maxim Letunov SJS 23 C 0 0 0 0
2 760 Ryan MacInnis CBJ 23 C 0 0 0 0
2 760 Niko Mikkola STL 23 D 0 0 0 0
2 760 Zach Whitecloud VEG 23 D 0 0 0 0
2 760 Evgeny Svechnikov DET 23 LW 0 0 0 0
2 769 Xavier Ouellet MTL 26 D 2 0 727 -29
2 770 Andrew Ladd NYI 34 LW 9 8 544 188
2 771 Christian Folin MTL 28 D 5 3 641 57
2 772 Dakota Mermis NJD 26 D 0 0 0 0
2 773 Joseph Blandisi PIT 25 C 1 -5 775 -157
2 774 Gabriel Carlsson CBJ 23 D 0 0 0 0
2 774 John Quenneville CHI 23 C 5 5 670 129
2 776 Jarred Tinordi NSH 27 D 0 0 0 0
2 776 Patrick Russell EDM 27 RW 0 0 0 0
2 778 Brandon Manning EDM 29 D 5 4 650 82
2 779 Yannick Weber NSH 31 D 1 -3 773 -105
1 780 Trevor Daley DET 36 D 3 -5 722 -149
1 781 Justin Dowling DAL 29 C -1 -8 808 -213
1 782 Andreas Englund OTT 24 D 0 0 0 0
1 782 Lawrence Pilut BUF 24 D 5 5 662 137
1 784 Alexandre Carrier NSH 23 D 0 0 0 0
1 784 Rhett Gardner DAL 23 C 0 0 0 0
1 784 Cameron Hughes BOS 23 C 0 0 0 0
1 784 Joshua Jacobs NJD 23 D 0 0 0 0
1 784 William Lagesson EDM 23 D 0 0 0 0
1 784 Austin Poganski STL 23 RW 0 0 0 0
1 784 Anthony Richard NSH 23 C 0 0 0 0
1 784 Kole Sherwood CBJ 23 RW 0 0 0 0
1 784 Jake Walman STL 23 D 0 0 0 0
1 784 Alexander Yelesin CGY 23 D 0 0 0 0
1 794 Roman Polak DAL 33 D 4 -1 703 -64
1 795 Alan Quine CGY 26 C 2 1 727 5
1 796 Gemel Smith TBL 25 C 5 4 639 93
1 797 Jonny Brodzinski SJS 26 C 2 1 739 -7
1 798 Colby Cave EDM 25 C 5 4 647 85
1 799 Connor Clifton BOS 24 D 2 0 734 -36
1 799 Jacob Middleton SJS 24 D 2 0 734 -36

Follow us throughout the year on Twitter @Fantasy_Ref - 33
20/21 Baseline Projection
Player Information (from end of 19/20 season) Past Base Projection Results
Pts Total Pts Rank Player Team Age Pos Pts Total Error Pts Rank Error
1 801 Calle Rosen TOR 25 D 2 -2 753 -85
1 801 Carl Dahlstrom WPG 25 D 5 4 661 71
1 803 Nico Sturm MIN 24 C 0 0 0 0
1 803 Joel L’Esperance DAL 24 RW 3 2 720 12
1 803 Max Veronneau OTT 24 RW 4 4 698 101
1 806 Tomas Jurco EDM 27 RW 0 0 0 0
1 806 Paul Ladue LAK 27 D 4 3 709 23
1 808 Stefan Matteau CBJ 25 LW 0 0 0 0
1 809 Brendan Gaunce BOS 25 C 4 3 692 40
1 810 Luke Witkowski TBL 29 D 0 -4 791 -123
1 811 Justin Bailey VAN 24 RW 3 3 714 85
1 812 Mark Barberio COL 29 D 2 -0 749 -51
1 813 Lukas Radil SJS 29 C 4 4 704 95
1 814 Lukas Vejdemo MTL 24 C 0 0 0 0
1 814 Mark Friedman PHI 24 D 0 0 0 0
1 814 Jordan Gross ARI 24 D 0 0 0 0
1 814 Mason Marchment TOR 24 F 0 0 0 0
1 814 Gage Quinney VEG 24 F 0 0 0 0
1 819 Korbinian Holzer NSH 31 D -2 -7 814 -175
1 820 Daniel Carr NSH 28 LW 4 3 711 21
1 821 Deryk Engelland VEG 37 D 5 -2 646 -51
1 822 Jean-Sebastien Dea BUF 25 C 4 4 680 119
1 823 Tyler Graovac VAN 26 C 0 0 0 0
1 823 Cole Bardreau NYI 26 F 0 0 0 0
1 825 Dan Hamhuis NSH 37 D 2 -8 752 -216
1 826 Matt Irwin ANA 32 D 3 0 712 -23
1 827 Adam Johnson PIT 25 C 2 0 742 -44
1 827 Sheldon Dries COL 25 C 4 4 692 107
1 829 Cameron Gaunce TBL 29 D 0 0 0 0
0 830 Nathan Walker STL 25 C 2 -0 753 -55
0 831 Anton Blidh BOS 24 LW 2 2 755 44
0 831 Chase De Leo ANA 24 C 0 0 0 0
0 831 Samuel Morin PHI 24 D 0 0 0 0
0 834 Sam Carrick ANA 27 C 0 -2 786 -88
0 834 Michael Chaput ARI 27 C 2 2 729 70
0 836 John Gilmour BUF 26 D 0 0 0 0
0 837 Kevin Gravel TOR 27 D 2 2 740 59
0 838 Joel Persson EDM 25 D 0 0 0 0
0 838 Anton Lindholm COL 25 D 0 0 0 0
0 838 Gustav Olofsson MTL 25 D 0 0 0 0
0 841 Andrew Agozzino ANA 29 LW -1 -4 801 -112
0 841 Matt Tennyson NJD 29 D 0 0 0 0
0 843 Gerald Mayhew MIN 27 F 0 0 0 0
0 844 Steven Kampfer BOS 31 D -1 -3 804 -106
-0 845 Andy Andreoff PHI 28 LW 0 0 0 0
-0 846 Andrei Chibisov WPG 26 F 0 0 0 0
-0 846 Steven Fogarty NYR 26 C 0 0 0 0
-0 846 Anton Wedin CHI 26 F 0 0 0 0
-0 849 Tyler Lewington WSH 25 D 2 2 742 57
-0 849 Ashton Sautner VAN 25 D 2 2 742 57

- Find more at FantasyRef.ca34
20/21 Baseline Projection
Player Information (from end of 19/20 season) Past Base Projection Results
Pts Total Pts Rank Player Team Age Pos Pts Total Error Pts Rank Error
-0 851 Patrick Brown VEG 27 C 0 0 0 0
-0 851 Jani Hakanpaa ANA 27 D 0 0 0 0
-0 851 T.J. Tynan COL 27 C 0 0 0 0
-0 854 Luke Schenn TBL 30 D 1 -3 774 -106
-0 855 Luke Johnson MIN 25 C 2 2 761 38
-0 856 Brandon Davidson SJS 28 D 1 1 771 28
-1 857 Riley Barber MTL 25 RW 0 0 0 0
-1 857 Jake Bischoff VEG 25 D 0 0 0 0
-1 857 Trevor Carrick SJS 25 D 0 0 0 0
-1 857 Marko Daňo CBJ 25 C 0 0 0 0
-1 857 Thomas Di Pauli PIT 25 C 0 0 0 0
-1 857 C.J. Suess WPG 25 LW 0 0 0 0
-1 863 Karl Alzner MTL 31 D -1 -1 799 0
-1 863 Paul Carey BOS 31 C 0 0 0 0
-1 865 Dylan McIlrath DET 27 D 0 0 0 0
-1 865 Michael Sgarbossa WSH 27 C 0 0 0 0
-1 865 Dalton Smith BUF 27 LW 0 0 0 0
-1 868 Joel Hanley DAL 28 D 0 0 0 0
-1 869 Chris Stewart PHI 32 RW 0 0 0 0
-1 870 Brian Lashoff DET 29 D -1 -2 808 -76
-1 871 Aaron Ness ARI 29 D 0 0 0 0
-1 872 Micheal Haley NYR 33 C 1 0 763 -31
-1 873 Dalton Prout SJS 29 D -1 -1 801 -2
-1 874 Buddy Robinson CGY 28 RW 0 0 0 0
-1 875 Jordan Szwarz OTT 28 RW 0 0 0 0
-1 876 Gabriel Dumont MIN 29 C 0 0 0 0
-1 876 Zach Trotman PIT 29 D -1 -1 808 -9
-1 878 Mark Letestu WPG 34 C 0 0 0 0
-1 879 Ben Street NJD 32 C 0 -1 788 -56
-1 880 Jayson Megna COL 29 C 0 0 0 0
-1 881 Cory Conacher TBL 30 LW 0 0 0 0
-2 882 Jonathan Ericsson DET 35 D 1 1 777 22
-2 883 Cody Goloubef DET 30 D 0 0 0 0
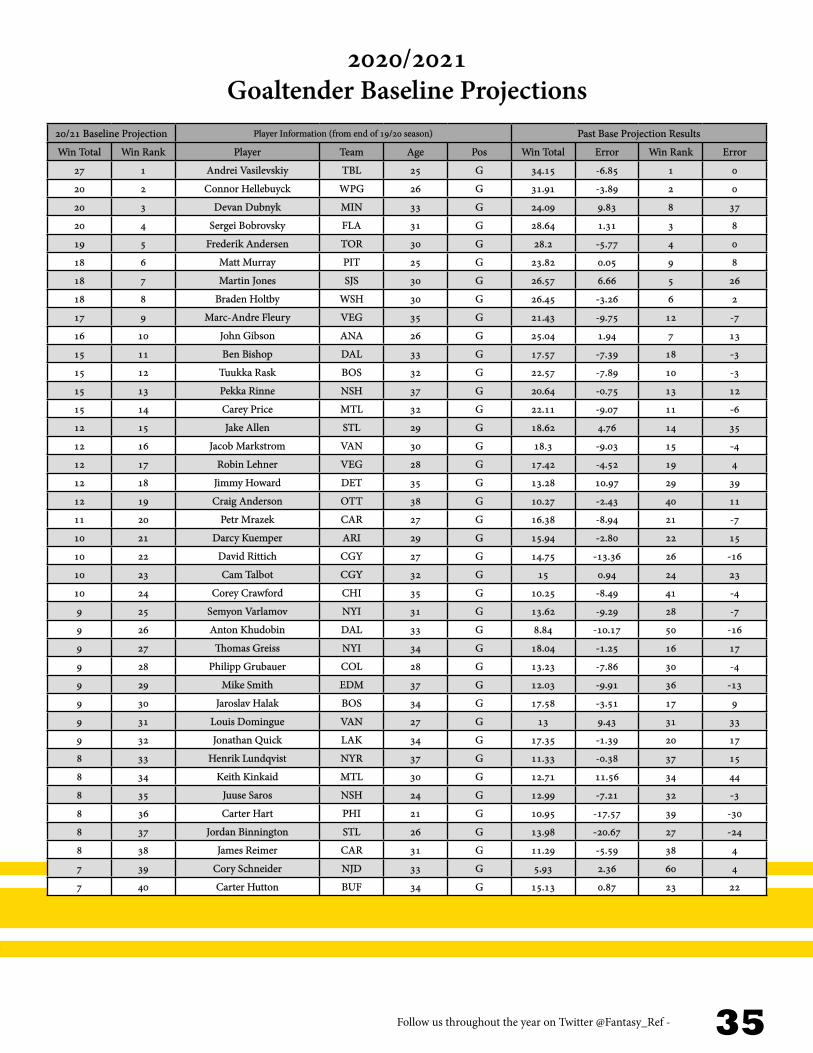
Follow us throughout the year on Twitter @Fantasy_Ref - 35
2020/2021 Goaltender Baseline Projections
20/21 Baseline Projection Player Information (from end of 19/20 season) Past Base Projection Results
Win Total Win Rank Player Team Age Pos Win Total Error Win Rank Error
27 1 Andrei Vasilevskiy TBL 25 G 34.15 -6.85 1 0
20 2 Connor Hellebuyck WPG 26 G 31.91 -3.89 2 0
20 3 Devan Dubnyk MIN 33 G 24.09 9.83 8 37
20 4 Sergei Bobrovsky FLA 31 G 28.64 1.31 3 8
19 5 Frederik Andersen TOR 30 G 28.2 -5.77 4 0
18 6 Matt Murray PIT 25 G 23.82 0.05 9 8
18 7 Martin Jones SJS 30 G 26.57 6.66 5 26
18 8 Braden Holtby WSH 30 G 26.45 -3.26 6 2
17 9 Marc-Andre Fleury VEG 35 G 21.43 -9.75 12 -7
16 10 John Gibson ANA 26 G 25.04 1.94 7 13
15 11 Ben Bishop DAL 33 G 17.57 -7.39 18 -3
15 12 Tuukka Rask BOS 32 G 22.57 -7.89 10 -3
15 13 Pekka Rinne NSH 37 G 20.64 -0.75 13 12
15 14 Carey Price MTL 32 G 22.11 -9.07 11 -6
12 15 Jake Allen STL 29 G 18.62 4.76 14 35
12 16 Jacob Markstrom VAN 30 G 18.3 -9.03 15 -4
12 17 Robin Lehner VEG 28 G 17.42 -4.52 19 4
12 18 Jimmy Howard DET 35 G 13.28 10.97 29 39
12 19 Craig Anderson OTT 38 G 10.27 -2.43 40 11
11 20 Petr Mrazek CAR 27 G 16.38 -8.94 21 -7
10 21 Darcy Kuemper ARI 29 G 15.94 -2.80 22 15
10 22 David Rittich CGY 27 G 14.75 -13.36 26 -16
10 23 Cam Talbot CGY 32 G 15 0.94 24 23
10 24 Corey Crawford CHI 35 G 10.25 -8.49 41 -4
9 25 Semyon Varlamov NYI 31 G 13.62 -9.29 28 -7
9 26 Anton Khudobin DAL 33 G 8.84 -10.17 50 -16
9 27 Thomas Greiss NYI 34 G 18.04 -1.25 16 17
9 28 Philipp Grubauer COL 28 G 13.23 -7.86 30 -4
9 29 Mike Smith EDM 37 G 12.03 -9.91 36 -13
9 30 Jaroslav Halak BOS 34 G 17.58 -3.51 17 9
9 31 Louis Domingue VAN 27 G 13 9.43 31 33
9 32 Jonathan Quick LAK 34 G 17.35 -1.39 20 17
8 33 Henrik Lundqvist NYR 37 G 11.33 -0.38 37 15
8 34 Keith Kinkaid MTL 30 G 12.71 11.56 34 44
8 35 Juuse Saros NSH 24 G 12.99 -7.21 32 -3
8 36 Carter Hart PHI 21 G 10.95 -17.57 39 -30
8 37 Jordan Binnington STL 26 G 13.98 -20.67 27 -24
8 38 James Reimer CAR 31 G 11.29 -5.59 38 4
7 39 Cory Schneider NJD 33 G 5.93 2.36 60 4
7 40 Carter Hutton BUF 34 G 15.13 0.87 23 22
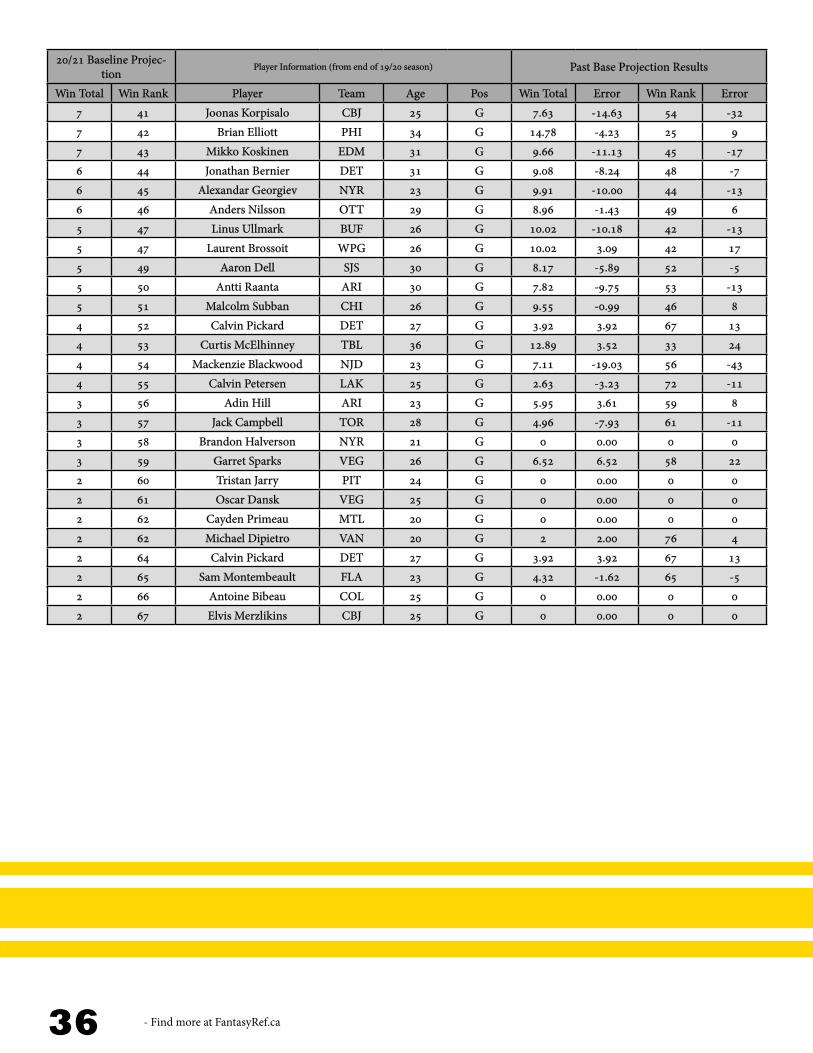
- Find more at FantasyRef.ca36
20/21 Baseline Projec-tion
Player Information (from end of 19/20 season) Past Base Projection Results
Win Total Win Rank Player Team Age Pos Win Total Error Win Rank Error
7 41 Joonas Korpisalo CBJ 25 G 7.63 -14.63 54 -32
7 42 Brian Elliott PHI 34 G 14.78 -4.23 25 9
7 43 Mikko Koskinen EDM 31 G 9.66 -11.13 45 -17
6 44 Jonathan Bernier DET 31 G 9.08 -8.24 48 -7
6 45 Alexandar Georgiev NYR 23 G 9.91 -10.00 44 -13
6 46 Anders Nilsson OTT 29 G 8.96 -1.43 49 6
5 47 Linus Ullmark BUF 26 G 10.02 -10.18 42 -13
5 47 Laurent Brossoit WPG 26 G 10.02 3.09 42 17
5 49 Aaron Dell SJS 30 G 8.17 -5.89 52 -5
5 50 Antti Raanta ARI 30 G 7.82 -9.75 53 -13
5 51 Malcolm Subban CHI 26 G 9.55 -0.99 46 8
4 52 Calvin Pickard DET 27 G 3.92 3.92 67 13
4 53 Curtis McElhinney TBL 36 G 12.89 3.52 33 24
4 54 Mackenzie Blackwood NJD 23 G 7.11 -19.03 56 -43
4 55 Calvin Petersen LAK 25 G 2.63 -3.23 72 -11
3 56 Adin Hill ARI 23 G 5.95 3.61 59 8
3 57 Jack Campbell TOR 28 G 4.96 -7.93 61 -11
3 58 Brandon Halverson NYR 21 G 0 0.00 0 0
3 59 Garret Sparks VEG 26 G 6.52 6.52 58 22
2 60 Tristan Jarry PIT 24 G 0 0.00 0 0
2 61 Oscar Dansk VEG 25 G 0 0.00 0 0
2 62 Cayden Primeau MTL 20 G 0 0.00 0 0
2 62 Michael Dipietro VAN 20 G 2 2.00 76 4
2 64 Calvin Pickard DET 27 G 3.92 3.92 67 13
2 65 Sam Montembeault FLA 23 G 4.32 -1.62 65 -5
2 66 Antoine Bibeau COL 25 G 0 0.00 0 0
2 67 Elvis Merzlikins CBJ 25 G 0 0.00 0 0
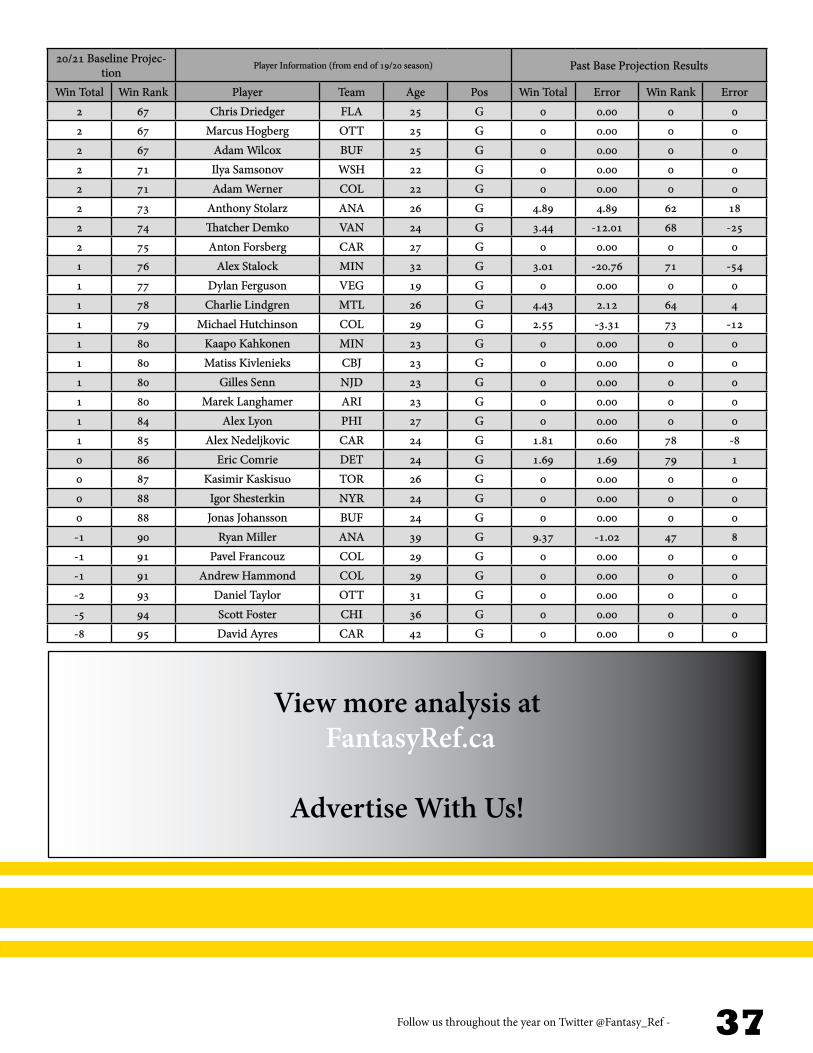
Follow us throughout the year on Twitter @Fantasy_Ref - 37
20/21 Baseline Projec-tion
Player Information (from end of 19/20 season) Past Base Projection Results
Win Total Win Rank Player Team Age Pos Win Total Error Win Rank Error
2 67 Chris Driedger FLA 25 G 0 0.00 0 0
2 67 Marcus Hogberg OTT 25 G 0 0.00 0 0
2 67 Adam Wilcox BUF 25 G 0 0.00 0 0
2 71 Ilya Samsonov WSH 22 G 0 0.00 0 0
2 71 Adam Werner COL 22 G 0 0.00 0 0
2 73 Anthony Stolarz ANA 26 G 4.89 4.89 62 18
2 74 Thatcher Demko VAN 24 G 3.44 -12.01 68 -25
2 75 Anton Forsberg CAR 27 G 0 0.00 0 0
1 76 Alex Stalock MIN 32 G 3.01 -20.76 71 -54
1 77 Dylan Ferguson VEG 19 G 0 0.00 0 0
1 78 Charlie Lindgren MTL 26 G 4.43 2.12 64 4
1 79 Michael Hutchinson COL 29 G 2.55 -3.31 73 -12
1 80 Kaapo Kahkonen MIN 23 G 0 0.00 0 0
1 80 Matiss Kivlenieks CBJ 23 G 0 0.00 0 0
1 80 Gilles Senn NJD 23 G 0 0.00 0 0
1 80 Marek Langhamer ARI 23 G 0 0.00 0 0
1 84 Alex Lyon PHI 27 G 0 0.00 0 0
1 85 Alex Nedeljkovic CAR 24 G 1.81 0.60 78 -8
0 86 Eric Comrie DET 24 G 1.69 1.69 79 1
0 87 Kasimir Kaskisuo TOR 26 G 0 0.00 0 0
0 88 Igor Shesterkin NYR 24 G 0 0.00 0 0
0 88 Jonas Johansson BUF 24 G 0 0.00 0 0
-1 90 Ryan Miller ANA 39 G 9.37 -1.02 47 8
-1 91 Pavel Francouz COL 29 G 0 0.00 0 0
-1 91 Andrew Hammond COL 29 G 0 0.00 0 0
-2 93 Daniel Taylor OTT 31 G 0 0.00 0 0
-5 94 Scott Foster CHI 36 G 0 0.00 0 0
-8 95 David Ayres CAR 42 G 0 0.00 0 0
View more analysis at FantasyRef.ca
Advertise With Us!

- Find more at FantasyRef.ca38
AnalysisOn top of ranking forecaster projections, I like to look for trends and analyze the projections. Due to time constraints and the fact that this is 2020 (yes, I am going to play that card), I have yet to complete this section. I am going add more pages of analysis from now until puck drop on January 13th.
You can expect to see analysis about forecasters’ projections for rookies, teams, positions, worst and best, etc.
Stay tuned!
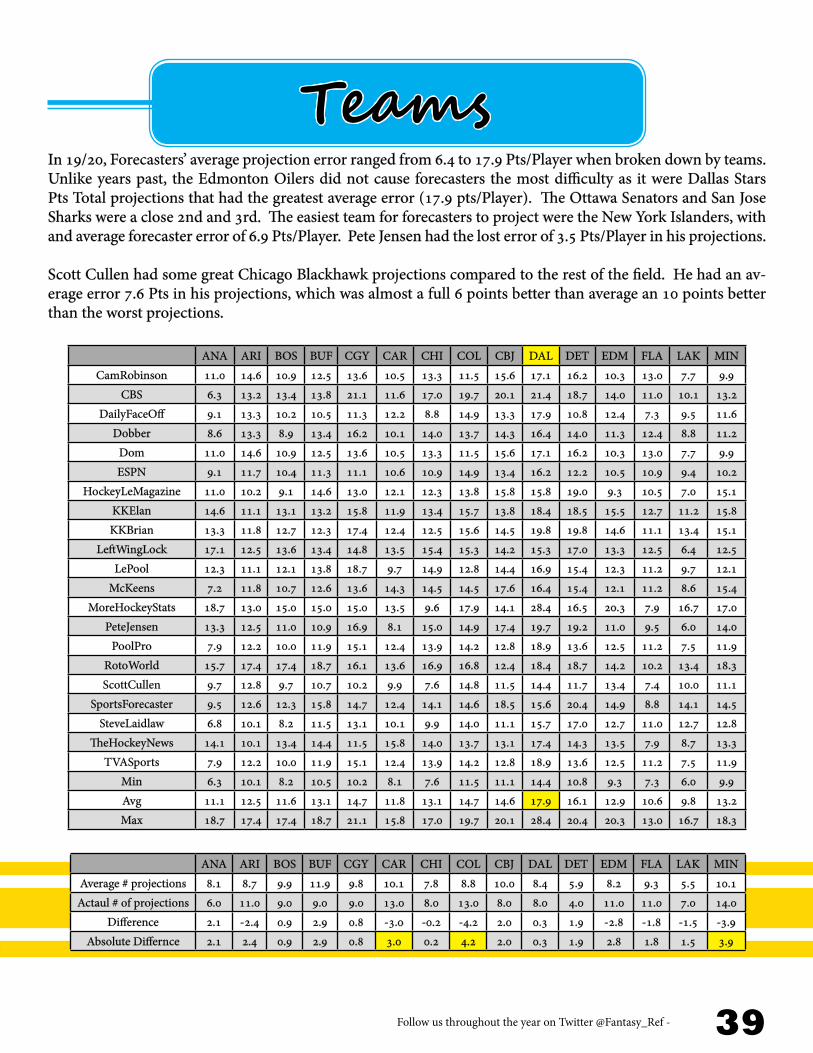
Follow us throughout the year on Twitter @Fantasy_Ref - 39
ANA ARI BOS BUF CGY CAR CHI COL CBJ DAL DET EDM FLA LAK MIN
CamRobinson 11.0 14.6 10.9 12.5 13.6 10.5 13.3 11.5 15.6 17.1 16.2 10.3 13.0 7.7 9.9
CBS 6.3 13.2 13.4 13.8 21.1 11.6 17.0 19.7 20.1 21.4 18.7 14.0 11.0 10.1 13.2
DailyFaceOff 9.1 13.3 10.2 10.5 11.3 12.2 8.8 14.9 13.3 17.9 10.8 12.4 7.3 9.5 11.6
Dobber 8.6 13.3 8.9 13.4 16.2 10.1 14.0 13.7 14.3 16.4 14.0 11.3 12.4 8.8 11.2
Dom 11.0 14.6 10.9 12.5 13.6 10.5 13.3 11.5 15.6 17.1 16.2 10.3 13.0 7.7 9.9
ESPN 9.1 11.7 10.4 11.3 11.1 10.6 10.9 14.9 13.4 16.2 12.2 10.5 10.9 9.4 10.2
HockeyLeMagazine 11.0 10.2 9.1 14.6 13.0 12.1 12.3 13.8 15.8 15.8 19.0 9.3 10.5 7.0 15.1
KKElan 14.6 11.1 13.1 13.2 15.8 11.9 13.4 15.7 13.8 18.4 18.5 15.5 12.7 11.2 15.8
KKBrian 13.3 11.8 12.7 12.3 17.4 12.4 12.5 15.6 14.5 19.8 19.8 14.6 11.1 13.4 15.1
LeftWingLock 17.1 12.5 13.6 13.4 14.8 13.5 15.4 15.3 14.2 15.3 17.0 13.3 12.5 6.4 12.5
LePool 12.3 11.1 12.1 13.8 18.7 9.7 14.9 12.8 14.4 16.9 15.4 12.3 11.2 9.7 12.1
McKeens 7.2 11.8 10.7 12.6 13.6 14.3 14.5 14.5 17.6 16.4 15.4 12.1 11.2 8.6 15.4
MoreHockeyStats 18.7 13.0 15.0 15.0 15.0 13.5 9.6 17.9 14.1 28.4 16.5 20.3 7.9 16.7 17.0
PeteJensen 13.3 12.5 11.0 10.9 16.9 8.1 15.0 14.9 17.4 19.7 19.2 11.0 9.5 6.0 14.0
PoolPro 7.9 12.2 10.0 11.9 15.1 12.4 13.9 14.2 12.8 18.9 13.6 12.5 11.2 7.5 11.9
RotoWorld 15.7 17.4 17.4 18.7 16.1 13.6 16.9 16.8 12.4 18.4 18.7 14.2 10.2 13.4 18.3
ScottCullen 9.7 12.8 9.7 10.7 10.2 9.9 7.6 14.8 11.5 14.4 11.7 13.4 7.4 10.0 11.1
SportsForecaster 9.5 12.6 12.3 15.8 14.7 12.4 14.1 14.6 18.5 15.6 20.4 14.9 8.8 14.1 14.5
SteveLaidlaw 6.8 10.1 8.2 11.5 13.1 10.1 9.9 14.0 11.1 15.7 17.0 12.7 11.0 12.7 12.8
TheHockeyNews 14.1 10.1 13.4 14.4 11.5 15.8 14.0 13.7 13.1 17.4 14.3 13.5 7.9 8.7 13.3
TVASports 7.9 12.2 10.0 11.9 15.1 12.4 13.9 14.2 12.8 18.9 13.6 12.5 11.2 7.5 11.9
Min 6.3 10.1 8.2 10.5 10.2 8.1 7.6 11.5 11.1 14.4 10.8 9.3 7.3 6.0 9.9
Avg 11.1 12.5 11.6 13.1 14.7 11.8 13.1 14.7 14.6 17.9 16.1 12.9 10.6 9.8 13.2
Max 18.7 17.4 17.4 18.7 21.1 15.8 17.0 19.7 20.1 28.4 20.4 20.3 13.0 16.7 18.3
Teams
ANA ARI BOS BUF CGY CAR CHI COL CBJ DAL DET EDM FLA LAK MIN
Average # projections 8.1 8.7 9.9 11.9 9.8 10.1 7.8 8.8 10.0 8.4 5.9 8.2 9.3 5.5 10.1
Actaul # of projections 6.0 11.0 9.0 9.0 9.0 13.0 8.0 13.0 8.0 8.0 4.0 11.0 11.0 7.0 14.0
Difference 2.1 -2.4 0.9 2.9 0.8 -3.0 -0.2 -4.2 2.0 0.3 1.9 -2.8 -1.8 -1.5 -3.9
Absolute Differnce 2.1 2.4 0.9 2.9 0.8 3.0 0.2 4.2 2.0 0.3 1.9 2.8 1.8 1.5 3.9
In 19/20, Forecasters’ average projection error ranged from 6.4 to 17.9 Pts/Player when broken down by teams. Unlike years past, the Edmonton Oilers did not cause forecasters the most difficulty as it were Dallas Stars Pts Total projections that had the greatest average error (17.9 pts/Player). The Ottawa Senators and San Jose Sharks were a close 2nd and 3rd. The easiest team for forecasters to project were the New York Islanders, with and average forecaster error of 6.9 Pts/Player. Pete Jensen had the lost error of 3.5 Pts/Player in his projections.
Scott Cullen had some great Chicago Blackhawk projections compared to the rest of the field. He had an av-erage error 7.6 Pts in his projections, which was almost a full 6 points better than average an 10 points better than the worst projections.

- Find more at FantasyRef.ca40
MTL NSH NJD NYI NYR OTT PHI PIT SJS STL TBL TOR VAN WSH WPG VEG
17.9 13.0 15.5 5.4 18.8 20.7 13.5 17.2 18.8 13.7 10.5 12.3 14.0 8.6 12.4 14.2 CamRobinson
17.7 14.4 13.4 5.7 13.7 7.8 12.9 17.4 19.0 15.4 12.7 22.0 14.6 13.9 18.7 17.9 CBS
14.9 11.0 16.4 5.7 20.1 16.8 12.5 16.0 17.0 15.0 9.6 13.0 15.3 14.6 9.5 10.9 DailyFaceOff
14.8 13.7 16.1 7.5 16.3 19.3 14.8 18.4 14.2 15.0 11.1 14.3 14.5 10.8 13.7 14.1 Dobber
17.9 13.0 15.5 5.4 18.8 20.7 13.5 17.2 18.8 13.7 10.5 12.3 14.0 8.6 12.4 14.2 Dom
13.4 13.0 14.1 3.9 18.0 14.5 11.1 15.8 12.6 12.9 11.1 10.2 17.9 9.2 12.8 12.7 ESPN
13.4 13.2 14.2 5.1 15.9 19.8 12.7 17.1 20.9 12.9 13.1 14.6 17.5 10.1 10.6 14.5 HockeyLeMagazine
15.9 14.0 21.4 5.4 15.8 16.8 17.3 14.8 20.1 12.9 10.7 13.1 18.5 11.0 13.7 12.9 KKElan
15.0 15.6 19.5 6.0 16.4 15.1 16.9 17.4 20.6 13.9 10.9 13.0 17.7 12.3 13.3 12.7 KKBrian
15.1 10.9 18.6 6.0 17.6 21.5 14.6 16.8 17.2 15.0 10.7 9.5 18.1 12.9 12.9 10.3 LeftWingLock
16.5 15.0 14.5 3.9 17.6 18.6 14.0 18.5 15.6 15.5 11.2 14.7 16.0 9.8 11.9 13.0 LePool
17.3 14.4 13.6 5.9 13.1 15.5 11.1 15.9 19.8 16.8 11.5 13.8 15.6 9.9 12.0 11.7 McKeens
14.3 13.9 13.4 12.7 18.8 21.4 16.2 21.8 17.1 14.2 11.4 14.1 21.1 19.9 20.7 14.3 MoreHockeyStats
17.9 15.1 16.4 3.5 15.6 19.0 13.3 17.0 18.3 17.2 8.6 13.7 12.4 8.3 9.0 10.3 PeteJensen
14.7 11.8 14.8 7.3 16.8 14.4 10.4 14.3 18.3 13.5 12.4 15.0 16.9 10.2 13.3 13.2 PoolPro
18.8 18.6 14.1 10.8 17.1 20.3 12.3 16.0 20.6 13.1 13.5 12.8 16.5 9.7 14.6 12.5 RotoWorld
13.1 10.7 12.1 8.2 15.3 13.4 9.4 15.8 11.0 15.4 11.4 8.8 16.6 12.4 14.9 13.5 ScottCullen
14.7 12.4 14.0 7.8 16.1 17.6 10.2 19.1 19.7 16.7 13.8 13.0 14.3 13.9 10.0 14.7 SportsForecaster
15.5 12.4 12.0 5.4 16.9 16.6 12.8 17.4 15.3 13.3 10.2 11.2 14.6 8.8 10.7 11.7 SteveLaidlaw
18.5 13.0 17.6 5.6 17.0 14.1 14.0 14.2 16.0 11.6 13.8 14.2 20.8 11.8 13.9 13.2 TheHockeyNews
14.7 11.8 14.8 7.3 16.8 14.4 10.4 14.3 18.3 13.5 12.4 15.0 16.9 10.2 13.3 13.2 TVASports
13.1 10.7 12.0 3.5 13.1 7.8 9.4 14.2 11.0 11.6 8.6 8.8 12.4 8.3 9.0 10.3 Min
15.8 13.4 15.3 6.4 16.8 17.1 13.0 16.8 17.6 14.4 11.5 13.4 16.4 11.3 13.1 13.1 Avg
18.8 18.6 21.4 12.7 20.1 21.5 17.3 21.8 20.9 17.2 13.8 22.0 21.1 19.9 20.7 17.9 Max
CBS also had some stand out projections for the Ottawa Senators compared to other forecasters. A full 9 Pts better than average and almost 14 Pts better than the worst forecaster.
When projecting the Top 300 players, forecasters (on average) underestimated Colorado, Minnesota, and Car-olina the most. The most underestimated team were the Wild, they had fourteen players crack the top 300 while on average forecasters had 10 players projected in that range. On the other side, the most overestimated team for forecasters were the Ottawa Senators. On average 7.8 Sens were projected in the Top 300 while only 5 actually made it.
Find more data below.
MTL NSH NJD NYI NYR OTT PHI PIT SJS STL TBL TOR VAN WSH WPG VEG
9.8 10.6 9.3 8.0 8.6 7.8 9.8 11.1 8.3 11.3 12.3 11.1 10.0 9.7 8.7 9.6 Average # projections
9.0 13.0 8.0 10.0 11.0 5.0 11.0 10.0 8.0 11.0 13.0 10.0 10.0 12.0 9.0 9.0 Actaul # of projections
0.8 -2.4 1.3 -2.0 -2.4 2.8 -1.3 1.1 0.3 0.3 -0.8 1.1 0.0 -2.3 -0.3 0.6 Difference
0.8 2.4 1.3 2.0 2.4 2.8 1.3 1.1 0.3 0.3 0.8 1.1 0.0 2.3 0.3 0.6 Absolute Differnce
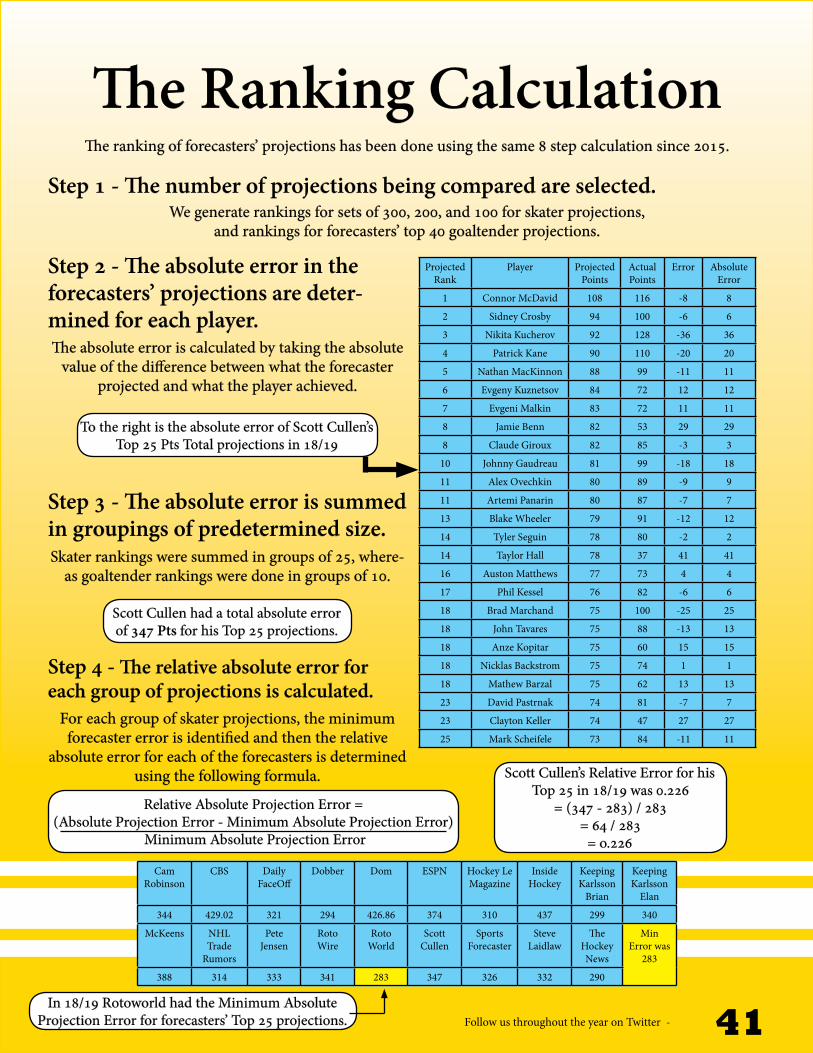
Follow us throughout the year on Twitter - 41
MTL NSH NJD NYI NYR OTT PHI PIT SJS STL TBL TOR VAN WSH WPG VEG
9.8 10.6 9.3 8.0 8.6 7.8 9.8 11.1 8.3 11.3 12.3 11.1 10.0 9.7 8.7 9.6 Average # projections
9.0 13.0 8.0 10.0 11.0 5.0 11.0 10.0 8.0 11.0 13.0 10.0 10.0 12.0 9.0 9.0 Actaul # of projections
0.8 -2.4 1.3 -2.0 -2.4 2.8 -1.3 1.1 0.3 0.3 -0.8 1.1 0.0 -2.3 -0.3 0.6 Difference
0.8 2.4 1.3 2.0 2.4 2.8 1.3 1.1 0.3 0.3 0.8 1.1 0.0 2.3 0.3 0.6 Absolute Differnce
The Ranking CalculationThe ranking of forecasters’ projections has been done using the same 8 step calculation since 2015.
Step 1 - The number of projections being compared are selected.We generate rankings for sets of 300, 200, and 100 for skater projections,
and rankings for forecasters’ top 40 goaltender projections.
Step 2 - The absolute error in the forecasters’ projections are deter-mined for each player.The absolute error is calculated by taking the absolute
value of the difference between what the forecaster projected and what the player achieved.
Step 3 - The absolute error is summed in groupings of predetermined size.Skater rankings were summed in groups of 25, where-
as goaltender rankings were done in groups of 10.
For each group of skater projections, the minimum forecaster error is identified and then the relative
absolute error for each of the forecasters is determined using the following formula.
Step 4 - The relative absolute error for each group of projections is calculated.
Projected Rank
Player Projected Points
Actual Points
Error Absolute Error
1 Connor McDavid 108 116 -8 8
2 Sidney Crosby 94 100 -6 6
3 Nikita Kucherov 92 128 -36 36
4 Patrick Kane 90 110 -20 20
5 Nathan MacKinnon 88 99 -11 11
6 Evgeny Kuznetsov 84 72 12 12
7 Evgeni Malkin 83 72 11 11
8 Jamie Benn 82 53 29 29
8 Claude Giroux 82 85 -3 3
10 Johnny Gaudreau 81 99 -18 18
11 Alex Ovechkin 80 89 -9 9
11 Artemi Panarin 80 87 -7 7
13 Blake Wheeler 79 91 -12 12
14 Tyler Seguin 78 80 -2 2
14 Taylor Hall 78 37 41 41
16 Auston Matthews 77 73 4 4
17 Phil Kessel 76 82 -6 6
18 Brad Marchand 75 100 -25 25
18 John Tavares 75 88 -13 13
18 Anze Kopitar 75 60 15 15
18 Nicklas Backstrom 75 74 1 1
18 Mathew Barzal 75 62 13 13
23 David Pastrnak 74 81 -7 7
23 Clayton Keller 74 47 27 27
25 Mark Scheifele 73 84 -11 11
To the right is the absolute error of Scott Cullen’s Top 25 Pts Total projections in 18/19
Scott Cullen had a total absolute error of 347 Pts for his Top 25 projections.
Cam Robinson
CBS Daily FaceOff
Dobber Dom ESPN Hockey Le Magazine
Inside Hockey
Keeping Karlsson
Brian
Keeping Karlsson
Elan
344 429.02 321 294 426.86 374 310 437 299 340
McKeens NHL Trade
Rumors
Pete Jensen
Roto Wire
Roto World
Scott Cullen
Sports Forecaster
Steve Laidlaw
The Hockey News
Min Error was
283
388 314 333 341 283 347 326 332 290
Scott Cullen’s Relative Error for his Top 25 in 18/19 was 0.226
= (347 - 283) / 283= 64 / 283
= o.226
Relative Absolute Projection Error = (Absolute Projection Error - Minimum Absolute Projection Error)
Minimum Absolute Projection Error
In 18/19 Rotoworld had the Minimum Absolute Projection Error for forecasters’ Top 25 projections.

- Find more at FantasyRef.ca42
Step 5 - The complement of the relative absolute error is calculated
Step 6 - The points for grouping are determined.
Step 7 - The number of points accumulated by each forecaster for all skater groupings are then totaled.
The complement relative error is calcualted by subtracting the relative absolute error from 1.
For each projection range, forecasters’ complement relative absolute er-ror is multiplied by the points allocated to each range to determine how
many points at received for the projections.
Step 8 - All forecasters’ total points are compared and ranked from greatest to least.
Scott Cullen’s Top 25 Complement Relative Absolute Error
= 1 - 0.226= 0.774
The number of points allocated to each group of projections is determined by the percentage of Pts scored (or whatever statistical category is being evaluated) by that group of players. For example in 18/19 the Top 25
skaters had 2352 total points. This represented 16.03 % of the total Pts scored by the top 300 skaters. Thus the Top 25 projections are allocated 16.03 points and so forth for the remaining groups
Range Total Pts Scored
Percentage of Top 300
Pts
Top 25 2352 16
26 - 50 1880 13
51 - 75 1622 11
76 - 100 1373 9
101 - 125 1235 8
126 - 150 1131 8
151 - 175 1023 7
176 - 200 935 6
201 - 225 869 6
226 - 250 808 6
251 - 275 749 5
276 - 300 694 5
Total 14671 100
The points allocated to each group of 25 skaters in the Top 300 rankings for
18 /19.
Scott Cullen earned 12.4 points for his Top 25 Pts Total Projections.
0.774 * 16 = 12.4
Points Acquired Per Projection Range
Forecaster Top 25 26 - 50 51 - 75 76 - 100 101 - 125 126 - 150 151 - 175 176 - 200 201 - 225 226 - 250 251 - 275 276 - 300 Total Rank
Cam Robinson 12.58 8.84 9.63 5.25 6.38 7.71 2.00 3.58 3.61 4.23 3.57 3.04 70.41 6
CBS 7.76 8.14 8.15 4.43 4.23 3.19 3.56 3.94 -0.30 4.63 -0.20 -0.15 47.37 13
Dobber 15.41 9.03 8.77 7.12 6.49 4.04 4.95 5.99 2.67 1.89 3.93 4.06 74.35 2
Dom 7.88 11.01 6.71 8.54 6.14 2.98 6.97 5.44 3.74 2.88 4.73 3.36 70.37 7
Hockey Le Magazine 14.50 7.58 8.58 6.12 7.30 1.65 6.07 4.65 3.42 3.76 2.10 2.80 68.54 8
Inside Hockey 7.31 9.62 6.37 6.70 1.65 1.59 1.70 3.05 1.64 1.67 1.83 1.62 44.74 14
McKeens 10.08 12.81 9.37 4.40 5.65 7.54 5.67 5.31 3.72 5.51 3.37 1.33 74.77 1
NHL Trade Rumors 14.28 10.03 6.48 8.29 4.10 4.53 6.42 6.37 1.91 4.65 3.22 2.78 73.07 4
Roto Wire 12.75 10.44 6.33 6.74 5.37 3.04 4.67 4.72 5.92 2.19 3.18 1.95 67.29 11
Roto World 16.03 10.44 6.00 6.96 5.16 1.79 3.35 5.05 2.77 2.36 5.11 2.71 67.72 10
Scott Cullen 12.41 9.03 7.35 7.25 8.42 5.49 4.85 4.21 3.69 4.72 3.25 2.52 73.18 3
Sports Forecaster 13.60 8.91 7.76 4.89 2.21 3.87 4.15 4.09 3.50 2.43 1.49 3.73 60.63 12
Steve Laidlaw 13.26 10.40 6.11 8.16 5.93 3.61 3.92 3.48 5.03 3.76 2.13 4.73 70.51 5
The Hockey News 15.64 7.43 11.06 5.57 3.26 5.03 4.90 5.79 1.29 5.06 0.49 2.40 67.91 9
Forecasters can earn up to a maximu of 100 points. However, there is no limit on how low the minimum points could be. In theory a forecaster can
have a negative total points but that is yet to happen. Some forecasters’ pro-jections do earn negative points for one or two groupings of 25 projections.