Fannie Mae Multifamily Mortgage Business Information · YTD June 2018 MF Business Information...
35
© 2018 Fannie Mae. Trademarks of Fannie Mae. 1 YTD June 2018 MF Business Information Presentation Fannie Mae Multifamily Mortgage Business Information August 2018
Transcript of Fannie Mae Multifamily Mortgage Business Information · YTD June 2018 MF Business Information...

© 2018 Fannie Mae. Trademarks of Fannie Mae. 1YTD June 2018 MF Business Information Presentation
Fannie Mae Multifamily Mortgage Business Information
August 2018

© 2018 Fannie Mae. Trademarks of Fannie Mae. 2YTD June 2018 MF Business Information Presentation 8/7/2018
Table of Contents
Multifamily Debt Market 3
Fannie Mae Acquisitions - Consistent Provider of Liquidity and Affordability to the Multifamily Debt Market 7
Fannie Mae Multifamily Guaranty Book - Diversification and Balance 13
Fannie Mae Mortgage Backed Securities - Capital Markets Liquidity and Stability 17
Fannie Mae Multifamily Delegated Underwriting and Servicing (DUS®) 21
Fannie Mae Multifamily Financial Results 29
Additional Fannie Mae Resources 35
Disclaimer: This presentation contains a number of estimates, expectations, beliefs, and other forward-looking statements, including statements regarding future economic conditions, the credit performance of Fannie Mae’s multifamily business, and future benefits of investing in Fannie Mae produ cts. These estimates, expectations, beliefs and other forward-looking statements are based on the company’s current assumptions regarding numerous factors and are subject to change. Actual outcomes may differ materially from those reflected in these forward-looking statements due to a variety of factors, including, but not limited to, those described in “Forward-Looking Statements” and “Risk Factors” in ou r qu arterly report on Form 10-Q for the quarter ended June 30, 2018 and ou r annual report Form 10-K for the year ended December 31, 2017. Any forward-looking statements made by Fannie Mae speak only as of the date on which they were made. Fannie Mae is under no obligation to, and expressly disclaims a ny obligation to, update or alter i ts forward-looking statements, whether as a result of new information, subsequ ent events, or otherwise.

© 2018 Fannie Mae. Trademarks of Fannie Mae. 3YTD June 2018 MF Business Information Presentation 8/7/2018
Multifamily Debt Market

© 2018 Fannie Mae. Trademarks of Fannie Mae. 4YTD June 2018 MF Business Information Presentation 8/7/2018
2006 2007 2008 2009 2010 2011 2012 2013 2014 2015 2016 2017Q1
2018
Other 44 50 44 41 43 39 36 36 37 44 45 44 44
Life Insurance Companies 46 52 52 49 47 49 51 54 56 62 67 73 74
State & Local Credit Agencies 72 79 72 78 84 83 81 84 84 86 91 94 96
Banks & Thrifts 253 261 280 271 258 251 260 289 327 379 425 450 459
CMBS 104 126 118 112 103 91 80 71 68 62 48 43 41
Ginnie Mae 36 38 39 44 52 60 71 82 90 94 99 109 111
Freddie Mac 53 67 88 98 100 107 119 124 135 160 191 231 236
Fannie Mae 105 132 156 168 172 179 190 185 189 200 231 266 270
-
100
200
300
400
500
600
700
800
900
1,000
1,100
1,200
1,300
Multifamily Debt Outstanding (MDO) by Holders of Credit Risk
GSEs
Guarantee 38%of MF MDO
FN M: 20% FRE: 1 8%
Fannie Mae’s Share of MF MDO
15% 17% 18% 20% 20% 21% 21% 20% 19% 18%
Fannie Mae has continued to guarantee approximately 20% of MF MDO over recent years
Sour ce: Federal Reserve
N ote: Numbers may not sum due to rounding
Total $ in Billions
19%
$ 714$ 803
$ 849 $ 860 $ 860 $ 860$ 887
$ 925$ 986
$ 1,087
$ 1,196
$ 1,311
20%
$ 1,332
20%
© 2018 Fannie Mae. Trademarks of Fannie Mae. 5YTD June 2018 MF Business Information Presentation 8/7/2018
T otalFannie
Mae
Freddie
Mac
Ginnie
MaeCMBS
Banks &
T hrifts
State & Local
Credit
Agencies
Life
Insurance
Com panies
Other
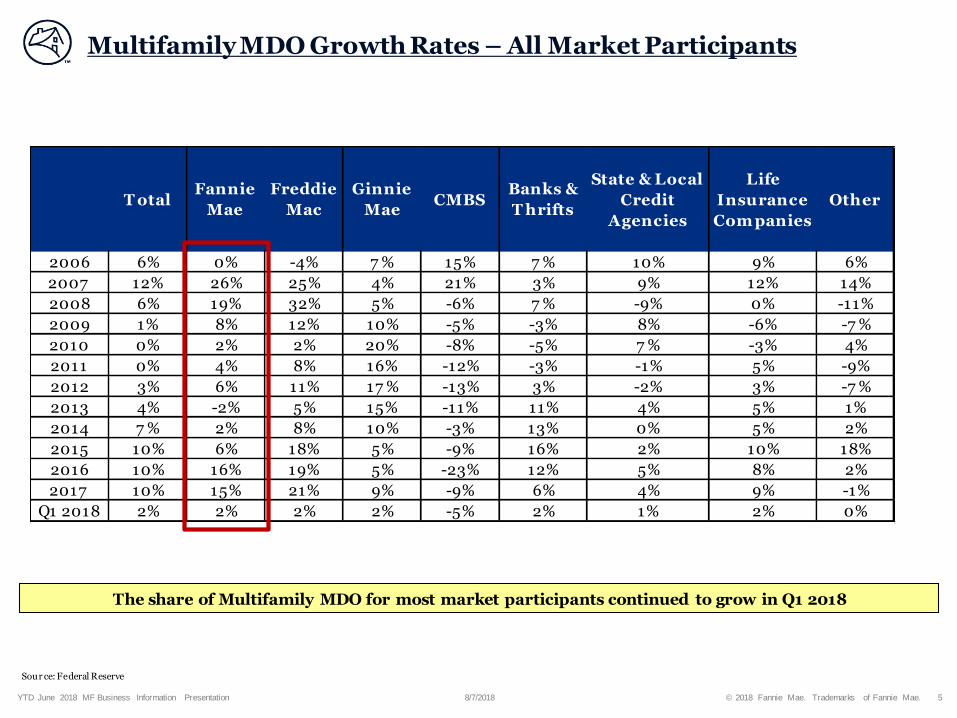
2006 6% 0% -4% 7 % 15% 7 % 10% 9% 6%
2007 12% 26% 25% 4% 21% 3% 9% 12% 14%
2008 6% 19% 32% 5% -6% 7 % -9% 0% -11%
2009 1% 8% 12% 10% -5% -3% 8% -6% -7 %
2010 0% 2% 2% 20% -8% -5% 7 % -3% 4%
2011 0% 4% 8% 16% -12% -3% -1% 5% -9%
2012 3% 6% 11% 17 % -13% 3% -2% 3% -7 %
2013 4% -2% 5% 15% -11% 11% 4% 5% 1%
2014 7 % 2% 8% 10% -3% 13% 0% 5% 2%
2015 10% 6% 18% 5% -9% 16% 2% 10% 18%
2016 10% 16% 19% 5% -23% 12% 5% 8% 2%
2017 10% 15% 21% 9% -9% 6% 4% 9% -1%
Q1 2018 2% 2% 2% 2% -5% 2% 1% 2% 0%
Multifamily MDO Growth Rates – All Market Participants
The share of Multifamily MDO for most market participants continued to grow in Q1 2018
Sour ce: Federal Reserve

© 2018 Fannie Mae. Trademarks of Fannie Mae. 6YTD June 2018 MF Business Information Presentation 8/7/2018
Estimated Competitive Multifamily Market Acquisitions by Participant1
Diversified participation exists in the multifamily market today
Non-GSE MF MBS issuances dropped by 92% from 2007
to 2009
N otes:1 Esti mated competitive market size is Fannie Mae’s internal estimate of multifamily originations activity.2 Ex cludes purchases of loans from others’ portfolios and Treasury HFA New Issue Bond program volume in 2009 and 2010, therefor e amounts may not tie to Fannie Mae 10-Qs or 10-Ks.3 Loans securitized by Ginnie Mae include non-dedicated multifamily housing e.g. healthcare and new construction4 Other includes state and local credit agencies, FHLBs and other financial institutions.5 Non-Traditional MF Lenders are non-institutional lenders that generate 1-2 multifamily loans a year with a typical size of less than $1M.
Sour ce: American Council of Life Insurers (ACLI), FDIC, Trepp, Mortgage Bankers Association & Fannie Mae Multifamily Economic Research Group
Total $ in Billions
2
3
4
5
Q1 201 8
Q1 2018
© 2018 Fannie Mae. Trademarks of Fannie Mae. 7YTD June 2018 MF Business Information Presentation 8/7/2018
Fannie Mae Acquisitions – Consistent Provider of Liquidity and Affordability to the Multifamily Debt Market
© 2018 Fannie Mae. Trademarks of Fannie Mae. 8YTD June 2018 MF Business Information Presentation 8/7/2018
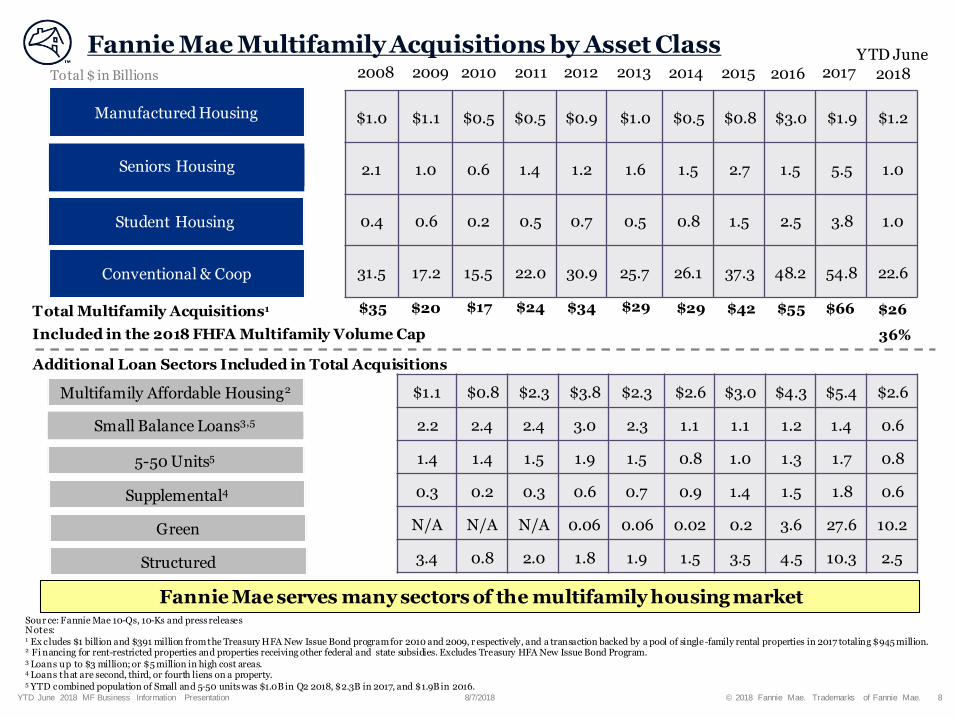
YTD June 2018
$1.1 $0.8 $2.3 $3.8 $2.3 $2.6 $3.0 $4.3 $5.4 $2.6
2.2 2.4 2.4 3.0 2.3 1.1 1.1 1.2 1.4 0.6
1.4 1.4 1.5 1.9 1.5 0.8 1.0 1.3 1.7 0.8
0.3 0.2 0.3 0.6 0.7 0.9 1.4 1.5 1.8 0.6
N/A N/A N/A 0.06 0.06 0.02 0.2 3.6 27.6 10.2
3.4 0.8 2.0 1.8 1.9 1.5 3.5 4.5 10.3 2.5
Notes:1 Ex cludes $1 billion and $391 million from the Treasury HFA New Issue Bond program for 2010 and 2009, r espectively, and a transaction backed by a pool of single-family rental properties in 2017 totaling $945 million.2 Fi nancing for rent-restricted properties and properties receiving other federal and state subsidies. Excludes Treasury HFA New Issue Bond Program. 3 Loans up to $3 million; or $5 million in high cost areas.4 Loans that are second, third, or fourth liens on a property.5 YTD combined population of Small and 5-50 units was $1.0B in Q2 2018, $2.3B in 2017, and $1.9B in 2016.
Fannie Mae Multifamily Acquisitions by Asset Class
Fannie Mae serves many sectors of the multifamily housing market
20092008 201220112010
Manufactured Housing
Seniors Housing
Student Housing
Conventional & Coop
86%$35 $20 $17 $24 $34Total Multifamily Acquisitions1
$1.0 $1.1 $0.5 $0.5 $0.9 $1.0 $0.5 $0.8 $3.0 $1.9 $1.2
2.1 1.0 0.6 1.4 1.2 1.6 1.5 2.7 1.5 5.5 1.0
0.4 0.6 0.2 0.5 0.7 0.5 0.8 1.5 2.5 3.8 1.0
31.5 17.2 15.5 22.0 30.9 25.7 26.1 37.3 48.2 54.8 22.6
Additional Loan Sectors Included in Total Acquisitions
2013
$29
2014
$29
2015
$42
Included in the 2018 FHFA Multifamily Volume Cap 36%
$55
Sour ce: Fannie Mae 10-Qs, 10-Ks and press releases
Total $ in Billions 2016 2017
$66
Multifamily Affordable Housing2
Small Balance Loans3,5
5-50 Units5
Supplemental4
Green
Structured
$26

© 2018 Fannie Mae. Trademarks of Fannie Mae. 9YTD June 2018 MF Business Information Presentation 8/7/2018
Fannie Mae Multifamily Acquisitions by Financing Type
Sour ce: Fannie Mae
N ote:1 Other financing types include supplemental financing on existing properties and construction take-outs. Construction takeout refers to the permanent debt on a newly constructed property where Fannie Mae did not pr ovide construction financing.
1
Fannie Mae business volume continues to be a mix of acquisitions and refinances
65%
36%
21% 20%26%
31% 34%39% 40%
48%44%
39%
30%
57%
77% 7 8%7 0%
67% 63%56% 54%
47%50%
57%
5% 7 %2% 2% 2% 2% 3% 5% 6% 5% 6% 4%
2007 2008 2009 2010 2011 2012 2013 2014 2015 2016 2017 YTD June2018
Acquisition Refinance Other

© 2018 Fannie Mae. Trademarks of Fannie Mae. 10YTD June 2018 MF Business Information Presentation 8/7/2018
Fannie Mae Multifamily Acquisitions by Loan Size
Sour ce: Fannie Mae
Fannie Mae has continually provided financing to all multifamily market segments with varying loan sizes
(Based on Loan Count)
91%
7 8%
63% 62%55% 54% 53%
44%
36% 35%32% 32%
8%
19%
32% 33%
38% 38% 39%
43%
47% 46%49% 50%
1% 3% 5% 5% 7 % 8% 8%13%
17% 19% 20% 18%
2007 2008 2009 2010 2011 2012 2013 2014 2015 2016 2017 YTD June2018<=$5M $5M<=$25M >$25M

© 2018 Fannie Mae. Trademarks of Fannie Mae. 11YTD June 2018 MF Business Information Presentation 8/7/2018
35%40% 38% 39%
44% 45% 42%37%
32% 29% 29%35%
51%49% 49% 50%
45% 42% 46%49%
51%51% 52%
49%
5%5% 6% 4% 2% 5% 5% 7 %
7 %8% 8%
8%
9% 6% 7 % 7 % 6% 8% 7 % 7 % 9% 11% 11% 8%
2007 2008 2009 2010 2011 2012 2013 2014 2015 2016 2017 YTD June2018
60% AMI or less >60%-100% AMI >100%-120% AMI >120% AMI
Fannie Mae Multifamily Acquisitions by Area Median Income (AMI)
The substantial majority of multifamily units financed by Fannie Mae continue to be affordable to families at or below 120% of the area median income
666 652 344 286 390Hou sing Goals Elig ible Units
000s
500 430
Fannie Mae’s ability to serve a variety of income segments is a key component of serving the entire multifamily market
Sour ce: Fannie Mae, based on Housing Goals methodology
37 0 469 553
1 Includes Stuyvesant Town transaction in NYC. Workforce AMI in NYC is above 120%.
1
631 27 1
© 2018 Fannie Mae. Trademarks of Fannie Mae. 12YTD June 2018 MF Business Information Presentation 8/7/2018
Sour ce: Fannie Mae
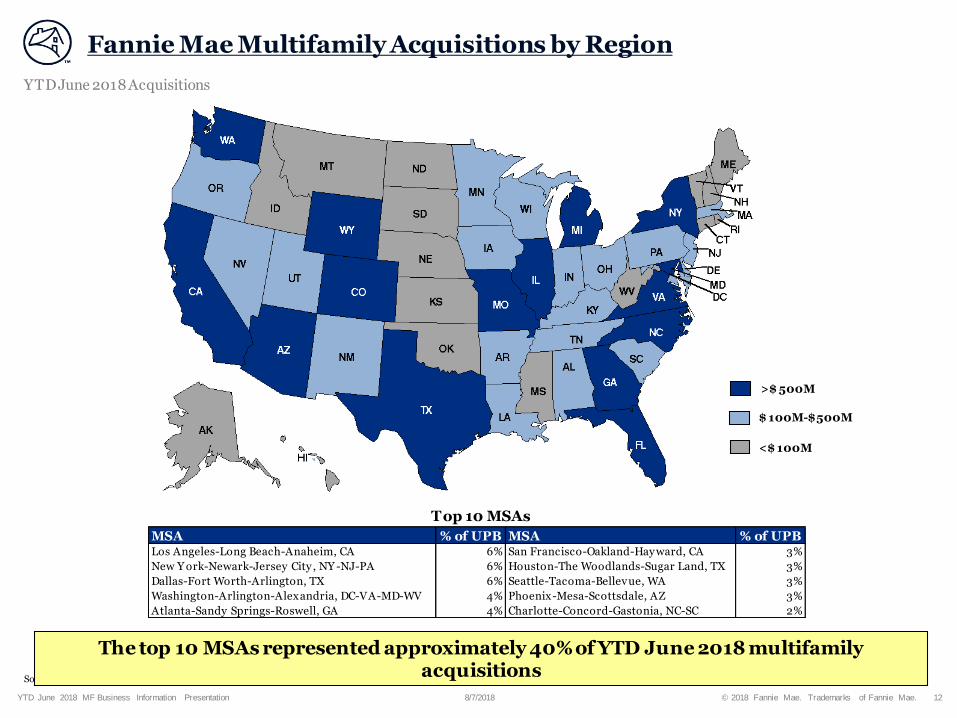
Fannie Mae Multifamily Acquisitions by Region
The top 10 MSAs represented approximately 40% of YTD June 2018 multifamily acquisitions
>$ 500M
$ 100M-$500M
<$ 100M
Top 10 MSAs
YTD June 2018 Acquisitions
MSA % of UPB MSA % of UPBLos Angeles-Long Beach-Anaheim, CA 6% San Francisco-Oakland-Hayward, CA 3%
New Y ork-Newark-Jersey City , NY -NJ-PA 6% Houston-The Woodlands-Sugar Land, TX 3%
Dallas-Fort Worth-Arlington, TX 6% Seattle-Tacoma-Bellevue, WA 3%
Washington-Arlington-Alexandria, DC-VA-MD-WV 4% Phoenix-Mesa-Scottsdale, AZ 3%
Atlanta-Sandy Springs-Roswell, GA 4% Charlotte-Concord-Gastonia, NC-SC 2%

© 2018 Fannie Mae. Trademarks of Fannie Mae. 13YTD June 2018 MF Business Information Presentation 8/7/2018
Fannie Mae Multifamily Guaranty Book -Diversification and Balance
© 2018 Fannie Mae. Trademarks of Fannie Mae. 14YTD June 2018 MF Business Information Presentation 8/7/2018
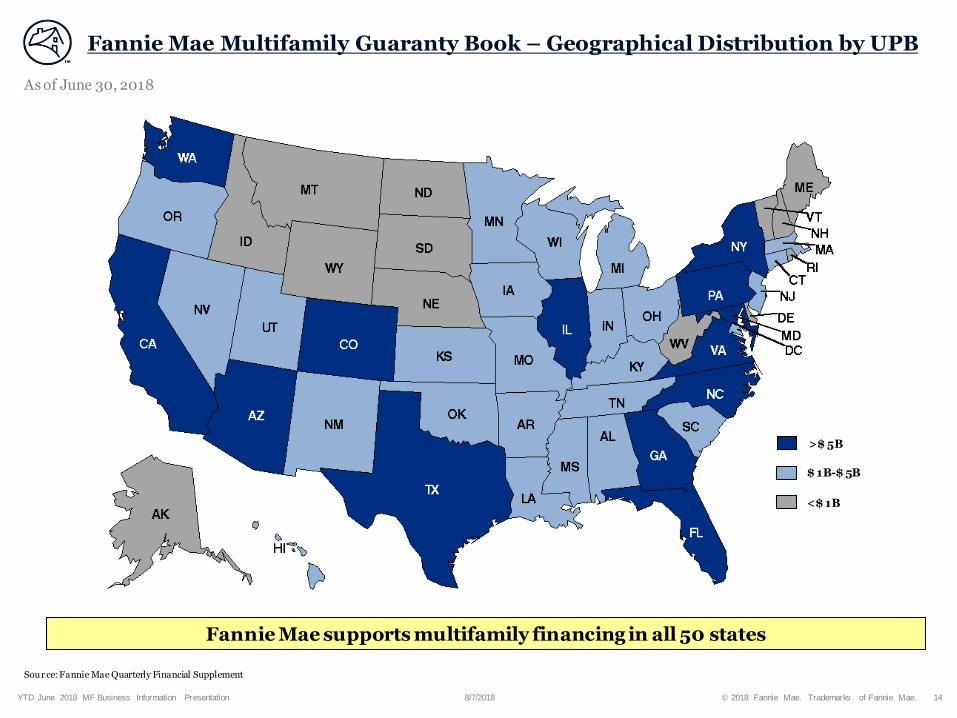
Sour ce: Fannie Mae Quarterly Financial Supplement
Fannie Mae Multifamily Guaranty Book – Geographical Distribution by UPB
Fannie Mae supports multifamily financing in all 50 states
>$ 5B
$ 1B-$ 5B
<$ 1B
As of June 30, 2018

© 2018 Fannie Mae. Trademarks of Fannie Mae. 15YTD June 2018 MF Business Information Presentation 8/7/2018
Fannie Mae Multifamily Guaranty Book – Geographical Distribution by Average Loan Size
Sour ce: Fannie Mae
Fannie Mae’s average multifamily loan size nationwide is $10M
>$ 10M
$ 5M-$ 10M
<$ 5M
As of June 30, 2018
© 2018 Fannie Mae. Trademarks of Fannie Mae. 16YTD June 2018 MF Business Information Presentation 8/7/2018
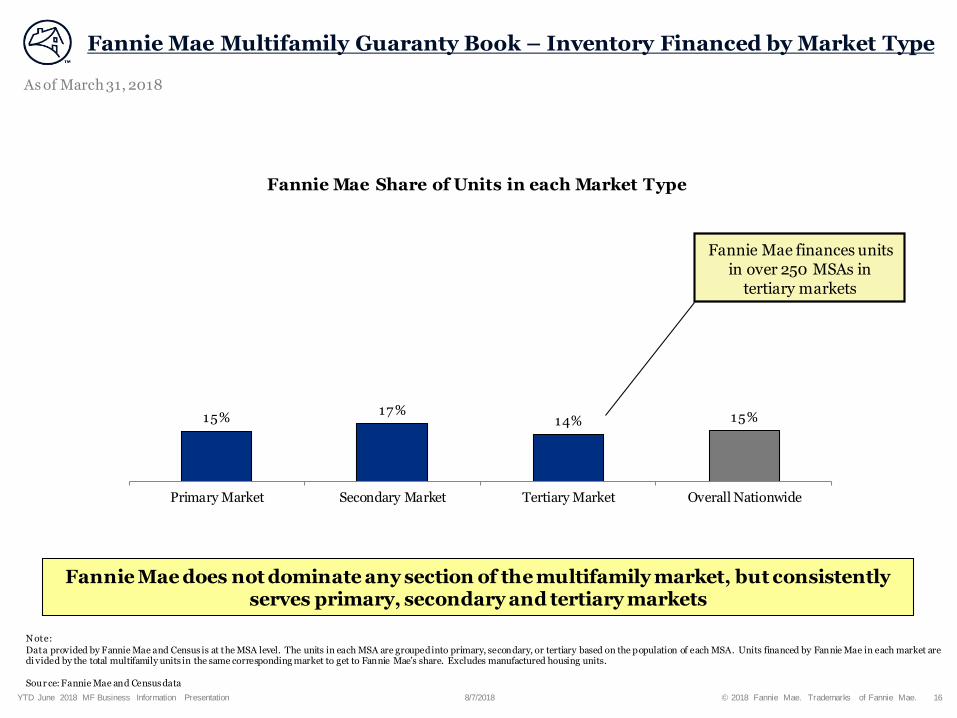
15%17%
14% 15%
Primary Market Secondary Market Tertiary Market Overall Nationwide
Fannie Mae Multifamily Guaranty Book – Inventory Financed by Market Type
Fannie Mae does not dominate any section of the multifamily market, but consistently serves primary, secondary and tertiary markets
Note:
Data provided by Fannie Mae and Census is at the MSA level. The units in each MSA are grouped into primary, secondary, or tertiary based on the population of each MSA. Units financed by Fannie Mae in each market are di vided by the total multifamily units in the same corresponding market to get to Fannie Mae’s share. Excludes manufactured housing units.
Sour ce: Fannie Mae and Census data
Fannie Mae finances units in over 250 MSAs in
tertiary markets
Fannie Mae Share of Units in each Market Type
As of March 31, 2018

© 2018 Fannie Mae. Trademarks of Fannie Mae. 17YTD June 2018 MF Business Information Presentation 8/7/2018
Fannie Mae Mortgage Backed Securities – Capital Markets Liquidity and Stability
© 2018 Fannie Mae. Trademarks of Fannie Mae. 18YTD June 2018 MF Business Information Presentation 8/7/2018
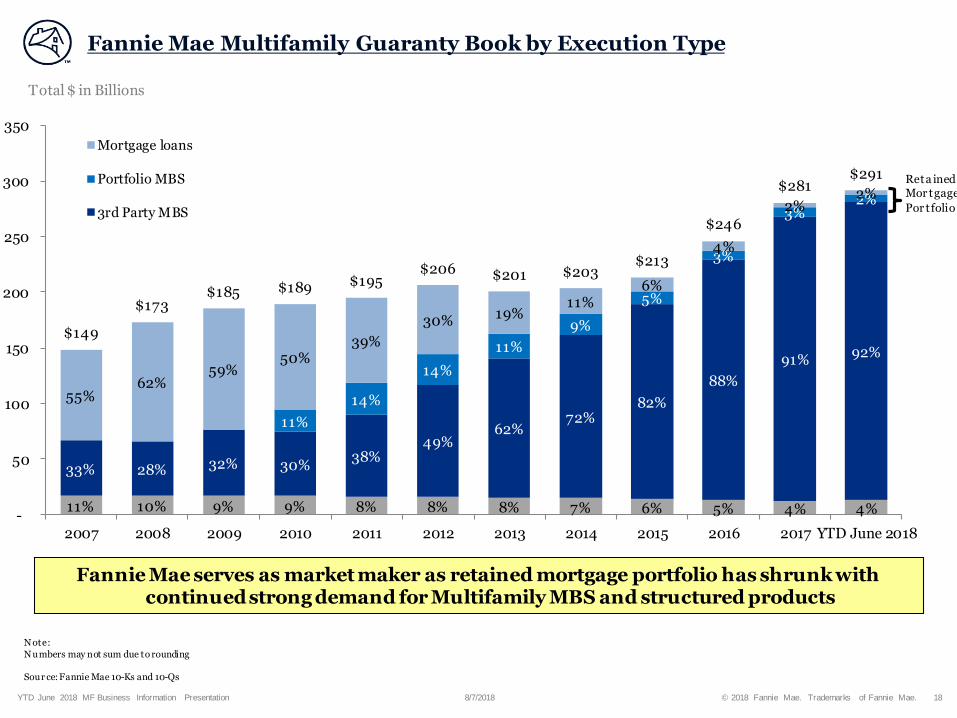
11% 10% 9% 9% 8% 8% 8% 7% 6% 5% 4% 4%
33% 28% 32% 30%38%
49%62%
72%82%
88%
91%92%
11%
14%
14%
11%
9%
5%
3%
3%2%
55%62%
59%50%
39%
30% 19%11%
6%
4%
2%2%
$149
$173$185 $189 $195
$206 $201 $203$213
$246
$281$291
-
50
100
150
200
250
300
350
2007 2008 2009 2010 2011 2012 2013 2014 2015 2016 2017 YTD June 2018
Mortgage loans
Portfolio MBS
3rd Party MBS
Fannie Mae Multifamily Guaranty Book by Execution Type
Fannie Mae serves as market maker as retained mortgage portfolio has shrunk with continued strong demand for Multifamily MBS and structured products
Total $ in Billions
Reta inedMor tgage
Por tfolio
Sour ce: Fannie Mae 10-Ks and 10-Qs
N ote:
N umbers may not sum due to rounding
© 2018 Fannie Mae. Trademarks of Fannie Mae. 19YTD June 2018 MF Business Information Presentation 8/7/2018
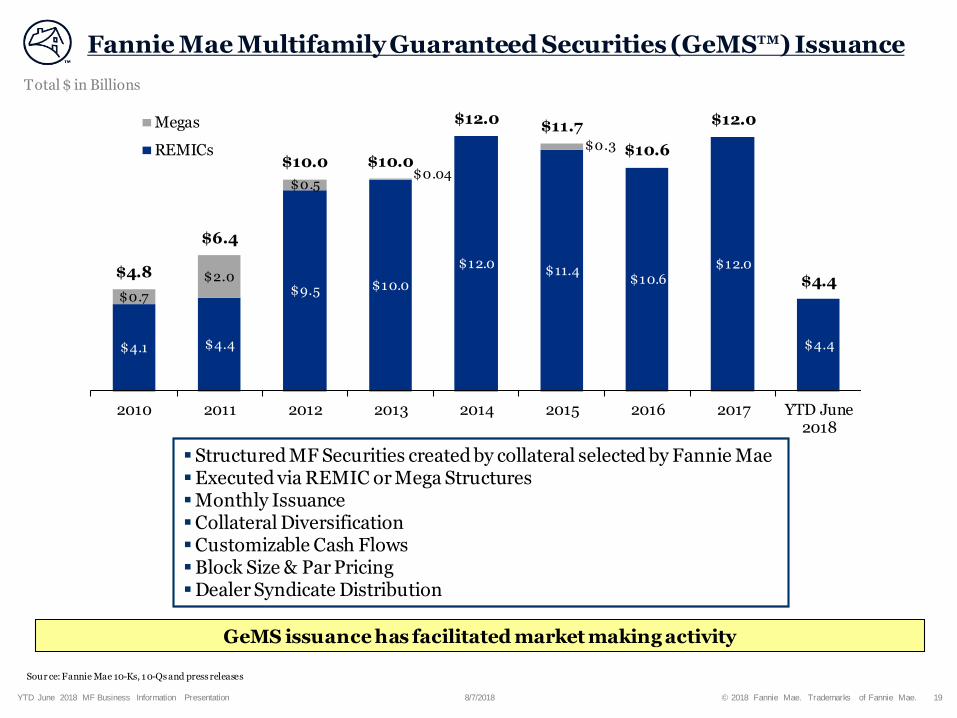
Fannie Mae Multifamily Guaranteed Securities (GeMS™) Issuance
GeMS issuance has facilitated market making activity
Total $ in Billions
Structured MF Securities created by collateral selected by Fannie MaeExecuted via REMIC or Mega StructuresMonthly IssuanceCollateral DiversificationCustomizable Cash FlowsBlock Size & Par PricingDealer Syndicate Distribution
Sour ce: Fannie Mae 10-Ks, 1 0-Qs and press releases
$4.1 $4.4
$9.5 $10.0
$12.0 $11.4
$10.6 $12.0
$4.4
$0.7
$2.0
$0.5$0.04
$0.3
$4.8
$6.4
$10.0 $10.0
$12.0 $11.7
$10.6
$12.0
$4.4
2010 2011 2012 2013 2014 2015 2016 2017 YTD June2018
Megas
REMICs

© 2018 Fannie Mae. Trademarks of Fannie Mae. 20YTD June 2018 MF Business Information Presentation 8/7/2018
0
50
100
150
200
250
Sp
rea
d v
s. s
wa
ps
MBS/DUS 10yr
10yr Freddie K A2
10yr FNMA GeMS A2
New Issue AAA CMBS
Legacy CMBS AAA Super Senior
Sour ce: JPMorgan s
Multifamily Market Spreads
Spreads remained tightened since 2H 2016, but may remain volatile as a result of macroeconomic uncertainty
Trailing Legacy & New Issue AAA CMBS, MBS/DUS®, GeMS and Freddie K Spreads

© 2018 Fannie Mae. Trademarks of Fannie Mae. 21YTD June 2018 MF Business Information Presentation 8/7/2018
Fannie Mae Multifamily Delegated Underwriting and Servicing (DUS®)
© 2018 Fannie Mae. Trademarks of Fannie Mae. 22YTD June 2018 MF Business Information Presentation 8/7/2018
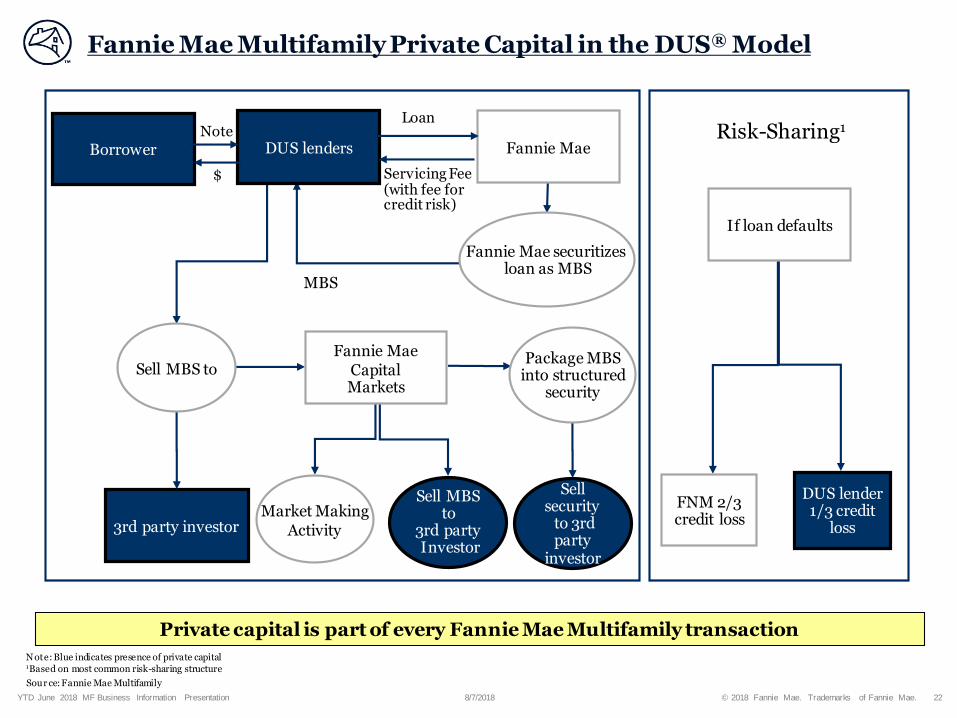
Fannie Mae Multifamily Private Capital in the DUS® Model
Private capital is part of every Fannie Mae Multifamily transaction
Servicing Fee (with fee for credit risk)
Loan
MBS
3rd party investor
DUS lenders
Fannie Mae securitizes loan as MBS
Fannie Mae
Sell MBS toFannie Mae
Capital Markets
Sell MBS to
3rd partyInvestor
Market MakingActivity
If loan defaults
DUS lender 1/3 credit
loss
FNM 2/3credit loss
Sell security
to 3rd party
investor
Package MBSinto structured
security
Risk-Sharing1
BorrowerNote
$
N ote: Blue indicates presence of private capital1Based on most common risk-sharing structure
Sour ce: Fannie Mae Multifamily

© 2018 Fannie Mae. Trademarks of Fannie Mae. 23YTD June 2018 MF Business Information Presentation 8/7/2018
Fannie Mae Multifamily Stakeholder Interests and Risk-Sharing
Competitive pricing
Broad range of financing products
Standardized loan documents
Shorter timelines to
loan closing
Range from individual sponsors to REITs,
pension funds, etc.
Contributes 20%+ equity
Delegated authority
Consistent underwriting and servicing standards
Higher servicing fee income
25 lenders range from independents to large diversified financial institutions
Shares in approximately 1/3 of the credit losses
Steady guaranty fee income
Scalable
Provides financing through all economic cycles
Shares in approximately 2/3 of the credit losses
Highly-rated credit strength
Enhanced liquidity
Call (prepayment) protection
Lower spread volatility
Stable cash flowsInte
rest
s
Borrower Lender Fannie Mae Investor
DUS ® is a unique model that leverages private capital, aligns interests through risk-sharing, and provides attractive structures to investors
© 2018 Fannie Mae. Trademarks of Fannie Mae. 24YTD June 2018 MF Business Information Presentation 8/7/2018
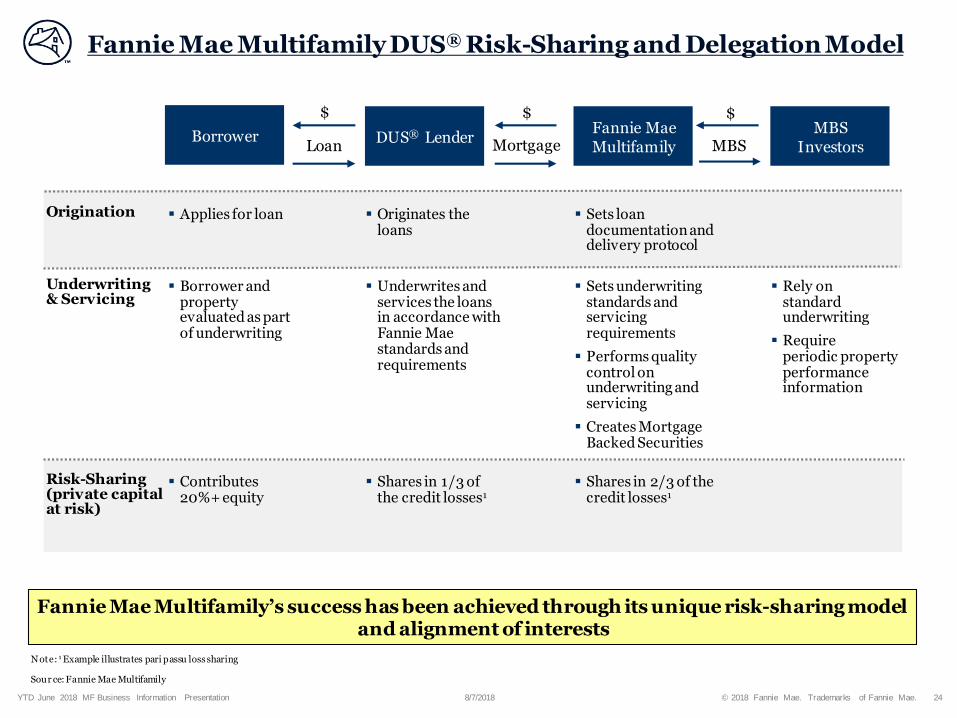
Fannie Mae Multifamily DUS® Risk-Sharing and Delegation Model
Fannie Mae Multifamily’s success has been achieved through its unique risk-sharing model and alignment of interests
MBS Investors
Borrower
$
LoanFannie Mae Multifamily
$
MBSDUS® Lender
$
Mortgage
Origination Originates the loans
Sets loan documentation and delivery protocol
Underwriting & Servicing
Underwrites and services the loans in accordance with Fannie Mae standards and requirements
Sets underwriting standards and servicing requirements
Performs quality control on underwriting and servicing
Creates Mortgage Backed Securities
Risk-Sharing (private capital at risk)
Shares in 1/3 of the credit losses1
Shares in 2/3 of the credit losses1
Contributes 20%+ equity
Applies for loan
Borrower and property evaluated as part of underwriting
Rely onstandard underwriting
Require periodic property performance information
Sour ce: Fannie Mae Multifamily
Note: 1 Example illustrates pari passu loss sharing
© 2018 Fannie Mae. Trademarks of Fannie Mae. 25YTD June 2018 MF Business Information Presentation 8/7/2018
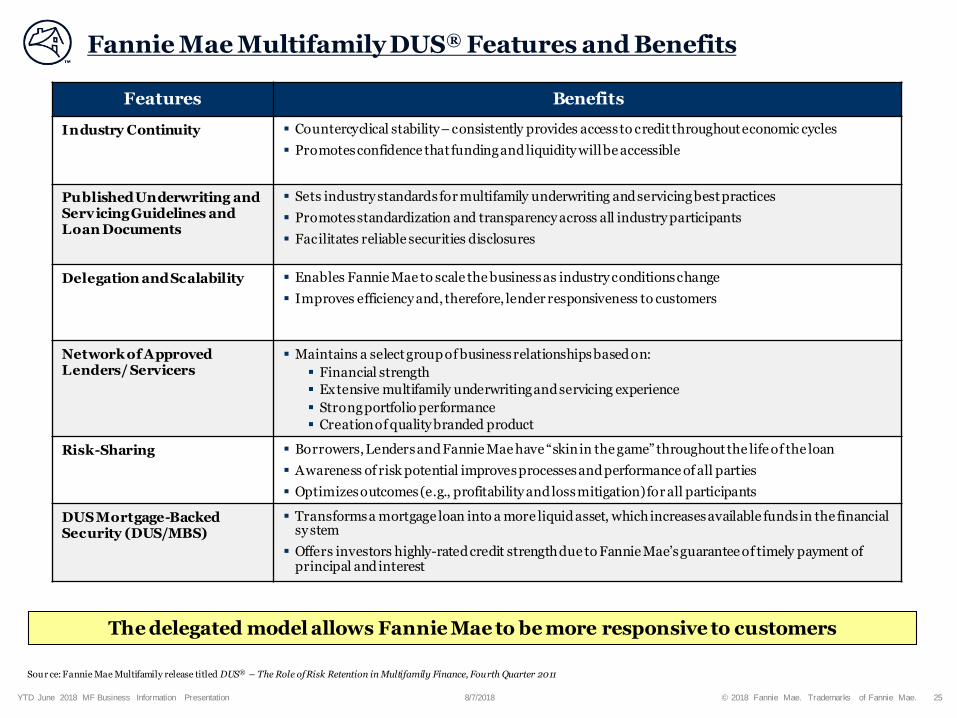
Fannie Mae Multifamily DUS® Features and Benefits
The delegated model allows Fannie Mae to be more responsive to customers
Features Benefits
Industry Continuity Countercyclical stability – consistently provides access to credit throughout economic cycles
Promotes confidence that funding and liquidity will be accessible
Published Underwriting and Servicing Guidelines and Loan Documents
Sets industry standards for multifamily underwriting and servicing best practices
Promotes standardization and transparency across all industry participants
Facilitates reliable securities disclosures
Delegation and Scalability Enables Fannie Mae to scale the business as industry conditions change
Improves efficiency and, therefore, lender responsiveness to customers
Network of Approved Lenders/ Servicers
Maintains a select group of business relationships based on:
Financial strength
Extensive multifamily underwriting and servicing experience
Strong portfolio performance
Creation of quality branded product
Risk-Sharing Borrowers, Lenders and Fannie Mae have “skin in the game” throughout the life of the loan
Awareness of risk potential improves processes and performance of all parties
Optimizes outcomes (e.g., profitability and loss mitigation) for all participants
DUS Mortgage-Backed Security (DUS/MBS)
Transforms a mortgage loan into a more liquid asset, which increases available funds in the financial sy stem
Offers investors highly-rated credit strength due to Fannie Mae’s guarantee of timely payment of principal and interest
Sour ce: Fannie Mae Multifamily release titled DUS® – The Role of Risk Retention in Multifamily Finance, Fourth Quarter 2011
© 2018 Fannie Mae. Trademarks of Fannie Mae. 26YTD June 2018 MF Business Information Presentation 8/7/2018
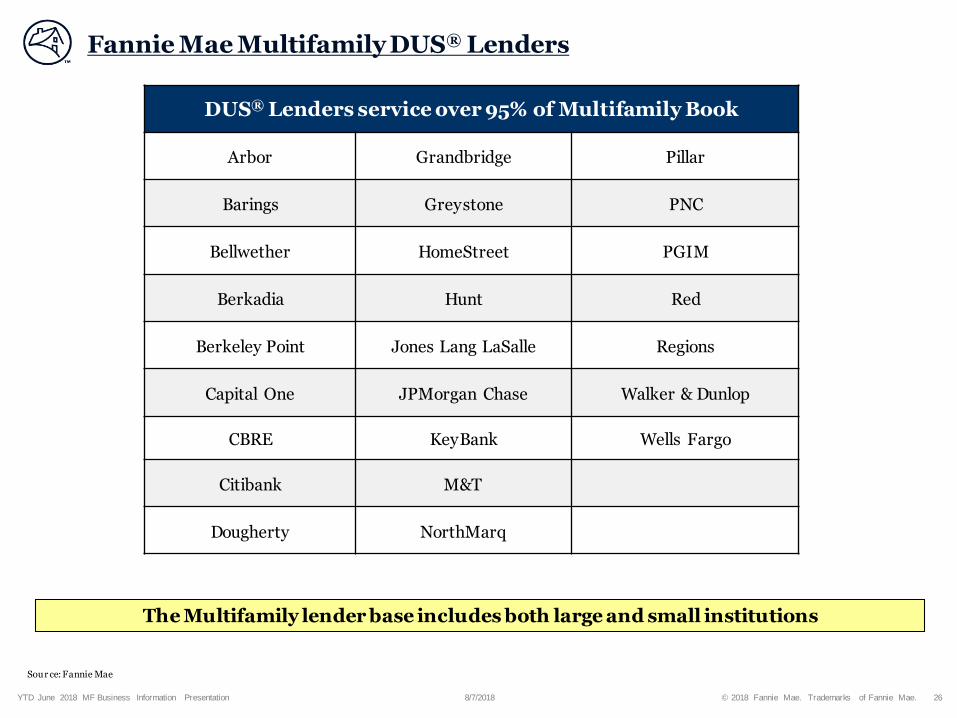
Fannie Mae Multifamily DUS® Lenders
The Multifamily lender base includes both large and small institutions
Sour ce: Fannie Mae
DUS® Lenders service over 95% of Multifamily Book
Arbor Grandbridge Pillar
Barings Greystone PNC
Bellwether HomeStreet PGIM
Berkadia Hunt Red
Berkeley Point Jones Lang LaSalle Regions
Capital One JPMorgan Chase Walker & Dunlop
CBRE KeyBank Wells Fargo
Citibank M&T
Dougherty NorthMarq

© 2018 Fannie Mae. Trademarks of Fannie Mae. 27YTD June 2018 MF Business Information Presentation 8/7/2018
Fannie Mae Multifamily DUS® Risk-Sharing
Lenders have increasingly shared in the risk of multifamily loans delivered to Fannie Mae
Percent of Multifamily Guaranty Book of Business with DUS or Other Lender Risk-Sharing
Sour ce: Fannie Mae 10-Ks and 10-Qs
7 8% 7 8%7 9%
81%
85%
88%
92%
94%
96%97%
2009 2010 2011 2012 2013 2014 2015 2016 2017 YTD June2018

© 2018 Fannie Mae. Trademarks of Fannie Mae. 28YTD June 2018 MF Business Information Presentation 8/7/2018
Managing Multifamily Losses – Fannie Mae vs Lender Loss Sharing
Fannie Mae lender partners have assumed 31% of all losses since 2007
Total $ in Millions
Note: Lender Loss is the portion of total loss owed by the lender, not taking into account any interim loss sharing that the lender may have already advanced at foreclosure
13 17 29
108
240261
187
75
27 23 163
8 911
66
127104
59
28
11 96
1
$22 $26 $40
$175
$368 $365
$246
$103
$38 $32 $22
$4
0
50
100
150
200
250
300
350
400
2007 2008 2009 2010 2011 2012 2013 2014 2015 2016 2017 YTD June2018
Lender Loss
Fannie Mae Loss

© 2018 Fannie Mae. Trademarks of Fannie Mae. 29YTD June 2018 MF Business Information Presentation 8/7/2018
Fannie Mae Multifamily Financial Results
© 2018 Fannie Mae. Trademarks of Fannie Mae. 30YTD June 2018 MF Business Information Presentation 8/7/2018
-0.2%
0.0%
0.2%
0.4%
0.6%
0.8%
1.0%
1.2%
1.4%
2008 2009 2010 2011 2012 2013 2014 2015 2016 2017 Q12018
Fannie Mae Freddie Mac All FDIC Insured Institutions CMBS
0%
1%
2%
3%
4%
5%
6%
20
07
20
08
20
09
20
10
20
11
20
12
20
13
20
14
20
15
20
16
20
17
Q1
20
18
0%
1%
2%
3%
4%
5%
6%
20
07
20
08
20
09
20
10
20
11
20
12
20
13
20
14
20
15
20
16
20
17
Q1
20
18
Fannie Mae
Freddie Mac
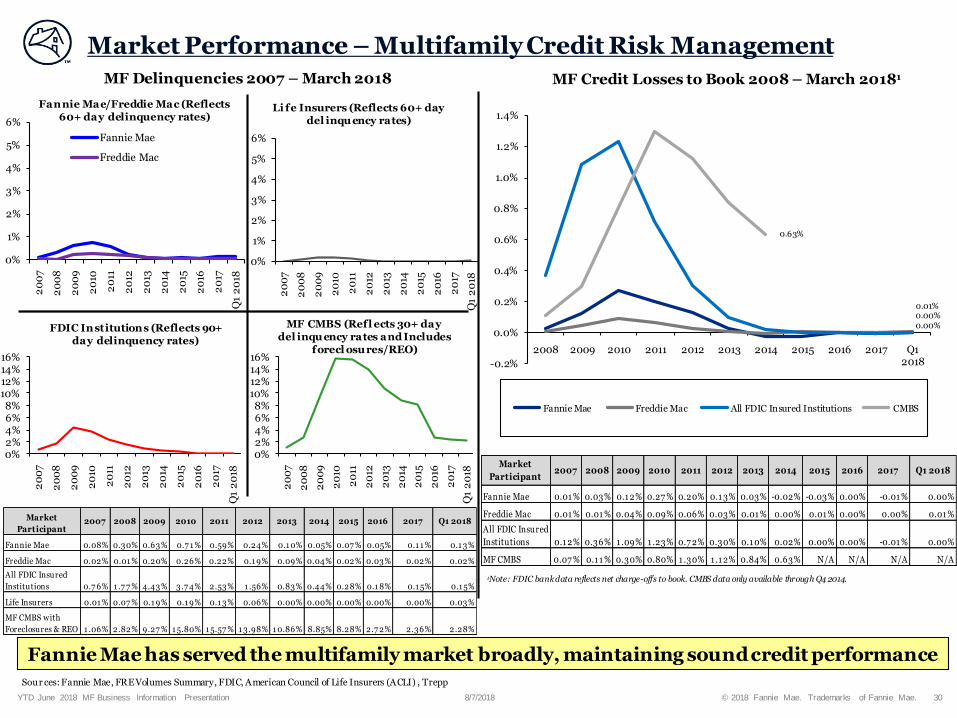
Market Performance – Multifamily Credit Risk Management
Fannie Mae has served the multifamily market broadly, maintaining sound credit performance
1Note: FDIC bank data reflects net charge-offs to book. CMBS data only available through Q4 2014.
Fannie Mae/Freddie Mac (Reflects 60+ day delinquency rates)
Li fe Insurers (Reflects 60+ day del inquency rates)
FDIC Institutions (Reflects 90+ day delinquency rates)
MF CMBS (Refl ects 30+ day del inquency rates and Includes
forecl osures/REO)
MF Credit Losses to Book 2008 – March 20181MF Delinquencies 2007 – March 2018
0.63%
0.01%0.00%
Sour ces: Fannie Mae, FRE Volumes Summary, FDIC, American Council of Life Insurers (ACLI) , Trepp
0%2%4%6%8%
10%12%14%16%
20
07
20
08
20
09
20
10
20
11
20
12
20
13
20
14
20
15
20
16
20
17
Q1
20
18
0%2%4%6%8%
10%12%14%16%
20
07
20
08
20
09
20
10
20
11
20
12
20
13
20
14
20
15
20
16
20
17
Q1
20
18
0.00%
Market
Participant2007 2008 2009 2010 2011 2012 2013 2014 2015 2016 2017 Q1 2018
Fannie Mae 0.08% 0.30% 0.63% 0.7 1 % 0.59% 0.24% 0.1 0% 0.05% 0.07 % 0.05% 0.1 1 % 0.1 3%
Freddie Mac 0.02% 0.01 % 0.20% 0.26% 0.22% 0.1 9% 0.09% 0.04% 0.02% 0.03% 0.02% 0.02%
All FDIC Insured
Institutions 0.7 6% 1 .7 7 % 4.43% 3.7 4% 2.53% 1 .56% 0.83% 0.44% 0.28% 0.1 8% 0.1 5% 0.1 5%
Life Insurers 0.01 % 0.07 % 0.1 9% 0.1 9% 0.1 3% 0.06% 0.00% 0.00% 0.00% 0.00% 0.00% 0.03%
MF CMBS with
Foreclosures & REO 1 .06% 2.82% 9.27 % 1 5.80% 1 5.57 % 1 3.98% 1 0.86% 8.85% 8.28% 2.7 2% 2.36% 2.28%
Market
Participant2007 2008 2009 2010 2011 2012 2013 2014 2015 2016 2017 Q1 2018
Fannie Mae 0.01 % 0.03% 0.1 2% 0.27 % 0.20% 0.1 3% 0.03% -0.02% -0.03% 0.00% -0.01 % 0.00%
Freddie Mac 0.01 % 0.01 % 0.04% 0.09% 0.06% 0.03% 0.01 % 0.00% 0.01 % 0.00% 0.00% 0.01 %
All FDIC Insured
Institutions 0.1 2% 0.36% 1 .09% 1 .23% 0.7 2% 0.30% 0.1 0% 0.02% 0.00% 0.00% -0.01 % 0.00%
MF CMBS 0.07 % 0.1 1 % 0.30% 0.80% 1 .30% 1 .1 2% 0.84% 0.63% N/A N/A N/A N/A

© 2018 Fannie Mae. Trademarks of Fannie Mae. 31YTD June 2018 MF Business Information Presentation 8/7/2018
5%9%
17% 18%
10% 55%19% 27%
13%11% -12%
6 1% 6 0%
5 9%
4 8 %
5 0%
5 3%
-3 4 %
1 14%1 07%
3 84%
1 13%1 00%
3 4 % 4 0%
3 2%
3 5%
3 2%
3 8 %
7 9%
-3 3 % -3 4 % -2 97 % -2 4 %1 2%
$8
$46
$219
$497
$410
$257
$52
($46) ($56)
($4) ($19) $8
<=$5M
$5M <= $25M
$25M+
48%
Fannie Mae Multifamily Credit Losses (Gains) by Loan Size
Diversification by loan size helps drive strong multifamily credit performance
12010 2011 20132012 2014 2015 2016
Total $ in Millions
1Ex cludes $19 million of credit-related income from other Multifamily Mortgage Business Investments
Sour ce: Fannie Mae 10-Ks, 1 0-Qs, Quarterly Financial and Credit Supplements
200920082007 2017YTD June
2018

© 2018 Fannie Mae. Trademarks of Fannie Mae. 32YTD June 2018 MF Business Information Presentation 8/7/2018
6 %0%
1 0% 6 %
2 2 %
5 %9 2 %
1 6% 2 4 %1 5% 1 1% -1 2%
6 9 % 6 5%
6 9 %
6 5%
5 3%
7 1%
-4 8 %
8 5 %1 06%
4 12% 1 16%9 4 %
2 5%
3 5%
2 1%
3 0%2 5%
2 5%
5 7 %
-1 % -3 0% -3 28% -2 8 %1 8 %
$10
$38
$188
$336 $333
$203
$32
($57)($54) ($3) ($19)
$8
<=$5M
$5M <= $25M
$25M+
2011
Fannie Mae Multifamily DUS ® Credit Losses (Gains) by Loan Size
The DUS ® model drives strong credit performance
Sour ce: Fannie Mae 10-Ks, 1 0-Qs and Quarterly Financial and Credit Supplements
2010 20132012 2014 2015 2016
Total $ in Millions
200920082007 2017 YTD June 2018
© 2018 Fannie Mae. Trademarks of Fannie Mae. 33YTD June 2018 MF Business Information Presentation 8/7/2018
2014 2015 2016 2017YTD June
2018
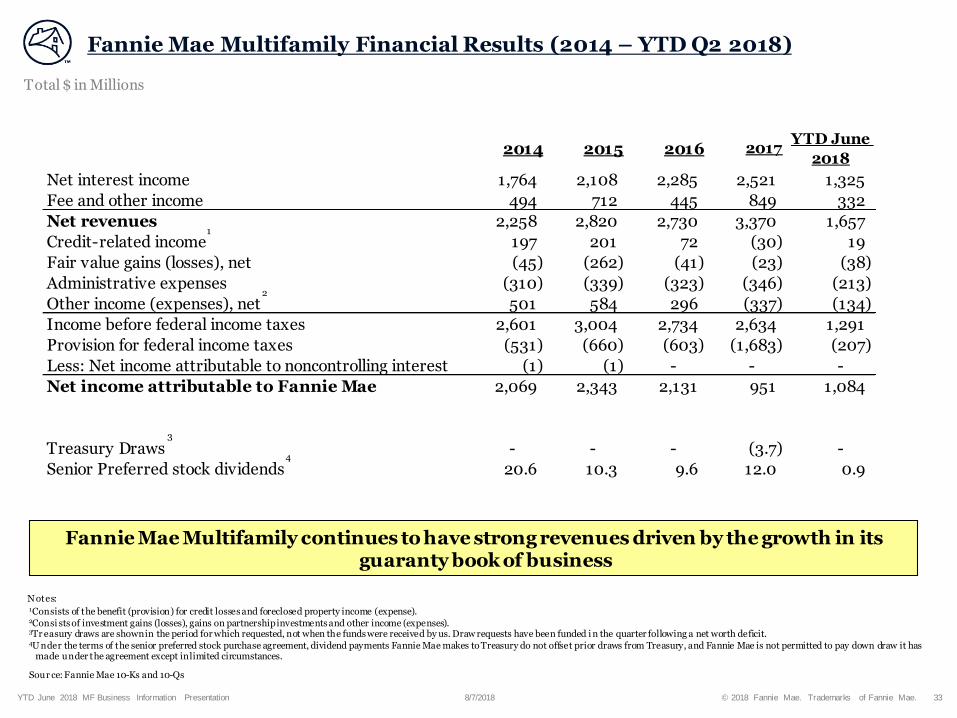
Net interest income 1,764 2,108 2,285 2,521 1,325
Fee and other income 494 712 445 849 332
Net revenues 2,258 2,820 2,730 3,370 1,657
Credit-related income 197 201 72 (30) 19
Fair value gains (losses), net (45) (262) (41) (23) (38)
Administrative expenses (310) (339) (323) (346) (213)
Other income (expenses), net 501 584 296 (337) (134)
Income before federal income taxes 2,601 3,004 2,734 2,634 1,291
Provision for federal income taxes (531) (660) (603) (1,683) (207)
Less: Net income attributable to noncontrolling interest (1) (1) - - -
Net income attributable to Fannie Mae 2,069 2,343 2,131 951 1,084
Treasury Draws - - - (3.7) -
Senior Preferred stock dividends 20.6 10.3 9.6 12.0 0.9
Fannie Mae Multifamily Financial Results (2014 – YTD Q2 2018)
Fannie Mae Multifamily continues to have strong revenues driven by the growth in its guaranty book of business
Sour ce: Fannie Mae 10-Ks and 10-Qs
1
2
1Consists of the benefit (provision) for credit losses and foreclosed property income (expense).2Consi sts of investment gains (losses), gains on partnership investments and other income (expenses).3Tr easury draws are shown in the period for which requested, not when the funds were received by us. Draw requests have been funded i n the quarter following a net worth deficit. 4U nder the terms of the senior preferred stock purchase agreement, dividend payments Fannie Mae makes to Treasury do not offset prior draws from Treasury, and Fannie Mae is not permitted to pay down draw it has
made under the agreement except in limited circumstances.
N otes:
Total $ in Millions
3
4

© 2018 Fannie Mae. Trademarks of Fannie Mae. 34YTD June 2018 MF Business Information Presentation 8/7/2018
Fannie Mae Multifamily Historical Credit Guaranty Results (2007 – 2013)
Sour ce: Fannie Mae 10-Ks and 10-Qs
1MF mar gin, MF operating income and MF pre-tax income are Non-GAAP measures that exclude low income housing tax credits (LIHTC) and multifamily equity investment related amounts and income tax income (expense)2Ear ned on Fannie Mae Multifamily mortgage loans and MBS included in Capital Markets Group’s results. Beginning in 2015, income also includes Capital Market’s yield maintenance.3Tr easury draws are shown in the period for which requested, not when the funds were received by us. Draw requests have been funded in the quarter following a net worth deficit. 4U nder the terms of the senior preferred stock purchase agreement, dividend payments Fannie Mae makes to Treasury do not offset prior draws from Treasury, and Fannie Mae is not permitted to pay down draw it has made
under the agreement except in limited circumstances.
N otes:
(Total $ in millions) 2007 2008 2009 2010 2011 2012 2013
Estimated Multifamily Credit Guaranty Financials
Guaranty fees 470 633 675 791 884 1,040 1,217 Credit losses (8) (52) (220) (498) (391) (257) (52)
MF margin1 462 581 455 293 493 783 1,165
Fee and other income 359 186 100 146 218 207 182
Administrative expenses (548) (404) (363) (384) (264) (269) (280)
MF operating income1 273 363 192 55 447 721 1,067
Other credit income (expenses) (1) (32) (1,996) 304 111 444 635
Other revenue (expenses) (236) (133) (38) (59) 5 19 19
MF pretax income1 36 198 (1,842) 300 563 1,184 1,721
LIHTC/equity/income tax income (expense) 121 (2,387) (7,186) (84) 20 327 8,348
Total MMB net income as reported 157 (2,189) (9,028) 216 583 1,511 10,069
Additional estimated net interest income2 565 785 865 873 827 1,360
Average Multifamily guaranty book of business 131,375 161,722 179,315 186,867 191,984 199,797 204,284
Total Fannie Mae Net Income (Loss)
Net income (loss) attributable to Fannie Mae (2,050) (58,707) (71,969) (14,014) (16,855) 17,224 83,963
Treasury Draws and Senior Preferred Stock Dividend Payments ($B) 2008 2009 2010 2011 2012 2013
Treasury Draws3 (15.2) (60.0) (15.0) (25.9) - -
Senior Preferred stock dividends4 0.0 2.5 7.7 9.6 11.6 82.5

© 2018 Fannie Mae. Trademarks of Fannie Mae. 35YTD June 2018 MF Business Information Presentation 8/7/2018
Additional Fannie Mae Resources
Quarterly/Annual Financial Results and Financial Supplement
http://www.fanniemae.com/portal/about-fm/investor-relations/quarterly-annual-results.html
Fannie Mae Progress Report
http://www.fanniemae.com/portal/about-fm/our-progress.html?utm_source=fmsite&utm_medium=marquee1&utm_campaign=2016progressreport
Fannie Mae Mortgage Market and Programs: “MBSenger”
http://www.fanniemae.com/portal/funding-the-market/mbs/news/mbsenger/index.html
Fannie Mae Commentary
http://www.fanniemae.com/portal/research-insights/perspectives.html
Monthly Summary Report
http://www.fanniemae.com/portal/about-fm/investor-relations/monthly-summary.html
Fannie Mae Multifamily New Business Volumes
https://www.fanniemae.com/content/fact_sheet/multifamily-monthly-business-volumes.pdf
Multifamily Market Commentary, Research and Analysis (“White Papers”), and General Information
https://www.fanniemae.com/multifamily/index
Multifamily DUS Prepayment History Report
http://www.fanniemae.com/portal/funding-the-market/mbs/multifamily/dusprepayment-history.html