Family Quality of Life What We Have Learned Five Years Into a New Field of Study Presented at...
21
Family Quality of Life What We Have Learned Five Years Into a New Field of Study Presented at IASSID-Europe Maastricht, The Netherlands August, 2006 Denise Poston and Ann Turnbull with the contributions of many others University of Kansas -- Beach Center on Disability www.beachcenter.org
-
Upload
lorraine-daniels -
Category
Documents
-
view
212 -
download
0
Transcript of Family Quality of Life What We Have Learned Five Years Into a New Field of Study Presented at...

Family Quality of Life
What We Have Learned Five Years Into a New Field of Study
Presented at IASSID-EuropeMaastricht, The Netherlands
August, 2006
Denise Poston and Ann Turnbull with the contributions of many others
University of Kansas -- Beach Center on Disabilitywww.beachcenter.org
Thanks to Partners and Colleagues
Families of children with disabilities Rud Turnbull Jean Ann Summers, Nina Zuna, George Gotto Janet Marquis, Lesa Hoffman, Kandace Fleming Mian Wang and Hasheem Mannan Jiyeon Park and Loui Lord Nelson The IASSID QOL SIRG Carla Jackson and Mojdeh Bayat Joe Lucyshyn and Beth DeGrace Beach Center office staff throughout the years

Big Ideas to Take Away
Family quality of life is a measurable construct. The Beach Center Family Quality of Life Scale
was developed using a rigorous process. Refinement continues.
The FQOL scale can and has been used for different purposes. How might you use it in your research and practice?
Research using the FQOL scale has added to our knowledge of family quality of life.
Why Study Family Quality of Life?
Previous family outcome measures focused on dysfunction or were narrow in scope.
Family quality of life is global, positive, and universal.
Supports and services for children with ID and their families should enhance family quality of life.
Programs are accountable for family as well as child outcomes.
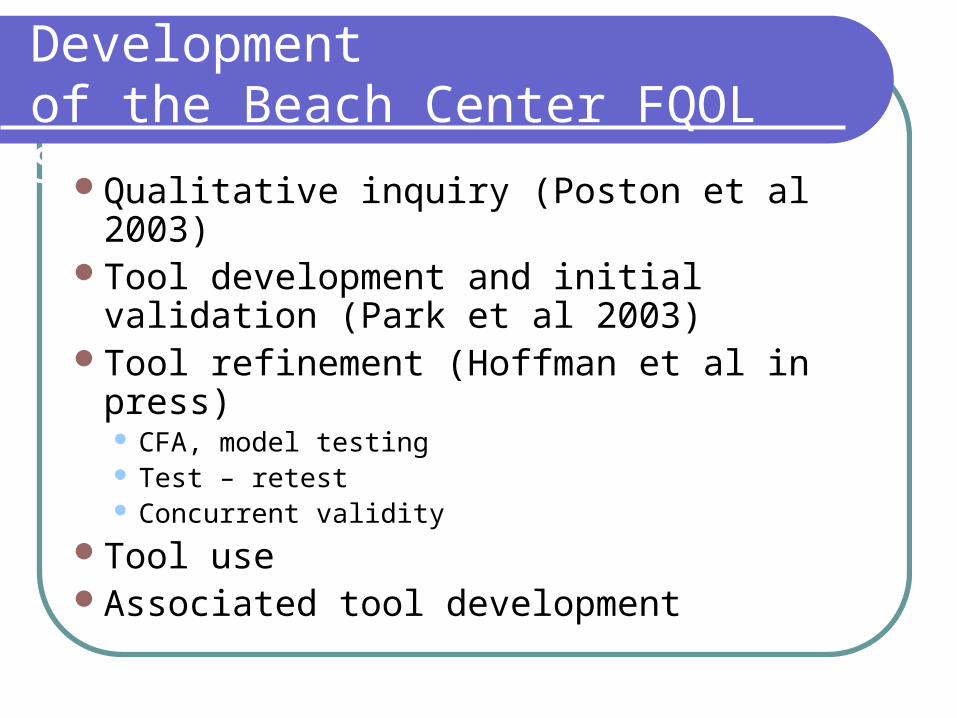
Big Idea #2 – Rigorous Development of the Beach Center FQOL Scale
Qualitative inquiry (Poston et al 2003)Tool development and initial validation
(Park et al 2003)Tool refinement (Hoffman et al in press)
CFA, model testing Test – retest Concurrent validity
Tool useAssociated tool development

Family Quality of Life Model
Family Quality of Life
FamilyInteraction
ParentingPhysical/Material
Well-Being
Disability-RelatedSupport
EmotionalWell-Being

Developing and TestingThe FQOL Model
Developing the model (EFA) 208 families in 7 states; mostly ages birth to 12
Confirming the model (CFA) 280 families in 1 state; mostly ages birth to 5
Cronbach alphas for internal consistencyEvaluate model fit (2, CFI, RMSEA)Continued model testing
120 families of children with autism 385 families in Columbia (older model) 107 couples (mothers and fathers) 566 families of typically developing children
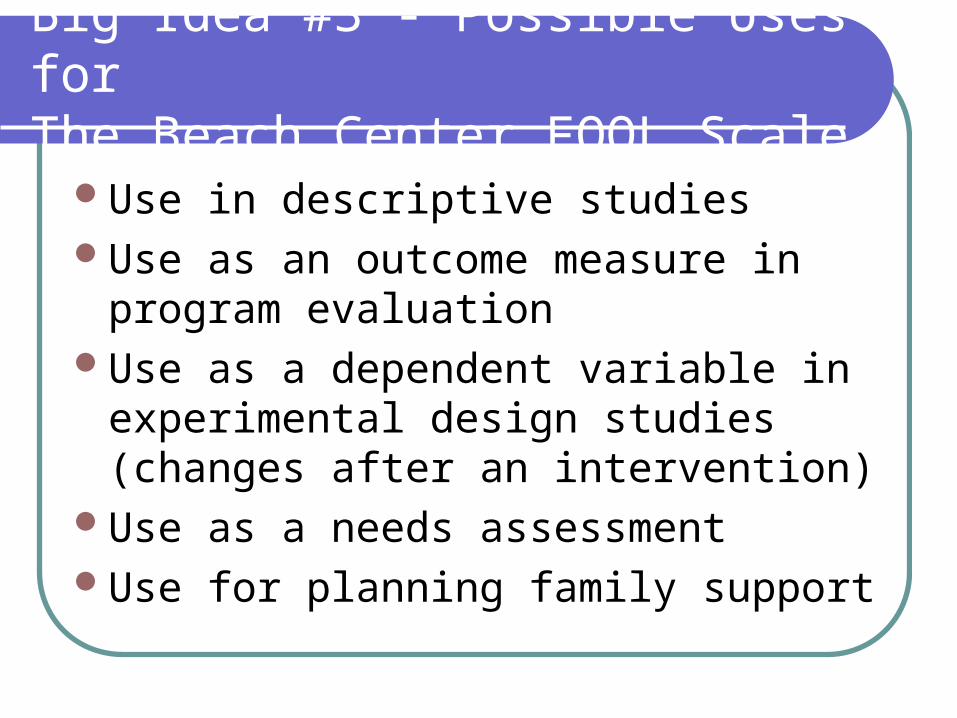
Big Idea #3 - Possible Uses for The Beach Center FQOL Scale
Use in descriptive studies Use as an outcome measure in program
evaluationUse as a dependent variable in
experimental design studies (changes after an intervention)
Use as a needs assessment Use for planning family support

Big Idea #4 - What We Are Learning About Family Quality of Life
This is NOT a meta-analysisResearch conducted at The Beach
Center and other research centersQuantitative and qualitative dataTeaching and applicationsEach additional piece of data helps build
our theory of family quality of lifeBig Idea #1 – Family quality of life is a
measurable construct

What We Are Learning From Qualitative Studies
Advocacy affects family quality of life - families feel a need to advocate, but wish they didn’t have to alone
Spirituality affects family quality of life - provides meaning and source of support
“Although ratings of satisfaction were high, it cannot be inferred that all the family’s needs have been adequately met” Carla Jackson (2005)
The effects of autism on the family 34% reported both positive and negative effects 30% negative effects 28% positive effects 8 % not negative, but different
“Family members articulated that their FQOL is adversely affected in the
areas of parenting, family interaction,and meeting its daily functions and
goals as a result of dealing with stressors of autism”.
Mojdeh Bayat, DePaul University

What We Are Learning From Quantitative Studies
What we are learning about domains and Indicators?
What are the similarities and differences among different populations?
What are demographic and other predictors of family quality of life?
What contributes to family quality of life?

The Domains and Indicators
Domain mean scoresItem mean scores
Consistently lower scoresHaving time to pursue interestsHaving support to relieve stressHaving time to care for all family members
Consistently higher scoresShowing love for each otherHaving adequate transportationGetting medical care when needed
Differences Among Populations
Families of typically developing children (age 4-5) rate their satisfaction higher on all items
Families of children with deafness respond more like families of typically developing children than families of children with ID or DD
Families with lower incomes rate their satisfaction lower
Families in Kansas seem to rate their satisfaction higher

Predictors and Contributors
Income and Severity of Disability as Predictors364 participants from 280 families of children
with mild to moderate disabilities ages birth to 5 in Kansas
Income is positive predictor for mothers’ satisfaction but not for fathers’
Severity is negative predictor for mothers’ and fathers’ satisfaction
Predictors and Contributors
Impact of partnership and services 180 parents of children in early intervention
programs in KansasAssessed satisfaction with services,
partnerships and family quality of lifeThe quality of partnerships with
professionals affects FQOLAdequacy of service affects FQOLPartnerships are a partial mediator between
services and FQOL

Predictors and Contributors
Relationship Between Community Participation and FQOL 332 families of children with developmental
and other disabilities ages birth through young adulthood in 8 states
Families who experience fewer challenges participating in the community report higher quality of life
Challenges with participation are most significantly related to Emotional Well-Being, Physical/Material Well-Being, and Disability-Related Support

Predictors and Contributors
Positive behavioral support intervention (single subject design) for child with life threatening food refusal - introduce snack routine
FQOL scores increase dramatically (old version of scale) FI 3.7 to 4.7 P 2.9 to 3.9 H&S 3.4 to 4.6 FR 2.6 to 3.6 DRS 2.4 to 3.8
“It’s imperative to do a FQOL measure with families when implementing a home-based PBS intervention.” Joe Lucyshyn, University of British Columbia, Canada
Predictors and Contributors
Positive PerceptionsN = 175 families in of children ages 2-18 with
autism spectrum disorder in Illinois2 components of perceptions = positive
contributions of the child to the family and causes of the disability
Perceptions of the child’s positive contributions were predictive of FQOL
Income, child’s age, and parental depression were strongest predictors of FQOL
Satisfaction with services were moderate predictors of FQOL

Impact of Deafness 207 primary caregivers of children ages 2-72
months in 39 states2 uses of FQOL scale – satisfaction and
impact - “to what extent has deafness affected this area of your family life”
Differences between groups and impact of deafness
No significant differences among demographic or intervention groups
Most significant impact on Emotional Well-BeingSmallest impact on Physical/Material Well-Being
Predictors and Contributors

Teaching the Application of Family Quality of Life
Doctoral level special education family seminar Website with success stories and tips for
practitioners related to enhancing partnership and family quality of life in early intervention
Masters level occupational therapy on-line course Use FQOL survey to interview
families and to think about ways to support families
“The information gathered gave me insights to this family that I have never known before, even after four years of working together”.Student in on-line family course

What We Still Need to Learn . . .
High satisfaction scores can give policy makers a false impression that all is well. Is there is a better response format than satisfaction?
How do we best collect and analyze data from multiple family members? Do we need to?
How does the FQOL scale work for families of adults living at home?
How does the FQOL scale work in cross-cultural, cross-language, and cross-country applications?
Does the Beach Center FQOL Scale correlate with the FQOL Survey (Brown et al)?
Which items are most predictive of overall FQOL? What are the “pivotal” or “cusp” interventions that will
most affect family quality of life?