FAMILY PLANNING MARKET REPORT - Clinton Health · PDF filefamily planning market report ......
38
FAMILY PLANNING MARKET REPORT AUGUST 2016 ACKNOLWEDGEMENTS: This report was produced as part of the landmark FP2020 Global Markets Visibility Project that CHAI launched in early 2014 in conjunction with the Reproductive Health Supplies Coalition (RHSC). The shipment data provided by suppliers was pivotal to addressing information gaps and constructing a more comprehensive view of the reproductive health commodi- ties market. We would like to thank current participating suppliers (Bayer, CR Zizhu, Cipla, Cupid, Mylan, Helm AG, Female Health Company, Merck/MSD, Pfizer, Pregna, PT Tunggal, Shanghai Dahua, and SMB) as well as our partner, the Concept Foundation, for their support in collecting and aggregating data from the Generic Manufacturers for Reproductive Health (the GEMS Caucus). We are also grateful to our colleagues from the FP2020, Coordinated Supply Planning Group, UNFPA, USAID, and Track20 for their invaluable feedback in the development and refinement of various market analyses.
Transcript of FAMILY PLANNING MARKET REPORT - Clinton Health · PDF filefamily planning market report ......

FAMILY PLANNING MARKET REPORT
A U G U S T 2 0 1 6
A C K N O L W E D G E M E N T S :
This report was produced as part of the landmark FP2020 Global Markets Visibility Project that CHAI launched in early 2014 in conjunction with the Reproductive Health Supplies Coalition (RHSC).
The shipment data provided by suppliers was pivotal to addressing information gaps and constructing a more comprehensive view of the reproductive health commodi-ties market. We would like to thank current participating suppliers (Bayer, CR Zizhu, Cipla, Cupid, Mylan, Helm AG, Female Health Company, Merck/MSD, Pfizer, Pregna, PT Tunggal, Shanghai Dahua, and SMB) as well as our partner, the Concept Foundation, for their support in collecting and aggregating data from the Generic Manufacturers for Reproductive Health (the GEMS Caucus).
We are also grateful to our colleagues from the FP2020, Coordinated Supply Planning Group, UNFPA, USAID, and Track20 for their invaluable feedback in the development and refinement of various market analyses.

EXECUTIVE SUMMARY
SUPPLIER SHIPMENT ANALYSIS
DONOR FUNDING ANALYSIS
ASSESSING PROGRESS TOWARDS FP2020
GLOBAL MARKETS VISIBILITY PROJECT ACKNOWLEDGEMENTS
APPENDIX A – 69 FP2020 COUNTRIES MARKET VOLUMES BY METHOD AND COUNTRY, 2011–2015
APPENDIX B – DATA SOURCES
APPENDIX C – ESTIMATING THE TOTAL FP2020 PUBLIC SECTOR MARKET SIZE
APPENDIX D – ESTIMATING TOTAL FP2020 DONOR-FUNDED VOLUMES
APPENDIX E – COUNTRY HIGHLIGHTS: BANGLADESH, INDONESIA, AND INDIA
APPENDIX F – KEY TERMS AND DEFINITIONS
APPENDIX G – ACRONYMS
2
4
8
12
13
14
24
25
31
32
36
37

BETWEEN 2011 AND 2015, THE TOTAL 69 FP2020 COUNTRIES PUBLIC SECTOR MARKET1 METHOD MIX SHIFTED IN FAVOR OF LONG-ACTING REVERSIBLE CONTRACEPTIVES, AND IMPLANTS SPECIFICALLY. THIS INCREASE WAS EVEN MORE PRONOUNCED BETWEEN 2013 AND 2015.
THERE IS AN OVERALL INCREASE IN THE NUMBER OF IMPLIED CONTRACEPTIVE USERS IN FP2020 COUNTRIES, EVEN THOUGH TOTAL SHIPMENT VOLUMES2 HAVE DECLINED AS A RESULT OF THE INCREASED DEMAND3 FOR CURRENT LOWER PRICED LONG-ACTING REVERSIBLE IMPLANTS. CONSEQUENTLY, THE FP2020 PUBLIC SECTOR MARKET VALUE HAS REMAINED RELATIVELY FLAT OVER THE PERIOD BETWEEN 2011 AND 2015.
There was a significant increase in demand for implants be-tween 2011 and 2015. The sizeable increase in demand for implants5 from six million units to 10 million units from 2013 to 2015 has resulted in long-acting and reversible contraceptives (LARCs) now making up 34 percent6 of the total FP2020 public sector market value7. The spend7 on implants and IUDs has grown to US$92 million in 2015, up from US$55 million in 2013. LARCs now also represent over 50 percent of the overall implied method mix (Exhibits 1-3, 5).8 Short-acting methods (including condoms, injectables, and oral contraceptives) represent 66 percent of the total FP2020 public sector market value in 2015, down from 80 percent in 2013.
This report covers the total FP2020 public sector market – defined as volumes purchased by institutional buyers (USAID, UNFPA, SMOs, etc.) and Ministry of Health (MOH) or govern-ment-affiliated procurers for the 69 FP2020 focus countries. The report highlights trends between 2011 and 2015, with a focus on significant new findings for the period from 2013 to 2015. Where percentage changes are discussed, the Compound Annual Growth Rate (CAGR)4 is used unless otherwise noted. Numbers may vary slightly between exhibits due to rounding.
1. The total FP2020 public sector market is based on volumes purchased by institutional buyers and MOH or government-affiliated procurers based on RHI data (male condoms) and historical supplier-reported shipment data (female condoms, implants, injectables, IUDs, and orals) for the 69 FP2020 focus countries, defined as countries with a 2010 gross national income (GNI) per capita less than or equal to US$2,500. Although South Africa made an FP2020 commitment, its GNI per capita was greater than US$2,500.2. Shipment volumes refer to the amount of a particular contraceptive method that has been transported.3. Demand refers to the desire for a particular contraceptive method in a country; for the pur-poses of this report, it is assumed that increased procurement is a result of increased demand from users.
4. The compound annual growth rate (CAGR) measures the mean annual growth rate required to get from the initial value to the ending value over a specified period of time.5. There was a 50 percent reduction in implant prices in 2013 as part of the Implant Access Pro-gram (IAP); however, the implant unit cost remains higher relative to other methods, but lower on a cost per couple-years of protection (CYP) basis. See Exhibit 4 for further details. 6. Long-acting and reversible contraceptive methods include IUDs and implants.7. Market value and spend refers to the supplier-reported shipment volume multiplied by the average prices of UNFPA and USAID for the specific years.8. Method mix is the percentage distribution of implied contraceptive users by method.
EXHIBIT 1: TOTAL FP2020 MARKET SIZE (USD)
$0M
$50M
$100M
$150M
$200M
$250M
$300M
$350M
$400M
$58M
2011 2012 2013 2014 2015
$103M
$4M
$95M
$5M
$89M
$10M$54M
$52M $53M $87M
$5M$43M$2M$79M
$13M$41M
$4M
$79M$1M
$91M
$13M$41M
$3M
$81M
$2M
$78M
$9M$47M
$4M
$98M
$1M$60M$11M$45M
Tota
l Mar
ket S
ize
(Mill
ions
USD
)
Condoms - Male
Injectables
Implants IUDs
Orals - EmergencyOrals - Combined andProgestin Only
Condoms - Female
$277M
$362M
$273M$283M
$269M
Note: The sum of individual stacked bars for all exhibits may differ slightly from totals due to rounding.
Sources: [1] Historical Supplier-Reported Shipment Data; [2] RHI Shipment Data, March 2016; [3] UNFPA Contraceptive Price Indicator, 2011–2015; [4] PPMR Data, March 2016; [5] USAID, “Cou-
ple-Years of Protection (CYP),” March 2016; [6] IAP Implant Price.
EXEC
UTIV
E SU
MM
ARY
2
The total number of implied users9 has increased during the period, from 92 million10 in 2011 to 112 million in 2015; the in-creasing trend of implied users is also observed between 2013 and 2015.The estimated number of users using product-based modern methods of contraception, based on data from the supplier-reported and Repro-ductive Health Interchange (RHI) shipment data have increased from 92 million in 2011 to 112 million in 2015. The observed increase is due to the fact that more users are adopting the longer-acting implants, which offer higher couple-years of protection (CYP)11 relative to short-acting methods (Exhibit 3).
The FP2020 public sector market value has remained fairly flat during the period 2011 to 2015. The decrease in value and volume of oral contraceptives shipped to the FP2020 public sector market was offset by the significant increase in implant shipment volumes over the period and the higher unit cost of implants relative to other methods, resulting in a FP2020 public sector market value of US$269 million in 2015 compared to US$277 million in 2011 (Exhibit 1).
Eleven countries represented half of the total FP2020 public sector market value in 2015: Tanzania, Ethiopia, Nigeria, Kenya, Bangladesh, Pakistan, Uganda, Zimbabwe, Malawi, Zambia, and Madagascar. In 2013, seven countries accounted for half of the total FP2020 public sector market value as compared to 11 in 2015. This change in the market concentration is driven by the supplier-reported shipment vol-umes related to Bangladesh, which have declined over the period from 2011 to 2015. This corresponds to a decline in donor-funded shipment volumes for Bangladesh as also recorded in the RHI database and this is also consistent with findings on page 12 of this report indicating that Bangladesh has shifted its procurement towards local and regional suppliers. Shipment data from these suppliers are not currently avail-able under the auspices of this project (Exhibits 7, 8).
Donors spent US$186 million on family planning products in 2015. Overall, there was a slight increase in donor spending between 2011 and 2015, but an annual year-on-year decline of 4 percent from the 2013 spend of US$203 million. Donor spending accounted for 69 percent of the total spending on fam-ily planning products in 2015. (Exhibit 10) As a result of the decrease be-tween 2013 and 2015, the number of users supported by donor funding has also declined by 7 percent since 2013, from 68 million12 to 60 million (Exhibit 11).
The 2013 to 2015 user trends presented in this report and those reported by FP2020 in the “FP2020 Commitment to Action” report are well aligned in that they both underscore an increase in users13. A more detailed discussion of this is described in the “Assessing Progress towards FP2020” section.
9. Implied users and all users referred to in this report are a measure of the number of women using a contraceptive method that is calculated using a method-specific consumption to shipment factor and corresponding couple-years of protection (CYP) factor. See Appendix C for further details.10. Previous report stated 85 million users in 2011; the discrepancy can be attributed to adding the data of two suppliers and change in consumption to shipment factor methodology. See Appendix C for further details. 11. Couple-years of protection is the estimated protection provided by a family planning methodduring a one-year period, based on the volumes of all contraceptives sold or distributed toclients during that period. This report relies upon USAID CYP conversion factors; USAID,
*Male condoms are separated because the source of the shipment data is from RHI whereas all other methods are supplier-reported. See Appendix C for further details.
“Couple-Years of Protection (CYP),” April 2014, available at http://www.usaid.gov/what-we-do/global-health/family-planning/couple-years-protection-cyp. See Appendix C for further details.12. Previous report stated donor-funded procurements supported 65 million users in 2013; the discrepancy can be attributed to adding the data of two suppliers and the change in consump-tion to shipment factor methodology. See Appendix C for further details.13. The numbers in this report differ from FP2020 estimates because they rely on estimates derived from supplier-reported shipment data of family planning commodities within the public sector only, whereas the methodology used to determine total FP2020-reported additional users is estimated based on household survey data that includes both public and private sector coverage, and includes non-product-based methods such as sterilization.
EXHIBIT 2: TOTAL FP2020 MARKET IN TERMS OF VOLUMES (MALE CONDOMS SEPARATED)*
EXHIBIT 3: TOTAL FP2020 USERS ON PRODUCT-BASED MODERN METHODS
3M10M
6M9M
6M8M
6M9M
10M10M
311M 319M283M
5M94M
17M
267M
5M
111M
25M
149M
6M
98M
25M3M 11M
109M
19M
73M
20M
2011 2012 2013 2014 2015Volu
mes
Shi
pped
to F
P202
0 Co
untr
ies
(Mill
ions
)
0M
100M
200M
300M
400M
500M
Injectables
Implants IUDs
Orals - EmergencyOrals - Combined andProgestin Only
Condoms - Female
421M 414M 424M
298M
473M
Note: The sum of individual stacked bars for all exhibits may differ slightly from totals due to rounding
MALE CONDOM SHIPMENT VOLUMES (BILLIONS)
2011 2012 2013 2014 2015
1.62 1.84 1.57 1.39 1.39
0M
20M
40M
60M
80M
100M
120M
Prod
uct-
base
d m
oder
n m
etho
d us
ers
in F
P202
0 co
untr
ies
(Mill
ions
)
2011 2012 2013 2014 20156M 11M 12M 16M 22M
34M
10M1M
31M
0.2M13M
16M1M
31M
0.2M9M
22M29M
13M0M
28M
0.1M11M
32M
15M1M
34M
0.1M13M
37M
15M0M23M0.1M11M
Condoms - Male
Injectables
Implants IUDs
Orals - EmergencyOrals - Combined andProgestin Only
Condoms - Female
92M 93M96 M
106M 112 M
Sources: [1] Historical Supplier-Reported Shipment Data; [2] RHI Shipment Data, March 2016; [3] UNFPA Contraceptive Price Indicator, 2011–2015; [4] PPMR Data, March 2016; [5] USAID, “Cou-
ple-Years of Protection (CYP),” March 2016; [6] IAP Implant Price.
EXEC
UTIV
E SU
MM
ARY
3

4
BETWEEN 2013 AND 2015, INCREASING DEMAND FOR IMPLANTS SHIFTED THE METHOD MIX AND MARKET SHARE14 IN FAVOR OF LARCS. HOWEVER, SHORT-ACTING METHODS CONTINUED TO DOMINATE THE MARKET IN TERMS OF VALUE, DESPITE DECREASING SHIPMENT VOLUMES.
This section of the report analyzes shipment, spend, and user trends in the total FP2020 public sector market from 2011 to 2015 using supplier shipment data from 13 suppliers (an increase from 11 suppliers in the previous report) for all product-based methods except for male condoms, which derive from the Reproductive Health Interchange (RHI) database.
14. Market share is the percentage of total value of shipment volumes in a market captured by a certain contraceptive method.
METHOD UNITS PER CYPUNIT COST COST PER CYP
2011 2012 2013 2014 2015 2011 2012 2013 2014 2015
Condoms - Female 120.00 $0.56 $0.55 $0.54 $0.53 $0.52 $67.02 $66.42 $65.04 $63.36 $62.40
Condoms - Male 120.00 $0.03 $0.03 $0.03 $0.03 $0.03 $3.34 $3.52 $3.56 $3.57 $3.51
Injectables - 1 month 13.00 $0.84 $0.85 $0.84 $0.85 $0.85 $10.92 $11.05 $10.95 $11.05 $11.05
Injectables - 2 month 6.00 N/A N/A $1.30 $1.30 $1.15 N/A N/A $7.80 $7.80 $6.90
Injectables - 3 month 4.00 $0.82 $0.82 $0.78 $0.79 $0.76 $3.27 $3.27 $3.12 $3.17 $3.05
Orals – Combined 15.00 $0.31 $0.30 $0.28 $0.30 $0.28 $4.70 $4.44 $4.26 $4.43 $4.20
Orals – Progestin Only 15.00 $0.32 $0.32 $0.31 $0.31 $0.32 $4.84 $4.85 $4.64 $4.60 $4.80
Orals – Emergency 20.00 $0.34 $0.49 $0.44 $0.30 $0.37 $6.74 $9.74 $8.84 $5.92 $7.40
Implants - 3 Year 0.40 $18.20 $17.92 $8.50 $8.50 $8.50 $7.28 $7.17 $3.40 $3.40 $3.40
Implants - 4 Year 0.31 N/A N/A $8.50 $8.50 $8.50 N/A N/A $2.66 $2.66 $2.66
Implants - 5 Year 0.26 $19.43 $18.05 $8.50 $8.50 $8.50 $5.11 $4.75 $2.24 $2.24 $2.24
IUDs 0.22 $0.43 $0.43 $0.43 $0.48 $0.47 $0.09 $0.09 $0.09 $0.10 $0.10
EXHIBIT 4: COST PER COUPLE-YEARS OF PROTECTION BY METHOD (USD)
The 2013 implant price reduction contributed to the significant increase in demand for implants, with shipment volumes in-creasing from six million in 2013 to 10 million in 2015; implants spending increased from US$52 million to US$87 million. Implants alone represented 32 percent of the market value in 2015, up from 19 percent in 2013. However, short-acting methods continue to hold a dominating market share at 66 percent, although down from 80 percent in 2013. Among short-acting methods, orals exhibited the most significant change with a decrease in market share from 31 percent in 2013 to 17 percent in 2015, driven by continued declining shipment volumes (Exhibits 1, 2, 5).
The implied number of users on product-based methods in 2015 grew from 93 million users15 in 2013 to 112 million users in 2015. Due to the higher couple-years of protection offered by LARCs, more users can be served by lower product volumes. Thus, even though total shipment volumes decreased during the period, there were 112 million total users implied by the supplier-reported shipment volumes in 2015, up from 93 million in 2013. LARCs represented 51 percent of the implied user method mix in 2015, up from 43 percent in 2013. This shift was most clearly seen from 2014 to 2015, whereas the method mix remained relatively stable from 2013 to 2014 (Exhibits 3, 5).
Sources: [1] Historical Supplier-Reported Shipment Data; [2] RHI Shipment Data, March 2016; [3] UNFPA Contraceptive Price Indicator, 2011–2015; [4] PPMR Data, March 2016; [5] USAID, “Cou ple-
Years of Protection (CYP),” March 2016; [6] IAP Implant Price.
SUPP
LIER
SHI
PMEN
T AN
ALYS
IS
15. Previous report stated 90 million users in 2013; the discrepancy can be attributed to adding the data of two suppliers and the change in consumption to shipment factor methodology. See Appendix C for further details.

5
Note: The sum of individual stacked bars for all exhibits may differ slightly from totals due to rounding
Sources: [1] Historical Supplier-Reported Shipment Data; [2] RHI Shipment Data, March 2016; [3] UNFPA Contraceptive Price Indicator, 2011–2015; [4] PPMR Data, March 2016; [5] USAID, “Cou-
ple-Years of Protection (CYP),” March 2016; [6] IAP Implant Price.
Met
hod
Mix
Condoms - Male
Injectables
Implants IUDs
Orals - EmergencyOrals - Combined andProgestin Only
Condoms - Female
2011 2012 2013 2014 2015
92 M
0%
20%
40%
60%
80%
100%
7% 10%
30%
14%1%
32%
0.1%12%
12%
31%
14%0.2%
30%
0.1%12%
16%
23%
16%1%
33%
0.2%10%
20%
31%
9%1%28%
0.2%11%
40%
16%0.2%25%
0.1%12%
92M 106M 93M 96M 112MM
arke
t Sha
re
Condoms - Male
Injectables
Implants IUDs
Orals - EmergencyOrals - Combined andProgestin Only
Condoms - Female
2011 2012 2013 2014 20150%
20%
40%
60%
80%
100%
$277M $362M $273M $283M $269M
21% 29%
1%
26%
1%
25%
3%15%
19%1%
30%
1%
29%
3%17%
19%1%
28%
1%
32%
5%15%
32%
2%16%1%
29%
5%15%
2%
35%
0.4%22%
4%16%
EXHIBIT 5: FP2020 CONTRACEPTIVE SHIPMENT MIX (IN TERMS OF VOLUMES), METHOD MIX (IN TERMS OF USERS), AND MARKET SHARE (IN TERMS OF DOLLARS) BY YEAR
SHIPMENT MIX 2011 2012 2013 2014 2015
Condoms - Female 1.0% 0.8% 0.9% 1.4% 1.5%
Condoms - Male 79% 80% 79% 77% 82%
Implants 0.2% 0.2% 0.3% 0.3% 0.6%
Injectables 3.6% 4.7% 4.7% 6.1% 5.8%
IUDs 0.5% 0.4% 0.4% 0.5% 0.6%
Orals - Emergency 0.1% 0.5% 0.2% 0.3% 0.4%
Orals - Combined & Progestin Only 15% 14% 14% 15% 9%
Total Volumes 2.04 B 2.32 B 1.98 B 1.82 B 1.69 B
IUDsImplants - 5 YearImplants - 4 Year
Injectables - 3 monthImplants - 3 YearCondoms - Male
Orals - Combined Orals - Progestin OnlyInjectables - 2 month
Orals - EmergencyInjectables - 1 month
Condoms - Female
Cost of Product per Year of Use in 2015 (USD)
$0.10$2.24$2.66$3.05$3.40$3.51$4.20$4.80
$6.90$7.40
$11.05$62.40
0 10 20 30 40 50 60 70
EXHIBIT 4: COST PER COUPLE-YEARS OF PROTECTION BY METHOD (USD) (CONTINUED)
SUPP
LIER
SHI
PMEN
T AN
ALYS
IS
6
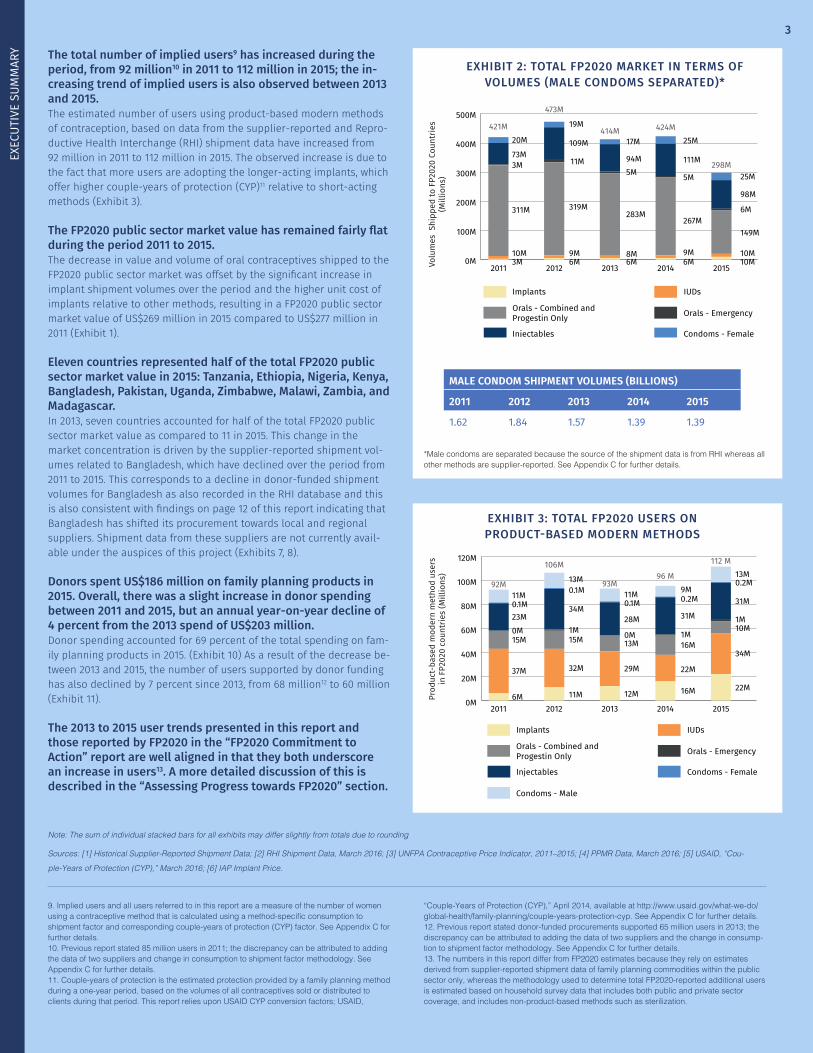
In 2015, Tanzania, Ethiopia, Nigeria, Kenya, Bangladesh, Pa-kistan, Uganda, Zimbabwe, Malawi, Zambia, and Madagascar accounted for US$133 million in market value annually, or 50 percent of the total public sector market. The seven countries which accounted for over 50 percent of the 2013 to-tal FP2020 public sector market value remain on this list, but they now account for less than 50 percent of the 2015 total FP2020 public sector market value. This is due to a continual decline in shipment volume to Bangladesh, resulting in a market value drop from US$70 million in 2011 to US$13 million in 2015. This corresponds to a decline in donor-funded shipment volumes to Bangladesh over the same period as observed in the RHI database. This shift should not be interpreted as a decline in use of contraception in Bangladesh, but represents a shift to local and regional suppliers as evidenced by the government’s purchase orders and procurement reports, which is further described on page 12 (Exhibits 6, 7, 8).
ELEVEN COUNTRIES ACCOUNT FOR HALF OF THE TOTAL FP2020 PUBLIC SECTOR MARKET IN 2015.
LARCs accounted for the majority of product-based method mix in nearly half of the top 20 countries in terms of users. In 2015, LARCs constituted the majority of the user method mix in eight out of the top 20 countries (an increase from six out of 20 in 2013): Tan-zania, Ethiopia, Kenya, Pakistan, Uzbekistan, India, Vietnam, and Phil-ippines. In half of those eight countries (Tanzania, Ethiopia, Kenya, and Philippines16), implant users represented more than half the number of implied LARC users. In the 12 remaining countries, short-acting method users represented the majority of method mix. Injectables represented more than 50 percent of implied short-acting method users in 10 of the 12 countries: Bangladesh, Nigeria, Uganda, Malawi, Zambia, Madagas-car, Myanmar, Ghana, Mozambique, and Honduras. It is important to note however that some of these top 20 countries may also procure domestically from suppliers that may not be participating in the Global Markets Visibility Project at this time. As a result, although indicative, the analysis of users by method may not comprehensively reflect each country’s product-based modern method mix (Exhibit 9).
38% 30%
2%3%
56%
9%
29%2%4%
57%
8%
32%
2%1%
53%
11%
21%2%1%
62%
14%
2%4%
43%
14%
Mar
ket S
hare
Unknown FP2020 Region
Asia & Pacific Latin America & Caribbean
Sub-Saharan AfricaMiddle East & North Africa
2011 2012 2013 2014 2015
$277 M $362M $273M $283M $269M
0%
20%
40%
60%
80%
100%
EXHIBIT 6: TOTAL FP2020 MARKET SHARE BY REGION (USD)
Note: The sum of individual stacked bars for all exhibits may differ slightly from totals due to rounding
Sources: [1] Historical Supplier-Reported Shipment Data; [2] RHI Shipment Data, March 2016; [3] PPMR Data, March 2016; [4] USAID, “Couple-Years of Protection (CYP),” March 2016.
*The “Unknown FP2020 Region” represents the proportion of shipment volumes to procurer warehouses where the final FP2020 desti-nation is unknown. See Appendix C for further details.
*
SUPP
LIER
SHI
PMEN
T AN
ALYS
IS
16. The number of actual implant users in the Philippines in 2015 is likely lower than the shipment-implied estimates. This is due to a Temporary Restraining Order (TRO) issued by the Supreme Court of the Republic of Philippines on June 17, 2015, as attested to in the Depart-ment Memorandum No. 2015-0216 from the Office of the Secretary of the Department of Health (DOH) of the Republic of the Philippines on July 1, 2015. The TRO banned any and all pending
registration and/or re-certification of reproductive products and supplies, and restrained the DOH from procuring, selling, distributing, dispensing or administering, advertising and promot-ing the hormonal contraceptive Implanon and Implanon NXT. As of the date of publication of this report, this legal matter was still ongoing.

7
Sources: [1] Historical Supplier-Reported Shipment Data; [2] RHI Shipment Data, March 2016; [3] PPMR Data, March 2016; [4] USAID, “Couple-Years of Protection (CYP),” March 2016.
Tota
l Mra
ket S
ize
(Mill
ions
USD
)
Top 11 Countries Other FP2020 Countries
2011 2012 2013 2014 2015
$277M $273M $269M$283M
$362M
$0M
$50M
$100M
$150M
$200M
$250M
$300M
$350M
$400M
$165M$229M
$133M
$160M
$113M
$148M
$135M
$133M
$135M$113M
EXHIBIT 8: TOP MARKETS (DETERMINED BY 2015 DATA) AND OTHER FP2020 MARKETS
EXHIBIT 9: TOP 20 COUNTRIES IN TERMS OF USERS, 2015
EXHIBIT 7: TOP 11 COUNTRIES IN TERMS OF MARKET SIZE, 2015
7%
50%
6%
5%
5%
5%
4%
4%
4%4%
3%3%
Tanzania
Ethiopia
Nigeria
Kenya
Bangladesh
Pakistan
Uganda
Zimbabwe
MalawiZambiaMadagascar
Other FP2020 Countries
* Top 11 countries include Tanzania, Ethiopia, Nigeria, Kenya, Bangladesh, Pakistan, Uganda, Zimbabwe, Malawi, Zambia, and Madagascar.
*
Note: The sum of individual stacked bars for all exhibits may differ slightly from totals due to rounding
Condoms - Male & Female
Implants Orals - Combined and Progestin Only
Injectables
IUDs
Orals - Emergency
0M 2M 4M 6M 8M 10M 12M 14M
PakistanUzbekistan
EthiopiaTanzania
Bangladesh
Top
20 C
ount
ries
NigeriaIndia
KenyaUganda
VietnamMadagascar
MalawiMyanmar
ZambiaZimbabwe
PhilippinesCongo Dem Rep
GhanaMozambique
Honduras
SUPP
LIER
SHI
PMEN
T AN
ALYS
IS
8
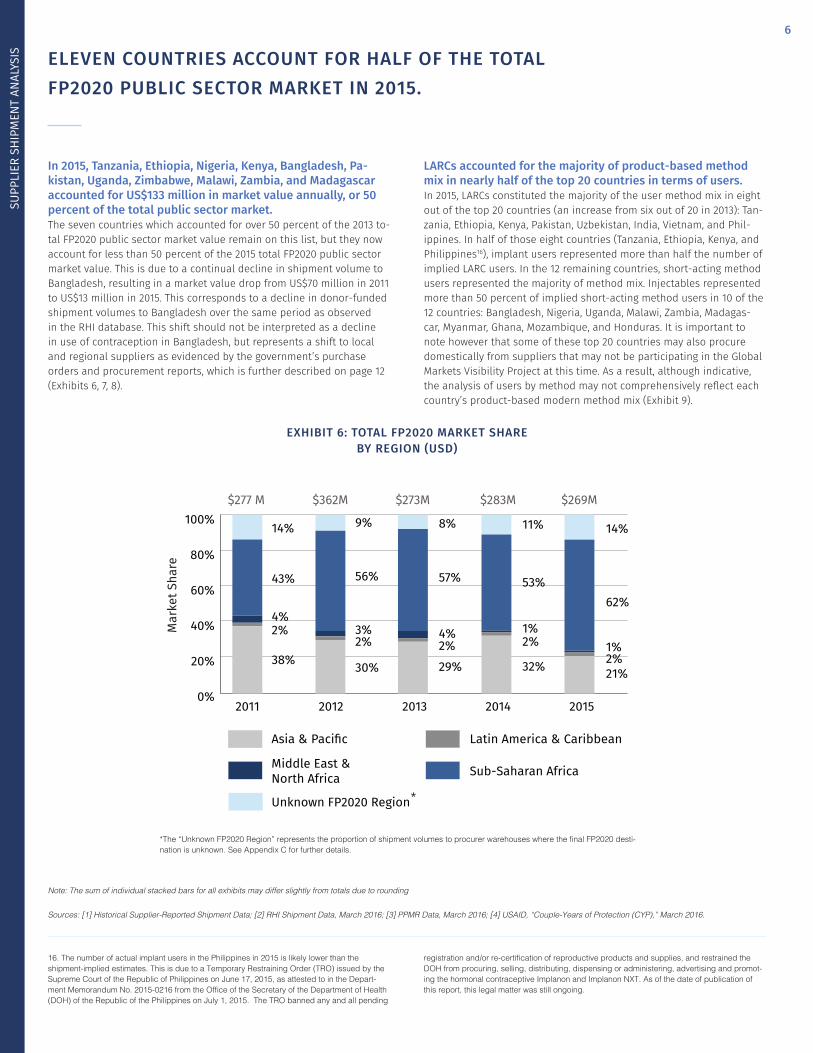
IN 2015, DONOR SPENDING DECREASED TO US$186 MILLION FROM US$203 MILLION IN 2013. CONSEQUENTLY, DONOR-FUNDED PROCUREMENT SUPPORTED 60 MILLION USERS OF PRODUCT-BASED METHODS IN 2015, DOWN FROM 68 MILLION17 IN 2013. THE INCREASED DEMAND FOR IMPLANTS IS REFLECTED IN THE PROCUREMENT PATTERNS OF BOTH UNFPA AND USAID.
This section of the report analyzes donor spend and user trends in the total FP2020 public sector market from 2011 to 2015, based on RHI shipment data for all methods.
UNFPA’s contraceptive procurement spending for the to-tal FP2020 public sector market was US$94 million in 2015 compared to US$110 million in 2013, an annual year-on-year decrease of 8 percent. Comparatively, USAID’s funding in-creased from US$79 million in 2013 to US$89 million in 2015, an annual year-on-year increase of 6 percent. Other donors’ spending decreased from US$14 million to US$3 million, an annual year-on-year decrease of 54 percent over the same period (Exhibit 10).
In 2015, donor-funded procurements supported 53 percent of total users implied by the supplier-reported shipment data; this represents an annual year-on-year decrease of 7 percent from 2013. The total number of users supported by UNFPA decreased from 35 million in 2013 to 31 million in 2015, whilst USAID’s total user support remained relatively stable over that period from 27 million in 2013 to 28 million in 2015. Other donor-funded user support has continued to decrease from six million in 2013 to one million in 2015, an annual year-on-year decrease of 54 percent (Exhibit 10).
17. Previous report stated donor-funded procurements supported 65 million users in 2013; the discrepancy can be attributed to an updated RHI dataset and the change in consumption to shipment factor methodology.
Sources: [1] Historical Supplier-Reported Shipment Data; [2] RHI Shipment Data, March 2016 [3] UNFPA Contraceptive Price Indicator, 2011–2015; [4] PPMR Data, March 2016; [5] USAID, “Cou-
ple-Years of Protection (CYP),” March 2016; [6] IAP Implant Price.
Note: The sum of individual stacked bars for all exhibits may differ slightly from totals due to rounding
Prod
uct-
base
d m
oder
n m
etho
d us
ers
in F
P202
0 co
untr
ies
(Mill
ions
)
USAID-funded Donor-funded, UNFPA-procured
Other Global Markets Visibility VolumesOther Donor-funded
2011 2012 2013 2014 2015
92M106M
93M 96M112 M
0M
20M
40M
60M
80M
100M
120M
30M 26M
27M
10M
43M
27M
35M
6M
25M
30M
26M
3M
36M
28M
31M
1M
52M
16M7M
40M
Com
mod
ity S
pend
ing
(Mill
ions
USD
)
USAID-funded Donor-funded, UNFPA-procured
Other Global Markets Visibility VolumesOther Donor-funded
2011 2012 2013 2014 2015
$277M
$362M
$273M $283M $269M
$0M
$50M
$100M
$150M
$200M
$250M
$300M
$350M
$400M
$107M $93M
$92M
$38M
$138M
$79M
$110M
$14M$70M
$88M
$92M
$10M
$94M
$89M
$94M
$3M
$83M
$41M$24M
$105M
EXHIBIT 10: DONOR-SUPPORTED USERS & COMMODITY COSTS
DONO
R FU
NDIN
G AN
ALYS
IS

9
The demand for implants in donor-supported countries has continued to increase since 2013. Between 2013 and 2015, donor-funded implant shipment volumes have increased from six million to eight million, an annual year-on-year increase of 6 percent, while shipment volumes for all other meth-ods have decreased, resulting in an estimated 18 million users using donor-funded implants in 2015, up from 11 million in 2013 (Exhibit 11).18 Implants have now become the top contraceptive method in terms of donor spending, accounting for 37 percent of all donor-spend on contraceptives. By contrast, the next highest methods, injectables and male condoms, each represented approximately one-fifth of the 2015 donor spend.
The purchasing patterns of USAID and UNFPA demonstrate a relatively stable method mix between LARCs and short-acting methods, with implant users surpassing IUD users in terms of LARCs. The implied method mix from USAID’s 2015 contraceptive procurements reveals that, at 64 percent (same level as in 2013), short-acting methods continue to dominate the method mix. Short-acting methods accounted for a little more than half (52 percent) of the implied method mix from UNFPA procurements in 2015, a moderate increase from 46 percent in 2013.
Within LARC users, implant users accounted for 68 percent of all USAID implied LARC users in 2015, a significant increase from 19 percent in 2013; for UNFPA, implant users represented 73 percent of all implied LARC users in 2015, a significant increase up from 48 percent in 2013 (Exhibit 11).
Sources: [1] RHI Shipment Data, March 2016 [2] PPMR Data, March 2016; [3] USAID, “Couple-Years of Protection (CYP),” March 2016
Note: The sum of individual stacked bars for all exhibits may differ slightly from totals due to rounding
2011 2012 2013 2014 2015
Condoms - Male
Injectables
Implants IUDs
Orals - EmergencyOrals - Combined andProgestin Only
Condoms - Female
0M
10M
20M
30M
40M
50M
60M
70M
80M
3M 7M
17M
6M0.3M
20M
0.1M12M
11M
20M
6M0.1M
21M
0.2M10M
12M
10M
7M0.4M
21M
0.2M9M
18M
8M6M0.4M16M0.2M12M
15M
6M0.2M
17M
0.1M11M
52M
63M68M
59M 60M
Prod
uct-
base
d m
oder
n m
etho
ds u
sers
in F
P202
0 co
untr
ies
(Mill
ions
)
7% 7%
19%
11%0.1%
43%
0.2%
20%
7%
29%
0%
33%
0.1%
20%
11%
16%
26%
7%0%
33%
0.2%
19%
24%
11%
12%0.3%
26%
25%
0.3%
5%
40%
8%0.1%
34%
0.2%12%
18%
40%
7%0.1%
26%
0.1%9%
26% 27%
6%12%1.3%
43%
0.3%11%
28%
7%0.2%
28%
0.3%10%
35%
13%7%0.9%
29%
0.2%15%
21%
13%0%
37%
0.3%
23%
30M 26M 27M
USAID UNFPA
30M 28M 16M 27M 35M 26M 31M
2011 2012 2013 2014 2015 2011 2012 2013 2014 2015
Condoms - Male
Injectables
Implants IUDs
Orals - EmergencyOrals - Combined andProgestin Only
Condoms - Female
0%
20%
40%
60%
80%
100%
Met
hod
Mix
EXHIBIT 11: USERS IMPLIED BY DONOR PROCUREMENT
EXHIBIT 12: USER METHOD MIX IMPLIED BY USAID & UNFPA PROCUREMENT
18. Previous report stated donor-funded procurement of implants supported 10.8 million users in 2013; this has been rounded to 11 million.
DONO
R FU
NDIN
G AN
ALYS
IS

10
MEASURES USED IN THIS REPORT AND THOSE USED BY FP2020 INDICATE CONTINUED GROWTH IN THE NUMBER OF MODERN METHOD USERS AND ARE AN IMPORTANT PART OF HELPING FAMILY PLANNING STAKEHOLDERS ASSESS PROGRESS TOWARD FP2020 GOALS.
This section of the report compares users implied by the supplier shipment data to users reported by FP2020 in the 69 FP2020 coun-tries; additional research was also conducted for select large markets where bigger gaps are observed between the two datasets.
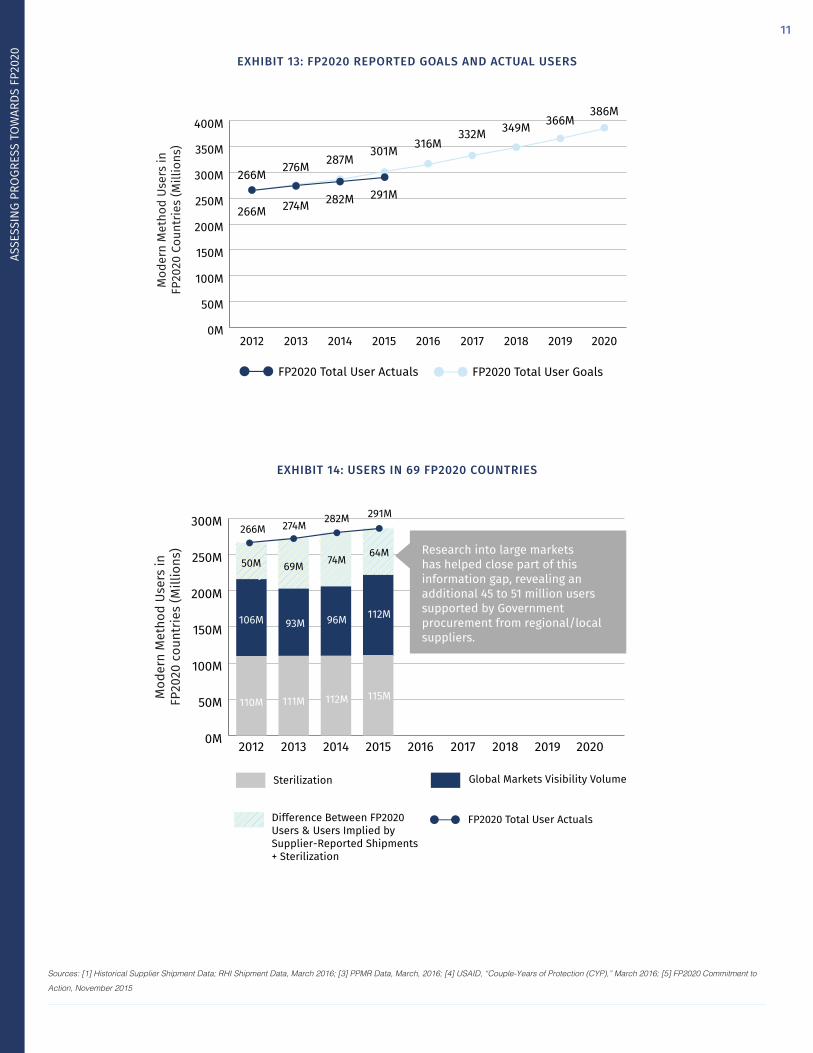
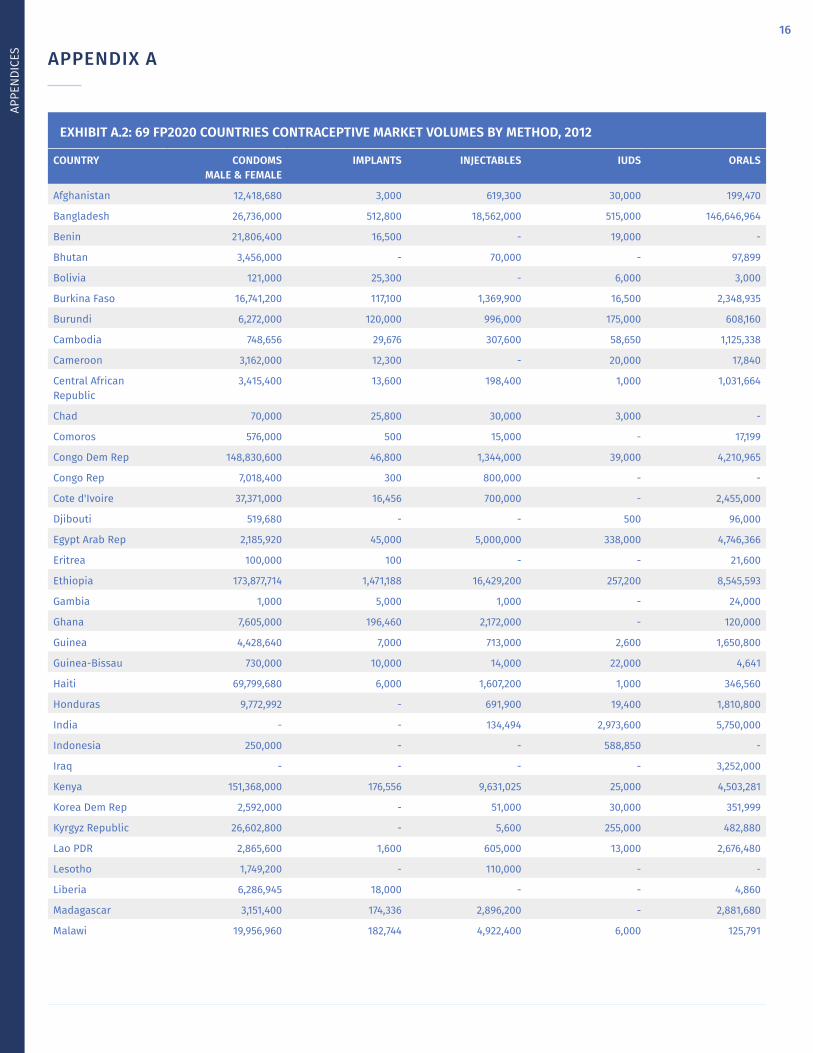
There are important differences between the data coverage and the methodology used as the basis of the 2015 CHAI Fam-ily Planning Market Report and this second iteration, which relies on estimates derived from supplier-reported public sector shipment data, and the methodology used by FP2020 to estimate total FP2020 additional users on modern methods that are estimated using statistical models based on house-hold survey data, which includes both public and private sec-tor data and non-product based methods. Additional research into large markets has helped close part of the information gap identified in the 2015 CHAI Family Planning Market Report.Based on the supplier-reported shipment data, the number of implied users in the public sector contraceptive market increased by 19 million, from 93 million in 2013 to 112 million in 2015 (Exhibit 3). In compari-son, FP2020 reported that the number of total women using a modern method increased by 17 million during that period, from 274 million in 2013 to 291 million in 2015 (Exhibit 13).19 The trends are therefore similar in that they both underscore an increase in users between 2013 and 2015. However, based on the modern contraceptive prevalence rates and method mix data reported by FP2020, approximately 115 million of users were relying on sterilization20 in 2015, while the remaining majority of 176 million modern method users in 2015 were relying on product-based methods.21 Yet, the supplier-reported shipment data continued to account for just over half of total FP2020 estimated prod-uct-based users in 2014 and 2015.
Consequently, there is an average gap of 64 million users per year between total FP2020-reported users on product-based modern meth-ods and users implied by the shipment data, between 2012 and 2015 (Exhibit 14).
To understand the drivers of the gap, it is important to first acknowl-edge the scope of this report. The CHAI Family Planning Market Report, first published in May 2015, provided the global community with its first detailed glimpse into the public sector family planning market across the 69 FP2020 countries. Now in its second iteration, the report continues to focus on the public sector procurement in the 69 FP2020
countries; it does not capture commercial sector sales. The scope of the report is defined by the data provided by suppliers participating in the Global Markets Visibility Project, which includes significant coverage of the public sector, donor-funded market. Within the RHI database, sup-pliers participating in the Global Markets Visibility Project represented 96 percent or more of total shipment volumes of every method,22 with the exception of IUDs, where participating suppliers held 50 percent of the volumes.
Second, to further investigate the gap, CHAI identified the key countries that accounted for the largest proportion of the gap based on coun-try-specific comparisons between FP2020-reported users on prod-uct-based modern methods and users implied by the shipment data.23
Supplementary research and analysis was thus conducted in three large markets – Bangladesh, India, and Indonesia – the results of which are further detailed on page 12. Purchase orders and procurement reports from these countries’ governments revealed that an additional 45 to 51 million users24 may be attributable to government procurement from regional and local suppliers, which have thus far not participated in the Global Markets Visibility Project.25 This finding is consistent with the decreasing shipment volumes to these countries seen by the sup-pliers that are currently participating in the project. Moving forward, CHAI will be engaging with and seeking the participa-tion of these additional suppliers. CHAI will also pursue its investigation to uncover additional suppliers that may be garnering a significant market share in one of the larger 69 FP2020 countries. CHAI is commit-ted to continuously improving market visibility within the family plan-ning space and evolving future iterations of the report in that regard.
19. Family Planning 2020, “FP2020 Commitment To Action, Measurement Annex” November 2015, pp. 4, 6, 85, 99–101. United Nations, “World Population Prospects” 2012. FP2020 updat-ed 2012 estimates of total women on reproductive age on modern methods in the 69 FP2020 focus countries from 258 million to 265 million.20. Sterilization does not have associated product costs but does have procedure costs.21. A small percentage of the remaining modern method users relied on Lactational Amenor-rhea Method (LAM).22. Male condoms are excluded because the source of the shipment data is from RHI whereas all other methods are supplier-reported.
23. In order to be consistent with the dataset used by FP2020, CHAI used UN Population data as of 2012 to determine the FP2020-reported total users on product modern methods by year.24. There are significant limitations associated with this estimate, including difference in time frames referred to, use of fiscal year data versus calendar years, and various diverse data definitions. See Appendix E for further details.25. There is currently limited access to these suppliers’ data in publicly available data sources such as RHI.
ASSE
SSIN
G PR
OGR
ESS
TOW
ARDS
FP2
020
11
Mod
ern
Met
hod
User
s in
FP20
20 C
ount
ries
(Mill
ions
)
2012
266M
266M
276M
274M
287M
282M
301M
291M
316M332M 349M 366M
386M
2013 2014 2015 2016 2017 2018 2019 2020
FP2020 Total User Actuals FP2020 Total User Goals
0M
50M
100M
150M
200M
250M
300M
350M
400M
Sterilization Global Markets Visibility Volume
Difference Between FP2020 Users & Users Implied by Supplier-Reported Shipments + Sterilization
FP2020 Total User Actuals
Mod
ern
Met
hod
User
s in
FP20
20 c
ount
ries
(Mill
ions
)
2012 2013 2014 2015 2016 2017 2018 2019 2020
266M 274M 282M 291M
0M
50M
100M
150M
200M
250M
300M
106M
110M 111M
93M
112M
96M
115M
112M
74M 64M50M 69M
EXHIBIT 13: FP2020 REPORTED GOALS AND ACTUAL USERS
EXHIBIT 14: USERS IN 69 FP2020 COUNTRIES
Research into large markets has helped close part of this information gap, revealing an additional 45 to 51 million users supported by Government procurement from regional/local suppliers.
Sources: [1] Historical Supplier Shipment Data; RHI Shipment Data, March 2016; [3] PPMR Data, March, 2016; [4] USAID, “Couple-Years of Protection (CYP),” March 2016; [5] FP2020 Commitment to
Action, November 2015
ASSE
SSIN
G PR
OGR
ESS
TOW
ARDS
FP2
020

SUMMARY OF FINDINGS RELATED SPECIFICALLY TO BANGLADESH, INDIA, AND INDONESIA
INDONESIA: Data from the public tender documents published by National Family Planning Coordinating Body (BKKBN) shows a total procurement of 84 million units of contraceptive products in 2015, including 30 million oral contraceptives, 53 million injectables, and 700,000 implants. By applying the same conversion factors used for the 2015 shipment volume, we estimate that the implied product-based users is approximately 19 million, as compared to the less than one million implied by the 2015 supplier shipment data.
While the tender documents do not record who the awarded suppli-ers are, additional research identified locally-based manufacturers of contraceptives in Indonesia and the products they supply, including but not limited to: PT Tunggal, PT Kimia Farma, PT Sunthi Sepuri, PT Harsen, PT Pratapa-Nirmala Fahrenheit, PT Triyasa, PT Catur Dakwah Crane, and PT Mitra Rajawali Bandjaran; among them PT Tunggal is the only suppli-er participating in this report as part of the GEMS Caucus. Additional information about these three markets can be found in Appendix E.
BANGLADESH: The Bangladesh Ministry of Health and Family Welfare (MOHFW) pro-cured 150 million male condoms, 79 million orals, 17 million injectables, and 50,000 implants during the 2014/2015 fiscal year, which ends on June 30. These contracts were awarded primarily to regional and local suppliers, including but not limited to: HLL Lifecare Limited, Maneesh Pharma, and MSD/Organon (India) Pvt Ltd. from India, Essential Drugs Co. Ltd, Khulna Essential Latex Plant (KELP), M/S, Reneta Ltd., Popular Pharma, and Techno Drugs from Bangladesh. Helm AG from Germany and Merck/MSD are the only companies on this list of suppliers to participate in this report. Therefore, only Helm AG and Merck/MSD’s reported volumes were included in the calculation of the number of implied users. Also, the government’s procurement volumes are based on the 2014/2015 fiscal year instead of the calendar year used in this report. By applying the same conversion factors used for 2014 and 2015 shipment volumes, we estimate the implied users to be between 11 mil-lion to 13 million for 2014/2015, as compared to the five to ten million users implied by the 2014 and 2015 supplier shipment data.
INDIA: Based on India’s Ministry of Health and Family Welfare (MOHFW) Annual Report for the 2013/2014 fiscal year which ends on March 31, shipment volumes for product-based methods totaled 1.2 billion units while four million sterilizations were performed. The 1.2 billion units in the year 2013/2014 represented an 8 percent increase from the 2010/2011 total of 968 million; the increase was driven by an 8 percent increase in male condoms (reaching 1.1 billion), a 4 percent increase in orals-combined (reaching 93 million), and a 52 percent increase in emergency contra-ceptives (reaching 15 million). These increases were partly offset by a 12 percent decrease in the shipment volume of IUDs (down to six million). While these shipment volumes are based on the 2013/2014 fiscal year instead of calendar year used in this report, by applying the same con-version factors used for 2013 and 2014 shipment volumes, we estimate that the implied product-based users is approximately 32 million to 43 million users in 2013/2014, as compared to the five to six million users implied by the 2014 and 2015 supplier shipment data. IUD users accounted for close to half of all product-based modern method users, followed by male condoms.
While the MOHFW Annual Reports do not record identities of the awarded suppliers, a USAID report has enabled the identification of local suppliers and the contraceptives supplied to the government and SMO programs as of 2006, including but not limited to: Indian Drug and Pharmaceutical Ltd. (IDPL), HLL Lifecare Limited, Phaarmasia, Pregna International, SMB Corporation, Cipla, Win-Medicare, and Famy Care, now known as Mylan.26,27 This list was further validated by in-country partners. Of these suppliers, Pregna International, SMB Corporation, Cipla, and Mylan currently participate in this report.
26. USAID, “Assessment of India’s locally manufactured contraceptive product supply”, 2006, available at: http://pdf.usaid.gov/pdf_docs/Pnadf989.pdf
27. In 2015, Mylan Laboratories Limited, completed the acquisition of certain women's health-care businesses, known as Jai Pharma, which were spun off from Famy Care Limited.
12AS
SESS
ING
PRO
GRES
S TO
WAR
DS F
P202
0

13
About the Global Markets Visibility Project The Global Markets Visibility Project is a landmark initiative that result-ed in the publication of the first CHAI Family Planning Market Report in May 2015, which provided the community with its first detailed glimpse into the public sector family planning market across the 69 FP2020 countries. The initiative provides insightful and strategic outputs for donors, MOHs, implementing organizations and suppliers to develop and implement more effective strategies aimed at ensuring that an additional 120 million women in the world’s 69 poorest countries have access to family planning products and services by 2020. The report is a joint collaboration with the Reproductive Health Sup-plies Coalition (RHSC). The initial report included data from 11 manu-facturers obtained either through direct MOUs or collaborations with the Generic Manufacturers Caucus for Reproductive Health (GEMs) and i+solutions. We have expanded our coverage and are privileged to now include data from two new suppliers. In addition, all suppliers who previously provided data agreed to participate in this year’s report. Donors, suppliers, and partners expressed strong interest to continue this project, build on our progress, and strengthen the family planning community’s market knowledge.
Market Definition, Scope, and Coverage The total FP2020 public sector market referenced in this report includes only data for the public sector in the 69 FP2020 countries – defined as volumes purchased by institutional buyers (USAID, UNFPA, SMOs, etc.) and MOH or government-affiliated procurers.
Although significant efforts have been deployed to collect as much data as possible, it should be noted that this report may not represent the entirety of institutional purchases for the public sector as it includes data from the majority, but not all, of the suppliers to these markets.
GLO
BAL
MAR
KETS
VIS
IBIL
ITY
PRO
JECT
ACK
NO
WLE
DGEM
ENTS

14
APPENDIX A
28. Female condoms are aggregated with male condoms by country in order to protect data confidentiality.29. Other FP2020 shipment volumes include shipments to procurer (USAID, UNFPA, SMOs) warehouses in non-FP2020 countries, such as Belgium, Denmark, France, Germany, Nether-lands, Norway, Sweden, Switzerland, UK, and US. Although these volumes were shipped to
69 FP2020 COUNTRIES MARKET VOLUMES BY METHOD28 AND COUNTRY 2011–2015
EXHIBIT A.1: 69 FP2020 COUNTRIES CONTRACEPTIVE MARKET VOLUMES BY METHOD, 201129
COUNTRY CONDOMS MALE & FEMALE
IMPLANTS INJECTABLES IUDS ORALS
Afghanistan 19,572,826 - 1,395,200 67,000 807,674
Bangladesh 112,426,800 422,109 18,984,000 475,000 138,631,121
Benin 13,249,064 48,600 10,300 21,000 -
Bhutan 2,880,000 - 475,200 1,600 88,002
Bolivia 1,570,360 2,350 - 35,000 210,000
Burkina Faso - 2,000 - - 1,597,501
Burundi 14,673,200 44,600 - 39,000 33,335
Cambodia 1,764,000 19,000 - 20,000 20,000
Cameroon - 11,500 - 31,000 50,200
Central African Re-public
6,410,600 500 200 - 91,403
Chad 1,567,600 15,000 52,000 1,000 -
Comoros 1,008,000 1,024 26,800 100 -
Congo Dem Rep 73,252,800 8,500 350,000 26,000 1,295,595
Congo Rep 20,566,352 10 1,412,400 500 391,905
Cote d'Ivoire 34,967,400 - 630,800 10,000 2,613,145
Djibouti 590,240 - - 1,500 -
Egypt Arab Rep 50,400 17,500 4,780,000 2,135,000 3,000,000
Eritrea 7,804,000 5,100 - 5,500 61,672
Ethiopia 146,223,384 382,704 5,471,200 420,000 7,752,440
Gambia 1,585,000 100 10,000 500 433,337
Ghana 5,514,000 57,674 3,044,000 - -
Guinea 7,932,400 1,000 546,240 11,000 233,335
Guinea-Bissau 1,555,000 5,000 - - 5,001
Haiti 54,534,096 - 976,800 - 200,001
Honduras 19,202,400 - 148,000 22,453 943,300
India - - 193,201 1,959,570 8,661,563
Indonesia 210,000 - - 316,721 50,001
Iraq - - - 75,000 2,633,250
Kenya 48,266,720 505,209 1,370,032 - 15,136,914
Korea Dem Rep 1,267,200 - - 36,150 139,500
Kyrgyz Republic 5,202,600 - - 160,000 -
Lao PDR 8,484,208 6,200 650,000 - 922,112
Lesotho 8,356,936 2,000 65,000 - 63,000
Liberia 22,048,800 3,000 423,200 - -
non-FP2020 countries, the end shipment destination of these volumes would likely be the 69 FP2020. As a result, these non-FP2020 volumes were included in the total shipments to 69 FP2020 countries after it was confirmed that the specific non-FP2020 volumes were associated with institutional purchases.
APPENDIX A
APPE
NDIC
ES

15
Sources: [1] Historical Supplier-Reported Shipment Data; [2] RHI Shipment Data, March 2016.
APPENDIX A
EXHIBIT A.1: 69 FP2020 COUNTRIES CONTRACEPTIVE MARKET VOLUMES BY METHOD, 201129
COUNTRY CONDOMS MALE & FEMALE
IMPLANTS INJECTABLES IUDS ORALS
Madagascar 24,254,800 124,318 1,913,600 4,500 324,550
Malawi 11,886,001 46,452 540,000 - 50,000
Mali 1,000 53,600 1,292,625 41,501 -
Mauritania 3,600,000 3,728 6,000 5,500 533,336
Mongolia 10,002,880 1,000 - - 321,000
Mozambique 96,394,000 5,010 1,241,400 41,000 5,393,262
Myanmar 56,563,712 4,000 - - 6,918,499
Nepal 33,641,000 - 327,600 10,000 250,000
Nicaragua 13,356,000 - 332,100 50,000 842,001
Niger 10,000 4,612 814,000 2,800 400,000
Nigeria 78,948,652 32,900 3,157,500 209,000 1,055,335
Pakistan 249,431,800 25,300 5,862,000 200,000 400,299
Papua New Guinea 2,500,000 2,000 - - 1,663,200
Philippines 740,800 - - - 6,639,745
Rwanda 30,211,488 - 1,768,400 18,600 -
Sao Tome and Prin-cipe
2,190,600 - 852,075 200 47,129
Senegal 11,400,000 10,350 - 3,000 220,000
Sierra Leone 4,515,800 91,700 - 35,500 1,206,269
Solomon Islands 30,000 - - - 24,000
Somalia - - - - -
South Sudan 4,161,000 - - - -
Sri Lanka 779,600 10,000 - 80,000 2,191,240
Sudan 10,591,344 3,500 - 2,000 1,167,875
Tajikistan 10,105,072 5,440 - 150,000 -
Tanzania 29,772,456 240,104 6,176,400 25,000 1,410,170
Timor-Leste 57,600 1,100 - 3,500 145,002
Togo 14,392,368 16,500 - 6,400 12,663
Uganda 82,319,600 86,688 2,089,800 83,785 334,220
Uzbekistan 5,414,112 - - 1,500,000 600,000
Vietnam 15,049,000 9,000 1,180,000 1,772,000 -
West Bank and Gaza 4,521,600 - - - -
Western Sahara - - - - -
Yemen Rep 829,440 6,625 2,001,875 30,000 3,971,120
Zambia 58,807,168 - 1,544,200 - 748,000
Zimbabwe 126,944,000 61,900 782,500 2,600 14,836,223
Other FP2020 Ship-ment Volumes
6,937,864 692,800 385,700 145,850 76,285,355
APPE
NDIC
ES
16
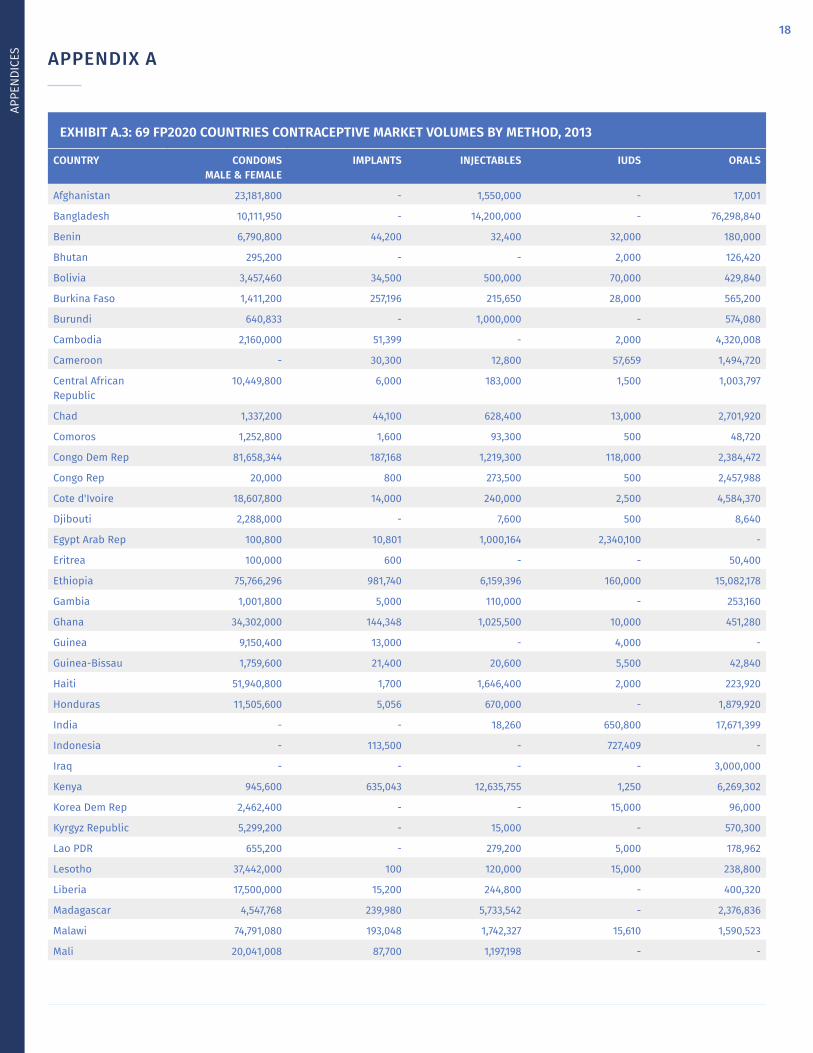
EXHIBIT A.2: 69 FP2020 COUNTRIES CONTRACEPTIVE MARKET VOLUMES BY METHOD, 2012
COUNTRY CONDOMS MALE & FEMALE
IMPLANTS INJECTABLES IUDS ORALS
Afghanistan 12,418,680 3,000 619,300 30,000 199,470
Bangladesh 26,736,000 512,800 18,562,000 515,000 146,646,964
Benin 21,806,400 16,500 - 19,000 -
Bhutan 3,456,000 - 70,000 - 97,899
Bolivia 121,000 25,300 - 6,000 3,000
Burkina Faso 16,741,200 117,100 1,369,900 16,500 2,348,935
Burundi 6,272,000 120,000 996,000 175,000 608,160
Cambodia 748,656 29,676 307,600 58,650 1,125,338
Cameroon 3,162,000 12,300 - 20,000 17,840
Central African Republic
3,415,400 13,600 198,400 1,000 1,031,664
Chad 70,000 25,800 30,000 3,000 -
Comoros 576,000 500 15,000 - 17,199
Congo Dem Rep 148,830,600 46,800 1,344,000 39,000 4,210,965
Congo Rep 7,018,400 300 800,000 - -
Cote d'Ivoire 37,371,000 16,456 700,000 - 2,455,000
Djibouti 519,680 - - 500 96,000
Egypt Arab Rep 2,185,920 45,000 5,000,000 338,000 4,746,366
Eritrea 100,000 100 - - 21,600
Ethiopia 173,877,714 1,471,188 16,429,200 257,200 8,545,593
Gambia 1,000 5,000 1,000 - 24,000
Ghana 7,605,000 196,460 2,172,000 - 120,000
Guinea 4,428,640 7,000 713,000 2,600 1,650,800
Guinea-Bissau 730,000 10,000 14,000 22,000 4,641
Haiti 69,799,680 6,000 1,607,200 1,000 346,560
Honduras 9,772,992 - 691,900 19,400 1,810,800
India - - 134,494 2,973,600 5,750,000
Indonesia 250,000 - - 588,850 -
Iraq - - - - 3,252,000
Kenya 151,368,000 176,556 9,631,025 25,000 4,503,281
Korea Dem Rep 2,592,000 - 51,000 30,000 351,999
Kyrgyz Republic 26,602,800 - 5,600 255,000 482,880
Lao PDR 2,865,600 1,600 605,000 13,000 2,676,480
Lesotho 1,749,200 - 110,000 - -
Liberia 6,286,945 18,000 - - 4,860
Madagascar 3,151,400 174,336 2,896,200 - 2,881,680
Malawi 19,956,960 182,744 4,922,400 6,000 125,791
APPENDIX A
APPE
NDIC
ES

17
Sources: [1] Historical Supplier-Reported Shipment Data; [2] RHI Shipment Data, March 2016.
APPENDIX A
EXHIBIT A.2: 69 FP2020 COUNTRIES CONTRACEPTIVE MARKET VOLUMES BY METHOD, 2012
COUNTRY CONDOMS MALE & FEMALE
IMPLANTS INJECTABLES IUDS ORALS
Mali 6,433,920 55,000 168,800 18,000 2,314,375
Mauritania 20,000 - 13,400 - -
Mongolia 6,073,000 5,120 120,000 - 652,797
Mozambique 98,478,960 30,000 2,490,000 - 6,419,170
Myanmar 9,785,112 - 1,501,600 18,000 6,864,858
Nepal 66,400,720 88,000 237,600 104,600 -
Nicaragua 4,229,280 - 450,400 11,896 822,055
Niger 24,400 3,108 200,600 10,000 740,850
Nigeria 199,399,440 328,212 14,321,300 872,634 3,025,137
Pakistan 252,501,000 70,768 857,600 90,700 226,701
Papua New Guinea 600,000 26,500 800,000 600 6,335
Philippines 2,001,600 1,536 200,000 447,514 14,565,234
Rwanda 15,724,568 20,060 776,400 - 105,000
Sao Tome and Prin-cipe
1,682,600 6,100 15,000 5,000 125,400
Senegal 14,407,000 77,056 1,478,400 14,000 1,002
Sierra Leone 1,122,000 - 250,000 15,990 739,073
Solomon Islands - - - - -
Somalia - 2,000 - - 20,000
South Sudan 2,400,000 5,004 - - -
Sri Lanka - 74,800 250,000 1,800 2,167,010
Sudan 3,335,968 25,040 - 9,000 3,968,200
Tajikistan 1,800,600 - 41,500 140,000 432,480
Tanzania 52,549,408 351,500 4,155,900 47,000 2,105,540
Timor-Leste 2,592,000 5,450 - 2,000 128,571
Togo 43,054,408 26,000 322,400 - 27,000
Uganda 89,421,536 396,829 6,249,200 76,896 114,400
Uzbekistan 3,635,000 - 445,000 800,000 1,121,280
Vietnam 52,546,800 23,976 900,000 800,000 138,999
West Bank and Gaza - - - - -
Western Sahara - - - - -
Yemen Rep 3,801,888 24,000 180,000 95,000 3,443,504
Zambia 39,274,440 38,300 2,010,800 - 1,655,200
Zimbabwe 99,270,000 113,600 634,200 6,050 14,254,948
Other FP2020 Shipment Volumes
15,667,176 721,200 12,500 84,400 68,013,625
APPE
NDIC
ES
18
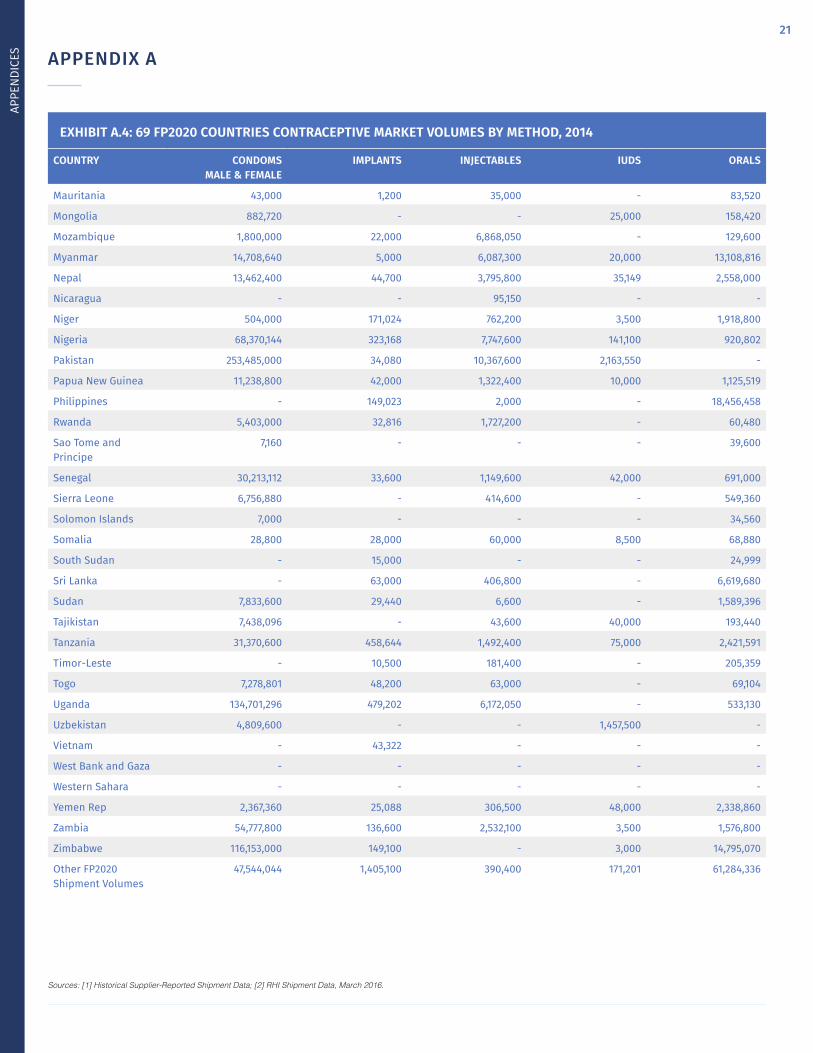
EXHIBIT A.3: 69 FP2020 COUNTRIES CONTRACEPTIVE MARKET VOLUMES BY METHOD, 2013
COUNTRY CONDOMS MALE & FEMALE
IMPLANTS INJECTABLES IUDS ORALS
Afghanistan 23,181,800 - 1,550,000 - 17,001
Bangladesh 10,111,950 - 14,200,000 - 76,298,840
Benin 6,790,800 44,200 32,400 32,000 180,000
Bhutan 295,200 - - 2,000 126,420
Bolivia 3,457,460 34,500 500,000 70,000 429,840
Burkina Faso 1,411,200 257,196 215,650 28,000 565,200
Burundi 640,833 - 1,000,000 - 574,080
Cambodia 2,160,000 51,399 - 2,000 4,320,008
Cameroon - 30,300 12,800 57,659 1,494,720
Central African Republic
10,449,800 6,000 183,000 1,500 1,003,797
Chad 1,337,200 44,100 628,400 13,000 2,701,920
Comoros 1,252,800 1,600 93,300 500 48,720
Congo Dem Rep 81,658,344 187,168 1,219,300 118,000 2,384,472
Congo Rep 20,000 800 273,500 500 2,457,988
Cote d'Ivoire 18,607,800 14,000 240,000 2,500 4,584,370
Djibouti 2,288,000 - 7,600 500 8,640
Egypt Arab Rep 100,800 10,801 1,000,164 2,340,100 -
Eritrea 100,000 600 - - 50,400
Ethiopia 75,766,296 981,740 6,159,396 160,000 15,082,178
Gambia 1,001,800 5,000 110,000 - 253,160
Ghana 34,302,000 144,348 1,025,500 10,000 451,280
Guinea 9,150,400 13,000 - 4,000 -
Guinea-Bissau 1,759,600 21,400 20,600 5,500 42,840
Haiti 51,940,800 1,700 1,646,400 2,000 223,920
Honduras 11,505,600 5,056 670,000 - 1,879,920
India - - 18,260 650,800 17,671,399
Indonesia - 113,500 - 727,409 -
Iraq - - - - 3,000,000
Kenya 945,600 635,043 12,635,755 1,250 6,269,302
Korea Dem Rep 2,462,400 - - 15,000 96,000
Kyrgyz Republic 5,299,200 - 15,000 - 570,300
Lao PDR 655,200 - 279,200 5,000 178,962
Lesotho 37,442,000 100 120,000 15,000 238,800
Liberia 17,500,000 15,200 244,800 - 400,320
Madagascar 4,547,768 239,980 5,733,542 - 2,376,836
Malawi 74,791,080 193,048 1,742,327 15,610 1,590,523
Mali 20,041,008 87,700 1,197,198 - -
APPENDIX A
APPE
NDIC
ES

19
Sources: [1] Historical Supplier-Reported Shipment Data; [2] RHI Shipment Data, March 2016.
APPENDIX A
EXHIBIT A.3: 69 FP2020 COUNTRIES CONTRACEPTIVE MARKET VOLUMES BY METHOD, 2013
COUNTRY CONDOMS MALE & FEMALE
IMPLANTS INJECTABLES IUDS ORALS
Mauritania 12,548,900 5,120 156,700 - 726,480
Mongolia 4,633,152 17,744 80,000 35,000 435,482
Mozambique 30,528,579 127,000 3,072,000 16,000 8,425,200
Myanmar 5,459,032 - 821,000 23,000 10,240,559
Nepal 6,370,788 10,000 655,200 30,000 -
Nicaragua 4,003,200 300 339,000 7,500 1,094,813
Niger 3,394,000 90,016 503,400 - 3,183,760
Nigeria 88,696,740 344,663 2,142,300 - 2,303,072
Pakistan 315,871,100 45,492 9,151,200 200,400 -
Papua New Guinea 19,924,800 38,790 - 4,000 1,313,583
Philippines - 85,056 1,485,000 - 9,331,385
Rwanda 14,132,000 27,000 928,000 - 1,477,200
Sao Tome and Principe
5,000 500 - - 6,000
Senegal 10,385,200 - 1,159,000 26,000 -
Sierra Leone 11,122,800 36,600 733,000 18,000 1,652,870
Solomon Islands - - - 500 -
Somalia - 1,000 - - 148,700
South Sudan 4,101,000 10,940 - 500 775,200
Sri Lanka - 93,000 233,500 110,000 2,068,050
Sudan 6,889,600 30,572 - - 2,456,292
Tajikistan 7,096,200 - - 105,000 -
Tanzania 29,769,000 309,621 - 55,000 2,009,270
Timor-Leste 57,600 2,100 - - 225,863
Togo 11,465,520 68,000 606,500 - 108,960
Uganda 185,409,800 471,635 12,243,775 143,000 142,000
Uzbekistan 9,553,400 - 300,000 800,000 1,367,760
Vietnam 31,968,000 56,136 870,000 1,700,000 71,665
West Bank and Gaza 3,998,304 - - - -
Western Sahara - - - - -
Yemen Rep 6,082,704 56,192 1,126,284 471,459 17,423,472
Zambia 86,409,000 75,000 1,656,900 - 2,669,480
Zimbabwe 111,075,000 244,180 2,460,400 3,500 24,101,441
Other FP2020 Shipment Volumes
54,175,200 678,000 251,400 84,430 46,980,070
APPE
NDIC
ES

20
EXHIBIT A.4: 69 FP2020 COUNTRIES CONTRACEPTIVE MARKET VOLUMES BY METHOD, 2014
COUNTRY CONDOMS MALE & FEMALE
IMPLANTS INJECTABLES IUDS ORALS
Afghanistan 17,329,040 3,000 109,600 5,500 424,560
Bangladesh - - 13,000,000 400,000 88,795,560
Benin 3,993,400 61,300 462,400 50,500 1,011,681
Bhutan 1,440,000 - - - 156,150
Bolivia 877,250 27,500 - - -
Burkina Faso 12,588,200 298,500 1,476,400 12,900 2,346,480
Burundi - 207,900 1,500,200 6,860 470,200
Cambodia 2,995,200 30,588 520,000 55,000 4,417,848
Cameroon 10,545,460 69,400 - 2,000 639,339
Central African Republic
200,000 3,500 142,300 - 155,024
Chad 3,738,240 41,100 644,800 - -
Comoros - 500 - - 59,997
Congo Dem Rep 140,366,800 50,212 267,600 14,000 964,695
Congo Rep 9,243,540 2,108 21,400 105,000 468,597
Cote d'Ivoire 21,745,600 75,700 1,698,200 15,500 4,770,310
Djibouti - - 3,800 - 15,000
Egypt Arab Rep 468,000 140,032 365,000 591,111 -
Eritrea - 500 20,000 - 108,000
Ethiopia 44,350,736 495,112 12,226,888 430,500 5,894,456
Gambia 1,440,000 9,048 160,000 - 67,860
Ghana 45,105,600 120,696 6,003,800 20,250 2,630,160
Guinea 8,955,000 20,800 45,800 - 194,400
Guinea-Bissau 2,426,400 31,000 25,000 - 8,280
Haiti 57,184,080 - 1,199,200 4,000 -
Honduras 18,254,736 40,000 119,400 21,500 2,860,830
India - - 10,094 2,039,273 13,244,150
Indonesia 12,000 - - 768,575 -
Iraq 5,078,880 - - 5,039 1,513,029
Kenya 14,426,000 481,336 2,681,620 - 3,617,640
Korea Dem Rep - - - - 96,000
Kyrgyz Republic - - 40,000 - -
Lao PDR 2,793,456 3,024 382,000 - 1,141,200
Lesotho 44,934,736 600 1,000 - 26,640
Liberia 9,574,000 - 457,000 - 352,080
Madagascar 27,001,200 77,440 8,058,500 - 1,057,362
Malawi 55,827,800 104,324 6,531,650 - 630,006
Mali 32,271,400 100,600 1,190,600 21,000 2,673,306
APPENDIX A
APPE
NDIC
ES
21
EXHIBIT A.4: 69 FP2020 COUNTRIES CONTRACEPTIVE MARKET VOLUMES BY METHOD, 2014
COUNTRY CONDOMS MALE & FEMALE
IMPLANTS INJECTABLES IUDS ORALS
Mauritania 43,000 1,200 35,000 - 83,520
Mongolia 882,720 - - 25,000 158,420
Mozambique 1,800,000 22,000 6,868,050 - 129,600
Myanmar 14,708,640 5,000 6,087,300 20,000 13,108,816
Nepal 13,462,400 44,700 3,795,800 35,149 2,558,000
Nicaragua - - 95,150 - -
Niger 504,000 171,024 762,200 3,500 1,918,800
Nigeria 68,370,144 323,168 7,747,600 141,100 920,802
Pakistan 253,485,000 34,080 10,367,600 2,163,550 -
Papua New Guinea 11,238,800 42,000 1,322,400 10,000 1,125,519
Philippines - 149,023 2,000 - 18,456,458
Rwanda 5,403,000 32,816 1,727,200 - 60,480
Sao Tome and Principe
7,160 - - - 39,600
Senegal 30,213,112 33,600 1,149,600 42,000 691,000
Sierra Leone 6,756,880 - 414,600 - 549,360
Solomon Islands 7,000 - - - 34,560
Somalia 28,800 28,000 60,000 8,500 68,880
South Sudan - 15,000 - - 24,999
Sri Lanka - 63,000 406,800 - 6,619,680
Sudan 7,833,600 29,440 6,600 - 1,589,396
Tajikistan 7,438,096 - 43,600 40,000 193,440
Tanzania 31,370,600 458,644 1,492,400 75,000 2,421,591
Timor-Leste - 10,500 181,400 - 205,359
Togo 7,278,801 48,200 63,000 - 69,104
Uganda 134,701,296 479,202 6,172,050 - 533,130
Uzbekistan 4,809,600 - - 1,457,500 -
Vietnam - 43,322 - - -
West Bank and Gaza - - - - -
Western Sahara - - - - -
Yemen Rep 2,367,360 25,088 306,500 48,000 2,338,860
Zambia 54,777,800 136,600 2,532,100 3,500 1,576,800
Zimbabwe 116,153,000 149,100 - 3,000 14,795,070
Other FP2020 Shipment Volumes
47,544,044 1,405,100 390,400 171,201 61,284,336
APPENDIX A
Sources: [1] Historical Supplier-Reported Shipment Data; [2] RHI Shipment Data, March 2016.
APPE
NDIC
ES

22
EXHIBIT A.5: 69 FP2020 COUNTRIES CONTRACEPTIVE MARKET VOLUMES BY METHOD, 2015
COUNTRY CONDOMS MALE & FEMALE
IMPLANTS INJECTABLES IUDS ORALS
Afghanistan 1,704,000 4,500 - 30,000 300,000
Bangladesh - 50,000 15,100,000 - -
Benin 12,169,800 222,536 125,500 66,500 525,600
Bhutan 1,936,800 - 111,000 - 129,999
Bolivia - 3,500 - - -
Burkina Faso 19,747,510 244,044 564,000 35,500 3,559,057
Burundi 5,760,000 134,500 1,639,267 - 594,600
Cambodia 5,730,480 11,000 200,000 30,000 9,551,557
Cameroon 26,245,443 125,052 10,000 46,550 48,465
Central African Republic
- 500 37,900 - 23,841
Chad 100,000 7,600 - - -
Comoros 1,303,200 1,008 78,400 - 35,001
Congo Dem Rep 97,286,368 308,230 1,189,200 - 3,124,218
Congo Rep 7,104,840 11,000 622,360 - -
Cote d'Ivoire 100,000 15,664 212,000 - 5,224,561
Djibouti - 500 296,667 - 93,327
Egypt Arab Rep - - - 258,200 -
Eritrea - - 120,000 - 108,000
Ethiopia 31,052,091 1,180,607 2,000,000 650,000 8,478,983
Gambia 2,900 30,048 265,000 - 156,240
Ghana 13,995,000 403,236 1,992,000 - 1,993,464
Guinea 10,080,000 32,500 907,448 - 484,880
Guinea-Bissau 3,384,720 59,400 27,500 - 78,000
Haiti 60,014,400 9,300 421,400 - 228,571
Honduras 10,000,800 93,656 1,725,800 62,000 3,505,905
India - - 795,252 1,273,927 325,000
Indonesia 20,000 25,086 - 171,000 -
Iraq - - - - -
Kenya 67,552,000 905,900 2,231,000 70,000 3,142,535
Korea Dem Rep - - - - -
Kyrgyz Republic 1,527,264 - 80,000 - -
Lao PDR 10,875,960 20,000 333,000 - 1,530,720
Lesotho 21,016,000 1,500 81,800 - 124,369
Liberia 9,009,780 44,600 846,800 - 459,270
Madagascar 1,500,000 72,722 9,349,250 35,996 595,605
Malawi 65,826,192 278,786 6,099,200 - 552,795
Mali 39,764,195 195,805 432,840 18,393 948,953
APPENDIX A
APPE
NDIC
ES

23
EXHIBIT A.5: 69 FP2020 COUNTRIES CONTRACEPTIVE MARKET VOLUMES BY METHOD, 2015
COUNTRY CONDOMS MALE & FEMALE
IMPLANTS INJECTABLES IUDS ORALS
Mauritania - 86,264 41,200 - 140,640
Mongolia 3,160,800 - 90,000 - 242,382
Mozambique 41,712,000 95,000 3,025,500 - -
Myanmar 42,251,912 108,156 7,231,700 900 1,134,860
Nepal 6,864,000 127,500 1,067,000 - 2,304,779
Nicaragua - 2,000 65,050 3,000 188,640
Niger - 12,700 820,800 10,425 2,495,670
Nigeria 97,478,368 379,591 8,132,250 75,000 2,725,901
Pakistan 289,413,000 210,484 - 3,024,116 -
Papua New Guinea 3,480 100,800 1,327,200 - 16,399
Philippines - 731,244 - 82,336 4,135,001
Rwanda 18,627,000 28,752 727,667 5,768 334,166
Sao Tome and Principe
- - 9,400 - 66,329
Senegal 18,858,530 65,384 760,000 - 1,471,680
Sierra Leone 7,926,120 68,500 726,800 - 1,214,340
Solomon Islands - - 15,000 - -
Somalia 151,200 52,016 158,900 - 262,080
South Sudan 9,036,000 53,100 89,350 - 147,902
Sri Lanka - 56,000 574,000 130,000 1,589,760
Sudan 3,000 30,568 474,200 - 3,851,868
Tajikistan 24,812,640 3,500 90,000 - 270,000
Tanzania 846,800 1,241,695 9,935,400 194,124 150,195
Timor-Leste - 12,000 240,000 2,000 79,902
Togo 4,810,000 59,672 495,400 - 261,468
Uganda 35,316,096 258,060 8,235,050 48,300 258,123
Uzbekistan - - 701,600 2,408,900 1,989,949
Vietnam - - - 1,005,000 -
West Bank and Gaza - - - - -
Western Sahara - - - - -
Yemen Rep 5,256,000 25,536 14,300 75,000 8,386,917
Zambia 66,167,400 245,900 3,399,400 13,000 3,770,375
Zimbabwe 132,879,280 98,500 889,100 1,900 9,400,083
Other FP2020 Shipment Volumes
85,564,584 1,564,900 352,600 113,550 62,288,739
APPENDIX A
Sources: [1] Historical Supplier-Reported Shipment Data; [2] RHI Shipment Data, March 2016.
APPE
NDIC
ES

24
Prior to the development of market analyses, CHAI reviewed various data sources from partner organizations that provide family planning market data at the global level. CHAI assessed these databases based on available metrics, coverage of countries, frequency of updates, and ease of access to identify the most appropriate sources for sustainable analyses, with the ability to be updated as new data became available. The following provides an overview of the data sources CHAI relied upon for market analyses:
Procurement Planning and Monitoring Report (PPMR):30Produced monthly by the USAID | DELIVER Project, this online data-base provides information on consumption and current/desired stock levels of contraceptive products on a country-by-country basis for 33 countries. Data is provided by MOHs or USAID partners (Abt Associates, USAID |DELIVER Project), SMOs (MSI, PSI), and UNFPA.
Reproductive Health Interchange (RHI):31Hosted by UNFPA, RHI collects data on past and upcoming contracep-tive volume shipments for over 140 countries from the central pro-curement offices of major contraceptive donors and procurers. This
APPENDIX B — DATA SOURCES
30. RHSC, “Procurement Planning and Monitoring Report,” available at http://ppmr.rhsupplies.org/content?id=1.
31. AccessRH, “What is RHInterchange?” UNFPA, available at https://www.unfpaprocurement.org/rhi-home.
database is updated at variable times that depend on the frequency of data submissions from the data provider. RHI reflects all of UNFPA’s and USAID’s contraceptive purchases, MSI’s and IPPF’s central procure-ments, and a few other procuring organizations’ purchases. For this report, the full RHI data was downloaded in March 2016.
FP2020 Global Markets Visibility Project: In early 2014, CHAI, in partnership with RHSC and the FP2020 Market Dy-namics Working Group, launched the Global Markets Visibility Project to help various donors, suppliers, and partners improve their understand-ing of the current market size and trends for key contraceptive markets. CHAI signed MOUs with six contraceptive manufacturers and received historical shipment data by product and country for each of the 69 FP2020 focus countries. CHAI has partnered with Concept Foundation to collect and aggregate shipment data from participating members of the RHSC Generic Manufacturers for Reproductive Health Caucus (GEMs). To date, the Global Markets Visibility Project has collected historical ship-ment data that covers institutional sales (USAID, UNFPA, MSI, etc.) and MOH tender volumes from 13 manufacturers across five family planning product categories.
APPE
NDIC
ES

25
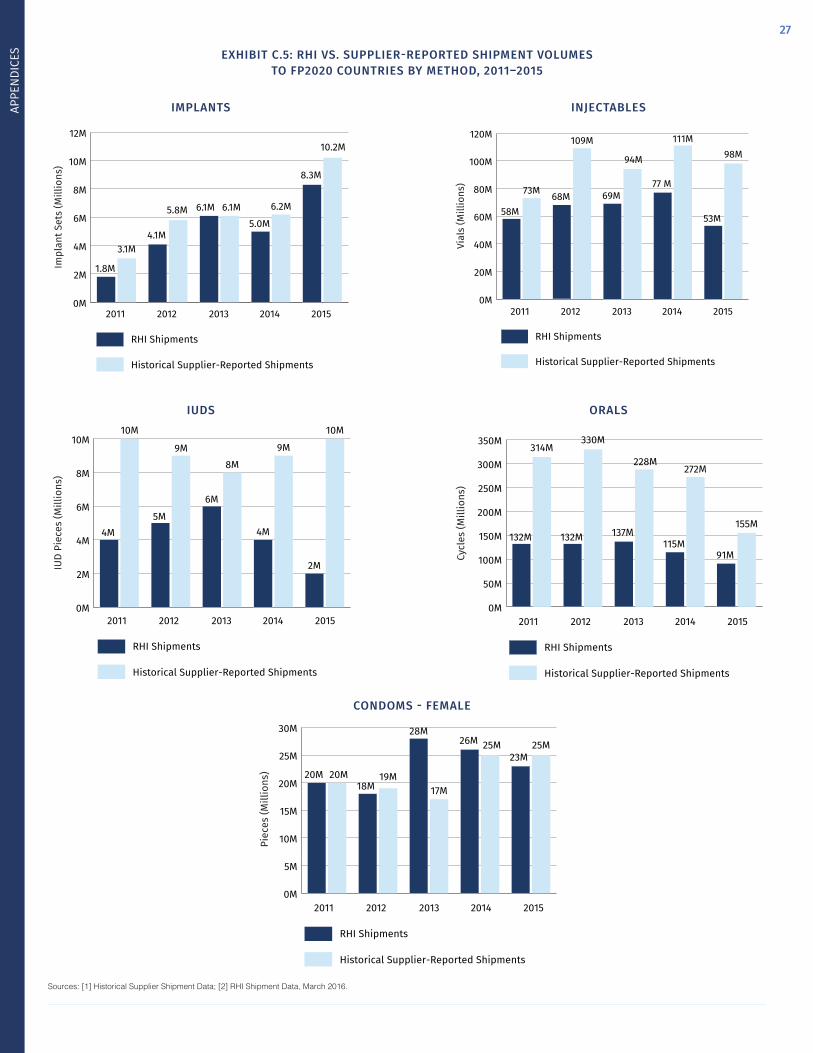
The FP2020 public sector market size was constructed using the best available data sources: historical supplier-reported shipment data and RHI shipment data. Within the RHI shipment data, the suppliers partic-ipating in the Global Markets Visibility Project held 96 percent or more of shipment volumes32 in every category with the exception of IUDs, where suppliers held 50 percent of the volumes (Exhibit C.1.). As CHAI continues to engage suppliers, the focus will be on categories where there are less coverage (i.e. male condoms and IUDs).
The historical supplier-reported shipment data captured a more comprehensive view of the FP2020 public sector market for female condoms, implants, injectables, IUDs, and orals relative to RHI and thus, served as the primary data source for these product markets. Because CHAI has not yet received male condom data from any suppliers, RHI
APPENDIX C — ESTIMATING THE TOTAL FP2020 PUBLIC SECTOR MARKET SIZE
32. Shipment volumes were calculated as cumulative from 2011 to 2015.
EXHIBIT C.1: GLOBAL MARKETS VISIBILITY PROJECT PARTICIPATING SUPPLIER VOLUMES WITHIN RHI BY METHOD
METHOD 69 FP2020 COUNTRIES VOLUMES 2011 – 2015
PARTICIPATING SUPPLIER RHI VOLUMES 2011 – 2015
% OF TOTAL METHOD VOLUMES
Condoms - Female 114,261,654 114,027,654 100%
Implants 25,228,266 24,952,738 99%
Injectables 324,478,252 312,707,450 96%
IUDs 22,080,215 11,150,275 50%
Orals 606,772,825 590,118,863 97%
Total 1,092,821,212 1,052,956,980 96%
EXHIBIT C.2: UNIT OF MEASUREMENT
METHOD UNIT OF MEASURE
Condoms - Female Piece
Condoms - Male Piece
Implants Set
Injectables Vial
IUDs Piece
Orals - Combined Cycle
Orals - Progestin Only Cycle
Orals - Emergency Doses
EXHIBIT C.3: GLOBAL MARKETS VISIBILITY PROJECT PARTICIPANTS AND PRODUCTS
MANUFACTURER CONDOMS - FEMALE IMPLANTS INJECTABLES IUDS ORALS
Bayer • • •
Cipla •
CR Zizhu •
Cupid •
Female Health Company •
Helm AG • •
Mylan • • •
Merck/MSD • •
Pfizer •
Pregna •
PT Tunggal • •
Shanghai Dahua •
SMB •
33. Total shipment of oral contraceptives includes combined, progestin-only, and emergency oral contraceptives.
Sources: [1] RHI Shipment Data, March 2015
data was relied upon for the male condom volumes. The data is quanti-fied by the units of measurement outlined in Exhibit C.2.
The following section describes the data source and market size esti-mation in more detail.
Historical Supplier-Reported DataTo date, the Global Markets Visibility Project has collected historical supplier-reported shipment data from 13 manufacturers – Bayer, Cipla, CR Zizhu, Cupid, Female Health Company, Helm AG, Mylan, Merck/MSD, Pfizer, Pregna, PT Tunggal, Shanghai Dahua, and SMB. Collectively, the total volumes cover institutional sales (USAID, UNFPA, MSI, etc.) and MOH tenders across five family planning product categories.33
APPE
NDIC
ES

26
Aggregating across female condoms, implants, injectables, IUDs, and orals in the 69 FP2020 countries and methods, sup-pliers have shipped an average of 406 million units of family planning commodities annually from 2011 to 2015.34
It is important to note that there were several shipments to procurer (USAID, UNFPA, SMOs) warehouses in non-FP2020 countries, such as Belgium, Denmark, France, Germany, Netherlands, Norway, Sweden, Switzerland, UK, and US. Although these volumes were shipped to non-FP2020 countries, the end shipment destination of these volumes would likely be the 69 FP2020 countries. As a result, these non-FP2020 country volumes were included in the total shipments to 69 FP2020 countries after it was confirmed that the specific non-FP2020 country volumes were associated with institutional purchases.
CHAI analyzed and assessed the aggregated historical supplier-re-ported shipment data to confirm the coverage across various FP2020
APPENDIX C — ESTIMATING THE TOTAL FP2020 MARKET SIZE
35. Similar to the historical supplier-reported shipment totals, RHI volumes to Belgium, Denmark, Germany, France, Netherlands, Norway, Sweden, Switzerland, UK, and the US are included in the total. For the UK, shipments to IPPF or MSI warehouses are included in total volumes. For Belgium, Denmark, Germany, France, Netherlands, Norway, Sweden, Switzerland, UK, and the US, shipments funded or procured by USAID and UNFPA are included in total vol-umes. We assume the end shipments destination of these volumes are likely to the 69 FP2020 countries and thus, include the volumes in the total FP2020 market estimate.
34. Negative volumes and volumes with no associated shipment destination have been excluded.
Source: [1] Historical Supplier-Reported Shipment Data.
EXHIBIT C.4: SUPPLIER-REPORTED SHIPMENT VOLUMES TO FP2020 COUNTRIES BY METHOD, 2011–2015
METHOD 2011 2012 2013 2014 2015
Condoms – Female 20.0 M 18.9 M 17.4 M 25.1 M 25.3 M
Implants 3.1 M 5.8 M 6.1 M 6.2 M 10.2 M
Injectables 73.3 M 109.1 M 93.7 M 111.4 M 97.6 M
IUDs 10.3 M 9.1 M 8.1 M 8.8 M 9.9 M
Orals - Combined & Progestin Only 311.0 M 319.5 M 283.4 M 267.5 M 148.6 M
Orals - Emergency 3.0 M 10.9 M 4.9 M 4.9 M 6.5 M
Total 420.7 M 473.1 M 413.6 M 423.9 M 298.1 M
product markets was greater relative to RHI shipment data for the 69 FP2020 countries. The aim of collecting historical volumes of all institutional purchases and MOH tenders directly from suppliers was to address data gaps observed in RHI shipment data which only captures a subset of procurers who choose to submit historical procurement data. Further, although some countries report national procurements, most national procurements are not reported into the RHI database. When compared to RHI, the total historical supplier-reported shipment volumes to 69 FP2020 countries and procurer warehouses is consis-tently greater than RHI volumes across four family planning methods: implants, injectables, IUDs, and orals.35 Thus, for these product markets, the supplier-reported shipment data captures a more comprehensive view of the family planning market in the 69 FP2020 countries. For female condoms, the RHI volumes are actually greater than supplier shipment data in 2013 and 2014, however the difference is relatively small in 2014.
APPE
NDIC
ES
27
58M53M
73M 68M 69M77 M
94M
109M 111M98M
2011 2012 2013 2014 2015
RHI Shipments
Historical Supplier-Reported Shipments
Vial
s (M
illio
ns)
0M
20M
40M
60M
80M
100M
120M
2011
4M5M
9M8M
6M
4M
2M
9M
6 M
10M 10M
2012 2013 2014 2015
RHI Shipments
Historical Supplier-Reported Shipments
IUD
Piec
es (M
illio
ns)
0M
2M
4M
6M
8M
10M
2011 2012 2013 2014 2015
RHI Shipments
Historical Supplier-Reported Shipments
Cycl
es (M
illio
ns)
0M
50M
100M
150M
200M
250M
300M
350M
132M 132M 137M115M
91M
314M330M
228M272M
155M
20M 20M18M 17M
19M
28M26M 25M 25M
23M
2011 2012 2013 2014 2015
RHI Shipments
Historical Supplier-Reported Shipments
Piec
es (M
illio
ns)
0M
5M
10M
15M
20M
25M
30M
2011
1.8M
3.1M4.1M
5.8M5.0M
6.1M 6.1M 6.2M
8.3M
10.2M
2012 2013 2014 2015
RHI Shipments
Historical Supplier-Reported Shipments
0M
2M
4M
6M
8M
10M
12M
Impl
ant S
ets
(Mill
ions
)
Sources: [1] Historical Supplier Shipment Data; [2] RHI Shipment Data, March 2016.
EXHIBIT C.5: RHI VS. SUPPLIER-REPORTED SHIPMENT VOLUMES TO FP2020 COUNTRIES BY METHOD, 2011–2015
IMPLANTS
IUDS
INJECTABLES
ORALS
CONDOMS - FEMALE
APPE
NDIC
ES

28
Male Condom MarketBecause CHAI has not yet received data from male condom suppliers, historical RHI shipment data for male condoms is used to capture a more comprehensive view of the family planning market for the 69 FP2020 countries. We use RHI shipment volume data from 2011 to 2015 and include all male condom shipment volumes to 69 FP2020 countries as well as volumes associated with procurer warehouses in non-FP2020 focus countries.36 The male condom market reflected by the RHI data includes 20 manufacturers and 18 funding sources.
The historical supplier-reported volumes for female condoms, implants, injectables, IUDs, and orals, together with RHI shipment volumes for male condoms, represent the estimated FP2020 public sector market from 2011 to 2015.
APPENDIX C — ESTIMATING THE TOTAL FP2020 MARKET SIZE
36. Total yearly volumes are based on the year that the product was shipped.
Source: [Exhibit C.6] RHI Shipment Data, March 2016. Source: [Exhibit A.7] Historical Supplier-Reported Shipment Data; RHI Shipment Data, March 2016.
EXHIBIT C.6: RHI MALE CONDOM SHIPMENT VOLUMES, 2011–2015
METHOD 2011 2012 2013 2014 2015
Condoms - Male 1.62 B 1.84 B 1.57 B 1.39 B 1.39 B
EXHIBIT C.7: 69 FP2020 CONTRACEPTIVE MARKET VOLUMES BY METHOD, 2011–2015
METHOD 2011 2012 2013 2014 2015
Condoms – Female 20.0 M 18.9 M 17.4 M 25.1 M 25.3 M
Condoms – Male (RHI) 1623.1 M 1842.0 M 1570.7 M 1391.3 M 1390.7 M
Implants 3.1 M 5.8 M 6.1 M 6.2 M 10.2 M
Injectables 73.3 M 109.1 M 93.7 M 111.4 M 97.6 M
IUDs 10.3 M 9.1 M 8.1 M 8.8 M 9.9 M
Orals – Combined & Progestin Only 311.0 M 319.5 M 283.4 M 267.5 M 148.6 M
Orals – Emergency 3.0 M 10.9 M 4.9 M 4.9 M 6.5 M
Total 2043.8 M 2315.1 M 1984.3 M 1815.2 M 1688.8 M
APPE
NDIC
ES

29
Previously CHAI used a single consumption-to-shipment factor for each method, across all three years from 2011 to 2013, based on just 2013 data due to limited availability of consumption data prior to 2013.39 To incorporate recent trends in consumption and smooth out year-to-year fluctuations, CHAI has revised the methodology to calculate the factor based on a rolling three-year average, as far as the data availability al-lows. Therefore, the consumption-to-shipment factor for 2014 and 2015 was calculated by taking a weighted average across two years40 and three years41 of data respectively. In addition, CHAI adopted a robust mechanism to exclude country outliers where there may be a lack of re-porting or data visibility, defined as when PPMR consumption volumes exceeds five times the RHI volume over the three-year period. The im-pact of the revised approach on 2011 to 2013 total users, using the same dataset from the previous report,42 is reflected in the exhibit below.
APPENDIX C — ESTIMATING THE TOTAL FP2020 MARKET SIZE
40. Weighted Average of 2013 and 2014 Shipment over Consumption data.41. Weighted Average of 2013, 2014 and 2015 Shipment over Consumption data.42. The previous report only had supplier-reported shipment volumes from 11 suppliers vs. 13 suppliers in this iteration of the report.
Sources: [Exhibit C.8] [[1] PPMR Data, March 2016; [2] RHI Shipment Data, March 2016; [3] USAID, “Couple-Years of Protection (CYP),” March 2016. [Exhibit C.9] Sources: [1] Historical Supplier Shipment Data.
EXHIBIT C.8: VOLUMES TO USERS CONVERSION FACTORS, 2011–2015
CONSUMPTION TO SHIPMENT COUPLE-YEARS OF PROTECTION (CYP)
METHOD 2011-2013 2014 2015 1/CYP
Condoms - Female 1.34 1.24 1.19 120.00
Condoms - Male 1.22 1.24 0.91 120.00
Implants - 3 Year 1.57 1.27 1.38 0.40
Implants - 4 Year 1.57 1.27 1.38 0.31
Implants - 5 Year 1.57 1.27 1.38 0.26
Injectables - 1 month 0.79 0.86 0.75 0.08
Injectables - 2 month 0.79 0.86 0.75 0.17
Injectables - 3 month 0.79 0.86 0.75 0.25
IUDs 1.30 1.82 1.33 0.22
Orals – Combined 1.39 1.15 1.10 15.00
Orals – Progestin Only 1.47 0.83 0.73 15.00
Orals – Emergency 0.83 0.20 0.23 20.00
Total FP2020 Public Sector Market In Terms of UsersCHAI translated shipment volumes to users by estimating the vol-umes consumed and converting to users based on a couple-years of protection (CYP) factor. First, CHAI converted all shipment volumes to consumption using a method-specific consumption-to-shipment conversion based on a ratio of consumption (via PPMR) to shipment volumes (via RHI).37 Next, CHAI estimated users by dividing consumption by the corresponding CYP factor published by USAID. CYP is the estimat-ed protection provided by contraceptive methods during a one-year period based upon the volume of all methods sold or distributed for free to clients during that period of time.38 Because various methods may have different CYPs associated with different sub-types of that method (e.g. there are different CYP factors for three-, four-, and five-year implants), the corresponding CYP of the method sub-type is used. The following exhibit shows the conversion factors used to translate volumes to users.
37. The consumption-to-shipment conversion is based on the understanding that what is shipped is not always consumed. For further details see Appendix C.38. USAID, “Couple-Years of Protection (CYP)”, April 2014, available at http://www.usaid.gov/what-we-do/global-health/family-planning/couple-years-protection-cyp39. PPMR Data has been collected since 2008 and has grown to include more countries over time; in 2011, 19 countries reported into PPMR, this number has grown to 33 countries to-date.
EXHIBIT C.9: IMPACT OF CONSUMPTION TO SHIP FACTOR CHANGE
YEAR OLD METHODOLOGY - USERS NEW METHODOLOGY - USERS
2011 84,520,196 91,999,536
2012 100,716,160 106,074,189
2013 89,667,175 93,473,726
APPE
NDIC
ES
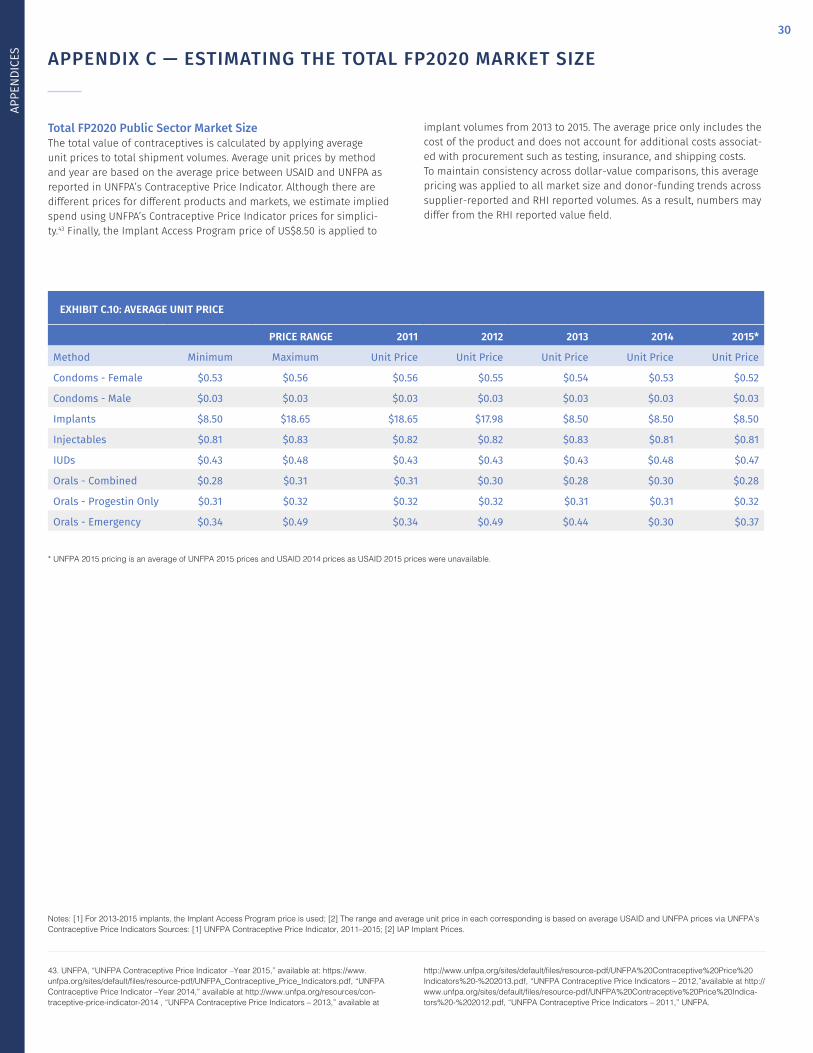
30
APPENDIX C — ESTIMATING THE TOTAL FP2020 MARKET SIZE
Total FP2020 Public Sector Market SizeThe total value of contraceptives is calculated by applying average unit prices to total shipment volumes. Average unit prices by method and year are based on the average price between USAID and UNFPA as reported in UNFPA’s Contraceptive Price Indicator. Although there are different prices for different products and markets, we estimate implied spend using UNFPA’s Contraceptive Price Indicator prices for simplici-ty.43 Finally, the Implant Access Program price of US$8.50 is applied to
Notes: [1] For 2013-2015 implants, the Implant Access Program price is used; [2] The range and average unit price in each corresponding is based on average USAID and UNFPA prices via UNFPA's Contraceptive Price Indicators Sources: [1] UNFPA Contraceptive Price Indicator, 2011–2015; [2] IAP Implant Prices.
* UNFPA 2015 pricing is an average of UNFPA 2015 prices and USAID 2014 prices as USAID 2015 prices were unavailable.
43. UNFPA, “UNFPA Contraceptive Price Indicator –Year 2015,” available at: https://www.unfpa.org/sites/default/files/resource-pdf/UNFPA_Contraceptive_Price_Indicators.pdf, “UNFPA Contraceptive Price Indicator –Year 2014,” available at http://www.unfpa.org/resources/con-traceptive-price-indicator-2014 , “UNFPA Contraceptive Price Indicators – 2013,” available at
implant volumes from 2013 to 2015. The average price only includes the cost of the product and does not account for additional costs associat-ed with procurement such as testing, insurance, and shipping costs. To maintain consistency across dollar-value comparisons, this average pricing was applied to all market size and donor-funding trends across supplier-reported and RHI reported volumes. As a result, numbers may differ from the RHI reported value field.
EXHIBIT C.10: AVERAGE UNIT PRICE
PRICE RANGE 2011 2012 2013 2014 2015*
Method Minimum Maximum Unit Price Unit Price Unit Price Unit Price Unit Price
Condoms - Female $0.53 $0.56 $0.56 $0.55 $0.54 $0.53 $0.52
Condoms - Male $0.03 $0.03 $0.03 $0.03 $0.03 $0.03 $0.03
Implants $8.50 $18.65 $18.65 $17.98 $8.50 $8.50 $8.50
Injectables $0.81 $0.83 $0.82 $0.82 $0.83 $0.81 $0.81
IUDs $0.43 $0.48 $0.43 $0.43 $0.43 $0.48 $0.47
Orals - Combined $0.28 $0.31 $0.31 $0.30 $0.28 $0.30 $0.28
Orals - Progestin Only $0.31 $0.32 $0.32 $0.32 $0.31 $0.31 $0.32
Orals - Emergency $0.34 $0.49 $0.34 $0.49 $0.44 $0.30 $0.37
http://www.unfpa.org/sites/default/files/resource-pdf/UNFPA%20Contraceptive%20Price%20Indicators%20-%202013.pdf, “UNFPA Contraceptive Price Indicators – 2012,”available at http://www.unfpa.org/sites/default/files/resource-pdf/UNFPA%20Contraceptive%20Price%20Indica-tors%20-%202012.pdf, “UNFPA Contraceptive Price Indicators – 2011,” UNFPA.
APPE
NDIC
ES

31
To protect customer confidentiality, suppliers were not asked to dis-close customer information associated with shipment volumes. Instead, CHAI relied upon RHI to estimate the donor-funded volumes and in turn, users and costs. RHI data contains shipment volume data report-ed by central procurement offices of major contraceptive orders and other organizations that procure contraceptives. This includes organi-zations such as IPPF, MSI, PSI, USAID, and UNFPA. From 2011 to 2015, the following funding sources are associated with shipment volumes to 69 FP2020 countries and shipment volumes to procurer warehouses that are reported into RHI:
APPENDIX D – ESTIMATING TOTAL FP2020 DONOR-FUNDED VOLUMES
Source: [1] RHI Shipment Data, March 2016.
EXHIBIT D.1: FP2020 FUNDING SOURCES REPORTING TO RHI, 2011–2015
FUNDING SOURCES
AFDB IPPF PSI
BMGF KFW UNDP
CDC MOH UNFPA
DFID MSI UNPEACE
DKT NETHERLANDS USAID
GLOBALFUND OTHER USDOD
ICA OTHERGOV WORLDBANK
IPPF UNDP
For the purposes of this analysis, national procurements identified as “OTHERGOV” and “MOH” as well as unknown funding sources identified as “OTHER” have been excluded. These may include volumes associated with UNFPA third party procurements or SMOs procurements using un-identified funding sources. It is important to note that RHI only includes data for procurement agencies that are data providers. There may be other donor-funded procurements that are not reported into RHI.
APPE
NDIC
ES

32
APPENDIX E – COUNTRY HIGHLIGHTS: BANGLADESH, INDONESIA, AND INDIA
CHAI conducted supplementary research and analysis using publicly available sources of data in three large markets: Bangladesh, India, and Indonesia—key countries accounting for the largest proportion of the gap based on country-specific comparisons between FP2020-reported users on product-based and users implied by the shipment data. Due to the limitations of these data sources, CHAI cannot confirm compre-hensive coverage of the public sector markets in these countries; rather, the data is meant to be used as initial confirmation of local and region-al procurement in these markets that are not covered by the suppliers participating in this report.
EXHIBIT E.1: MOHFW SUPPLY CHAIN CONTRACEPTIVE SHIPMENT RECEIPT DETAILS
PRODUCT NAME SUPPLIER NAME SUM OF QUANTITY
Condom ESSENTIAL DRUGS CO. LTD. 50,000,000
Condom KHULNA ESSENTIAL LATEX PLANT((KELP) 100,000,000
Ecp (2 Tab/Pack) M/S, RENETA LTD. 100,000
Implant (Single Rod) MSD-NV Organon, Organon(India) Private Ltd.
50,000
Injectables (DMPA) Helm-AG 14,000,000
Injectables (DMPA) TECHNO DRUGS Ltd 2,500,000
Oral Contraceptive Pill (Shukhi) HLL Lifecare Limited 22,469,025
Oral Contraceptive Pill (Shukhi M/S, RENETA LTD. 20,730,975
Oral Contraceptive Pill (Shukhi Maneesh Pharmaceuticals Limited
22,289,280
Oral Contraceptive Pill (Shukhi Popular Pharmaceuticals Ltd.
10,800,000
Oral Contraceptive Pill (Shukhi TECHNO DRUGS Ltd 1,710,720
Oral Pill Apon M/S, RENETA LTD. 1,000,000
Source: Bangladesh MOHFW, Supply Chain Management Portal, 2016.
44. Government of Bangladesh, Ministry of Health and Family Welfare, “MOHFW Supply Chain Management Portal – National Receive Details; Product Group: Contraceptive; Product Name: ALL; Warehouse; ALL” available at: https://scmpbd.org/index.php/wims-reports/national-re-ceive-details.
45. The fiscal year for Bangladesh runs from July 1 to June 30, as such 2015/2016 figures were not included in this analysis as the reported data is not a full fiscal year.
APPE
NDIC
ES
BangladeshCHAI used data from the Government of Bangladesh’s Ministry of Health and Family Welfare (MOHFW)44 for fiscal year 2014/2015.45 The data was further vetted through conversations with in-country experts from Management Sciences for Health.

33
APPENDIX E – COUNTRY HIGHLIGHTS: BANGLADESH, INDONESIA, AND INDIA
IndiaCHAI looked at data from the Indian Government’s MOHFW Annual Reports46 for fiscal years 2013/2014 and 2014/201547 for the India market. The MOHFW distributes contraceptives to the states/UTs through Free Supply Scheme and Social Marketing Scheme; only modern contracep-tive methods including condoms,48 oral pills (orals – combined), IUDs, and ECPs (orals – emergency) are included in this analysis. While the
Source: India MOHFW Annual Report, 2014-2015.
*Figures are Provisional
46. Government of India, Ministry of Health and Family Welfare, “Annual Report of Depart-ment of Health & Family Welfare for the year of 2014-15” available at: http://www.mohfw.nic.in/index1.php?lang=1&level=2&sublinkid=5253&lid=3215; “Annual Report of Department of Health & Family Welfare for the year of 2013-14” available at: http://www.mohfw.nic.in/index2.php?lang=1&level=2&sublinkid=4454&lid=2939
47. The fiscal year for India runs from April 1 to March 31, as such 2014/2015 figures were not included in this analysis as the reported data is not a full fiscal year.48. Condoms are reported in millions whereas all other methods are reported as “lakh” – the Indian unit of 100,000
EXHIBIT E.2.1: QUANTITIES SUPPLIED TO STATES/UTS
CONTRACEPTIVES 2012-13 2013-14 2014-15 (UP TO NOV.14)
Condoms (In million pieces) 367.86 394.00 176.00
Oral Pills (In lakh cycles) 226.79 361.24 102.84
IUDs (In lakh pieces) 87.50 60.42 45.88
Tubal Rings (In lakh pairs) 31.22 19.00 15.76
ECP (in lakh packs) 75.91 75.80 58.62
Pregnancy Test Kits (in lakhs)
222.18 100.14 102.38
EXHIBIT E.2.2: PERFORMANCE OF SOCIAL MARKETING PROGRAMME IN THE SALE OF CONTRACEPTIVE
CONTRACEPTIVES 2011-12 2012-13 2013-14 2014-15 (UP TO OCT.2014)
Condoms (Million pieces)
677.91 618.18 698.33 366.30
Oral Pills (Social Mar-keting) (lakh cycles)
471.97 376.82 290.27 109.48
SAHELI 244.56 270.76 279.35 11.47*
EXHIBIT E.2.3: EMERGENCY CONTRACEPTIVE PILLS [ECP]
CONTRACEPTIVES 2011-12 2012-13 2013-14 2014-15 (UP TO OCT.2014)
ECP 75.91 75.80 75.80 366.30
EXHIBIT E.2: ANNUAL REPORT OF DEPARTMENT OF HEALTH & FAMILY WELFARE FOR THE YEAR OF 2014-15
MOHFW Annual Reports do not record who the awarded suppliers are, a report from USAID has identified local suppliers and the contraceptives they supply to the government and SMO programs as of 2006, including: Indian Drug and Pharmaceutical Ltd. (IDPL), HLL Lifecare Limited, Phaar-masia, Pregna International, SMB Corporation, Cipla, Win-Medicare, and Famy Care, which is now Mylan.
APPE
NDIC
ES
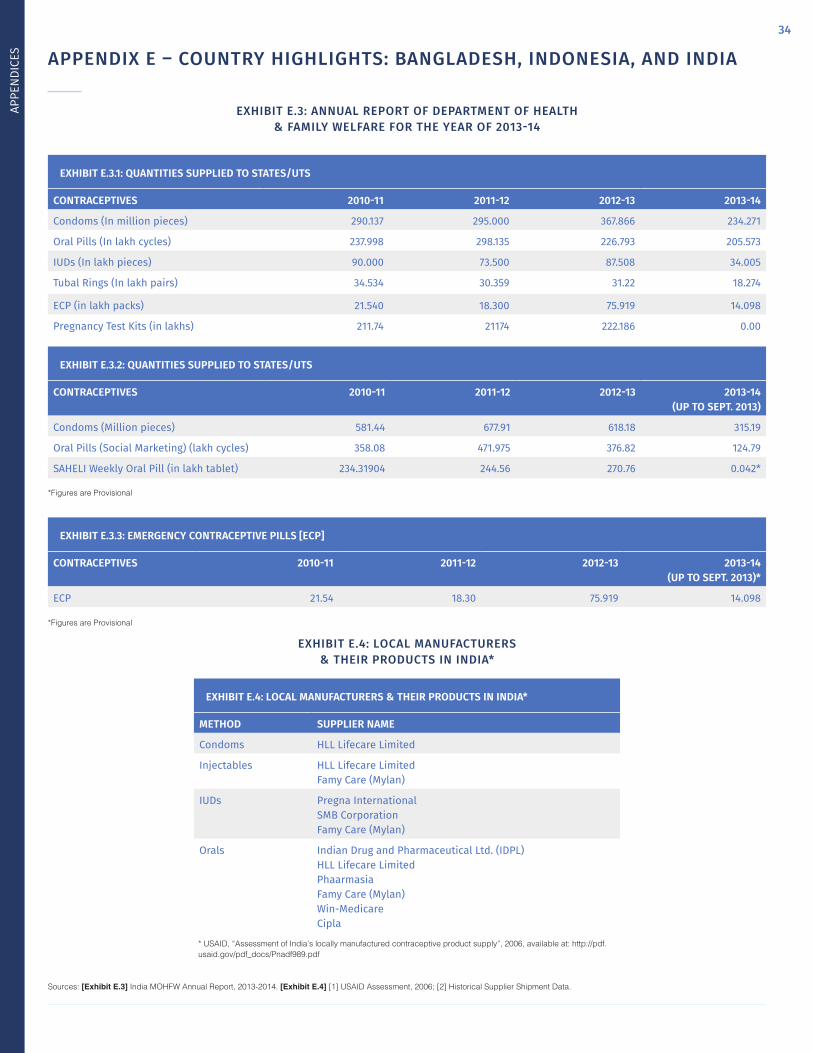
34
APPENDIX E – COUNTRY HIGHLIGHTS: BANGLADESH, INDONESIA, AND INDIA
EXHIBIT E.3: ANNUAL REPORT OF DEPARTMENT OF HEALTH & FAMILY WELFARE FOR THE YEAR OF 2013-14
EXHIBIT E.4: LOCAL MANUFACTURERS & THEIR PRODUCTS IN INDIA*
EXHIBIT E.3.1: QUANTITIES SUPPLIED TO STATES/UTS
CONTRACEPTIVES 2010-11 2011-12 2012-13 2013-14
Condoms (In million pieces) 290.137 295.000 367.866 234.271
Oral Pills (In lakh cycles) 237.998 298.135 226.793 205.573
IUDs (In lakh pieces) 90.000 73.500 87.508 34.005
Tubal Rings (In lakh pairs) 34.534 30.359 31.22 18.274
ECP (in lakh packs) 21.540 18.300 75.919 14.098
Pregnancy Test Kits (in lakhs) 211.74 21174 222.186 0.00
EXHIBIT E.3.2: QUANTITIES SUPPLIED TO STATES/UTS
CONTRACEPTIVES 2010-11 2011-12 2012-13 2013-14 (UP TO SEPT. 2013)
Condoms (Million pieces) 581.44 677.91 618.18 315.19
Oral Pills (Social Marketing) (lakh cycles) 358.08 471.975 376.82 124.79
SAHELI Weekly Oral Pill (in lakh tablet) 234.31904 244.56 270.76 0.042*
EXHIBIT E.4: LOCAL MANUFACTURERS & THEIR PRODUCTS IN INDIA*
METHOD SUPPLIER NAME
Condoms HLL Lifecare Limited
Injectables HLL Lifecare LimitedFamy Care (Mylan)
IUDs Pregna InternationalSMB CorporationFamy Care (Mylan)
Orals Indian Drug and Pharmaceutical Ltd. (IDPL)HLL Lifecare LimitedPhaarmasiaFamy Care (Mylan)Win-MedicareCipla
*Figures are Provisional
* USAID, “Assessment of India’s locally manufactured contraceptive product supply”, 2006, available at: http://pdf.usaid.gov/pdf_docs/Pnadf989.pdf
*Figures are Provisional
EXHIBIT E.3.3: EMERGENCY CONTRACEPTIVE PILLS [ECP]
CONTRACEPTIVES 2010-11 2011-12 2012-13 2013-14 (UP TO SEPT. 2013)*
ECP 21.54 18.30 75.919 14.098
Sources: [Exhibit E.3] India MOHFW Annual Report, 2013-2014. [Exhibit E.4] [1] USAID Assessment, 2006; [2] Historical Supplier Shipment Data.
APPE
NDIC
ES
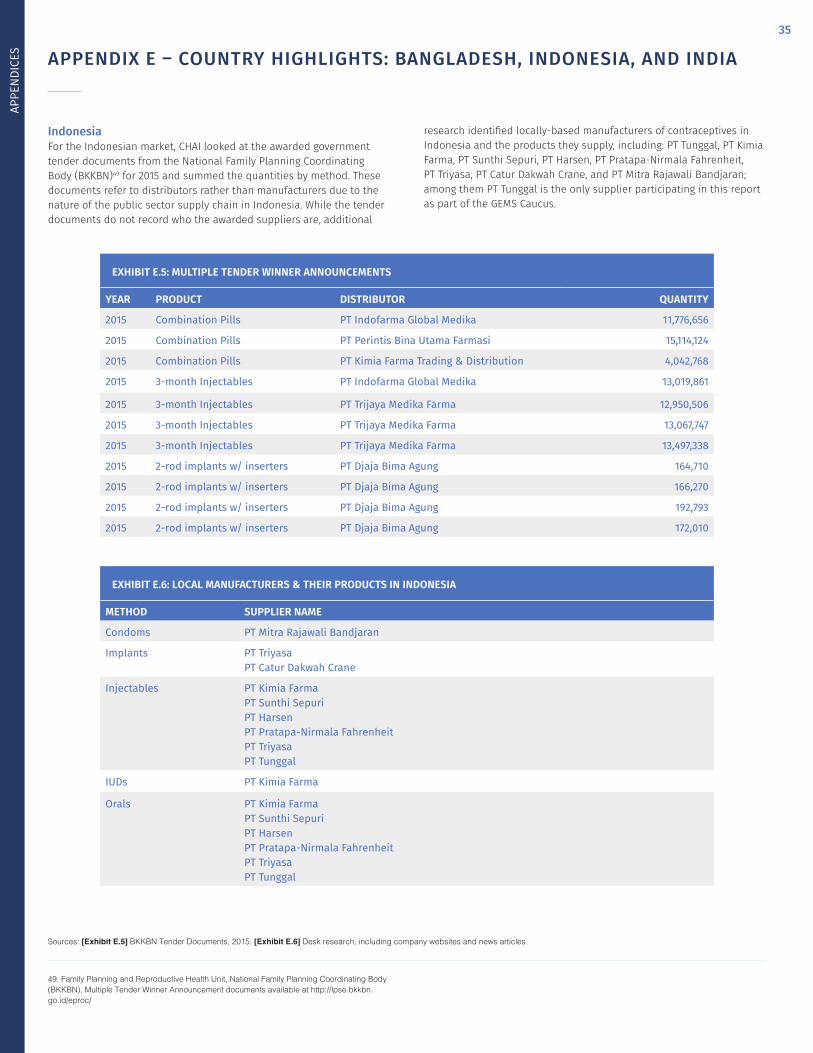
35
APPENDIX E – COUNTRY HIGHLIGHTS: BANGLADESH, INDONESIA, AND INDIA
IndonesiaFor the Indonesian market, CHAI looked at the awarded government tender documents from the National Family Planning Coordinating Body (BKKBN)49 for 2015 and summed the quantities by method. These documents refer to distributors rather than manufacturers due to the nature of the public sector supply chain in Indonesia. While the tender documents do not record who the awarded suppliers are, additional
Sources: [Exhibit E.5] BKKBN Tender Documents, 2015. [Exhibit E.6] Desk research, including company websites and news articles
49. Family Planning and Reproductive Health Unit, National Family Planning Coordinating Body (BKKBN), Multiple Tender Winner Announcement documents available at http://lpse.bkkbn.go.id/eproc/
EXHIBIT E.5: MULTIPLE TENDER WINNER ANNOUNCEMENTS
YEAR PRODUCT DISTRIBUTOR QUANTITY
2015 Combination Pills PT Indofarma Global Medika 11,776,656
2015 Combination Pills PT Perintis Bina Utama Farmasi 15,114,124
2015 Combination Pills PT Kimia Farma Trading & Distribution 4,042,768
2015 3-month Injectables PT Indofarma Global Medika 13,019,861
2015 3-month Injectables PT Trijaya Medika Farma 12,950,506
2015 3-month Injectables PT Trijaya Medika Farma 13,067,747
2015 3-month Injectables PT Trijaya Medika Farma 13,497,338
2015 2-rod implants w/ inserters PT Djaja Bima Agung 164,710
2015 2-rod implants w/ inserters PT Djaja Bima Agung 166,270
2015 2-rod implants w/ inserters PT Djaja Bima Agung 192,793
2015 2-rod implants w/ inserters PT Djaja Bima Agung 172,010
EXHIBIT E.6: LOCAL MANUFACTURERS & THEIR PRODUCTS IN INDONESIA
METHOD SUPPLIER NAME
Condoms PT Mitra Rajawali Bandjaran
Implants PT TriyasaPT Catur Dakwah Crane
Injectables PT Kimia FarmaPT Sunthi SepuriPT HarsenPT Pratapa-Nirmala FahrenheitPT TriyasaPT Tunggal
IUDs PT Kimia Farma
Orals PT Kimia FarmaPT Sunthi SepuriPT HarsenPT Pratapa-Nirmala FahrenheitPT TriyasaPT Tunggal
research identified locally-based manufacturers of contraceptives in Indonesia and the products they supply, including: PT Tunggal, PT Kimia Farma, PT Sunthi Sepuri, PT Harsen, PT Pratapa-Nirmala Fahrenheit, PT Triyasa, PT Catur Dakwah Crane, and PT Mitra Rajawali Bandjaran; among them PT Tunggal is the only supplier participating in this report as part of the GEMS Caucus.
APPE
NDIC
ES

36
APPENDIX F – KEY TERMS AND DEFINITIONS
Shipment VolumesShipment volumes refers to the amount of a particular contraceptive method that has been transported.
DemandDemand refers to the desire for a particular contraceptive method in a country; for the purposes of this report, it is assumed that increased procure-ment is a result of increased demand from users.
Total FP2020 Public Sector MarketThe total FP2020 public sector market is based on volumes purchased by institutional buyers and MOH or government-affiliated procurers based on RHI data (male condoms) and historical supplier-reported shipment data (female condoms, implants, injectables, IUDs, and orals) for the 69 FP2020 focus countries, defined as countries with a 2010 gross national income (GNI) per capita less than or equal to US$2,500. Although South Africa made an FP2020 commitment, its GNI per capita was greater than US$2,500.
Market Value and SpendMarket value and spend refers to the supplier-reported shipment volume multiplied by the average prices of UNFPA and USAID for the specific years.
Method MixMethod mix is the percentage distribution of implied contraceptive users by method.
Implied UsersImplied users and all users referred to in this report are a measure of the number of women using a contraceptive method that is calculated using a method-specific consumption to shipment factor and corresponding couple-years of protection (CYP) factor. See Appendix C for further details.
Market ShareMarket share is the percentage of total value of shipment volumes in a market captured by a certain contraceptive method.
APPE
NDIC
ES
37
APPENDIX G – ACRONYMS
CHAI CLINTON HEALTH ACCESS INITIATIVE
CYP COUPLE-YEARS OF PROTECTION
FP FAMILY PLANNING
FP2020 FAMILY PLANNING 2020
GEMS GENERIC MANUFACTURERS FOR REPRODUCTIVE HEALTH
GNI GROSS NATIONAL INCOME
IUD INTRA-UTERINE DEVICE
LAM LACTATIONAL AMENORRHEA METHOD
LARC LONG-ACTING REVERSIBLE CONTRACEPTIVES
MOH MINISTRY OF HEALTH
MOHFW MINISTRY OF HEALTH AND FAMILY WELFARE
MOU MEMORANDUM OF UNDERSTANDING
RHSC REPRODUCTIVE HEALTH SUPPLIES COALITION
RHI RHINTERCHANGE
USAID UNITED STATES AGENCY FOR INTERNATIONAL DEVELOPMENT
UNFPA UNITED NATIONS POPULATION FUND
APPE
NDIC
ES