Families & Poverty Introduction to Family Studies.
34
Families & Families & Poverty Poverty Introduction to Family Introduction to Family Studies Studies
-
Upload
myra-johnson -
Category
Documents
-
view
227 -
download
1
Transcript of Families & Poverty Introduction to Family Studies.

Families & Families & PovertyPoverty
Introduction to Family Introduction to Family StudiesStudies

Thinking about PovertyThinking about Poverty
What percentage of the population is poor?What percentage of the population is poor?
What percentage of children are poor?What percentage of children are poor?
What are poor childrenWhat are poor children’’s lives like?s lives like?

TerminologyTerminology
Poverty: Income below the federal poverty level (FPL)Poverty: Income below the federal poverty level (FPL) $$$22,050 $22,050 per year for a family of fourper year for a family of four
Low-income: Income below 200 percent of the federal Low-income: Income below 200 percent of the federal poverty level (FPL) poverty level (FPL) $44,100 per year for a family of four$44,100 per year for a family of four
Source: http://www.childstats.gov/americaschildren/eco1.asp

Poverty in the U.S.Poverty in the U.S. Every year the Census Bureau publishes Every year the Census Bureau publishes
the number of people in povertythe number of people in poverty the number without health insurance the number without health insurance the median family incomethe median family income
The bad economy has led to an increase in poverty and a The bad economy has led to an increase in poverty and a decrease in median family incomedecrease in median family income
15.0 percent of Americans fall below the poverty line (46.5 15.0 percent of Americans fall below the poverty line (46.5 million people)million people)
Real median household income in the United States in 2010 was Real median household income in the United States in 2010 was $51,000$51,000
Household income has declined by 8.3 percent since 2008Household income has declined by 8.3 percent since 2008
The number of people without health insurance in the U.S. was The number of people without health insurance in the U.S. was 48 million in 2012, while the percentage without coverage was 48 million in 2012, while the percentage without coverage was 15.7 percent15.7 percent
Source: http://www.census.gov/newsroom/releases/archives/income_wealth/cb13-Source: http://www.census.gov/newsroom/releases/archives/income_wealth/cb13-165.html165.html

Families & PovertyFamilies & Poverty
YearYear PercentPercent1969196913.713.71979197912.412.41989198913.113.11998199812.712.72001200111.711.72007200712.512.52009200914.314.32012201215.015.02013201314.014.0
Source: U.S. Bureau of the Census
Despite many initiatives and billions of dollars over the past 40 years:
Note how LITTLE CHANGE in the % of people living below poverty
Poverty rate did go down from 2012-2013

Families, Public Policy, Families, Public Policy, & Poverty& Poverty
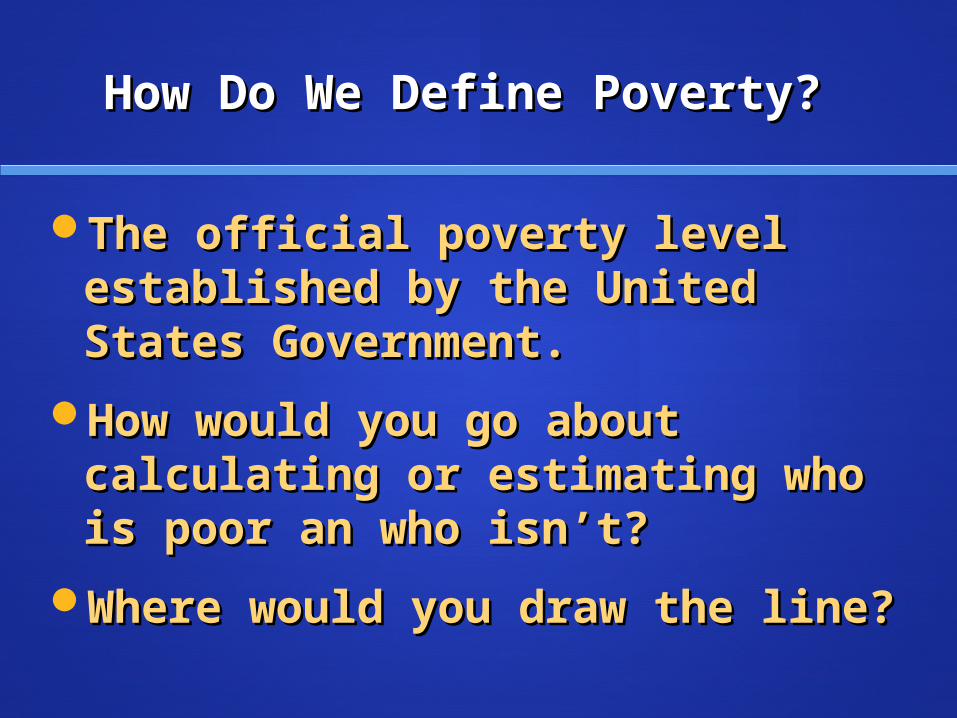
How Do We Define Poverty?How Do We Define Poverty?
The official poverty level The official poverty level established by the United established by the United States Government.States Government.
How would you go about How would you go about calculating or estimating who calculating or estimating who is poor an who isnis poor an who isn’’t?t?
Where would you draw the Where would you draw the line?line?

How Do We Define Poverty?How Do We Define Poverty?
Poverty thresholds were Poverty thresholds were developed in 1963-1964 by Mollie developed in 1963-1964 by Mollie Orshansky, a home economist at Orshansky, a home economist at the Social Security Administration.the Social Security Administration.
Based on the estimated cost of an Based on the estimated cost of an ““economy food budgeteconomy food budget”” multiplied multiplied by 3 (assuming that food by 3 (assuming that food constitutes 1/3 of a familyconstitutes 1/3 of a family’’s s budget).budget).
The economy food budget was The economy food budget was ““designed for temporary or designed for temporary or emergency use when funds are emergency use when funds are low.low.””

How Do We Define Poverty?How Do We Define Poverty?
Poverty Poverty thresholdsthresholds define the poverty level define the poverty level
Used for statistical purposes – to show poverty over timeUsed for statistical purposes – to show poverty over time Adjusted for:Adjusted for:
family sizefamily size number of children under 18 years of agenumber of children under 18 years of age annually based on changes in the cost of livingannually based on changes in the cost of living
Problems with this definitionProblems with this definition Families living below poverty have inadequate incomesFamilies living below poverty have inadequate incomes Families just above line still teetering on the edgeFamilies just above line still teetering on the edge

How Do We Define How Do We Define Poverty?Poverty?
Poverty Poverty guidelinesguidelines
Issued each year by the Dept. of Issued each year by the Dept. of Health and Human Services (HHS). Health and Human Services (HHS).
Used for administrative purposes-- Used for administrative purposes-- for instance determining who is for instance determining who is eligible for federal programs like: eligible for federal programs like:
Temporary Assistance to Needy Temporary Assistance to Needy Families (TANF) or welfare.Families (TANF) or welfare.
Food stampsFood stamps

Poverty Guidelines for Recent Poverty Guidelines for Recent YearsYears**
Year First Four Person Each Add’l Person Family Person1996 $7,740 $15,600 $2,620 1998 $8,050 $16,450 $2,800 2000 $8,350 $17,050 $2,900 2004 $9,310 $18,850 $3,180
2010 $10,830 $22,050 $3,740* for the 48 contiguous states and D.C.
Source: Department of Health and Human Services Source: Department of Health and Human Services http://aspe.hhs.gov/poverty/10poverty.shtmlhttp://aspe.hhs.gov/poverty/10poverty.shtml
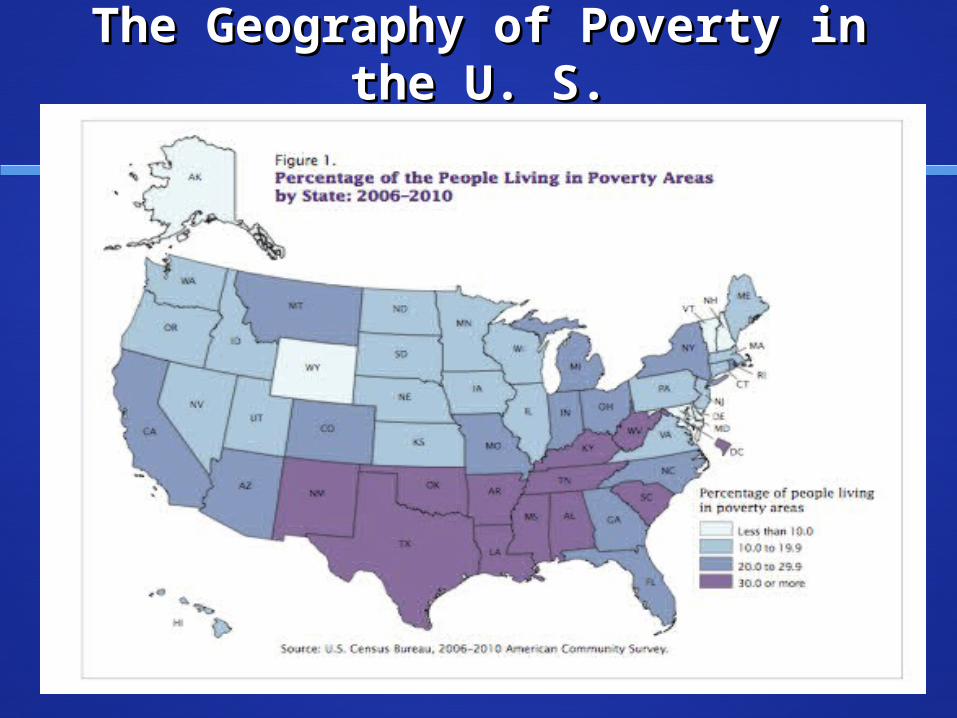
The Geography of Poverty in The Geography of Poverty in the U. S.the U. S.

The Deserving PoorThe Deserving PoorHistorian, Michael Katz, studies the history of
poverty in the U.S.
He argues that there have always been a group of people called the deserving poor – they deserve to get assistance from the government
They are poor through no fault of their own
Prior to the 1970s, this group included the:AgedChildrenFemale headed families (through widowhood)

The Deserving PoorThe Deserving Poor
Now the deserving poor are only:AgedChildrenDisabled/mentally challengedThe deserving poor no longer includes single
mothers because they came to be perceived as poor because they made bad choices – i.e. had a child outside of marriage
Shift from single motherhood due to widowhood vs. single motherhood due to nonmarital birth
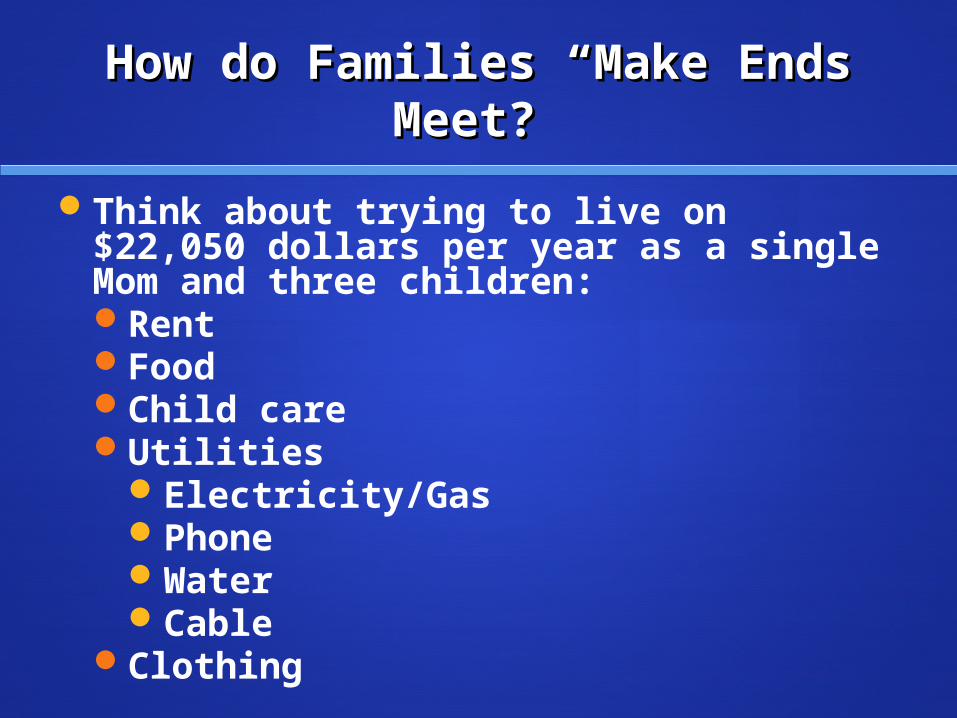
How do Families How do Families ““Make Ends Make Ends Meet?Meet?””
Think about trying to live on $22,050 dollars per year as a single Mom and three children:RentFoodChild careUtilities
Electricity/GasPhoneWaterCable
Clothing

Poverty in the U.S. Poverty in the U.S. in 2013in 2013
The poverty rate finanalyy decrease The poverty rate finanalyy decrease by 1.0 from 2012 to 2013 – but not by 1.0 from 2012 to 2013 – but not stat. significantstat. significant
We now have the largest number of We now have the largest number of poor in the U. S. in the 52 years poor in the U. S. in the 52 years for which poverty estimates have for which poverty estimates have been published.been published.
Your likelihood of being poor and of receiving welfare is associated with your race and ethnicity
Source: http://www.census.gov/newsroom/releases/archives/income_wealth/cb11-157.html
04/19/23
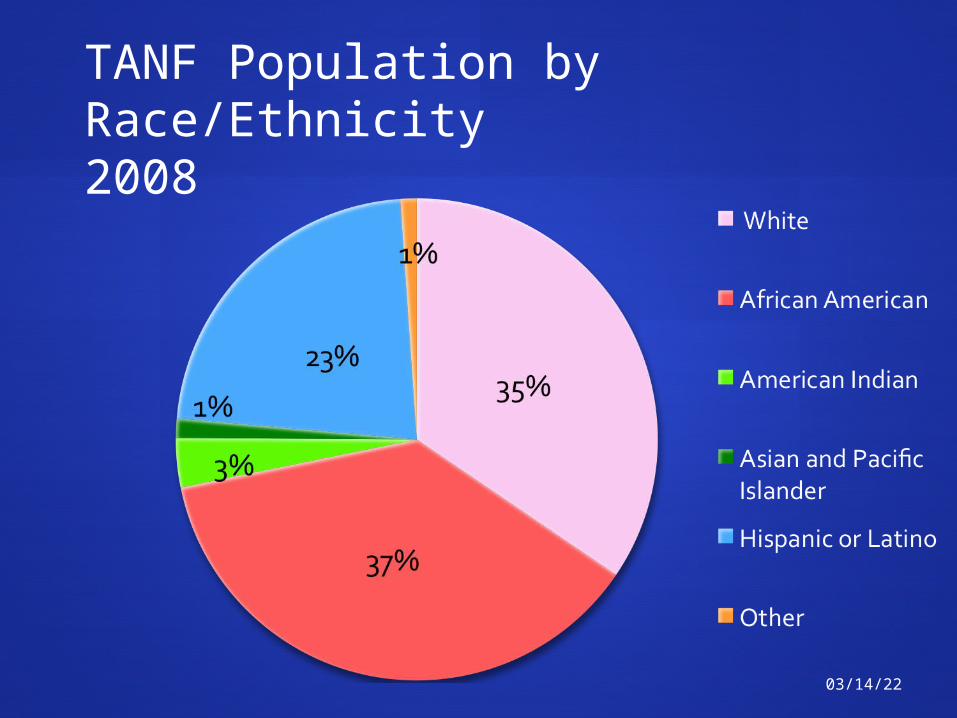
TANF Population by Race/Ethnicity2008

U.S. Population by Race U.S. Population by Race and Ethnicityand Ethnicity
In the U. S. In the U. S.
75% of the Total U.S. population 75% of the Total U.S. population are Non Hispanic whiteare Non Hispanic white
12.6 % are Non Hispanic African 12.6 % are Non Hispanic African AmericanAmerican
16.3 % are Hispanic16.3 % are Hispanic
6.3 % are Asian6.3 % are Asian

But But compare the total percentage compare the total percentage of each race/ethnic group to the of each race/ethnic group to the
percentage on TANFpercentage on TANF
75% of the TOTAL U.S. population in Non Hispanic 75% of the TOTAL U.S. population in Non Hispanic white but only 35% of the TANF population is white but only 35% of the TANF population is white white So whites are underrepresented in the TANF So whites are underrepresented in the TANF population compared to the % in TOTAL U.S. population compared to the % in TOTAL U.S. populationpopulation
12.6 % of the U.S. population is Non 12.6 % of the U.S. population is Non Hispanic African American, but African Hispanic African American, but African Americans make up 35% of the TANF Americans make up 35% of the TANF populationspopulationsSo African Americans are OVER So African Americans are OVER represented in the TANF populationrepresented in the TANF population

Child PovertyChild Poverty
How many children live in poverty? How many children live in poverty?
Children represent a disproportionate share of the Children represent a disproportionate share of the poor in the United Statespoor in the United States
25 percent of the total population, are children in the 25 percent of the total population, are children in the U.S. U.S.
but but
35 percent of the poor population are children 35 percent of the poor population are children
In 2011, 21 percent, were poor. In 2011, 21 percent, were poor.

Child Poverty Rates in the U.S. Child Poverty Rates in the U.S. from 2006-2010from 2006-2010
Source: Kids Count retrieved from http://datacenter.kidscount.org/data/acrossstates/NationalProfile.aspx?cat=16&group=Category&loc=1&dt=1%2c3%2c2%2c4

Elderly are LESS poor today Elderly are LESS poor today
Note on the previous chart that the elderly (age 65 and Note on the previous chart that the elderly (age 65 and over) were the poorest in 1959over) were the poorest in 1959
Over time, the poverty rate for 65+ age group declines Over time, the poverty rate for 65+ age group declines
In 1974 the elderly poverty rate dips below child poverty In 1974 the elderly poverty rate dips below child poverty rate (note that lines cross)rate (note that lines cross)
In 2011 children (18 and under) have the highest poverty In 2011 children (18 and under) have the highest poverty rate of three age groups on graphrate of three age groups on graph

http://datacenter.kidscount.org/data/tables/43-children-in-http://datacenter.kidscount.org/data/tables/43-children-in-poverty?loc=1&loct=2#ranking/6/any/true/38/any/poverty?loc=1&loct=2#ranking/6/any/true/38/any/322http://datacenter.kidscount.org/data/acrossstates/322http://datacenter.kidscount.org/data/acrossstates/NationalProfile.aspx?NationalProfile.aspx?cat=16&group=Category&loc=1&dt=1%2c3%2c2%2c4cat=16&group=Category&loc=1&dt=1%2c3%2c2%2c4
http://www.npc.umich.edu/poverty/http://www.npc.umich.edu/poverty/
Sources for Statistics on Child Sources for Statistics on Child PovertyPoverty

Child Poverty varies by race and ethnicityChild Poverty varies by race and ethnicity
The poverty rate for children also varies substantially by The poverty rate for children also varies substantially by race and Hispanic origin, as shown in the table belowrace and Hispanic origin, as shown in the table below
Children Under 18 Living in Poverty, 2011Children Under 18 Living in Poverty, 2011
All children under 18: 23%All children under 18: 23%
White only, non-Hispanic: 12.5%White only, non-Hispanic: 12.5%
Black: 37.4 %Black: 37.4 %
Hispanic: 34.1 %Hispanic: 34.1 %
SOURCE: http://aspe.hhs.gov/hsp/12/povertyandincomeest/ib.shtml

Child Poverty Rate by Family Child Poverty Rate by Family StructureStructure
Source: http://aspe.hhs.gov/hsp/12/povertyandincomeest/ib.shtml

Child Poverty, Race/Ethnicity & Family Child Poverty, Race/Ethnicity & Family StructureStructure
Latino/a and African American children Latino/a and African American children are disproportionately low income.are disproportionately low income.
Nearly one-half of children living in female-Nearly one-half of children living in female-headed families live below povertyheaded families live below poverty

Effects of Poverty on ChildrenEffects of Poverty on Children
HealthHealth MortalityMortality Low birth weightLow birth weight Health problemsHealth problems AbuseAbuse
Educational OutcomesEducational Outcomes High drop out rateHigh drop out rate Underfunded schoolsUnderfunded schools

Kidscount websiteKidscount website
What are poverty rates for Children in New Jersey?What are poverty rates for Children in New Jersey?
http://datacenter.kidscount.org/data/bystate/Default.aspxhttp://datacenter.kidscount.org/data/bystate/Default.aspx

There Are No Children HereThere Are No Children Here
The Henry Horner Homes were not always badThe Henry Horner Homes were not always bad
In the 1960s there were groups like girl scouts who met In the 1960s there were groups like girl scouts who met regularlyregularly
And the crime rate was lowerAnd the crime rate was lower
But during the 1970s and 1980s drug and gang activity But during the 1970s and 1980s drug and gang activity increasedincreased

There Are No Children HereThere Are No Children Here
The local Chicago government officials and the Chicago The local Chicago government officials and the Chicago Housing Authority never wanted the Henry Horner Homes Housing Authority never wanted the Henry Horner Homes to be built in the first placeto be built in the first place
The buildings were not well funded and were not well builtThe buildings were not well funded and were not well built
So they never put much money into them, even from the So they never put much money into them, even from the beginningbeginning
Later, in the 1980s, findings of a housing authority tour of Later, in the 1980s, findings of a housing authority tour of facilities revealed terrible conditions…rats, filthy, flooded facilities revealed terrible conditions…rats, filthy, flooded basementsbasements
ChicagoChicago’’s public housing has a history of neglect s public housing has a history of neglect

There Are No Children HereThere Are No Children Here
In Philadelphia, and Newark -- high-rise public housing is In Philadelphia, and Newark -- high-rise public housing is being replaced by:being replaced by: two-story, low density townhousestwo-story, low density townhouses Section 8 vouchersSection 8 vouchers
Strategies to increase home ownership: Strategies to increase home ownership:
targeted at low to moderate income who targeted at low to moderate income who can afford to pay a mortgage, but cannot can afford to pay a mortgage, but cannot get together enough $$ for a down get together enough $$ for a down payment & closing costspayment & closing costs

SummarySummary
Poverty has been increasing, while household Poverty has been increasing, while household income is decreasingincome is decreasing
More people are poor today than in the history More people are poor today than in the history of data collected on the poor in the U.S.of data collected on the poor in the U.S.
15.0 percent of Americans are poor in 201215.0 percent of Americans are poor in 2012
Even people living 100 % above the poverty Even people living 100 % above the poverty line are poor as the line is set line are poor as the line is set ““artificiallyartificially”” low low
The line was based on the price of a short-The line was based on the price of a short-term monthly diet – designed for emergencies…term monthly diet – designed for emergencies…not for long term usenot for long term use

SummarySummary
For a rich nation, the U.S. has high rates of child povertyFor a rich nation, the U.S. has high rates of child poverty
Children are more likely to be in poverty than adultsChildren are more likely to be in poverty than adults
Child poverty varies by race and ethnicityChild poverty varies by race and ethnicity
Is this the U.S. we want?Is this the U.S. we want?
How can we do better as a society and as individuals to How can we do better as a society and as individuals to fight child poverty?fight child poverty?