
Families on the front line report: Part Two
75
FAMILIES ON THE FRONT LINE? FAMILIES ON THE FRONT LINE? Local spending on children’s services in austerity Family and Parenting Institute Local spending on children’s services in austerity October 2012
-
Upload
family-and-childcare-trust -
Category
Government & Nonprofit
-
view
42 -
download
2
Transcript of Families on the front line report: Part Two

FAMILIES ON THE FRONT LINE?
FAMILIES ON THE FRONT LINE? Local spending on children’s services in austerity
Family and Parenting Institute
Local spending on children’s services in austerity
October 2012

About the Family and Parenting Institute (FPI)FPI is a charity working to make the UK a better place for children and families. We want to help build a UK that supports families as they are today – that means families in all their diverse forms.
We are here to speak up for all families, and focus in particular on those facing disadvantage. We campaign for change to improve the lives of children and families right now and we provide insight into the changing needs of families to help build a better society for the future.
We offer practical support to businesses and organisations on how to be more family friendly and we provide advice to families through a range of publications and information about how to cope with the challenges of family life.
About ESROESRO is an award-winning, full-service research agency, providing insight and intelligence to a wide range of public, third and commercial sector clients. ESRO works with clients to produce published reports and visuals, ensuring that research has an impact beyond the bookshelf. Specialisms include: delivering strategic insight and evaluation of policy impacts; deep qualitative and ethnographic research with ‘hard to reach’ populations and communities; understanding customer experiences of services and products; and building evidence bases for decision-makers.

FAMILIES ON THE FRONT LINE? LOCAL SPENDING ON CHILDREN’S SERVICES IN AUSTERITY
1
Contents
Introduction 4Families in the Age of Austerity 4A new local settlement for families? 5 Families on the front line? Local spending on children’s services in austerity 5
Summary of research findings 7
Methodology 11
CHAPTER 1Funding and policy context 15
Financial settlement 15Children’s services budgets: what is known nationally? 16Policy context 17
CHAPTER 2Data findings 20
The scale of budget fluctuations 20Where have budgets been reduced? 22What kinds of savings have been made? 26
CHAPTER 3 The story of the cuts 28
Reductions in service delivery 28Saved from the cuts 36The decline of universalism? 37What have these cutbacks meant for the voluntary sector? 38
CHAPTER 4An era of innovation and resourcefulness? 40
Enhancing efficiency 40Services to meet need 41Better ways of delivering services 44Innovation and new policy initiatives 48The Government’s Troubled Families initiative 49The cuts process 50The result of forensic strategic planning? 51

2
CONTENTS
CHAPTER 5A look towards the future 54
The low-hanging fruit 54A challenge for partnership working 55A challenge for commissioning, management and morale 56
Conclusion 58Innovation or erosion? 58Meeting the needs of the many or the few? 59Is early intervention affordable in austerity? 59Doing more with less 60
Appendix 1Council by council data on savings and growth 62
Appendix 2
Summary of budget reductions across service categories 66
Endnotes 69
References 71
Index of Visualisations
Overview of research sample 13 The context in which children’s services are being delivered 18 The timing of the spending cuts across the two years studied 21How different service areas were affected by spending reductions 24 Strategies used by local authorities to deliver cost savings 33The trend towards service integration at the local level 46The distribution and timing of budget growth and reductions, council-by-council 62

FAMILIES ON THE FRONT LINE? LOCAL SPENDING ON CHILDREN’S SERVICES IN AUSTERITY
3
Researchers and authors This research was carried out between November 2011 and August 2012 by Oliver Hopwood and Dr Robin Pharoah of ESRO.
The report was written by Oliver Hopwood and Dr Robin Pharoah of ESRO with Celia Hannon of the Family and Parenting Institute.
AcknowledgementsThe authors would like to thank all the councils and council officers who gave us their time and offered us their personal perspectives on the challenges of working in local government in the current climate. Without their generous input we would never have untangled the complex financial data contained in this report.
We would also like to thank the experts, researchers and local government officers who reviewed or commented on drafts. Finally, we are grateful to Paulien Hosang and Cormac Bakewell of Soapbox for their work in helping us to make these findings as accessible as possible.

4
INTRODUCTION
IntroductionFamily and Parenting Institute, October 2012
Thriving families are the foundation of a resilient society, and during periods of challenge and uncertainty they can come to serve as the ‘shock absorbers’ of change. The recession combined with public funding cutbacks have led to far-reaching changes in the provision of government financial support and services to families. At the Family and Parenting Institute we believed that, in addition to understanding the implications of tax and benefit changes for family budgets, there was a pressing need to explore how today’s funding pressures could be shaping the services families are able to access locally in years to come.
Families in the Age of AusterityThis report contains the findings of one strand of the Family and Parenting Institute’s (FPI) two-year research programme Families in the Age of Austerity. We have already worked to understand the impact on families of national policy change, analysing the implications of welfare reform and the introduction of Universal Credit.1 We continue to closely monitor the experiences of 10 families over the course of a year as they balance household budgets in a challenging economic climate. With the launch of this research, we document changes in local authority revenue spending on children’s services. We have worked with an expert research team at ESRO with the aim of making the complexities of council budgets accessible, so that it is possible to draw out some of the implications for families more directly.
While the arcane detail of yearly growth and savings within children’s services departments could, at first glance, appear remote from family life, at FPI we believed it to be an essential dimension of the picture of family life in austerity. Household income is only one element of the package of support that sustains family life. For most families, and particularly for vulnerable families, access to efficient, effective and free (or low cost) public services is a core component of the help they need to become and remain resilient.
Some of these services enable the state to intervene at crisis points (for example, residential care for looked after children (LAC)) whereas others (such as children’s centres or youth centres) can provide ways of addressing emerging issues before they become entrenched problems. As a result, the impact of any drop in household income is likely to be magnified if services are being rolled back simultaneously. For this reason, it is of real concern that many of the families most dependent on services are also the group most likely to be more affected by changes to benefit levels – meaning that austerity measures taking hold in both domains could create a double impact on family life.
Household income is only one element of the package of support that sustains family life

FAMILIES ON THE FRONT LINE? LOCAL SPENDING ON CHILDREN’S SERVICES IN AUSTERITY
5
A new local settlement for families?High-quality local services clearly matter to family life, but why is now such a critical juncture to pause and evaluate the resourcing of such services? It has been widely acknowledged that the tough funding settlement for local authorities in 2010 created significant financial challenges in terms of adjusting children’s services budgets, marking a major step change from the preceding period of incremental growth. This shift could well represent the emergence of a different type of settlement between families and local authorities – as the lines are re-drawn in terms of thresholds for access, the balance between targeted and universal provision, and local government comes to play a less significant role as a direct service provider.
It has become apparent that funding constraints are serving as a driver for far-reaching change at the local level as councils make difficult decisions about the closure and decommissioning of services, as well as around eligibility and charging. New trends in service delivery to families are emerging as services are integrated and re-designed, and new commissioning models with both the private and voluntary sector are brought into play. However, it is less clear how widespread these practices are, and how profound the impact of spending reductions on different categories of services has been.
To date, the picture has been partially obscured by the sheer range of approaches taken by different councils to balancing budgets, alongside the fact that they all have a different starting point when it comes to existing models of service provision. Inconsistencies in the presentation of budget data complicate the task of comparison between different authorities, as does the diversity of the needs of the populations that councils serve. Perhaps most problematic of all is the fact that any analysis of local cutbacks inevitably becomes politicised – one individual’s ‘efficiency saving’ is another’s ‘cutback’.
Families on the front line? Local spending on children’s services in austerityIt is clear that a range of factors make arriving at a single, unified story of cuts at local level an impossible task. But despite the variation in the picture (indeed, partly because of it), we felt there was a pressing need for further exploration of these developments with research such as this. While acknowledging the diversity and complexity of local authority budgets, this report therefore seeks to identify some of the strategies driving spending decisions within children’s services – analysing trends in terms of the categories of service that have been shielded from revenue spending reductions and those that have been more exposed.
It would be impractical to aim for full representativeness in such a study as this, so instead we take diversity as the starting point for the research and set out to understand the story of eight different local authorities over two budget cycles. For the purposes of this research, Children’s Services departments (while certainly not encompassing all the services families use locally) served as the most appropriate umbrella for the key public services that parents and children are likely to access.

6
INTRODUCTION
The numbers contained in budget documents could never tell the full story of the change underway in children’s services – in particular it would be inaccurate to assume that reductions in spending necessarily translate into cuts to front line service provision. Similarly, some of the consequences of cuts in spending may not be apparent for some years to come – meaning that we should avoid the temptation to draw premature conclusions about the direct ‘impact’ of spending adjustments on families and children.
Given the limitations of budget data, it was critical to bring together spending data with qualitative accounts of change, to understand this process of change from the perspective of those making the decisions. Alongside the detailed financial data analysed by ESRO researchers in the eight local authorities, interviews were conducted with a range of officers. To enable interviewees to speak candidly and openly about the challenges and opportunities presented by the current situation, we also guaranteed all participating local authorities anonymity. The research was guided by the following areas of inquiry:
• Which service areas within children’s services were most affected by revenue spending reductions and which were protected?
• How did local authorities develop and implement their strategies, and to what extent were they based on analysis of family needs and the effectiveness of existing provision?
• Were local authorities able to find ways of ‘innovating in austerity’?• What was the interaction between national policy agendas and
developments locally?• What were the potential implications of these changes for different groups
of families now and in the years to come?
At the outset of this project it rapidly became clear that one of the defining characteristics of the period studied was the sheer pace of change, as budget constraints collided with new policy pressures and rising demand among local populations. In terms of determining the shape of future provision, it therefore seems likely that these years will come to represent a key chapter in the recent history of local services provision to children and families. However, this period of upheaval may only mark the beginning of the next era – this report makes clear that the most painful cuts to front line services could be still to come.
We at the Family and Parenting Institute are extremely grateful to all the participating local authorities and officers who agreed to be interviewed for the project. We hope that the insights contained in this report will be of practical use for those who have further difficult decisions to make about how best to deliver for families in austerity.

7
FAMILIES ON THE FRONT LINE? LOCAL SPENDING ON CHILDREN’S SERVICES IN AUSTERITY
Summary of research findingsThis research sought to understand the impact of revenue spending cuts on Children’s Services across eight different local authorities in England. Researchers examined publicly available accounts and analysed spending fluctuations across two budget cycles: the financial years of 2011–12 and 2012–13. To allow for comparison, spending reductions and growths were categorised in eight, broad service areas. Interviews were also conducted with officers responsible for strategy and service delivery in each council. These interviews provided valuable information about the context for and rationale behind spending decisions as well as providing officer perceptions of the impact on front-line services.
Chapter 1: Funding and policy contextThe research takes into account that these spending reductions follow an extended period of spending growth in the sector, derived in particular from specific grants from central government. It also emphasises that cuts to Children’s Services spending are being managed in the context of significant other pressures and shifts in policy. These include the Academies agenda being led by the Department for Education, the Troubled Families initiative pursued by the Department for Communities and Local Government and expectations that councils should improve their performance in child protection and early intervention. All these agendas have implications for council priorities, what type of services they deliver and where difficult decisions need to be made.
Chapter 2: Data findings The research highlighted the extent to which spending cuts were ‘front-loaded’ in the first year of the spending review period. For these eight councils, the total value of spending reductions in year one of the study was more than double that of year two. Although there was some spending growth in certain service areas as councils sought to meet growing demand or directed funds towards ‘invest to save’ initiatives, it was far outweighed by savings. Savings totalled £112m, while growth was just £32m across the eight councils involved. Spending growth and spending reductions are discussed in Chapter 3 of the report.
Chapter 3: The story of cutsSpending cuts were not evenly spread across service areas:
Services provided to schools – such as school improvement, curriculum support, education welfare, behaviour support, school transport, etc. – bore the greatest burden of cuts. Out of every pound cut from children’s services

8
SUMMARY OF RESEARCH FINDINGS
budgets, 30p was taken from services to schools. This reflects broader national policy and legislative changes related to the Academies programme. These changes have led to a reduction in the proportion of education funding that is held by local authorities as opposed to that held by individual schools. In response, the local authorities in our study had reduced the services they offer to schools, and/or had begun to sell them to schools to achieve cost recovery.
Services designed to help and support children, young people and families below the threshold of social work and statutory intervention also shouldered a large share of the cuts. These services – which include the provision of youth centres and family and parenting support – were particularly adversely affected by the loss or reduction of grant funding. Many of the Early Years services commonly associated with the principle and practice of early intervention, including children’s centres, also suffered significant cuts, despite government rhetoric on the importance of early help. The universal elements of these services, in particular, appear to have been badly hit as councils seek to save money by targeting services at those with additional needs or most at risk of negative outcomes. The closure of youth centres was another visible symbol of this trend – although, in the councils we studied, perhaps fewer youth centres and children’s centres had closed than many might have feared given the scale of the cuts.
Social work services and services for children with special educational needs (SEN) appeared, from the data in this study, to have been shielded from the worst of the cuts. Certain targeted spending reductions had taken place in these service areas, particularly spending on independent fostering agencies (IFAs) and cost-efficiencies in social work practice. But these savings were largely counter-balanced by spending growth. This growth was largely attributed to increased demand being placed on social work and SEN services; an early warning, perhaps, of escalating levels of need in a time of economic stagnation. This demand-led growth, of course, means that in practice more money had to be saved elsewhere.
Chapter 4: An era of innovation and resourcefulness?The research also indicated, however, that in many councils, austerity had been met by a certain determination and desire to innovate: determination to continue delivering high-quality services, and attempts to find new ways of meeting families’ needs for less money. Some officers suggested that these new, less costly services could even be more effective than those they replaced.
The research found numerous examples of such efforts across the service spectrum:
• Static youth work being replaced by mobile youth provision or targeted outreach work aimed those who would benefit most.
• Children’s centres operating a ‘hub and spoke’ model, whereby integrated services remained available across localities, but centre opening hours and sessions were rationalised according to need.
• Councils testing innovative approaches to delivering services to schools including: joint ventures, trading arrangements and formal partnerships.

FAMILIES ON THE FRONT LINE? LOCAL SPENDING ON CHILDREN’S SERVICES IN AUSTERITY
9
• Making better use of staff and community members with specialist skills, in order to add value to existing service delivery. Examples included community fostering and peer-to-peer mentoring.
Furthermore, one of the defining features of this ‘age of austerity’ for children’s services is that it has provided the impetus for many councils to join-up and integrate different services more closely than ever before. It would appear that councils are increasingly switching to models of the ‘Team around the Family’, where support is drawn from a range of different professionals and coordinated by a single, lead practitioner. It was felt that models like this have the potential to be less complex and more effective in supporting families, while relieving councils of significant overheads and operational costs.
In the case of the councils studied for this research, it was found that these structural changes in the ways children’s services are joined up and delivered are taking place in tandem with, not as a consequence of, the Troubled Families initiative launched by central government. Indeed, many of the officers we spoke to suggested that while efforts to integrate and realign children’s services may have been bolstered by this agenda, the desire to improve the council’s capacity to provide early help to children and families existed before the Troubled Families programme was initiated.
Structural changes in service delivery were also often matched, officers told us, by significant cultural shifts within Children’s Services departments themselves. More than ever, they argued, those working in children’s services were embracing and operationalising the principles of evidence-based and outcomes-focussed practice.
Our report also acknowledges the efforts the councils made, across the board, in limiting reductions to front-line service delivery. Millions of pounds worth of spending cuts have not simply translated into millions of pounds worth of reductions in front-line service delivery. Councils’ central services – the back offices and support systems – have shouldered a sizeable share of the cuts, and officers expressed a clear preference for rationalising management structures before eroding the front line.
The voluntary sectorThe research did not uncover the existence of consistent policies to either protect or target the voluntary sector in terms of spending cuts. Rather, officers talked in general terms of the need to deliver more with less, and to be resolutely focussed on delivering outcomes and value for money, irrespective of current providers. Nevertheless, alongside the general growth of commissioning as a means of planning and purchasing services, there was some evidence of councils seeking to encourage the participation of small local charities in the delivery of local services – often as part of a consortium with larger voluntary sector partners.
Chapter 5: A look towards the futureWhile for the time being innovation and efficiency measures appear to have deflected some of the most visible reductions in front-line service delivery,
One of the defining features of this ‘age of austerity’ for children’s services is that it has provided the impetus for many councils to join-up and integrate different services more closely than ever before

10
SUMMARY OF RESEARCH FINDINGS
the prospect of making further cuts in the future is likely to pose a far greater challenge. Local authorities may have found large savings early on, but they were the ‘easiest’ cuts to implement. Officers were clear that the future looks bleaker. Going forward, there is little scope for introducing yet more efficiency measures that will not directly impact on the front line or on services for the most vulnerable. And worryingly, the ever-tightening constraints on council finances are taking hold at a time when the scale of the challenge facing local government – both in terms of meeting the needs of local communities and responding to policy pressures – is growing. Councils are being asked to deliver more for families just as the resources available to them are dwindling.

FAMILIES ON THE FRONT LINE? LOCAL SPENDING ON CHILDREN’S SERVICES IN AUSTERITY
11
MethodologyThe study began with the identification of eight local authorities with children’s services responsibilities, selected to achieve a balanced strategic sample along the variables shown below:
English region Local authorities were located across four English regions
Type of community The sample included:• two authorities with predominantly rural and semi-rural
populations• two suburban/outer urban boroughs• four urban areas
Political balance The sample included four authorities with Conservative party majorities, three with Labour party majorities and one with no overall control.
Relative deprivation according to the Indices of Multiple Deprivation
Five authorities in the sample were more deprived than average; three authorities had lower than average levels of deprivation.
Extent of reduction in revenue spending power (Department for Communities and Local Government Local Government Finance Settlement 2011–12)
Three authorities in the sample faced spending reductions in the upper two quartiles, while the remaining five authorities had revenue spending reductions in the lower quartiles.
Data relating to revenue budget savings and growth made in children’s services for 2011–12 were obtained through locally published budget books, revenue budget reports, medium-term financial strategies and/or Cabinet reports. Capital expenditure was excluded from the analysis. Non-children’s services spending appearing in ‘children’s services’ budgets (e.g. in some cases aspects of leisure, libraries, Supporting People, etc.) were eliminated. Budget adjustments were then categorised as shown in the table below. These are intended to be broadly recognisable service types, and while inevitably imperfect, allow some degree of comparison.

12
METHODOLOGY
Social care and looked after children
• Children’s social work (children in need, child protection)• Fostering, adoption, residential care for looked after children, special
guardianship• Local Safeguarding Children’s Boards• Services for children with disabilities or complex health needs
Non-social work services for young people and families
• Youth services, including Connexions, Positive Activities for Young People, youth sports
• Targeted services for young people such as teenage pregnancy services, diversion programmes
• Parenting programmes• Afterschool childcare services
Services to schools • School improvement and curriculum consultants• Behaviour support services• Education welfare• School admissions• Pupil referral units and alternative provision• Home-to-school transport (mainstream)• Costs of academy conversion
Youth Offending • Youth Offending Teams/services for young people with court orders
Special educational needs (SEN)
• Education psychologists• Inclusion and SEN services, statements• Home-to-school transport for children with SEN
Early Years • Childcare services for under-5s• Children’s centres• Early Years consultancy/advisory/support for the private, voluntary and
independent sector
Across-service savings • Training (where not allocated to specific department)• Department-wide personnel savings (e.g. multi-service restructures,
agency staff spend reduction)• Department-wide procurement spend
Non-service-related expenditure
• Top executive posts• Buildings and facilities• Ancillary spend/income, e.g. canteens, car parks• Spend on human resources, finance teams, etc.

FAMILIES ON THE FRONT LINE? LOCAL SPENDING ON CHILDREN’S SERVICES IN AUSTERITY
13
RESEARCHERS LOOKED AT THE SPENDING ON CHILDREN’S SERVICES IN A SAMPLE OF EIGHT LOCAL AUTHORITIES ACROSS ENGLAND
L
Reduction in revenue spending power (2011/12)
Level of social deprivation LAC ratesSizeGeography
HigherLo
wer
Average
L
M
L
L
M
S
M
LAC rates per 10,000 children(and change over 2 years 2009-11)
Urban
KEYType of Council Reduction in revenue
spending power 2011/12Level of social deprivation
Higher than average Below average
Above averageAverage
Lower than average
Rural
Increasing
Decreasing
Suburban
COUNCIL 1
COUNCIL 2
COUNCIL 3
COUNCIL 4
COUNCIL 5
COUNCIL 6
COUNCIL 7
COUNCIL 8

14
Interviews were subsequently undertaken with an average of three to four council officers in seven of those councils (the eighth council responded to questions via email). These officers were in senior managerial/executive roles and represented a broad spectrum of the activities undertaken by Children’s Services departments. Spending data were used as the basis for interviews, with officers asked to clarify figures and describe the background to spending changes (drivers, rationale) and changes in how the service is delivered and how the population is targeted. Where appropriate, officers were also invited to reflect on broader organisational strategy and contextual factors. Interviews also covered known data on service impact and the implications of changes.
By design, the research thus focused on the perspective of council officers themselves, and data presented in this report represents their viewpoints unless otherwise indicated. All interviewees were guaranteed anonymity, thereby affording them the opportunity to speak candidly and honestly about the services and budgets they managed. Wherever possible, data were triangulated with other sources (e.g. published minutes).
Equivalent financial data were gathered for the same councils for the 2012 –13 budget cycle and categorised in the same way, supplemented with further qualitative engagement with the councils. Where necessary, Freedom of Information requests were used to ensure the completion of the growth/spend data acquired.
METHODOLOGY

15
CHAPTER 1
Funding and policy contextThis project was initiated at a time of considerable change and upheaval for children’s services and local government more widely; this section looks at the wider policy and financial context in which decisions about spending on services were being made.
Financial settlement The research for this project took place during a period when council budgets have been significantly reduced: not just the grant funding (which had been the source of so much of the previous decade’s funding increases for councils), but also core funding from central government, a significant proportion of a local authority’s income.
The Local Government Association (LGA) maintains that in the 2010 Spending Review, councils had one of the toughest financial settlements across the whole public sector. Indeed, in the first year of the Spending Review period, government funding of local authorities in the form of Formula Grant decreased by 11.6 per cent.2 In addition, many grants which Children’s Services departments formerly received as discrete funding streams were rolled into the broader Early Intervention Grant – entailing, however, a significant net reduction in the grant income received. The DfE states that there was a reduction of 10.9% in the Early Intervention Grant (EIG) compared to the grants it replaced. However, if other grants are included which were ended and not replaced, such as non frontline schools education services, or which were cut in the coalition’s Emergency Budget, it is possible to argue that there was an even more significant reduction when comparing the EIG with the 2010/11 baseline. The Early Intervention Grant is a small but significant source of funds for a Children’s Services department – for example, in one council studied it amounted to just under 10 per cent.
However, the total reduction in spending power varied between councils, depending not just on the scale of the cutback to their individual Formula Grant from government, but also the relative proportion of their revenues provided by council tax and other sources. This latter proportion varies considerably between authorities, with some drawing on a larger local tax base and therefore being less vulnerable to fluctuations in government grant. The Government introduced a Transition Grant to ensure that no local authority was faced with a spending power reduction of more than 8.8 per cent. Further incentives were also provided to councils to encourage them to refrain from increasing their council tax. Consequently, the average reduction in spending power across local authorities in England for 2011–12 was 4.4 per cent.3
Added together, these cuts have been ‘front-loaded’: that is, larger reductions were made in the first years of the Spending Review period than are planned for the period 2013–15. Cumulatively, central government funding to councils is planned to be reduced by 28 per cent over four years. At the 2010 Spending Review, forecasts for the Government’s funding of councils via the Formula Grant were as follows:

16
CHAPTER 1 – FUNDING AND POLICY CONTEXT
Financial year Formula Grant (£bn)4 % change
2010–11 £28.5
2011–12 £26.1 -8.4
2012–13 £24.4 -6.5
2013–14 £24.2 -0.8
2014–15 £22.9 -5.4
These figures represent a reversal of the trend over the decade leading up to the 2010 Spending Review. Over this period, despite efficiency savings targets of 2.5 per cent (‘Gershon’ savings – 2005–07) and 3 per cent (2007–10) per annum, local government spending grew consistently – increasing by 36 per cent in real terms between 2001–02 and 2006–07 alone, and more moderately thereafter, until 2010 –11.5 Local government spending on social care (including children’s social care) had been growing at an average annual real-terms rate of 5.2 per cent from 2001–02 to 2009 –10.6 Very rapid reductions in council spending are therefore taking place immediately after marked increases over several years.
In one council studied in this research, the overall spending cut for the authority was over £20m for the first year of the cuts and £13m for the second year; savings of less than £10m are required in subsequent years. The cumulative impact of these cuts, though, is that compared to the 2010–11 baseline, the council’s total budget will have been reduced by well over 10 per cent. This of course varies between authorities: one analytical study predicted that the cumulative effect of the cuts for local authorities would be 20 per cent over four years.7 This same study suggested that councils in poorer areas were in fact hit harder by the Government’s spending cuts, observing that:
“...the most deprived local authorities lose systematically the most spending power, especially in the first year, while some affluent areas face only mild cuts initially.”
This is principally because these deprived authorities were more dependent on government grants in the first place. The Government’s Formula Grant works in such a way as to recognise the tax-raising abilities of different councils and thus allocates a greater proportion of funds to those councils with a lower council tax base.
Children’s services budgets: what is known nationally?Excluding the Dedicated Schools Grant, children’s services might typically account for approximately 20 per cent of a council’s spending. Children’s services budgets may, however, have been somewhat protected. Analysis by the Institute of Fiscal Studies showed that social care budgets (including much of children’s services) were relatively protected compared to other service

17
FAMILIES ON THE FRONT LINE? LOCAL SPENDING ON CHILDREN’S SERVICES IN AUSTERITY
areas in the early stages of the cuts.8 In a 2012 survey from The Chartered Institute of Public Finance and Accountancy (CIPFA)9 with responses from 134 Chief Financial Officers, children’s social care and education budgets were among those budgets named as most likely to be protected, alongside capital spending, economic development and housing. In this survey, 44 per cent of councils responded that their children’s social care budget would be likely to increase or stay the same in 2012–13.
Of course, a stable budget or a marginal increase does not mean that the available budget is keeping pace with demand or inflation. Indeed, even a budget with net growth could amount to a cut in real terms due to inflation.
Policy contextFor children’s services, the tough financial settlement coincided with a series of significant external policy influences – meaning that members and senior executives needed to adjust services to align with new legislation and focuses of public interest, as well as downsize to fit a new financial envelope.
The Academies Act 2010 paved the way for the conversion of a large number of schools to academy status, affording individual schools greater autonomy from the local authority. More than 1,000 schools became academies in the space of one year in 2011 and, at the time of writing, 45 per cent of all maintained secondary schools had already obtained academy status or were in the pipeline to convert.10
Alongside the secession of schools from local authorities to become academies, the Education Act of 2011 removed local authorities’ duty to appoint a School Improvement Partner for each school within its borough. In effect, this significantly reduced councils’ role in education at primary and secondary levels. This is consistent with the vision articulated in the 2011 Schools White Paper, The importance of teaching,11 whereby school improvement is to be led by schools themselves, not by top-down initiatives or local authority intervention. Accordingly, much government funding for the activities undertaken by local authorities within schools – such as curriculum consultancy and school improvement – was axed with the removal of the Area Based Grant.
Beyond education, the work of children’s services has been the focus of further public and media interest following high-profile national reviews and developments. In January 2011 the report by Graham Allen MP, entitled Early intervention: the next steps, made the case for, among other things, the rebalancing of a “culture of ‘late reaction’ to social problems towards an “Early Intervention culture” and improvement of skills in the Early Years (0–5) workforce. The review also called for a more explicit focus on evidence-based practice rather than unevaluated programmes.
In May of the same year, Professor Eileen Munro published her report into the effectiveness of the social care system for children. Among her recommendations, which were of great importance to local authorities, was an insistence on a cultural shift from a system beset with bureaucratic burdens to one much freer of central prescription and better equipped to meet local need. Professor Munro’s review called for greater freedoms for social workers

18
CHAPTER 1 – FUNDING AND POLICY CONTEXT
Localism
POLITICAL AND POLICY PRESSURES
DIMINISHING FINANCIAL RESOURCES
RISING DEMAND
Troubled Families agenda
Graham Allen Review and early intervention agenda
Eileen Munro Review of child protection
Political and publicopposition to local cuts and closures
Media spotlight on Child Protection
LOCAL AUTHORITIES ARE DELIVERING CHILDREN’S SERVICES IN A CHALLENGING CONTEXT
TOWN HALL
Rising demand for local adult social care services
Pressure on household incomes escalating need amongst local families
Increased referrals into care creating pressure on
LAC services
£
££ ££
££ £££
£££ £ £
£
££
£
££
£
£
£
£
£
£
Reductions to Formula Grant
Net reduction of support via new
Early Intervention grant
Loss of funding associated with schools’ conversion
to Academy status

19
to exercise professional judgement, while also making the case for radically improving the knowledge and skills of social work professionals, supported by systems of regular case review as normal practice. At the same time, the ability of the sector to adequately fulfil its child protection duties has been brought under intense public and media scrutiny by tragic cases such as that of Baby Peter in north London.
Picking up on the work of Graham Allen MP, Professor Munro’s review also recommended a statutory duty for local authorities to secure sufficient early help for children, young people and families that services can be provided before needs escalate to meet the criteria of social care services.
The case for early intervention became a focus of public attention following the riots that took place in several English cities in the summer of 2011. Questions were asked throughout media and political circles about the supposed failure of public services to prevent social breakdown of this nature. Political debate also focused on families, with Prime Minister David Cameron concluding:
“if we want to have any hope of mending our broken society, family and parenting is where we’ve got to start”.12
The Government responded with the creation of the dedicated Troubled Families Unit, which set about constructing a mechanism of working with local authorities to identify and support some 120,000 families in Britain most in need of help (i.e. meeting centrally defined ‘troubled families’ criteria covering anti-social behaviour and crime, truancy and worklessness). The model is predicated, to an extent, on a payment-by-results principle, and at the time of writing, local councils were in the process of configuring their individual approaches to working with the families meeting the Government’s criteria in their area. While criteria and funding models are centrally determined, actual approaches to supporting these families are perhaps more consistent with the Government’s ‘localism’ agenda, with councils free to develop their own models of help and intervention.
But while early intervention has become a policy focus, pressure on councils to perform impeccably when it comes to the highest need, most complex and most dangerous cases remains as strong as ever. Harrowing cases like that of Victoria Climbié and Baby Peter have focused public attention on the services designed to help before a crisis point is reached and on the role of councils in intervening when children and young people are already at serious risk of harm. In 2009, the Southwark Judgement clarified local authorities’ duties to accommodate homeless 16 and 17-year-olds – placing further strain on some local budgets.
Spending cuts, the academies reforms, early intervention, Baby P, Munro, the riots, localism, Troubled Families: this research was engaging with local authorities, therefore, at a time when they were facing spending cuts of a magnitude not seen for many years, as well as a paradigm shift in the policy landscape. Council officers interviewed were presiding over decreasing budgets – yet were also being positioned at the centre of government ambitions to mend a ‘broken’ society.
FAMILIES ON THE FRONT LINE? LOCAL SPENDING ON CHILDREN’S SERVICES IN AUSTERITY

20
Data findingsThis section describes the financial position of the eight councils included in the study and serves as a point of reference for the discussion, analysis and qualitative insights in Chapters 3, 4 and 5.
The scale of budget fluctuations
Figure 1: Total budget growth and reductions across all local authorities
2011–12 2012–13
Budget growth (£000s) 19,794 12,372
Budget reductions (£000s) (79,548) (32,206)
Net change (£000s) (59,754) (19,834)
Children’s services budgets are commonly made up of many different budget lines. From year to year, some will go up (growth) to pay for increased demand, new services or expanded services, while others will go down (savings) to enable spending reductions to be made. The total actual budget growth in the local authorities studied over the two financial years was £32.166m, against total savings of £111.754m. There was a net reduction to the budgets, therefore, of £79.588m.
The net reduction across the eight local authorities for 2011–12, at £59.8m, was higher than the net reduction for 2012–13, at £19.8m. This trend of greater net reductions in 2011–12 is evident across six of the eight authorities studied; in the remaining two, more significant net reductions were made to budgets in 2012–13 than in the preceding year. In one authority, there was nominal net budget growth.
Across the 8 councils we studied, there was an average Children’s Services budget reduction for 2011–12 of 9.8 per cent. This figure is slightly lower, but broadly comparable, to a figure of 13 per cent identified by Children and Young People Now magazine in 201113 following a wider survey of directors of children’s services. The average reduction in 2012/13 was lower (6.2 per cent), perhaps reflecting the kind of ‘slowdown’ in cuts cautiously predicted by the NSPCC,14 and correlating with what we describe above as the ‘front loading of cuts’. Over the two year period, the cumulative average budget reduction was 15.3 per cent.
These figures on the reductions in overall Children’s Services budgets should be treated with some caution however. The range of budget reductions across the different councils was large (from 2.8 per cent to 14.2 per cent in 2011–12). And even if the range had been narrow, figures from different councils are rarely comparable due to the differing structures and scopes
CHAPTER 2

FAMILIES ON THE FRONT LINE? LOCAL SPENDING ON CHILDREN’S SERVICES IN AUSTERITY
21
-40 -30-60 -50 -20 -10
Reductions:-£32.2m
SAVINGS IN CHILDREN’S SERVICES WERE FRONTLOADED: SPENDING REDUCTIONS IN YEAR ONE WERE
MORE THAN DOUBLE THAT OF YEAR TWO
Note: Children's Services budgets are made up of many different budget lines. From year to year, some go up (growth), while others go down (reductions).
2011/12 2012/13
0 10 20 30 40 50 60
Net change: -£59.8m Net change: -£19.8m
Growth: £19.8m Growth: £12.4m
0 10 20-40 -30-60 -50 -20 -10 30 40 50 60
Reductions: -£79.5m

22
CHAPTER 2 – DATA FINDINGS
of different Children’s Services departments. Furthermore, department-wide budget reduction figures alone reveal little about impacts on services. In much of this report we focus instead on individual service areas and the share of budget cuts they have had to shoulder. This allows us to see which areas have been protected from the cuts and which have been more exposed, and thereby compare the different strategies councils have employed when looking for savings.
Where have budgets been reduced?
Figure 2: Average share of total children’s services savings made by
individual service areas
Service area Indicative proportion of children’s services budget as at 2011
Average share of savings in 2011–12
Average share of savings in 2012–13
Services to schools 20–30% 30% 15%
Social work and looked after children
35–50% 21% 22%
Non-social work services for children, young people and families
15–30% 17% 23%
Across-service savings N/A 6% 15%
Non-service-related savings 0–10% 12% 8%
Early Years 5–15% 9% 14%
Special educational needs 10–25% 3% 2%
Youth Offending 0–5% 3% 1%
Figure 2 illustrates the share of savings made by each service area over all eight local authorities. In 2011–12, on average, councils made the largest proportion of their savings – 30 per cent – in services to schools, followed by social work and looked after children (LAC), and non-social work services for children and young people. Savings made across the service and savings that do not relate directly to service delivery together accounted for 18 per cent of all savings, on average. In 2012–13, on average, councils made the largest proportion of their savings in non-social work services for children and young people, followed by social work and LAC and services to schools. However, social care and services for LAC commonly account for the largest component of children’s services spending. Special educational needs (SEN) and Youth Offending accounted for the smallest proportion of savings in both financial cycles; in the case of Youth Offending, these services commonly only account for a small proportion of budgets.

FAMILIES ON THE FRONT LINE? LOCAL SPENDING ON CHILDREN’S SERVICES IN AUSTERITY
23
Figure 3: Net budget change over two financial years
Service area Indicative proportion of children’s services budget as at 2011
Net budget change across all eight councils (£000s)
Service budget reduction as a proportion of total budget reduction (net) across all eight councils
Services to schools 20–30% -30,861 38.8%
Non social work services for children, young people and families
15–30% -15,709 19.7%
Non-service-related spending
0–10% -11,695 14.7%
Early Years 5–15% -10,930 13.7%
Across-service savings N/A -9,594 12.1%
Youth Offending 0–5% -619 0.8%
SEN 10–25% -139 0.2%
Social work and looked after children
35–50% -41 0.1%
Total -79,588
Figure 3 shows that, over the two financial cycles studied, all service areas faced a net reduction in nominal terms. That is, total savings amounted to more than total growth over the years studied in all areas of spending. These figures do not account for price and wage inflation – indeed, the real-terms reduction will be even larger.
Services to schools suffered the largest net reduction, followed by non-social work services for children, young people and families. Non-service-related spending saw large reductions, particularly given that this accounts for a relatively small proportion of spending.
Figure 3 also shows that the net reduction in spending in social work and LAC and SEN was particularly small. Although considerable savings were made in social work services across the eight local authorities (as shown in Figure 2), these reductions were largely offset by budget growth. On page 25 Figure 4 shows the share of total budget growth across all eight authorities in each area of spending.

24
CHAPTER 2 – DATA FINDINGS
More exposed to cuts More shielded from cuts
0%
50%
43%
23%
16% 14%
1%0% 0%
20%
30%
40%
10%
Non-service related
spending
Non-social work services for families and young people
Youth Offending
Social work & LAC
Services to schools SENEarly years
• School improvement and curriculum consultants• Behaviour support services• Education Welfare• School admissions• Pupil Referral Unit and alternative provision• Home-to-school transport (mainstream)• Costs of academy conversion
• Youth Offending Teams/ Services for young people with court orders
• Children’s social work (children in need, child protection)• Fostering, adoption, residential care for looked after children, special guardianship• Local Safeguarding Children’s Boards• Services for children with disabilities or complex health needs
• Youth services, including Connexions, Positive Activities for Young People, youth sports• Targeted services for young people such as teenage pregnancy, diversion programmes• Parenting programmes• Afterschool childcare services
• Education psychologists• Inclusion and SEN services, statements• Home-to-school transport for children with SEN
• Childcare services for under-5s• Children’s centres• Early Years consultancy/ advisory/support for the private, voluntary and independent sector
• Top executive posts• Buildings and facilities• Ancillary spend/income, e.g. canteens, car parks• Spend on human resources, finance teams, etc.
Share of savings (net)
Approximate share of children services budget
NOTES:
• All service areas were required to find somemeasure of efficiency savings. However in someservice areas, savings were offset by demand-ledgrowth in spending.
• The figures for 'share of budget' are an approximation, based on this sample of council budgets. In practice this proportion will vary considerably between councils.
• Savings made in the ‘across-service’ category (which includes spending across categories in areas such as training and procurement budgets)have been excluded from this graph.
KEY:
THE REDUCTIONS TO CHILDREN’S SERVICES BUDGETS HAVE NOT BEEN APPLIED UNIFORMLY
ACROSS DIFFERENT SERVICE AREAS

FAMILIES ON THE FRONT LINE? LOCAL SPENDING ON CHILDREN’S SERVICES IN AUSTERITY
25
Figure 4: Average share of budget growth attributed to different service areas
across eight authorities
Service area Indicative proportion of children’s services budget as at 2011
Average share of growth in 2011–12
Average share of growth in 2012–13
Social work and LAC 35–50% 66% 56%
Services to schools 20–30% 15% 13%
Non social work services for children, young people and families
15–30% 10% 12%
SEN 10–25% 8% 6%
Non-service-related spending
0–10% 1% 4%
Early Years 5–15% 0% 5%
Youth Offending 0–5% 0% 4%
Across-service savings N/A 0% 0%
This research would therefore suggest that services to schools and non-social work services for young people have been most adversely affected by recent spending reductions (although in the case of services to schools, some of this budget is ‘transferred’ from the councils to schools themselves). SEN spending and social work and LAC spending have, meanwhile, been relatively protected.
These findings reflect those of other similar studies. For example, 56 per cent of directors of children’s services who responded to the Children and Young People Now 2011 survey15 stated that ‘youth services’ (categorised here as non-social work services) would be among the hardest hit; 40 per cent said that school improvement would also be hit hardest. Youth services, school improvement and Connexions were also top of the list of children’s services most affected by budget reductions in 2011–12 in the Joseph Rowntree Foundation analysis of BBC/CIPFA data.16
It is likely that the real proportion of cuts made in areas of spending that do not relate directly to service delivery – such as office costs, finance, human resources (HR) and other back office overheads – is higher than represented in these figures, as some of these savings are likely to be reported as corporate savings rather than savings in children’s services budgets. Indeed, in the Local Government Association’s 2011 Survey of Finance Directors, ‘central services’ were far more likely to receive a proportionally larger savings target than any other aspect of council spending: 65 per cent of counties and single-tier councils said that their central services were facing proportionally larger cuts, compared to 22 per cent citing services for young people.

26
What kinds of savings have been made?A summary of the types of savings clustered under each category is shown in Figure 5 below. A fuller list of examples is included in Appendix 2.
Figure 5: Summary of the types and nature of savings made in service categories
Service area Examples of savings
Social work and LAC
• Reduced spend on independent fostering agencies (IFAs): delivering more in-house foster care and renegotiating contracts with IFAs
• Reduced spend on services for unaccompanied asylum-seeking children • Reduced social work demand through provision of services at Common
Assessment Framework (CAF) level (early intervention)• Savings in management and business support
Services to schools
• Reduction of school improvement and related activities • Reduction of education welfare service to statutory levels• Charging for services provided to academies to increase income• Ceasing of revenue spend associated with Building Schools for the
Future Programme• Management savings • Changing eligibility for home-to-school transport
Non-social work services for families and young people
• Reduction in universal youth offer, focusing on areas of high need/high risk young people
• Closure or replacement of youth centres• Reduction of universal Connexions Information, Advice and Guidance• Integration of below-the-threshold services (parenting support advisers, family
support workers, outreach officers, youth workers) into locality teams to facilitate early intervention
• Increased targeting of parenting programmes
Early Years • Remodelling of children’s centres, for example hub and spoke model• Recommissioning of children’s centres• Management restructuring in children’s centres• Reduction in spend on training and consultancy for the Early Years private,
voluntary and independent sectors • Increase in charging for local authority nursery provision• Increased income from children’s centres
SEN • Tighter commissioning of SEN placements and transport• SEN pressure management through panel procedures • Review of policy for SEN home-to-school transport to reduce spend• Integration of assessments for SEN and children with disabilities• Reducing statementing levels, employing fewer educational psychologists• Reduction of education psychology to core activity/trading
Across-service savings
• Departmental procurement savings: supplies, services• Department-wide management restructuring programmes/team integration
CHAPTER 2 – DATA FINDINGS

27
Non-service-related spending
• Infrastructure reorganisation and deletion of vacant posts• Executive management restructure/mergers• Savings in back office support and systems• Income from ancillary activities• Premises/accommodation savings• Policy/performance/commissioning team cost reduction• Reduction or restructuring of training budgets
FAMILIES ON THE FRONT LINE? LOCAL SPENDING ON CHILDREN’S SERVICES IN AUSTERITY
28
The story of the cutsChapter 2 described the scope of funding reductions faced by Children’s Services departments. This chapter analyses the reductions in the context of data gathered in interviews with officers from across children’s services. It will consider, in turn, reductions made in education, youth work, family support and parenting, Early Years, social work and services for looked after children. We will consider, too, some of the less ‘visible’ spending reductions that have taken place and explore the implications of spending cuts for the voluntary sector.
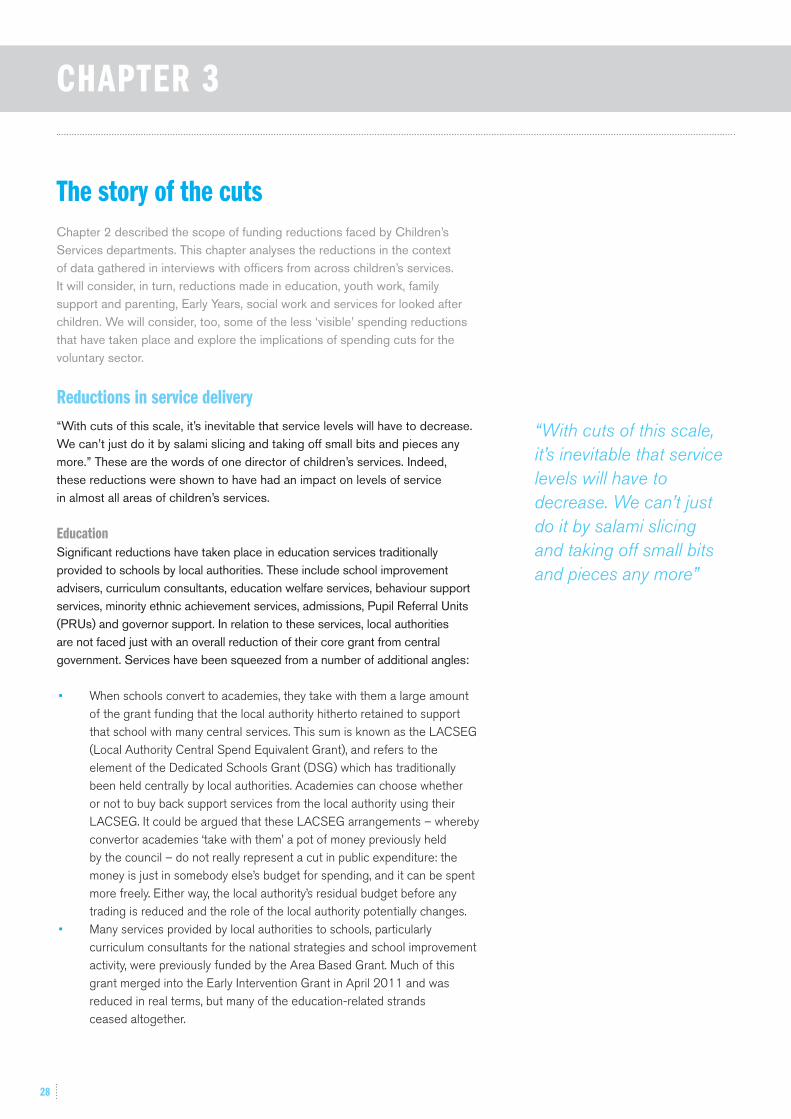
Reductions in service delivery“With cuts of this scale, it’s inevitable that service levels will have to decrease. We can’t just do it by salami slicing and taking off small bits and pieces any more.” These are the words of one director of children’s services. Indeed, these reductions were shown to have had an impact on levels of service in almost all areas of children’s services.
EducationSignificant reductions have taken place in education services traditionally provided to schools by local authorities. These include school improvement advisers, curriculum consultants, education welfare services, behaviour support services, minority ethnic achievement services, admissions, Pupil Referral Units (PRUs) and governor support. In relation to these services, local authorities are not faced just with an overall reduction of their core grant from central government. Services have been squeezed from a number of additional angles:
• When schools convert to academies, they take with them a large amount of the grant funding that the local authority hitherto retained to support that school with many central services. This sum is known as the LACSEG (Local Authority Central Spend Equivalent Grant), and refers to the element of the Dedicated Schools Grant (DSG) which has traditionally been held centrally by local authorities. Academies can choose whether or not to buy back support services from the local authority using their LACSEG. It could be argued that these LACSEG arrangements – whereby convertor academies ‘take with them’ a pot of money previously held by the council – do not really represent a cut in public expenditure: the money is just in somebody else’s budget for spending, and it can be spent more freely. Either way, the local authority’s residual budget before any trading is reduced and the role of the local authority potentially changes.
• Many services provided by local authorities to schools, particularly curriculum consultants for the national strategies and school improvement activity, were previously funded by the Area Based Grant. Much of this grant merged into the Early Intervention Grant in April 2011 and was reduced in real terms, but many of the education-related strands ceased altogether.
CHAPTER 3
“With cuts of this scale, it’s inevitable that service levels will have to decrease. We can’t just do it by salami slicing and taking off small bits and pieces any more”

FAMILIES ON THE FRONT LINE? LOCAL SPENDING ON CHILDREN’S SERVICES IN AUSTERITY
29
• The Education Act 2011 reduced the statutory role of local authorities in school improvement and other areas.
Officers interviewed described the dramatic changes taking place in these services. In one council, school improvement budgets were slashed by more than a third. Another council, despite shielding front-line school improvement activity as much as possible through dramatic reductions in premises and management spend, reduced its school improvement activity to only the very weakest schools; significantly fewer visits are therefore taking place. Other officers reported having almost completely phased out their curriculum consultants for the national strategies as a result of the deletion of the Area Based Grant.
As a means of sustaining services, many authorities have instituted trading arrangements of various types in order to sell school improvement services to schools – in particular to academies. New vehicles – including joint ventures with private companies and merged entities with neighbouring local authorities – are being developed as a means of maintaining the local authority’s service provision in schools in an era where the money has essentially changed hands. While some senior education officers report that such trading arrangements have been successful, with local schools choosing to buy back services from the council, this success has not been universal. In some areas, school improvement and related services are simply not being bought: “Retired headteachers, or ex-local authority advisers now working as freelance consultants, are up to 50 per cent cheaper.” explained one officer.
Cuts have not only been felt on the school improvement side of local education departments. In one council, a senior officer reported that the local Schools Forum – the body representing local headteachers and responsible for determining the proportion of school (DSG) funding the authority can keep to provide central services – had decided to cease funding for local minority ethnic achievement and English as an additional language (EAL) specialist support services – previously a prized and cherished team in the local area with high numbers of children from refugee families, traveller families and minorities with a first language other than English. A similar fate befell the Behaviour Management Team in another authority, where demand for the service from local academies was so low that the service was commercially unviable.
Meanwhile, education welfare services have faced their share of reductions too. “We used to offer a more sophisticated service to schools and families. Now, we can only afford to do the bare minimum in terms of making sure local kids are attending school.” The story of a rationalisation of education welfare officer activity further and further towards the statutory minimum of dealing with the most serious cases was told in more than one local authority visited.
Some senior officers in local government expressed concern at the disintegration of these services to schools, principally for two reasons:
• The loss of assets and levers to influence standards in education as a consequence of ‘academisation’ and grant reduction: “We are being
“We used to offer a more sophisticated service to schools and families. Now, we can only afford to do the bare minimum in terms of making sure local kids are attending school”

30
CHAPTER 3 – THE STORY OF THE CUTS
asset-stripped,” explained one Director of Education, “and our capacity to have leverage is reducing. Previously sacrosanct budgets like education welfare are being stripped out.” “It’s harder to maintain intelligence of what is going on in local schools if you don’t have the people going out and doing visits”, reported another. Furthermore, academies are not required to share their data with local authorities in the same way as traditional schools. The ability of local authorities to contribute to school improvement efforts is thus arguably weakened. Of course, this school improvement activity may or may not be being undertaken more than adequately elsewhere by other parties commissioned by schools themselves.
• The lack of viability of services to support remaining schools: As more schools become academies and take with them their LACSEG funding, so the future looks more difficult for the services provided by the council to remaining local authority schools. “It becomes increasingly difficult for us to provide any services at all, as we lose economies of scale and the model just stops being sustainable”, explained a senior officer responsible for school improvement and education welfare. A further area of concern for senior officers was Pupil Referral Units, demand for which risks increasing considerably if local academies choose to exclude larger numbers of pupils (which they have the right to do).
Debates about whether the conversion of increasing numbers of schools to academies adds choice and diversity or threatens accountability perhaps stray too far from the focus of this research, which is concerned chiefly with local authority services, their viability and vitality. Nevertheless, evidence from interviews with officers suggests that the funding changes and cuts have coincided with the Education Act 2011 to result in significant changes – and in many cases reductions – to the services that elected authorities provide to local schools.
Home-to-school transport is another local authority service that has suffered as a result of funding reductions. More than one local authority studied was reducing eligibility for transport to school for pupils starting Year 7 so that pupils in faith, grammar and other selective schools were no longer entitled to free transport. This had been particularly controversial in one authority with a significant rural school population.
Youth work“If services to the most needy and most vulnerable – i.e. social work – are to be protected in the cuts, then something has to give.” Here, a director of social services and early intervention explains the logic behind the local decision to cut services below the social work threshold – services like youth work, parenting and family support.
As shown in Figure 2, these services have faced a significant proportion of local authority reductions. One local authority made a cut of 10 per cent in its services to young people in one year; its universal offer of Connexions services was the most significant target for reductions. A senior commissioner in another authority facing a savings target of more than £3m in youth services
“If services to the most needy and most vulnerable – i.e. social work – are to be protected in the cuts, then something has to give”
FAMILIES ON THE FRONT LINE? LOCAL SPENDING ON CHILDREN’S SERVICES IN AUSTERITY
31
alone explained that councillors there had opted to withdraw from universal provision altogether, in order that this service be delivered more cheaply on a localised basis. Another officer explained that a locally developed, intensive youth support programme designed to help young people get into employment, education or training had faced the axe as the council rationalised its offer for young people, keen to reduce duplication with other services such as Connexions. A number of youth centres in the area have also been closed. In this council, the relevant members’ scrutiny panel for Children and Young People’s Services had actually declined to approve the closure of these centres – but the closures went ahead nevertheless. This demonstrates at least the controversy surrounding these decisions – if not the reluctance with which councillors made the call to stop funding centre-based provision. Indeed, all the eight local authorities included were making significant inroads into spend on youth services, with common features such as:
• reduction in Connexions services at universal level and/or the trading of this service with schools (with an associated income target)
• reduction in universal youth provision such as youth clubs, including closure of some youth clubs
• radical approaches to recommissioning of more targeted outcomes-led youth services in the voluntary sector as opposed to in-house delivery.
One officer commented that these quite significant cuts have been more politically acceptable now than they would have been only a few years ago. The sheer number and scale of broader cutbacks mean that individual service reductions assume less prominence and attract less attention: “The broader corporate programme had lots of other big-ticket items, which took the heat off the youth service changes.”
Family support and parentingOther services designed to meet children’s, young people’s and families’ needs below the social work threshold have also suffered in the cuts, despite ubiquitous rhetoric of the importance of early intervention. One senior officer reported that the number of parenting support advisers in local schools had decreased by more than a third, with schools claiming that loss of funding was the cause (a point disputed by the council officer, who insisted that funding streams were intact). Nevertheless, the number of Common Assessment Frameworks (CAFs) – assessments of lower level or emerging needs, commonly completed by parenting support advisers – in the local authority have now declined by almost a third, potentially indicating a reduced ability to identify needs in families across the community. In another authority, a deprived urban area, the previous trend of increasing CAF levels is now beginning to slow and potentially reverse: officers say the cause may be the halving of the size of the central CAF coordination team, or the fact that the council now has 35 per cent fewer family support workers around the city.
Parenting, too, has been a target of budget reductions, principally taking the form of targeting of provision and attempting to make better use of

32
CHAPTER 3 – THE STORY OF THE CUTS
reduced resources. One council, where parenting budgets are under particular pressure, is reviewing which courses it offers: until now, universal courses have been well attended, while the council and its partners struggled to fill places on the targeted programme (although those attending universal programmes generally had additional needs). Outreach work to identify families who could benefit from the provision has also had to be reduced, and the council is having to rely on a virtual network of parents online to spread the word. From now on, fewer programmes will be run, but parents are encouraged to attend a taster session before committing to the programme. A compounding problem, though, has been the council’s difficulty in finding facilitators to deliver the courses, as partner agencies such as health authorities have also faced staff cutbacks. “For now, we’re just muddling through and doing as best we can, Sometimes we have to buy in facilitators,” explained the manager in charge.
Another authority facing cuts of 10 per cent to its parenting budget in 2012–13, had undertaken a wide-ranging audit of parenting across the Children’s Trust, looking at who had received training and which courses were proving more successful. To safeguard the availability of staffing resources for parenting, the deployment of skills across the workforce is now being more tightly managed: all those who have received training now have a commitment to actually deliver programmes.
Early YearsDespite the introduction of the Early Intervention Grant, services for the youngest children and their families have not been shielded from cutbacks. This is largely because the Early Intervention Grant was worth less than the sum total of the grants it replaced, including the General Sure Start Grant: in one of the local authorities involved in this study, the total reduction in these grants was equal to more than 20 per cent, and the council chose to balance this loss by cutting services elsewhere.
This demonstrates the high priority often accorded to Early Years services. Indeed, officers frequently described the efforts undertaken to preserve front-line delivery in the face of spending cuts, partly because local members are often keen to keep children’s centres open. National research published by the Daycare Trust and 4Children in January 2011 found that 7 per cent of children’s centres were closing or expected to close, while 56 per cent would provide a reduced service and 86 per cent were facing budget cuts of some sort.17
Data from this research are very much in line with these national headlines. Budget data show considerable savings in Early Years management, with one operational manager now frequently covering several children’s centres in more than one of the local authorities studied, as well as the thinning out of strategic Early Years management, savings to the graduate leader fund and in consultancy and training services provided by councils to the private, voluntary and independent sectors.
Income targets for children’s centres have also been increased in some instances, with the temporary appointment of centre development managers to

FAMILIES ON THE FRONT LINE? LOCAL SPENDING ON CHILDREN’S SERVICES IN AUSTERITY
33
TOWN HALL
YOUTH BUS
Passporting funds to local partners and organisations to deliver a universal youth offer tailored according to characteristics of different communities
Community Fostering: supporting struggling families through help, advice and mentoring from experienced foster carers in a peer-to-peer model, rather than sending in social workers or other Council employees
Mobile youth provision in targeted areas to replace static youth centres which were not necessarily well located or well attended
LOCAL AUTHORITIES USED DIFFERENT STRATEGIES WHEN MAKING COST SAVINGS, AVOIDING DIRECT CUTS TO SERVICE
PROVISION WHERE POSSIBLE
CHILDREN’S CENTRE
Early intervention school improvement service: a traded service with schools which intervenes when schools show initial signs of weakness – rather than waiting until problems become entrenched
Hub and spoke model for Children’s Centres – core centres provide full service, locality satellite centres provide reduced targeted services – but all centres remain open
Early intervention maternity services developed in partnership with the local NHS to provide antenatal and postnatal support packages to mothers with additional needs and prevent emergence of costly problems in early years
Management restructure – e.g. reducing number of executive directors; 15% management cost reduction across the board, etc
Savings in ICT by merging children’s services ICT team with wider council team
Sharing managers with other local authorities
Renegotiating contracts with independent fostering agencies or growing the pool of local authority foster carers
Merging preventative function with other targeted youth work to eliminate duplication
Developing new services for families who had been repeatedly referred to social services but whose needs fell below existing thresholds, so that their problems did not become crises
SCHOOL
Transforming SEN services so that schools can meet lower level special educational needs themselves without undergoing costly and bureaucratic council processes

34
CHAPTER 3 – THE STORY OF THE CUTS
maximise potential revenue from those who can afford to pay. Finally, two of the local authorities involved in the study have increased charges for their in-house nursery provision to bring charges closer to true-cost recovery, essentially reducing if not ending the council’s subsidy of childcare for those residents who have the means to fund this themselves. Measures such as these meant that in one council, while Early Years as a whole faced a 15 per cent cut in one year, children’s centre budgets had to make cutbacks of only 10 per cent. One described increased income targets for children’s centres, which would be achieved by attracting more paying service users and introducing a new charging structure.
Only in one council spoken to had the cuts to Early Years budgets led to the closure of a children’s centre – and in this case, it concerned an underused and inefficient centre which had long been earmarked for closure; services and staff were transferred to another centre nearby, releasing savings on premises costs. In one council facing a 10 per cent cut in children’s centre budgets, the savings were made by management rationalisation (in both in-house centres and those delivered by voluntary sector partners), reducing the number of staff in each session, and adjusting the preparation time allocated for each session. In some instances, this has meant changing the frequency and length of sessions to accommodate an operating model that optimises preparation and delivery time.
Meanwhile, a council with a more substantial 35 per cent cut to children’s centre budgets has operationalised a ‘hub and spoke’ model of children’s centre delivery – with a core of main centres and a number of smaller delivery hubs. Some centres, therefore, deliver fewer sessions but coverage is retained across the whole local authority area with no centres facing closure.
Another council is directing its children’s centre funding reductions at those centres run by local schools, where it is argued that not all the earmarked funding was being used for centre costs in the first place. In a fifth council, all Early Years operational managers across settings, centres and, crucially, sectors, signed up to three binding principles – protecting the front line, treating all sectors equally, and minimising job losses – and were then free to make their reductions however they saw fit according to local circumstances.
These service reductions taking place across youth work, parenting, family support and Early Years perhaps appear concerning at a time when politicians and professionals are calling for a focus on early help, identifying needs quickly, and intervening with families before problems become crises.
Social work and looked after children Social work services and services for looked after children (LAC) have been subjected to a relatively smaller proportion of cuts, given that they commonly account for the largest proportion of children’s services spending. However, to say that these high-end statutory services have been entirely immune from spending reductions would be inaccurate: officers reported that carefully considered savings have been made in these departments, too, where the opportunities allow. Core social work budgets have, though, remained more

FAMILIES ON THE FRONT LINE? LOCAL SPENDING ON CHILDREN’S SERVICES IN AUSTERITY
35
or less intact: in none of the local authorities involved in this study were there significant reductions in social work teams or child protection capacity.
In one local authority, a reduction in the number of incoming unaccompanied asylum seeking children – and the progression of former service users into adulthood – has led to significant savings in this area. In another council, contingency funding added into the budget in a previous year to allow for a predicted rise in spend on placements for looked after children was once again removed as the forecasted increase in need did not materialise. A third council recognised that its contact services for looked after children and their parents were more generous than statute required, and have thus been trimmed back.
Spending less on placements for children through independent fostering agencies tended to reflect not a squeeze on provision of care per se, but a policy to increase the numbers of children cared for by the council’s own pool of foster carers, which can often cost half as much, or a decision to provide enhanced services ‘at the edge of care’. In practice this means spending money on services which support children, young people and families with high or complex needs to help them stay together, rather than spending money on taking a child into local authority care. One officer explained that maintaining support for just six adolescents at the edge of care, as opposed to in local authority care, would save up to £200,000.
However, the maintenance of social work spending does not mean that these services are not facing significant pressures. Many officers representing these services described considerable escalation of need and demand for these services in local communities. Nationally, the number of children in care increased by 7 per cent between 2009 and 2011.18 In one council, there has been a 70 per cent increase in referrals to social work in just 18 months, a trend which has been correlated by local research officers to the rise in claimant count. In the same council, child protection cases have increased by almost 50 per cent, and the number of children in local authority care is also edging upwards. In another authority, the number of children placed in mainstream external foster care has increased by 5 per cent in the last two years. One council reported not just the intensification of needs in communities historically associated with ‘high need’ for social services, but also needs emerging in new and qualitatively different communities: families in more affluent neighbourhoods experiencing problems because parents cannot afford to separate due to inflation, wage stagnation and exorbitant housing costs. One director of children’s services estimated the cost of rising pressures on services as being almost £3 million – which must be funded on top of savings that total more than £20 million over two years. In four of the eight councils involved, new funds were being added to social work budgets to allow for increased demand in fostering, adoption and children’s residential care.

36
CHAPTER 3 – THE STORY OF THE CUTS
Cuts beyond the front line To merely describe the ways in which councils’ services have been reduced, rationalised or closed would not do justice to the millions of pounds of savings that councils involved in the study have made in their back offices and support functions – changes which might be invisible to most families in receipt of council services. Indeed, in two of the councils involved in this study, cuts and service reductions reflected less than 20 per cent of savings across the board. Spending reductions beyond the front line made up a much larger proportion of savings achieved, as did efficiency measures and service redesigns (discussed later in this report).
In one department visited, 25 per cent of all management costs were cut in one year; in another, three directors’ posts were merged into one and the management layers beneath tightened in a similar fashion. In three authorities visited, the post of director of children’s services has been deleted and in two of these has been merged with the director of adult services to create a directorate of ‘Services to People’. In another council, strict new procurement practices are being rolled out with the support of a temporary procurement partner to make large savings in the purchase of supplies, while buildings costs have been slashed by locating the vast majority of office-based staff in a single building.
Post reductions in finance, performance and policy teams were also common, as were reductions in PA support for senior staff. The sharing of senior posts with other councils was also reported by more than one authority. Cutting management is not always easy, though, as one senior commissioning officer explained: in that particular council, middle and senior management had both been cut by over 15 per cent even before the current spending review period.
Saved from the cutsThe survey and analysis of spending cutbacks detailed above should not be assumed as necessarily representative of all councils. In school improvement, for example, one council has kept all its school improvement advisers, as this is what local members, senior officers and the Schools Forum felt was most appropriate. In more than one council, local members had confirmed their determination not to close youth centres and significantly reduce universal youth services, instead making savings by reducing the proportion of services delivered in-house. Another council chose to buck the trend and keep its universal careers advice service because local evidence suggested it continues to perform well: “If it ain’t broke, why fix it?” questioned one officer. In one council, a senior officer suspected that the incoming administration of a different political creed had been keener to protect the entirety of children’s and adults’ services than the incumbent members had been. It was remarked that, “It felt like there has been a bit more protection this year.”
Several of the councils studied had been able to shield certain services, which were seen locally as highly valuable or important, from the cutting of the Area Based Grant. This in effect meant ‘mitigating’ grant reduction
To merely describe the ways in which councils’ services have been reduced, rationalised or closed would not do justice to the millions of pounds of savings that councils involved in the study have made in their back offices and support functions

37
FAMILIES ON THE FRONT LINE? LOCAL SPENDING ON CHILDREN’S SERVICES IN AUSTERITY
by replacing lost grants with funding from the council’s own core budget – i.e. diverting money from other council-funded services to protect aspects of children’s services which otherwise would have been reduced. One council in particular undertook mitigation on a particularly large scale: the total sum of funds redirected to shield services from grant cuts was almost as much as the total savings taken from the budget. In other words, the impact of government cuts was almost halved.
The decline of universalism?The overview of service reductions which have taken place might be summarised as follows:
• efforts to protect the front line where possible• significant changes to and reductions in services provided to schools and
the trading of services with academies• rationalisation of services below the statutory threshold such as youth
work, Connexions, family support and parenting, with a particular focus on the increased targeting of these services
• reductions in Early Years spending involving peripheral spending and the rationalisation of sessions and programmes more than the closure of provision
• less retrenchment in social work and services for looked after children, although specific reductions were made here too.
Do these trends signify that councils are beginning to serve primarily as a provider or commissioner of services for the most vulnerable families in the most deprived communities? Certainly, the role of council services in relation to schools has been diminished, and local education department responsibilities lie more prominently with educating those with the most acute needs. Similarly, youth work is increasingly targeted at the more vulnerable, and the universal element of Connexions is in some places disappearing, while children’s centre sessions in more affluent areas are ceasing in order to allow funding to remain in place for more deprived areas.
On the other hand, the arguments against the hypothesis that councils are losing their universal relevance are perhaps equally strong. On the question of education services, several senior officers in education interviewed in this study argued that with the right policies and strategies, the local authority – keen to resist the fragmentation of the sector and marginalisation of the local education department – can very much remain a key player and contributor despite recent legislative and policy changes. In one authority, this has meant the recasting of school improvement as a service which intervenes not when a school is weak, but when a school shows the first and even smallest signs of weakness. In another area, local maintained schools are keen to resist academy conversion and are forming an association of local authority schools based on shared principles and values, and supported by the local authority as a democratically accountable institution.

38
Another director of education emphasised that there are other ways beyond school improvement advisers of bringing schools into the fold, whether academies or not, such as Early Years work, 13–19 service offers, or early intervention and prevention work. Another senior officer stressed that while many local schools had become academies, the sense of a shared responsibility across all local authority partners was uncontested and the role of the local authority to both champion excellence and challenge performance remained clear.
With respect to other services, such as youth work and parenting, the fading away of universal services is perhaps not the paradigm shift that one might mistake it to be. In one council which is increasingly withdrawing from universal youth provision, a senior officer pointed out that, “More than 80 per cent of local people never used our services anyway – so they weren’t really universal.” In another local authority where universal parenting classes are under threat in terms of their frequency, if not their existence, the officer responsible quickly pointed out that the vast majority of attendees at this programme were from the ‘targeted’ cohort anyway, and that a sensible solution was to offer a parenting programme better suited to these families’ needs.
A service manager for a children’s centre questioned the pertinence of the debate about universalism. While recognising the validity of the ambition to remain universal in provision, this officer emphasised that the challenge has always been to “get the right families through the door”, i.e. the families who would most benefit from the services and help on offer. Regardless of whether we are in an era of universalism, proportional universalism or purely targeted provision, the challenge of reaching out to the ‘right’ families remains as present as ever.
What have these cutbacks meant for the voluntary sector?
Accurately ascertaining whether the voluntary sector has been hit harder or relatively protected from the cuts is a question easier asked than it is answered. To date, analysis of the issue has been limited by the absence of robust, up-to-date data about spending on the voluntary sector both nationally and locally.
In many of the councils studied in this research, it is certainly the case that when the Area Based Grant was cut, many of the kinds of services commonly delivered by voluntary sector organisations were affected: youth work, family support and children’s centres. This reflects the findings outlined in a report by the National Council for Voluntary Youth Services.19 However, these cuts also significantly affected service areas most commonly associated with council in-house provision – such as school improvement.
In an era of austerity, councils are approaching retendering and recommissioning exercises very carefully indeed. This is often a case of wanting to ‘do more with less’. For example, one senior officer described making cuts of nearly 30 per cent to children’s centres, but with an ambition to deliver the same outcomes with almost as many centres and sessions in operation. Commissioners described their expectation that private
CHAPTER 3 – THE STORY OF THE CUTS
Regardless of whether we are in an era of universalism, proportional universalism or purely targeted provision, the challenge of reaching out to the ‘right’ families remains as present as ever

39
and voluntary sector partners make the same sacrifices in management, administration and overheads that councils themselves say they have been making.
There was no evidence in the study of councils having a normative preference for delivering services in the public versus voluntary sector per se. At the present juncture, senior commissioners appeared more concerned about what is being delivered and which outcomes are achieved, than precisely who is delivering the service. In more than one council studied, some services were being brought in-house (in these cases, Connexions and family assessments), while others were being tendered out to other sectors (children’s centres and childcare).
An overall shift towards more commissioning – across youth support, family support, domestic violence and Early Years – rather than councils delivering things in-house could signify in some senses a ‘growth’ agenda for the voluntary sector. During this study, officers described their intentions to commission across a range of services, but particularly youth work and Early Years. Several council officers interviewed described organisational restructures taking place to accommodate a commissioning/provider split within the Children’s Services department, with the aim that the council would be able to commission more robustly – both from its own services and from the marketplace. What this ‘robust’ commissioning might look and feel like is explored in a recent report by the Family Strategic Partnership,20 but is likely to involve competitive tendering, payment by results and different lengths of contract.
Officers interviewed for this project suggested that in future, the specification and monitoring of outcomes is likely to be keener and more business-like. Will this mean that the relationship between council as commissioner and voluntary sector organisation as provider will become increasingly managerial? If so, this could potentially favour the larger charities more accustomed to high-value bids and contracts.
That said, there remains some acknowledgement in the upper echelons of town halls of the value of smaller, grassroots voluntary organisations. Indeed, one council, in a tendering process for its youth services, was actively encouraging greater participation of such charities in service delivery, aware of their ability to understand and meet needs very specific to local communities. As such, the council was welcoming bids from consortiums of small charities and larger voluntary sector partners.
FAMILIES ON THE FRONT LINE? LOCAL SPENDING ON CHILDREN’S SERVICES IN AUSTERITY

40
An era of innovation and resourcefulness?This chapter focuses on strategies adopted to maintain, innovate and improve services despite the challenging financial context. It considers:
• examples of efficiency gains in children’s services• the redesign of services to better align to levels of need• innovative delivery models.
It also considers how spending decisions have been made in the context of different strategic approaches taken by councils to delivering services in the current fiscal climate.
This report began by focusing on inputs into public service and public value in terms of relative levels of spending and cutbacks. But funding is only one part of the equation when considering the effectiveness of a service. Whether or not the service is fit for purpose, the value for money and outcomes it delivers depend not solely on how much is spent on the service or how many staff work in it, but also on:
• whether it is the ‘right’ service in the first place• the level of need that the service is attempting to meet• whether the service is well designed, efficient and well run.
Thus, even the most lavishly funded service might not be fit for purpose or good value for money if it is ill-conceived or delivered with a flawed understanding of the needs it is intending to meet. Similarly, a well-designed and conceived service which delivers to well-understood needs in a given community might be unfit for purpose if the level of provision is inadequate.
The following section discusses the changes that have been taking place in children’s services spending in the light of what officers reported about need, organisational effectiveness and service suitability, as a basis for a more nuanced debate about the funding and delivery of children’s services.
Enhancing efficiency“We have made £1m savings in Connexions since 2011,” reported a senior officer responsible for youth provision. “The workforce has been halved, but to be honest, the universal offer has remained more or less intact. We had some capacity in the system.”
As this example shows, in some cases even quite significant cuts in funding do not necessarily translate into delivery reduction on the front line. Similarly, an officer interviewed in a large council explained that significant reductions had been made in the council’s budget for music services: in terms of point of delivery, little has changed, but new processes, new terms and conditions and new ways of working have drastically reduced costs. This potentially raises
CHAPTER 4

FAMILIES ON THE FRONT LINE? LOCAL SPENDING ON CHILDREN’S SERVICES IN AUSTERITY
41
questions about why ‘unnecessary’ spending was sustained prior to the advent of the current spending review period.
Efficiencies of this nature have been made in specialist services, too. Ostensibly, one council involved in the study appeared to have made large reductions to its Youth Offending service. In reality, it was more a question of streamlining and removing duplication: management is now shared with another Tier 4 service and performance management is undertaken by a central children’s services performance management team. Management across the various Youth Offending teams has been ‘delayered‘ (i.e. fewer tiers and fewer subdivisions of responsibility), and the preventive arm of the service integrated into the council’s targeted youth support team to remove “unnecessary duplication”. Business support savings have also been achieved.
Another council officer described how savings were being made to the looked after children (LAC) placement budget, despite LAC numbers increasing. The council in question had for several years been paying large sums to independent fostering agencies (IFAs). “Our fostering service was a bit neglected. We had dwindling numbers of carers. We became dependent on IFAs – and the IFAs knew how dependent we were on them. In terms of pricing, the tail was wagging the dog.” The pressure of financial cuts, though, has heralded significant changes in terms of how this council manages its fostering budget. On the one hand, more local foster carers are being recruited to enrich the council’s own pool. At the same time, though, efficiencies are achieved through “tougher negotiations with IFAs”: joining other local authorities in the region in these negotiations, the council is achieving “keener pricing and a better focus on outcomes”.
Services to meet needIn one interview, a director of children’s services explained that his council had made “pretty significant cuts in youth services [...] There were issues about quality concerning our own delivery, and local kids wanted something more bespoke. So we’re going to be spending less, but giving them a more bespoke offer, probably involving more, smaller community organisations.” Another officer in the same council commented that several services in the area were previously working towards the same objective. “We – youth offending prevention services, Connexions and the youth service – were all trying to achieve the same thing. You couldn’t put a fag paper between them.” The reduction of services to a core youth offer was, therefore, in the eyes of this officer, not so much a significant cut, as the removal of duplication, even triplication.
In a different council, a senior officer reported that the financial imperatives really helped elected members with the process of reconceptualising youth services as youth support services, a change that reportedly needed to happen. “We have had to fight hard to win the argument that young people with additional needs need the service more than other young people, and that we should focus on early help. As senior decision makers, we’ve really worked at making this reality the orthodox one in such a leafy area, you know,
“Our fostering service was a bit neglected. We had dwindling numbers of carers. We became dependent on IFAs – and the IFAs knew how dependent we were on them. In terms of pricing, the tail was wagging the dog”

42
CHAPTER 4 – AN ERA OF INNOVATION AND RESOURCEFULNESS?
not doing as many golf lessons but helping young people who actually need it and preventing their problems from spiralling into more serious things like youth offending... Previously, we did a lot of work at the universal level, and colleagues in other services did lots at the upper tiers. But the middle – additional and emerging needs – was squeezed, and we didn’t have good services for them. The cuts gave us an opportunity. We had to radically rethink and reshape the system.”
One service manager for education services pointed out that the structure of the service before the cuts was only “accidental” in the first place. “We had a higgledy-piggledy service in school improvement, as a result of the grants system and of random post reduction over the years.” But the service was ill-structured relative to demand: although the local authority in question has five times more primary schools than secondary schools, secondary school improvement advisers far outnumbered their primary school colleagues. For this manager, “the financial imperative was a convenient way of managing change which needed to happen. The budget reductions were helpful in terms of a background against which to develop a rationally based service.” One manager of a school improvement service went as far as to say that “I could have got away with saving less money, but my ability to properly transform services would have been diminished.” For this service manager, the front-loading of the cuts was important and beneficial – providing the platform to make bold strategic moves.
A service manager in inclusion services explained that his special educational needs (SEN) service had been “decimated” by the cuts a year ago. “We used to have an army of staff in a central SEN service.” The manager went on to explain that statementing levels were well above the average, and a culture prevailed in schools whereby recourse to statementing and council services was uncontested. “Vast bureaucratic processes developed and we had death by moderation. You’d have a process costing £9,000, lasting eight or nine months for a support package worth about £2,000.” The manager in question felt that this level of council service was not commensurate with need and that the cuts provided “the opportunity to look at how services were being delivered and make them fit for purpose in terms of what was actually needed and right for young people”.
As a consequence, terms and conditions for some core staff were altered so that they were employed on council, not school contracts, and an increased degree of funding was delegated to schools themselves so that more pupils’ needs could be met within schools. The requirement for the ‘army’ of local authority staff has thus diminished. Of course, such an approach is not without its risks, the manager conceded, but the overall assessment was that “there are fewer assessments and a clearer focus on outcomes, not processes, and we’re not statementing for the sake of it any more”. The officer described these as changes that the department had wanted to make for a while – with the cuts providing the necessary burning platform for action.
Officers described the ways in which social work services, too, are being adjusted more as a way to better align services with needs than to cut outright. One service manager for child protection – where social work is facing a
“The cuts gave us an opportunity. We had to radically rethink and reshape the system”

FAMILIES ON THE FRONT LINE? LOCAL SPENDING ON CHILDREN’S SERVICES IN AUSTERITY
43
savings target of £5m – explained that two-thirds of referrals to social work do not meet thresholds, but that the failure to meet additional needs when they are identified at this point ultimately adds cost to the system as the same families reappear later on, but with their problems in a more advanced and complex state. Investment is therefore being made in evidence-based lower-end interventions and in clearer partnership arrangements with universal settings with the ambition to meet needs earlier and more effectively and thereby release pressure on social work teams. One such example is a programme to work with children’s centres and voluntary organisations to support mothers experiencing domestic violence: these cases would not normally meet social work thresholds and the needs would, under the old system, perhaps not have been adequately met. This can be viewed as the manifestation of ‘early intervention’ principles and their incorporation into service design.
Such accounts of services being dramatically changed or reduced in order to, purportedly, better meet actual need, raise questions as to how that need is identified and quantified in the first place. How in-depth and reliable are these approaches to assessing need?
Understanding ‘need’Interviews demonstrate that councils do not have a single method of identifying need. An Early Years manager described needs analysis as an ongoing process looking at birth rates and trends, data from antenatal services and health visitors, and regular assessment and evaluation of internal management information about access to services. A youth service manager described key needs indicators as truancy levels, not in education, employment or training (NEET) levels, rates of teenage pregnancy, obesity and numbers of warnings issued to minors by the police. Beyond this, trends in terms of service demand “tell you a lot about what young people are looking for, and you can analyse who is using the service by postcode, lower super output area and levels of deprivation”, it was explained. Describing the rising caseload in looked after children, one head of children’s social work described fortnightly analysis of referrals statistics, set against trends (who is referring, on what basis, and what initial assessments were showing), as a direct indicator of the nature of need in the community. A commissioning director described how sources of information about needs for discrete services are many and varied, and are “tied together by our central policy team, who are in charge of joint strategic needs assessments and overarching strategies for assessing needs like the children and young people’s plan”.
Of course, in some cases, the analysis of need was more subjective. “We basically know that the wrong kinds of parents were accessing our parenting courses, we just weren’t picking up the kinds of troubled families we really needed to reach”, explained one officer, albeit without hard statistical evidence. The quantification of and interpretation of need is, however, no exact science. How it is best undertaken is difficult to judge: a council might fail to meet even the most accurately understood need if it does not identify the correct service interventions, or if these services are undermined by broader

44
CHAPTER 4 – AN ERA OF INNOVATION AND RESOURCEFULNESS?
systemic challenges. Evidence from this study does suggest, however, that the orthodoxy of rigorous needs analysis is now more widespread and more embedded than ever before: local authorities can ill afford to fail to identify need – just as they can ill afford to provide services which fail to meet need.
Better ways of delivering services“I’m simply not prepared to head up a mediocre service.” This was the sentiment strongly expressed by one senior officer – and shared by many others. In spite of the scale of funding reductions, officers interviewed in the study consistently articulated a determination to maintain quality services. Nationally, other research tells a similar story: a survey conducted by the RSA and the Local Government Information Unit (LGiU)21 found that 71 per cent of council chief executive officers/senior officers felt that the impact of cuts had been “positive or neutral” in early 2012. But what has this meant for children’s services?
In this context of an unwavering commitment to serve local communities well, many services delivered or commissioned by local authorities have undergone significant reshaping, realignment or restructuring – with a view to being able to ‘deliver more with less’ or find new, cheaper ways of working that preserve or enhance outcomes. In these cases, significant funding reductions may have radically changed the way a service works, as the following examples illustrate.
One council which has seen closures of several youth centres is continuing to provide services via a suite of mobile facilities – including facilities for sport and music making. These are deployed in ‘hotspot’ areas on certain days of the week. “We’re going out with state-of-the-art facilities to where young people are, rather than sitting and waiting for them to turn up at our youth centres,” the officer explained.
A service manager responsible for parenting support advisers and family support described how the radical downsizing of the service was not having the dramatic effect that might be assumed: with the downsizing came a new approach to how the service works. “We used to be less focused. You’d have family support workers working with families at all levels of need, according to all sorts of models. Now we’re clearer on who does what and where different people have a role to play. So now our family support function works at Tier 3 as a lead professional, in a structured six-week intervention following a thorough assessment. Different agencies and skill-sets are pulled in as necessary rather than loads of council or partner staff working with the family all at once, on different issues and with different strategies. Now we have a clear, rational basis for our service.”
Integration and early helpIn many councils, the cuts have prompted not just changes in how individual services are delivered but radical departmental shifts in ways of working, principally concerning the integration of children’s services.
“We’re going out with state-of-the-art facilities to where young people are, rather than sitting and waiting for them to turn up at our youth centres”

FAMILIES ON THE FRONT LINE? LOCAL SPENDING ON CHILDREN’S SERVICES IN AUSTERITY
45
In one council, several previously separate teams – each with their own professional management, separate processes, infrastructure, databases and often separate premises – have been merged into a single integration function, composed of teenage pregnancy outreach workers, education welfare officers, Connexions officers, drugs support workers, youth workers, youth offending prevention officers, family support workers and flexible learning support officers. This not only saves hugely on cost – as fewer managers and less infrastructure are required to support integrated teams – but also has the clear potential, so the officers explain, to support families in a much more effective way at the early intervention level. “Often these separate services were working with the same families, but doing different assessments, coming from different directions. Now it’s coordinated for the family – and we have a single picture of their needs.” Such joined-up support packages have led council officers to consider searching questions about their service delivery that previously received little attention. For example, such an approach might now sometimes require a single person to lead a support package for a family with school attendance issues, where currently an education welfare officer might be acting in an enforcement capacity alongside a parenting support adviser working in a support capacity. Now, clear processes are agreed and in place for how such a matter is dealt with by the lead professional. Furthermore, the new teams operate on the principle of the ‘team around the family’: recognising the importance of family and home in the life of any child or young person, all assessments have the family at their heart.
In the same example, the creation of a single early intervention service also brought key partners together from the Children’s Trust – notably from the police and from health – to draw up an agreed basis for locality working. Previously, different agencies operated with different local subdivisions of the area – posing a significant challenge for local partnership working. The formation of the early intervention function was accompanied by the aligning of locality boundaries and locality-based services, and represents a long-held intention of the Children’s Trust, accelerated by the onset of cuts.
The integration function is mirrored by a multi-agency assessment function at the ‘front door’ of children’s services. This function enables not just the step-up of cases directly into social work and child protection, but improves the council’s ability to ‘step-down’ cases out of social work into other services – without severing support completely. In addition, it provides a mechanism whereby a service can be provided to families who do not meet the thresholds for social work, but for whom early intervention support via locality teams is seen as necessary. The council’s previous operating model based on discrete professional silos made the provision of this support more opaque and difficult. This wholesale service redesign had been on the cards locally for a long time – but the cuts “provided the impetus to get going with it”.
Services have been integrated in a similar fashion across several of the councils involved in the study. In one, the integration includes family outreach officers, targeted youth workers and education welfare staff – and is based on the same locality model as the local social work teams, to create an all-age early intervention service.
“Often these separate services were working with the same families, but doing different assessments, coming from different directions. Now it’s coordinated for the family – and we have a single picture of their needs”

46
CHAPTER 4 – AN ERA OF INNOVATION AND RESOURCEFULNESS?
One local authority studied was operating several separate services city-wide. Each team had their own managers, processes and were working with family members for different lengths of time…
STATUS QUO
…this had been re-designed into one single early intervention service, divided into three localities. Each case is now being managed as a 6 week intervention with a lead worker drawing in support from other professionals when needed.
‘TEAM AROUND
THE FAMILY’
SCHOOL
YOUTH CENTRE
THE PRESSURE TO FIND SAVINGS HAS ACCELERATED THE TREND TOWARDS SERVICE INTEGRATION LOCALLY
SCHOOL
Connexions
Savings per year: £750,000
Cost effectiveness
£750,000 of savings were made by this council per year,
as a result of lower management and
premises costs, less duplication of casework
between teams and tighter time-management
of interventions
Drugs outreach workers
Family support worker
YOUTH CENTRE
Youth workers
Youth offending prevention
officers
Teenage pregnancy
officers
Drugs outreach workers
Teenage pregnancy
officers
Connexionsofficer
Education welfareofficer
Education welfareofficer
Youth workers
6 week plan
Youth offending prevention
officers
Family Support Worker
as Lead Professional

FAMILIES ON THE FRONT LINE? LOCAL SPENDING ON CHILDREN’S SERVICES IN AUSTERITY
47
Another council has taken a similar approach, albeit with discrete services for the 0–12 and 13–19 cohorts; a single director oversees, though, not just the early intervention teams, but also social work and child protection, to ensure a seamless transition in and out of the service tiers. In a third council, new early intervention locality teams also include educational psychologists and Common Assessment Framework (CAF) coordinators. For one manager, the benefits of the model are clear. “We were trying to help chaotic families with a chaotic system. Now we have a single keyworker – someone we hope the family can trust – and who can bring order to the chaotic system.” In the research interviews conducted for the study, there was even a sense of excitement that old cultural barriers to effective working might soon be consigned to the past: “Gradually, children’s services staff are building greater respect and acknowledgement across different services. It’s less to do with professional heritage and more about attitude and values.”
In a fourth council, the early intervention function incorporates the management of children’s centres and some social work capacity to enable the management of cases “at the edge of the social work threshold” safely. Here, too, services are provided in six-week packages of assessment, intervention and review, with the family and parenting at the heart of the approach.
These examples are expressions of what is perhaps a broad shift in children’s services to achieve an integrated coordinated approach to early intervention. Such approaches are reducing both the proliferation of assessments and the duplication of delivery. Substantial cost savings are achieved through the minimising of overheads. One senior officer responsible for such an early intervention function wonders whether families will actually be better served under this new approach despite the cuts: “It is difficult to know. We have certainly reinvigorated the need for a focus on outcomes and put the quality of our work at the top of our agenda. We’re increasingly geared up to be evidence based and know that what we are doing is effective.”
In one council, this integration of early intervention functions had not yet taken place – but a review was under way, and such a move was looking increasingly probable. “We’ll be looking at who is working with families below a certain level, how they assess need and what sorts of interventions they offer,” an officer explained.
It is also worthy of note that these integrated early intervention functions identified in the study frequently feature a family-based approach to both assessment and the provision of service. “Lots of our services, particularly in youth work, previously didn’t have to take account of the family or of the community. But things have changed now... We really do ‘think family’, and the idea that every family has resilience as well as risks – so strengths not just weakness – is pretty core to the way we’re designing our services,” explained one officer. “There is a growing narrative about parenting, and as a department we are more and more considering the client as part of a family, not just the individual.” This also takes the form of training and professional development, with increasing numbers of staff across all sectors of the local partnership equipped to engage with parents, explained the officer.
“We really do ‘think family’, and the idea that every family has resilience as well as risks – so strengths not just weakness – is pretty core to the way we’re designing our services”

48
CHAPTER 4 – AN ERA OF INNOVATION AND RESOURCEFULNESS?
There is also evidence that these locality models are expanding beyond children’s services to include aspects of adult services too.
Social workHeads of children’s social work interviewed in some councils also spoke of something resembling a cultural shift taking place in the social work profession alongside budgetary pressures. In one council, the need to improve efficiency in social work prompted a review of how assessment is balanced with provision. “We used to have separate teams for initial response, assessment and monitoring and then looked after children. It was great in terms of performance management – hitting throughput targets and making sure things happen at the right speed, so that we met all of the targets government gave us. But the system was building discontinuity for families with constant changes of teams and social workers. Children and families were constantly saying goodbye to our staff on their pathway through a service which they were supposed to trust and get help from. It was gutting for practitioners, too.” The council in question has re-engineered its social work function to place service user continuity, relationships and outcomes at its heart – and achieved some savings at the same time.
Another senior social worker made similar reflections about assessment and front-line practice. Concerned that social work had been dominated by the performance management of sequential assessments over recent years, this officer felt that it was imperative to stop thinking so much and so disproportionately about assessments, and to start thinking more about how and when help is delivered. A model of a continuum of assessment is thus being developed locally in a gradual cultural shift which is intended not just to enhance the service’s capability, but also to reduce the financial burden of bureaucratic assessment regimes.
Innovation and new policy initiativesWhile cutbacks, service targeting and restructures have to a greater or lesser extent dominated the agenda in many local authorities, it is also clear from interviews conducted for this study that there remains a role for local innovation and local policy discretion.
Some such innovations and new policy implementations are ‘invest-to-save’ initiatives: members in one authority are committed to investment in local small residential facilities for older teens in care, for example, to reduce spending on costly placements in out-of-borough children’s homes. Another council is investing significantly in the Family Nurse Partnership programme as part of a suite of service changes to enable improved early intervention and prevention. This is a new budget and a new team within the local authority.
It is notable that several of the new initiatives and investments described involved an element of peer-to-peer working or service user involvement. One such example is the community fostering programme being expanded in one council, whereby experienced foster carers are offered additions to their allowances to work with other families who are struggling or at the edge

FAMILIES ON THE FRONT LINE? LOCAL SPENDING ON CHILDREN’S SERVICES IN AUSTERITY
49
of care. Another council is piloting a similar initiative which encourages local people to be involved in low-level parenting support and befriending other parents undergoing the CAF process. Another council is seeking to improve the support it offers to its pool of foster carers through a training programme delivered by local looked after children themselves.
One council officer spoken to described significant investment taking place locally to reduce youth unemployment, in a partnership initiative designed to offer in-depth support to young people seeking work alongside the active encouragement of employers to take on new staff. “We’ve faced massive cuts in our services, but that doesn’t diminish our members’ ambitions for the area,” the officer responsible explains. “So there is a story of front-loading the cuts and then slowly building things up again.”
Reflecting on the cultural shift in the department over the past five years, one director of children’s services commented: “necessity is the mother of invention. We used to have a fortress mentality and when things got difficult, our instinct was to batten down the hatches. It doesn’t feel like that here any more. We are a learning organisations and we have the permission to test things out.”
The Government’s Troubled Families initiative
What has the Government’s high-profile Troubled Families initiative meant for these eight councils’ spending reduction strategies? Has it played a part in driving these major service transformations?
In one council, the Troubled Families initiative has prompted the creation of a small new department, comprising family support coordinators and resources for information sharing; the actual providers of services remain in their traditional settings. The council in question is, however, executing a larger, more strategic piece of work looking at how early intervention and social care can best function in the medium to long term. It is clear that this council sees the Troubled Families initiative as significant – the local Partnership Governing Board named improving outcomes for this cohort of families as one of its three top priorities.
In other councils, the reception of the Troubled Families initiative was perhaps more lukewarm – particularly by middle managers. While no officers interviewed disagreed with the principles or ambitions of the Troubled Families initiative, many articulated a certain frustration that this was “nothing new”. For some, it was perceived as a ‘recycling’ of existing FIP (Family Intervention Project) models – and some officers expressed relief that they had not cut their FIPs when funding streams came to an end, “because otherwise we would have had to start from scratch all over again”. “We loved the FIP model in terms of its values, beliefs and concepts – working with the whole family and so on – and that’s no different from what Troubled Families is about.”
Some officers went further, even expressing concern about the FIP programme. “Apparently we’ve got so many hundred troubled families under our watch. How would they know anyway? I suppose it could distract us a bit from what we’re trying to achieve more broadly in terms of early intervention.” This officer’s concerns were related to a wider restructuring programme designed to improve pathways through children’s services at lower cost –
“We’ve faced massive cuts in our services, but that doesn’t diminish our members’ ambitions for the area, so there is a story of front-loading the cuts and then slowly building things up again”

50
CHAPTER 4 – AN ERA OF INNOVATION AND RESOURCEFULNESS?
and the Troubled Families work was having to be integrated within a larger piece of strategic planning.
In another council undergoing a similar type of strategic restructuring, the Head of Social Work Practice expressed irritation that “they [the Government] keep changing the goal posts” and that this much-trumpeted policy was “hardly inspiring” in its payment-by-results mechanism. In this council, participation in the initiative required a reshuffling of three existing services: the FIP, the service to support high-needs adolescents and the nascent early help service. Indeed, the council was confident that it was already working with the ‘troubled families’ in its area.
The focus of frustration for other council officers was the perceived contradiction in government policy. A director of education remarked that it might become “much more tricky” to give the best support to troubled families if the child happens to be a pupil at an academy, which, independent from the council, can more easily exclude pupils from its roll. A parenting lead in another council felt that the Troubled Families initiative was being undermined by the money being cut from other aspects of children’s services.
The cuts processThe processes through which councils have reached their funding and savings decisions are perhaps worthy of attention for the level of wider stakeholder involvement that some, at least, have striven to achieve.
Several managers spoke of the importance of involving staff in gathering intelligence about service strengths and weaknesses – going beyond mere consultation to involve staff in design and decision-making. The ‘LEAN review‘ process (a means of reviewing a service based on eliminating waste and identifying value-adding activities) applied by one senior manager – described as “vital to our ability to design good services for the new era” – was a mechanism used in one local authority to give a group of staff a significant role in influencing the future of their service and in identifying crucial value-adding elements of their work. Another council held a large ‘festival of ideas’ event, preceded by a broad programme of front-line shadowing, which brought together staff from across disciplines, back and front office, to brainstorm approaches for the Troubled Families agenda.
In terms of the distribution of cuts across the range of services, councils displayed various approaches aimed at balancing the burden of reductions across departments in a manner that corresponded to local residents’ concerns. Indeed, in many cases, children’s services fare well in such consultations and figure as one of residents’ top priorities. Beyond standard consultation exercises undertaken on an annual basis, officers also described roadshow events involving both officers and members, and sophisticated policy matrices whereby council-wide priorities were mapped against service delivery to facilitate the identification of cross-cutting outcomes.

FAMILIES ON THE FRONT LINE? LOCAL SPENDING ON CHILDREN’S SERVICES IN AUSTERITY
51
The result of forensic strategic planning?A question legitimately poses itself regarding how councils had reached the point at which they found themselves during fieldwork for this study. Were their spending and savings decisions the fruit of careful strategic planning, or the unplanned result of ad hoc opportunities and less coherent, isolated policy decisions?
Undoubtedly, in all councils, some so-called ‘salami-slicing’ has taken place. “Vacancy management”, as one officer described it, had enabled a large proportion of savings to be accounted for in the first year of cuts in one council. The expiry of contracts, departure of members of staff, relinquishing of not-needed office stock or premises and so on enabled the accrual of a considerable sum of savings in many cases.
The interviews carried out with council employees also evidenced, however, sophisticated exercises in strategic forward planning, undertaken as a response to the need to reduce budgets and designed to identify savings in a rational and thoughtful manner, consistent with a stated organisational goal or objective. Such examples include:
• A ‘root and branch review’ undertaken in one authority, across the Children’s Services partnership, under the guidance of the director of children’s services, with five stated core principles:
- listening to staff - reducing bureaucracy – to protect the front line - reducing management costs – to protect the front line - embedding evidence-based practice - reducing the department’s footprint (i.e. premises space)
This review fed the design of an ‘operating model’, in which the ‘commissioning’ elements of children’s services are separate from the ‘provider’ elements – i.e. direct service delivery. The stated aim of such a split was to strengthen and consolidate commissioning capacity and to achieve the same leverage, focus on outcomes and value for money from in-house services as sought from services commissioned to partners in the voluntary or private sector.
• A ‘Children’s Services change programme’ whose core principle was to recognise, support and promote the strength of the families in redesigning service delivery. This marked a cultural shift away from an era where it was seen as ‘right for the council to do everything’, towards a culture where families themselves – not state intervention – are at the heart of the solutions to problems they face. A wide-ranging exercise in analysing business processes and service models was undertaken, alongside a staff and service user consultation programme. Services were prioritised in terms of local and national importance, effectiveness and value for money, enabling the development of a target operating model for the future, which catered for a more sophisticated system of early help as described above.

52
These are two examples of the strategic approaches taken by many councils in the sample studied to achieving spending reductions in a more logical and rational manner than the previous vogue of ‘salami slicing’. It is these processes of strategy making that have led to the paradigm shifts in service structures described above. Indeed, these processes take time and resource. “It’s taken us over a year,” reported a programme manager, “and we’ve had to spend some money on getting the right people to help us out with it.” Councils varied, though, in their progress through these strategic journeys: in the sample studied, one council was at the very beginning of such a journey, while officers in another had already undertaken and implemented a strategic realignment of services and spending. Many councils were midway through the journey – with strategic plans implemented in some aspects of service, but not others.
Common to all stated ‘strategies’ interrogated during the research process were certain unsurprising principles. All councils expressed some sort of commitment to protecting front-line services, in particular those that reach the most vulnerable, rationalising processes and resources, and eliminating ‘waste’, whatever such waste might be. The importance of protecting jobs was more explicitly articulated in some councils than others.
Strategies in the context of existing strengths and weaknessesMore striking was the contrasting content of these strategies – often depending principally on the starting point of the council, and the spending and service imperatives associated with this starting point. Indeed, this research strongly demonstrates that there can be no ‘best’ or ‘one-size-fits-all’ approach to managing spending reductions, owing to the diversity of circumstances local authorities face. The examples below are illustrative of this.
Example 1: Savings in expensive services have already been made – so efficiencies are made in other areas
In one council, numbers of looked after children (LAC) were “pretty much as low as they can go”, following targeted efforts over the previous five years to reduce the numbers of children and young people looked after by the authority (such as investment in services for those aged 16+ to help adolescents stay at home and the promotion of special guardianships). Therefore there are not many significant savings to be found in social work and the authority stands by its commitment to its locality model of working. Savings are therefore principally being made in areas such as youth services and childcare, and in services that deliver early help to families, such as family support and education welfare. The professional silos that once existed around these services are being broken down in the creation of a single early help function.
Example 2: Making considered savings in social work
In another council, numbers of looked after children were high and rising, partly in relation to the Southwark Judgment (which clarified councils’ duties to house 16- and 17-year-olds who are unable to live at home). Spend in expensive services was particularly high not just because of population size
CHAPTER 4 – AN ERA OF INNOVATION AND RESOURCEFULNESS?

53
but also because large sums were being spent on independent fostering agencies and external residential placements. In this council, therefore, the overall savings strategy includes a larger element of spending reductions in social care and LAC services: “Much more can and should be done in the community to support our families,” explained the Head of Social Work for Children. Key to this strategy has been a culture change within the organisation. “In recent years, we have had a culture of risk aversion. We were too willing to put children in our care. This led to too much work for social workers, high caseloads and a workforce in turmoil – actually, the latent conditions for a tragedy, with a sort of atmosphere of ‘it can only be well managed if it is in Tier 4’.” The council’s strategy has therefore focused on improving commissioning (and value for money) from care providers in the private, voluntary and independent (PVI) sector and on making more robust services available below Tier 4, to reduce spending on the most expensive child protection activities and, crucially, relieve pressure in the system.
Example 3: Unable to make savings in expensive services due to demand pressures
A third council faced similar rising pressure in its social work system, but did not feel it could safely make savings in the ways described in example 2, as such opportunities were not available. In fact, social work services had received marginally more funding in recent years with particular investment in in-house residential care. But budgets had not increased at the same pace as need levels had risen – so there is still much budgetary restraint in evidence in these services. This manifests itself, for example, by not automatically putting all children in a family on a child protection plan if one child requires it; by being vigilant about taking a child off a protection plan when risks are suitably low; by having smaller teams of social workers with a better mix of skills; by ensuring a focus on evidence-based systemic practice (as per the Munro review). Pressure in social work has meant, though, that more in the way of savings has had to come from other areas. This has primarily been achieved through the reorganisation and consolidation of formerly separate professional departments into multi-agency locality teams working on a case-holding basis. Hard choices have been made – including the closure of some centre-based youth provision.
These examples highlight three different overall strategies employed by local authorities to manage budget reductions in the light of service pressures. They illustrate that the strategy a local authority ultimately adopts is likely to depend on:
• which services are stretched in the first place• the direction of travel for the most expensive social care and LAC services,
i.e. can LAC numbers be safely reduced?• the perceived availability of ‘easier’ savings which have a lesser impact on
front-line services.
Inevitably, beneath these high-level strategies exist policies, plans and distinct approaches for particular service areas – such as children’s centres, education services or youth work.
FAMILIES ON THE FRONT LINE? LOCAL SPENDING ON CHILDREN’S SERVICES IN AUSTERITY

54
A look towards the futureThis section identifies current and future challenges facing children’s services as identified during this research, focusing on the relative ease or difficulty of making further savings, the viability of partnership working and workforce issues.
This report has surveyed the cuts and reductions that councils have made in their children’s services spending, and provided an account of the extent to which councils have reconfigured services or redeployed resources to continue to meet the needs of families as, or even more, effectively than before the current spending review period. But with several years of fiscal restraint still on the horizon, what is the position of the sector following recent reductions and what grounds are there for optimism or otherwise?
The low-hanging fruit“Some of our reductions and changes we would have made anyway. I think the Government cuts agenda made the change happen faster. And it increasingly feels like the changes we’re making are driven by finance rather than by needs or policy.”
In Chapters 2, 3 and 4, council officers describe cuts that have been made and responses to the financial imperatives, including the interplay between needs, effectiveness and level of provision. But the officer quoted above is also one of many to express the concern, during interviews for this research, that the future might not be so easy: that cuts become harder to make, that the “low-hanging fruit has gone”. While there was a common expectation among the officers interviewed that the overall sum of cuts would reduce slightly in coming years, there was equally strong consensus that the cuts would become harder to make.
One officer anticipated savings in the future through better integration of health services, and services for children with disabilities and special educational needs (particularly in assessment); many officers reported awaiting government policy direction on special educational needs (SEN) before addressing this. However, in general terms, many of the savings that have been made so far can only be made once: once management has been delayered, unnecessary housekeeping spending eliminated, services to schools remodelled and universal services scaled back, it can only be a matter of time before the reductions begin to bite in other service areas of targeted or even specialist provision.
It would appear that many councils were anticipating that improved effectiveness in early intervention would relieve pressure on budgets for costly higher-tier services. The extent to which this will translate into savings or merely eliminate the need for budget growth remains to be seen. This question is of course partly dependent on the escalation or otherwise of levels of need. A senior commissioner for children’s services expressed his concern that “we
CHAPTER 5

FAMILIES ON THE FRONT LINE? LOCAL SPENDING ON CHILDREN’S SERVICES IN AUSTERITY
55
designed our new operating model based on a two-year recession, not a five or seven-year stagnation – who knows what the future might be like”. Another officer expressed a worry that in an age of targeting, means testing, tightly managed thresholds and time-bound, coordinated interventions, some families might just slip through the net as universal services disappear. “What about the poor who don’t have additional needs, but who are just able to cope thanks to certain council services like free afterschool care? Might they soon escalate into social work? Or will they just get poor outcomes?”
The data presented in Chapters 2, 3 and 4 also suggest that the hypothesis that the full effect of the cuts is yet to be felt is plausible. A substantial proportion of these reductions have been made through efficiency measures, non-service spending and services to schools, which will take time to filter through the system. Indeed, reductions in areas such as youth services and parenting may not be reflected in poorer outcomes for a number of months or years.
Whether or not the real impact of funding reductions has yet been felt, there was a sense among a small number of officers interviewed that the sector was being weakened by the financial stranglehold it is facing. “Is this actually about disabling local authorities?” asked one officer, angered by the share of cuts being shouldered by local government. “The money we are saving feels like such a drop in the ocean nationally, but is making such a massive impact locally.”
A challenge for partnership workingSince the establishment of the Every Child Matters agenda and the formation of Children’s Trusts, partnership working has been a key feature of both local strategy and delivery in the children’s services sector. The withdrawal of statutory guidance on Children’s Trusts, the emergence of academies and free schools, and budgetary tightening across partnerships, however, represent potential challenges to the models of partnership which had become commonplace.
“It is becoming more difficult to get people around the table. The police have cut officers and the primary care trust is undergoing a massive merger. Partners keep saying that their staff are being stretched very thinly,” reported a commissioner for a local Children’s Trust. “The trust is now a voluntary engagement,” explained another officer, “and I suppose the police don’t see CAF and early help as their core business, they’ve got their own problems.” Not all interviewees would agree with this pessimistic view of the state of Children’s Trusts, though. “Partnership working is becoming easier, there’s a better mutual understanding and a willingness to put core business first. We know we need each other more than ever,” stated one officer. “This climate has made us really pull together. That’s how we do it around here,” remarked another.
Sustaining a spirit of partnership with schools that have acquired academy status is, for some at least, not proving straightforward. “Some of our partnerships with academies are dreadful. They don’t have to tell the
“It is becoming more difficult to get people around the table. The police have cut officers and the primary care trust is undergoing a massive merger. Partners keep saying that their staff are being stretched very thinly”

56
CHAPTER 5 – A LOOK TOWARDS THE FUTURE
local authority anything. The majority of them are fine but not all of them.” A director of children’s services, meanwhile, articulated a certain “concern about the fragmentation of the education system” and the risk of antagonism between academies and the local authority, particularly around thorny issues of admissions and exclusions. However, on the viability of a flourishing partnership between councils and academies, perspectives and outlooks were divided, with many officers optimistic about their ability to establish a shared sense of focus in meeting needs in local communities.
A challenge for commissioning, management and moraleThe increasing prevalence of commissioning as a way of working across local government is well documented, and children’s services do not buck this trend. But the move towards commissioning more services from the voluntary and private sector is not unproblematic for managers experiencing a squeeze on their budgets. “You’d think that we’d need a good commissioning department, but our commissioning team in Children’s Services has been subsumed into a corporate one... so our capacity is reduced and I’m not sure how it’s going to work out.”
While the data gathered in interviews suggest that such reductions in commissioning capacity are not universal, this issue remains of ongoing interest, given that commissioning involves not only the planning and procurement of services, but also the analysis of need and the evaluation of outcomes. One council involved has developed a new mechanism for the management of performance and tracking of outcomes alongside its new early intervention function – which it celebrates as more consistent and robust than the previous culture of ‘secretive monitoring in discreet teams’, but due to capacity issues and the relaxation of government reporting requirements, “some data simply isn’t being gathered any more”. The officer questioned whether the shift away from performance monitoring had “gone too far the other way”, with too little data now collected by central teams, where previously too much was demanded.
It is in relation to management and leadership, and organisational functioning more generally, however, that officers interviewed articulated graver concerns. “Our education psychologists are spending hours doing typing and admin because their admin budgets were slashed,” reported one officer. “The management structure for social workers has been significantly dismantled,” explained another. “This means their capacity for case management and supporting other professionals in the community such as teachers might be reduced.” This echoes wider concerns articulated by the British Association of Social Work in its paper The State of Social Work 2012, which found that 77 per cent of social workers felt their caseloads were “unmanageable”, alongside “excessive administration demands, inadequate supervision, high vacancy rates [and] low morale”.22
A children’s centre manager, meanwhile, complained that “the senior commissioners responsible for my service are now so far removed, such managerialists, that they don’t really understand my service – or understand
It is in relation to management and leadership, and organisational functioning more generally, that officers interviewed articulated graver concerns

FAMILIES ON THE FRONT LINE? LOCAL SPENDING ON CHILDREN’S SERVICES IN AUSTERITY
57
what it is that is vital for the way the service works, like good-quality, informal partnership working across agencies.” This was not the only officer to express growing frustration fuelled by the sense of distance felt between operational staff and the senior management or ‘commissioners’ in charge of their services.
Of course, complaints about management are neither new nor unusual. But these quotes from officers raise a question about the strength of the strategic capacity of councils to continue to manage budget reductions adeptly, while maintaining a focus on quality and outcomes, long into the future. The morale of children’s services departments also emerges as an area of concern, as it is eroded by the pressures of overworking, reduced administrative support and increasingly distant management.

58
CONCLUSION
ConclusionFamily and Parenting Institute, October 2012
The spectrum of approaches adopted by managers and officers interviewed for this report serves as testimony to their determination to continue delivering high-quality services for families, even in an era of diminishing resources. It is also clear from this study that there was no single ‘right’ way to navigate the financial challenges now being faced in local government, only a range of strategies developed in response to local context, existing models of service provision and the needs of local families.
At this early stage, the longer-term impact of these different approaches is yet to be felt, and the full consequences for families and children cannot yet be known. Nevertheless, looking across this complex picture, there is consistency in the very fact that austerity is evidently prompting local authorities to refocus their resources and so redefine their priorities.
Innovation or erosion?While the pace of change has been rapid and the cuts deep in many instances, the accounts of the officers making these decisions also suggest we should be wary of casting all developments in an exclusively negative light. This research shows that many of those working in Children’s Services departments have endeavoured to use the upheaval as something of a burning platform – devising ambitious approaches to service redesign and integration to deliver cost savings. In some instances, budget pressures have seemingly prompted changes that were perhaps overdue, or provided opportunities to ‘innovate in austerity’ for managers able to identify more effective ways to meet the needs of families and children.
It is also apparent from both the analysis of spending data and the interviews that this period has seen many local authorities going to considerable lengths to shield front-line service provision from direct cutbacks. Consequently, it seems likely that a large proportion of the spending reductions that took place during this period will not have been immediately visible to families and service users.
However, in the face of further cuts local authorities are likely to be confronted with even greater challenges when it comes to sustaining current levels of service delivery. Over time, additional cuts may also incrementally erode the effectiveness of those services that remain. Earlier in the report, one commissioner for children’s services was quoted as summarising this particular sustainability challenge thus: “We designed our new operating model based on a two-year recession, not a five- or seven-year stagnation – who knows what the future might be like.”
As cuts become increasingly visible to families, public opposition also may become more vocal. The under-used youth centre may have been closed this year without too much public outcry, and the senior team might have
“We designed our new operating model based on a two-year recession, not a five- or seven-year stagnation – who knows what the future might be like”

FAMILIES ON THE FRONT LINE? LOCAL SPENDING ON CHILDREN’S SERVICES IN AUSTERITY
59
been reduced from six to three. But next year, will all the remaining youth centres also be closed? And can the whole department continue to function with an even smaller executive team? Cuts beneath the surface and across departments can have a cumulative effect, gradually undermining the capacity of the overall system to operate effectively. It may well be that future cuts to service provision – moving ever closer to the front line – will be far harder to implement, even if they are lesser in their sum financial value.
Meeting the needs of the many or the few?The very practical adjustments to resourcing levels documented in this report also generate deeper questions about the relationship between different groups of families and their local council. Of course this relationship was never static, and an earlier chapter has already touched on the fact that ‘universalism’ in relation to families has long been a complex concept. Nonetheless, this research indicates that the service areas which are most affected by cuts are also those most associated with ‘universal’ provision (for example non-social work services and Early Years). With less money to go around, many local authorities will inevitably need to target their limited resources among groups with the highest need.
As a result, we may start to witness a process whereby the relevance of the council – or at least the children’s services delivered by the council – to all groups of families is in decline. For example, there are fewer council employees working in other capacities in local schools and the local children’s centre might be run by a national charity, paid for by a commissioner in the town hall. Those who more frequently encounter council officers may increasingly be the so-called ‘troubled’ families, families in crisis, or children in the criminal justice system. Such a trend could give rise to a range of unintended political and social consequences in years to come.
Is early intervention affordable in austerity?Looking ahead, it seems likely that levels of need in communities will be intensified by the economic climate and cuts to benefits in particular. One early indication of such rising demand could be the continued growth in budgets for looked after children and social work that was highlighted in this research. Against this backdrop of escalating need, there is the real possibility that the cuts to lighter touch services (which are arguably best positioned to pick up problems at an earlier stage) may prove to be something of a false economy.
Although many local authorities studied were able to highlight examples of their commitment to early intervention initiatives, in the current financial climate it seems likely that it will become increasingly difficult for them to justify resourcing work with families before crisis point is reached. Cuts to funding for services aimed at less vulnerable families may also have the unintended consequence of escalating need and increasing pressure on more costly social work services.

60
CONCLUSION
Of course, both the early intervention agenda and the integration of services to create a ‘team around the family’ promise cost savings further downstream if delivered successfully. But, as we have seen from the accounts in this report, many local authorities are facing intense budget pressures in here and now. Savings will need to be concrete and realisable in the short term for local authorities to fulfil the ambitions of central government and drive these agendas forward.
Doing more with lessLocal authorities are set to remain in the spotlight for some time to come, and the rising expectations of what they are able to deliver to families show no sign of abating. Indeed, such expectations have only been heightened by current policy agendas and political pressures, such as intense scrutiny of performance on safeguarding and the challenge of the challenge of delivering on the ‘troubled families’ and early intervention agendas. When it comes to family policy, it seems that localism is empowering councils to effect change at a time when their capacity to deliver it is at risk of being eroded by diminished resources and less direct oversight of service provision.
The process of academisation and (in some cases) a greater emphasis on commissioning services rather than delivering them in-house has only accelerated this trend. Interviews with officers reflected the fact that they felt some of the levers of influence once available to them were now beyond their reach – or as one of the directors of education quoted earlier in this report framed it: “We are being asset-stripped, and our capacity to have leverage is reducing.”
The findings of this research also raise the possibility that that the shift towards localism in tandem with rapidly implemented cutbacks could be giving rise to increasingly fragmented patterns of provision across the country. In a more complex landscape of service provision, it becomes less possible for every local authority to meet the expectations of families in consistent ways, and harder for families to see a clear line of accountability from services they access back to the council itself. Of course, local authorities will always need to adapt their approaches to the local context. Nevertheless, policymakers in central government may need to consider how increasing variation and inconsistency will be experienced by families in practice.
In the midst of a heated public debate about where cuts were falling and who was ‘hardest hit’, this project was initiated to look as objectively as possible at spending decisions from the perspective of families and children. Despite the scale of the savings they were tasked with finding, this research has reaffirmed the extent to which officers and local authority managers were committed to minimising the direct impact of cutbacks on children and families – although clearly this was not always possible. However, it is only the first chapter of the story. It now seems certain that the lean years ahead will put that commitment to the test even more acutely, further re-shaping the relationship between families and their councils in the process.
“We are being asset-stripped, and ourcapacity to haveleverage is reducing”


62
APPENDIX 1
APPENDIX 1: THE DISTRIBUTION AND TIMING OF BUDGET GROWTH
AND BUDGET REDUCTIONS, COUNCIL-BY-COUNCIL
Non-service related spending
Non-social work services to families and young people
Youth Offending
Social work & LAC£100,000
Services to schools
SEN Across service spending
Early years
COUNCIL A
Net Savings 2011/12 and 2012/13
COUNCIL B
Growth 2011–2013£1.9m
Growth 2011–2013
Savings 2011–2013£4.8m
Savings 2011–2013£6.2m
2011/12 2012/13
2011/12
2012/13
KEY
Net Savings 2011/12 and 2012/13
There was no growth identified in this council's budget between 2011–13
NOTE: Each service area will occupy a differing proportion of the children's services budget from council to council, which may then affect the proportion of savings and growth attributed to these services.

FAMILIES ON THE FRONT LINE? LOCAL SPENDING ON CHILDREN’S SERVICES IN AUSTERITY
63
Growth 2011–2013£8.3m
Savings 2011–2013£21.1m
Savings 2011–2013£11.1m
Growth 2011–2013£0.3m
COUNCIL D
COUNCIL C
2011/12
2012/13
2011/12
2012/13
Net Savings 2011/12 and 2012/13
Net Savings 2011/12 and 2012/13
Non-service related spending
Non-social work services to families and young people
Youth Offending
Social work & LAC£100,000
Services to schools
SEN Across service spending
Early years
KEY
NOTE: Each service area will occupy a differing proportion of the children's services budget from council to council, which may then affect the proportion of savings and growth attributed to these services.

64
APPENDIX 1
Savings 2011–2013£16.6m
Growth 2011–2013£1.7m
Savings 2011–2013£26.8m
Growth 2011–2013£16.9m
COUNCIL E
2011/12
2012/13
2011/12
2012/13
COUNCIL F
Net Savings 2011/12 and 2012/13
Net Savings 2011/12 and 2012/13
In council E there was net growth of £1.6m in 2012/13 rather than net savings
Non-service related spending
Non-social work services to families and young people
Youth Offending
Social work & LAC£100,000
Services to schools
SEN Across service spending
Early years
KEY
0
NOTE: Each service area will occupy a differing proportion of the children's services budget from council to council, which may then affect the proportion of savings and growth attributed to these services.
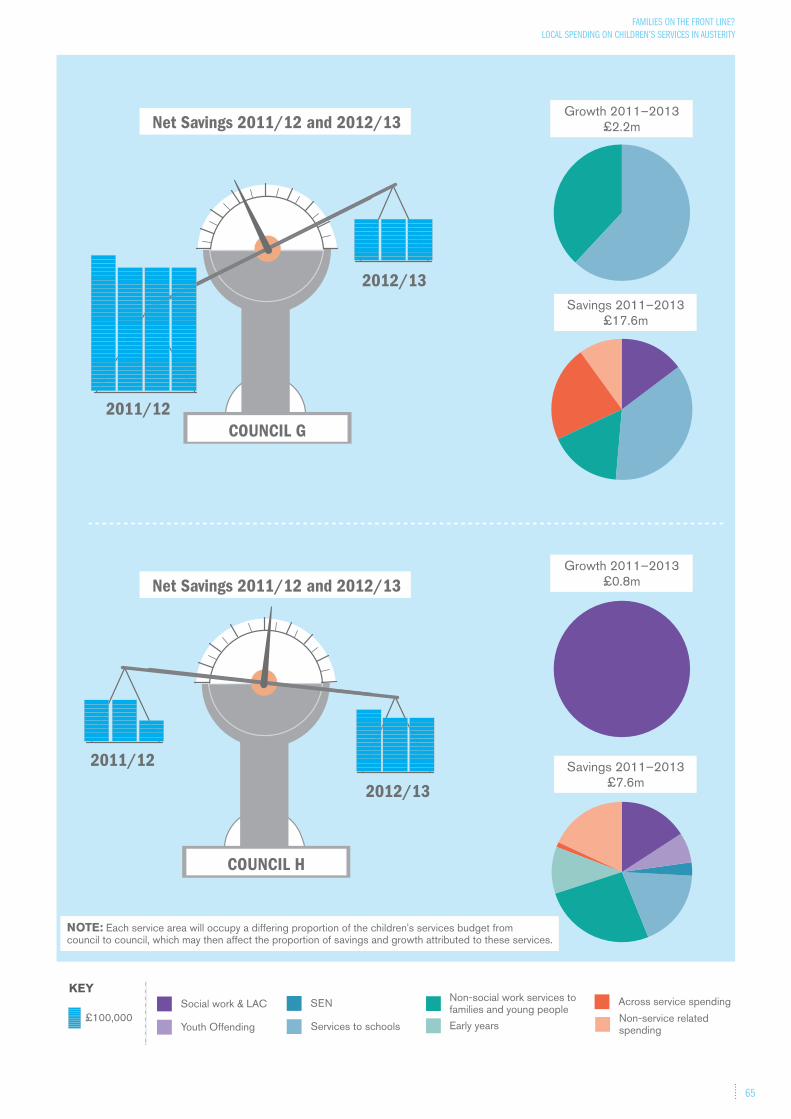
FAMILIES ON THE FRONT LINE? LOCAL SPENDING ON CHILDREN’S SERVICES IN AUSTERITY
65
COUNCIL G
COUNCIL H
2011/12
2012/13
2011/12
2012/13
Growth 2011–2013£2.2m
Growth 2011–2013£0.8m
Savings 2011–2013£17.6m
Savings 2011–2013£7.6m
Net Savings 2011/12 and 2012/13
Net Savings 2011/12 and 2012/13
Non-service related spending
Non-social work services to families and young people
Youth Offending
Social work & LAC£100,000
Services to schools
SEN Across service spending
Early years
KEY
NOTE: Each service area will occupy a differing proportion of the children's services budget from council to council, which may then affect the proportion of savings and growth attributed to these services.
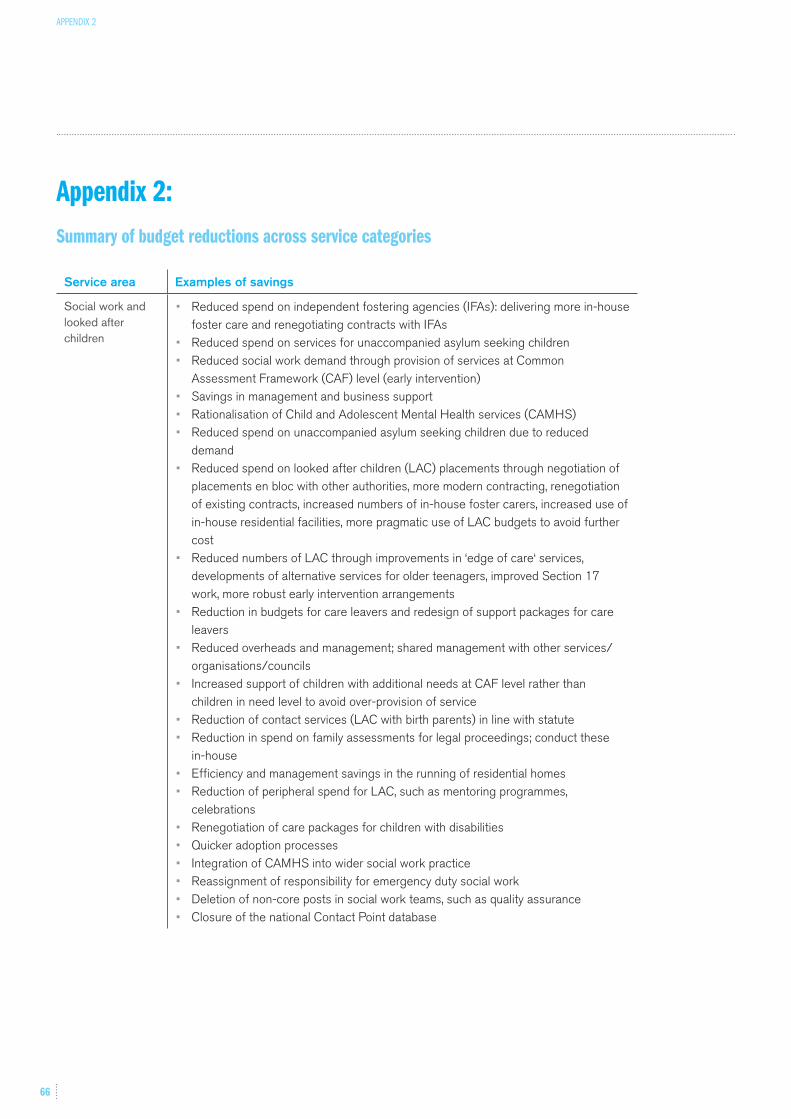
66
APPENDIX 2
Appendix 2: Summary of budget reductions across service categories
Service area Examples of savings
Social work and looked after children
• Reduced spend on independent fostering agencies (IFAs): delivering more in-house foster care and renegotiating contracts with IFAs
• Reduced spend on services for unaccompanied asylum seeking children • Reduced social work demand through provision of services at Common
Assessment Framework (CAF) level (early intervention)• Savings in management and business support• Rationalisation of Child and Adolescent Mental Health services (CAMHS) • Reduced spend on unaccompanied asylum seeking children due to reduced
demand• Reduced spend on looked after children (LAC) placements through negotiation of
placements en bloc with other authorities, more modern contracting, renegotiation of existing contracts, increased numbers of in-house foster carers, increased use of in-house residential facilities, more pragmatic use of LAC budgets to avoid further cost
• Reduced numbers of LAC through improvements in ‘edge of care‘ services, developments of alternative services for older teenagers, improved Section 17 work, more robust early intervention arrangements
• Reduction in budgets for care leavers and redesign of support packages for care leavers
• Reduced overheads and management; shared management with other services/organisations/councils
• Increased support of children with additional needs at CAF level rather than children in need level to avoid over-provision of service
• Reduction of contact services (LAC with birth parents) in line with statute• Reduction in spend on family assessments for legal proceedings; conduct these
in-house• Efficiency and management savings in the running of residential homes• Reduction of peripheral spend for LAC, such as mentoring programmes,
celebrations• Renegotiation of care packages for children with disabilities• Quicker adoption processes• Integration of CAMHS into wider social work practice• Reassignment of responsibility for emergency duty social work• Deletion of non-core posts in social work teams, such as quality assurance• Closure of the national Contact Point database

FAMILIES ON THE FRONT LINE? LOCAL SPENDING ON CHILDREN’S SERVICES IN AUSTERITY
67
Services to Schools
• Reduction of school improvement activities: removal of curriculum support functions, ending the training offer, focusing school improvement adviser service on only weakest schools, charging for additional services
• Reduction of education welfare service to statutory levels• Charging for services provided to academies (school improvement, minority ethnic
achievement services, education welfare)• Management rationalising and mergers• Charging for or reducing the services of the education business partnership• Removal of revenue-funded posts associated with the defunct/expired Building
Schools for the Future programme• Ceasing subsidies to schools for school meals, insurance, ICT services• Sharing of alternative provision with neighbouring authorities• Changing eligibility for home-to-school transport for new Year 7s (reduced eligibility
for faith schools, selective schools, post-16)
Non-social work services for families and young people
• Reduction in universal youth offer, focusing on areas of high need/high risk young people
• Replacement of static youth centres with flexible mobile provision• Ceasing direct provision of universal youth services – provision via voluntary sector/
devolution to lower tiers of government• Reduction of Connexions service to focus on vulnerable young people; trading of
Information, Advice and Guidance service with schools• Integration of below-the-threshold services (parenting support advisers, family
support workers, outreach officers, youth workers) into locality teams to facilitate early intervention
• Reduction in funding of Positive Activities for Young People and Youth Opportunities Fund programmes
• Reduction in subsidy of Extended Schools activities such as breakfast clubs • Charges for services such as afterschool care• Reduction of spend in participation/involvement services for children and young
people• Increased targeting of parenting programmes
Early Years • Remodelling of children’s centres, for example hub and spoke model• Recommissioning of children’s centres in voluntary sector on more competitive
terms• Restructuring of sessions on offer in children’s centres to enable more efficient
staffing• Reduction in funding of children’s centres operated by primary schools• Rationalisation of number of centre and quality managers for Early Years settings• Reduction in spend on training and consultancy for the Early Years private and
voluntary sectors• Increase in charging for local authority nursery provision• Increased income from children’s centres through new or increased charges

68
APPENDIX 2
Special educational needs (SEN)
• More robust commissioning of SEN placements• Containment of demographic SEN pressure through tighter panel management• Review policy for SEN home-to-school transport to reduce spend• Changing of routes and suppliers for SEN home-to-school transport• Integration of assessments for SEN and children with disabilities• Reduced capacity in inclusion services • Reduced statementing levels, fewer educational psychologists• Reposition SEN service to see schools as client and encourage management of
need at School Action/School Action Plus• Reduction of education psychology to core activity; additional service traded• Administrative savings• Reduction of parent partnership spend
Across-service savings
• Departmental procurement savings: supplies, services• Department-wide management restructuring programmes• Alignment of grants to enable savings from core funding• Department-wide staff integration (merging of teams)• Reduction in spend on Local Safeguarding Children’s Board• Reduction in spend on agency staff
Non-service-related spending
• Infrastructure reorganisation and deletion of vacant posts• Executive management restructure/mergers• Change in severance policy• Executive admin support reduction, fewer PAs• Director of Children’s Services post deletion• Income from conference centres• Efficiencies in back-office services (finance, HR, equality and diversity, etc.)• Transfer of responsibilities for student support• Cease funding or subsidy of hospitality/catering• Premises/accommodation savings• Policy/performance/commissioning team cost reduction• Reduction or restructure of training budgets

FAMILIES ON THE FRONT LINE? LOCAL SPENDING ON CHILDREN’S SERVICES IN AUSTERITY
69
Endnotes
1. Family and Parenting Institute (2012) The Impact of Austerity Measures on Households with Children, Analysis by J., Browne, Institute for Fiscal Studies. Online at http://www.familyandparenting.org/our_work/Families-in-the-Age-of-Austerity/New+IFS+report+reveals+impact+of+austerity+on+families
2. Berman, G. and Keep, M. (2011) The Local Government Finance Settlement 2011-13, amended July 2012, Commons Library Research Paper, Research papers RP11/16.
3. Communities and Local Government, Departmental announcement (2011)
4. Local Government Association (2010) Briefing: The Spending Review 2010.
5. Emmerson, C., Johnson, P. and Miller, H. (eds) (2012) The IFS Green Budget: February 2012, Institute for Fiscal Studies.
6. Ibid.
7. Hastings, A., Bramley, G., Bailey, N. and Watkins, D. (2012) Serving deprived communities in a recession, Joseph Rowntree Foundation.
8. see note 4
9. Chartered Institute of Public Finance and Accountancy, CIPFA Snapshot Budget Survey 2012.
10. Department for Education, July 2012 (departmental announcement)
11. Department for Education (2010) The Importance of Teaching: Schools White Paper.
12. Prime Minister’s speech, Monday 15 August 2011. Online at <http://www.number10.gov.uk/news/pms-speech-on-the-fightback-after-the-riots/>
13. Higgs, L. (2011) ‘Exclusive survey: youth services and children’s centres worst hit as cuts average 13 per cent in one year’, Children and Young People Now, January 2011.
14. Chartered Institute of Public Finance and Accountancy (2011) Smart Cuts? Public Spending on Children’s Social Care, NSPCC.

70
ENDNOTES
15. See note 13
16. See note 6
17. Daycare Trust Press release. Online at <http://www.daycaretrust.org.uk/pages/250-sure-start-childrens-centres-face-closure-within-a-year.html>
18. Department for Education, Looked After Children Statistics 2011.
19. National Council for Voluntary Youth Services (2010) Comprehensive Cuts: Report on funding changes in the voluntary and community youth sector, October 2010.
20. Cundy, J. (2012) Commissioning for better outcomes, Understanding local authority and voluntary sector experiences of family services commissioning in England, Barnardo’s (as part of the Family Strategic Partnership).
21. ‘Councils cut the fat but cracks are beginning to show’, RSA and LGIU, press release, 3 May 2012. Online at <http://www.thersa.org/about-us/media/press-releases/councils-cut-the-fat-but-cracks-are-beginning-to-show>
22. British Association of Social Workers (2012) The State of Social Work 2012: what social workers think about the state of their profession in 2012, Online at <http://cdn.basw.co.uk/upload/basw_23651-3.pdf>

FAMILIES ON THE FRONT LINE? LOCAL SPENDING ON CHILDREN’S SERVICES IN AUSTERITY
71
ReferencesAllen MP, G. (2011), Early intervention: the next steps, Department for
Work and Pensions. Available online at http://www.dwp.gov.uk/docs/early-intervention-next-steps.pdf
Berman, G. and Keep, M. (2011) The Local Government Finance Settlement 2011–13, amended July 2012, Commons Library Research Paper, Research papers RP11/16. Online at http://www.parliament.uk/briefing-papers/RP11-16
British Association of Social Workers (2012) The state of social work 2012: what social workers think about the state of their profession in 2012, Online at <http://cdn.basw.co.uk/upload/basw_23651-3.pdf>
Chartered Institute of Public Finance and Accountancy (2011) Smart cuts? Public spending on children’s social Care, CIPFA for the NSPCC. Online at http://www.nspcc.org.uk/Inform/research/findings/smart_cuts_pdf_wdf85752.pdf
Chartered Institute of Public Finance and Accountancy, CIPFA Snapshot Budget Survey 2012.
Communities and Local Government (2011) Local Government finance settlement 2011/12, Online at http://www.local.odpm.gov.uk/finance/1112/grant.htm
Cundy, J. (2012) Commissioning for better outcomes. Understanding local authority and voluntary sector experiences of family services commissioning in England, Barnardo’s (as part of the Family Strategic Partnership). Online at http://www.familystrategicpartner.org/wp-content/uploads/2011/09/Commissioning-for-Better-Outcomes.pdf
Department for Education (2010) The Importance of Teaching: Schools White Paper. Online at http://www.education.gov.uk/schools/toolsandinitiatives/schoolswhitepaper/b0068570/the-importance-of-teaching
Department for Education, Looked After Children Statistics 2011. http://www.education.gov.uk/rsgateway/DB/SFR/s001026/index.shtml
Emmerson, C., Johnson, P. and Miller, H. (eds) (2012) The IFS Green Budget: February 2012, Institute for Fiscal Studies. Online at http://www.ifs.org.uk/budgets/gb2012/gb2012.pdf
Family and Parenting Institute (2012), The Impact of Austerity Measures on Households with Children, Analysis by Browne, J., Institute
for Fiscal Studies. Online at http://www.familyandparenting.org/our_work/

72
REFERENCES
Families-in-the-Age-of-Austerity/New+IFS+report+reveals+impact+of+austerity+on+families
Hastings, A., Bramley, G., Bailey, N. and Watkins, D. (2012) Serving deprived communities in a recession, Joseph Rowntree Foundation. Online at http://www.jrf.org.uk/sites/files/jrf/communities-recession-services-full.pdf
Higgs, L. (2011) ‘Exclusive survey: youth services and children’s centres worst hit as cuts average 13 per cent in one year’, Children and Young People Now, January 2011.
Local Government Association (2010) Briefing: The Spending Review 2010.
Munro, E. (2011) The Munro Review of Child Protection: Final report – a child-centred system, Department for Education. Online at https://www.education.gov.uk/publications/standard/AllPublicationsNoRsg/Page1/CM%208062
National Council for Voluntary Youth Services (2010) Comprehensive Cuts: Report on funding changes in the voluntary and community youth sector, October 2010. Online at http://ncvys.org.uk/UserFiles/Comprehensive Cuts.pdf
RSA and Local Government Information Unit (2012) ‘Councils cut the fat but cracks are beginning to show’, press release. Online at <http://www.thersa.org/about-us/media/press-releases/councils-cut-the-fat-but-cracks-are-beginning-to-show>

FAMILIES ON THE FRONT LINE? Local spending on children’s services in austerity
Family and Parenting Institute
This report seeks to understand decisions being made about spending on local services from the perspective of families and children, presenting the findings of one strand of the Family and Parenting Institute’s research programme Families in the Age of Austerity. It analyses local authority spending during a period of upheaval for children’s services, as budget constraints collide with new policy pressures and rising demand among local populations. Drawing on a sample of eight local authorities in England, researchers from ESRO undertook analysis of data on revenue spending in Children’s Services departments across two budget cycles: the financial years of 2011–12 and 2012–13. This analysis is brought together with qualitative interviews carried out with a number of officers responsible for strategy and service delivery. The report identifies which service areas were more affected by revenue spending reductions and which appeared to be more protected, and explores how local authorities were developing and implementing their strategies. It finds that funding constraints were serving as a driver for significant change at the local level and identifies instances of ‘innovation in austerity’. However, it also warns that a number of the spending cutbacks being made could give rise to unintended consequences for families and that further savings will be much harder to find.
Family and Parenting Institute is the operating name of the National Family and Parenting Institute (NFPI). NFPI is a company limited by guarantee, registered in England and Wales. Registered Company No. 3753345. VAT Registration No. 833024365. Registered Office: 430 Highgate Studios, 53–79 Highgate Road, London NW5 1TL. Registered charity No. 1077444.
Family and Parenting Institute430 Highgate Studios, 53–79 Highgate Road, London NW5 1TL
Tel 020 7424 3460 Fax 020 7485 3590 Email [email protected] Web www.familyandparenting.org
Free updateswww.familyandparenting.org/keepupdated


