Falsehoods perpetrated by GM technology bashers on GM mustard
33
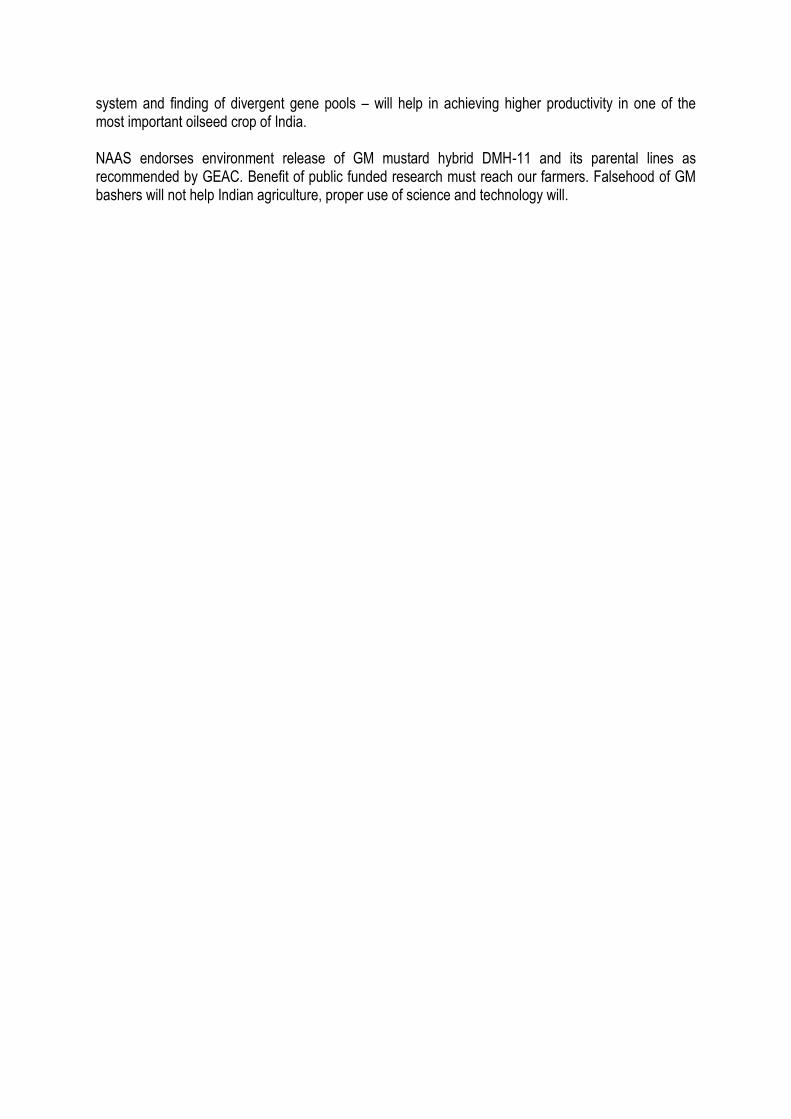
Falsehoods perpetrated by GM technology bashers on GM mustard A report by NAAS scientists The General Body of the National Academy of Agricultural Sciences (NAAS) in its annual meeting on June 5, 2017 passed a resolution supporting the decision of the Genetic Engineering Appraisal Committee (GEAC) recommending environmental (commercial) release of GM mustard hybrid DMH-11 and its parental lines (Annexure 1 ). An overwhelming majority of the fellows in attendance were deeply concerned about unscientific and ill-motivated attacks on the use of GM technology for improving the edible oil economy of the country. Ever since the Government of India activated decision making process by the regulatory bodies – hard- core GM technology bashers have been very active in spreading lies and fears on GM crops – particularly mustard. In some recent write-ups – GM bashers have tried to show that the opposition to the release is based on scientific data. Such arguments are open to analysis. President, NAAS, requested Prof. R B Singh (past-President NAAS) and a few other colleagues to analyse the arguments put-forth by GM bashers purely from a scientific perspective. The broad conclusion is that almost all the negative reports on GM mustard appearing on websites, newspapers and letters to the Ministers and PMO are fallacious, wilfully distort scientific data and have been made with the sole intention of scuttling the use of a technology which could be of great interest and value to the country. Here is an analysis of some of the arguments. In some recent articles GM bashers have compared yields of rapeseed (a sister crop of mustard) in Europe, Canada, USA, China and India. Presented graphs show that non-GM rapeseed in Europe yields upto 3.9 tons/hectare while GM rapeseed in Canada yields only 1.9 tons/hectare. Their argument is – that GM is of no value. While the data taken from FAO stats is correct – the interpretation is dead wrong. In Europe rapeseed is a 300 day crop, in Canada it is a 120 day crop. Yields of the two cannot be compared. This argument is a wilful misrepresentation of scientific facts (Annexure 2 ). The argument was first made by an international level anti-GM activist Colin Todhunter – and subsequently advanced by many others including T S R Subramanian (Hindu, May 25, 2017) and a member of NAAS, Prof P C Kesavan in his letter to the President , NAAS. Another charge being made ad nauseam is that BRL-I and BRL-II (Biosafety Research Level I and II) field trials conducted in the years 2010-11, 2011-12 and 2014-15 were not adequate for yield assessment of hybrid DMH-11 as the national check Kranti was not included in the trials. The claim is that the country will not benefit from the release of DMH-11. An involved analysis of the data generated in the trials conducted by ICAR-AICRP-RM (All India Coordinated Research project – Rapeseed/Mustard) in the last eight years clearly shows that national check Kranti and zonal check RL-1359, both tested at the same 51 locations for yield in zone II, have very similar weighted mean yields (Annexure 3 ). Kranti was not an entry in the BRL trials – RL-1359 was – and served as an appropriate check. Yield of hybrid DMH-11 was around 35% more that RL-1359 in the BRL trials – a significant increase for a first generation hybrid (Annexure 4 ). The argument that BRL trials were not adequate for assessing the yield potential of hybrid DMH-11 is nothing but mischief. The first rapeseed hybrid released in Canada using a GM technology similar to what has been used in mustard yielded only around 13% more than the Canadian mega variety Westar. In 2008, a hybrid was released with close to 46% yield advantage over Westar. A robust hybrid seed production system is a one-time breakthrough – finding and breeding parental lines for developing hybrids with higher yields is an ongoing exercise. This is text book knowledge in plant breeding.
Transcript of Falsehoods perpetrated by GM technology bashers on GM mustard
Falsehoods perpetrated by GM technology bashers on GM mustard A report by NAAS scientists The General Body of the National Academy of Agricultural Sciences (NAAS) in its annual meeting on June 5, 2017 passed a resolution supporting the decision of the Genetic Engineering Appraisal Committee (GEAC) recommending environmental (commercial) release of GM mustard hybrid DMH-11 and its parental lines (Annexure 1). An overwhelming majority of the fellows in attendance were deeply concerned about unscientific and ill-motivated attacks on the use of GM technology for improving the edible oil economy of the country. Ever since the Government of India activated decision making process by the regulatory bodies – hard-core GM technology bashers have been very active in spreading lies and fears on GM crops – particularly mustard. In some recent write-ups – GM bashers have tried to show that the opposition to the release is based on scientific data. Such arguments are open to analysis. President, NAAS, requested Prof. R B Singh (past-President NAAS) and a few other colleagues to analyse the arguments put-forth by GM bashers purely from a scientific perspective. The broad conclusion is that almost all the negative reports on GM mustard appearing on websites, newspapers and letters to the Ministers and PMO are fallacious, wilfully distort scientific data and have been made with the sole intention of scuttling the use of a technology which could be of great interest and value to the country. Here is an analysis of some of the arguments.
In some recent articles GM bashers have compared yields of rapeseed (a sister crop of mustard) in Europe, Canada, USA, China and India. Presented graphs show that non-GM rapeseed in Europe yields upto 3.9 tons/hectare while GM rapeseed in Canada yields only 1.9 tons/hectare. Their argument is – that GM is of no value. While the data taken from FAO stats is correct – the interpretation is dead wrong. In Europe rapeseed is a 300 day crop, in Canada it is a 120 day crop. Yields of the two cannot be compared. This argument is a wilful misrepresentation of scientific facts (Annexure 2). The argument was first made by an international level anti-GM activist Colin Todhunter – and subsequently advanced by many others including T S R Subramanian (Hindu, May 25, 2017) and a member of NAAS, Prof P C Kesavan in his letter to the President , NAAS.
Another charge being made ad nauseam is that BRL-I and BRL-II (Biosafety Research Level I and II) field trials conducted in the years 2010-11, 2011-12 and 2014-15 were not adequate for yield assessment of hybrid DMH-11 as the national check Kranti was not included in the trials. The claim is that the country will not benefit from the release of DMH-11. An involved analysis of the data generated in the trials conducted by ICAR-AICRP-RM (All India Coordinated Research project – Rapeseed/Mustard) in the last eight years clearly shows that national check Kranti and zonal check RL-1359, both tested at the same 51 locations for yield in zone II, have very similar weighted mean yields (Annexure 3). Kranti was not an entry in the BRL trials – RL-1359 was – and served as an appropriate check. Yield of hybrid DMH-11 was around 35% more that RL-1359 in the BRL trials – a significant increase for a first generation hybrid (Annexure 4). The argument that BRL trials were not adequate for assessing the yield potential of hybrid DMH-11 is nothing but mischief.
The first rapeseed hybrid released in Canada using a GM technology similar to what has been used in mustard yielded only around 13% more than the Canadian mega variety Westar. In 2008, a hybrid was released with close to 46% yield advantage over Westar. A robust hybrid seed production system is a one-time breakthrough – finding and breeding parental lines for developing hybrids with higher yields is an ongoing exercise. This is text book knowledge in plant breeding.

It has also been alleged that some of the new varieties outperform hybrid DMH-11. Some disgruntled scientists are also part of this campaign – comparing yields from different trials without referring to a common entry – a national or a zonal check; such comparisons are scientifically infructuous (Annexure 5). An analysis of the post-release yield data of the new varieties shows that these are more or less at par in yield with the current national check – Kranti (Annexure 6). As a consequence, Kranti released in 1983 still remains the national check. Further, there is no significant seed indent for the new varieties and the old varieties Varuna (released in 1976) and Pusa Bold (released in 1984) still remain the most popular public system varieties amongst the farmers (Annexure 7).
Contrary to GM basher’s propaganda – that very high diversity is available in Indian mustard – scientific analysis has shown that the Indian gene pool of mustard is very narrow. As a consequence, inspite of extensive efforts by our plant breeders – there is very little impact of pure-line breeding on mustard yields in recent years (Annexure 8). The only way out of the current yield stagnation is to exploit hybrid breeding in mustard. Currently, in rapeseed growing countries – 86 % of the area in Canada, 80% of the area in China and 90% of the area in Europe is under hybrids. We have been lagging behind because of lack of a robust system for hybrid seed production in mustard which is available now and has been cleared by GEAC for environmental release.
The biggest misrepresentation being carried out is – the hybrid contains a herbicide resistance conferring transgene; therefore, farmers will use the herbicide and lakhs of landless workers will lose their livelihoods. Yes, the used GM technology contains a gene that confers resistance to herbicide glufosinate – the hard fact is that herbicide use is required only for hybrid seed production and permission is being sought from the Ministry of Agriculture only for this limited use. The debate on using HT crops for protection against weeds and for conservation tillage is still an open question in India and will have to be decided by the Central Government at an appropriate time.
Another myth being conjured is genetic pollution of existing varieties. All varieties are multiplied in isolation of 100-200 meters to maintain seed purity following well established ICAR guidelines. Transgenes do not jump out of a plant and spread. Their spread follows well established models of population genetics. Genes that confer high selective advantage will spread in the population at a very fast rate. As herbicide is not going to be used in the farmer’s field growing mustard hybrids and there are no feral populations of wild mustard in the fields of mustard crop – the arguments on spread of herbicide resistance gene are complete falsehoods and part of a vicious propaganda to scare.
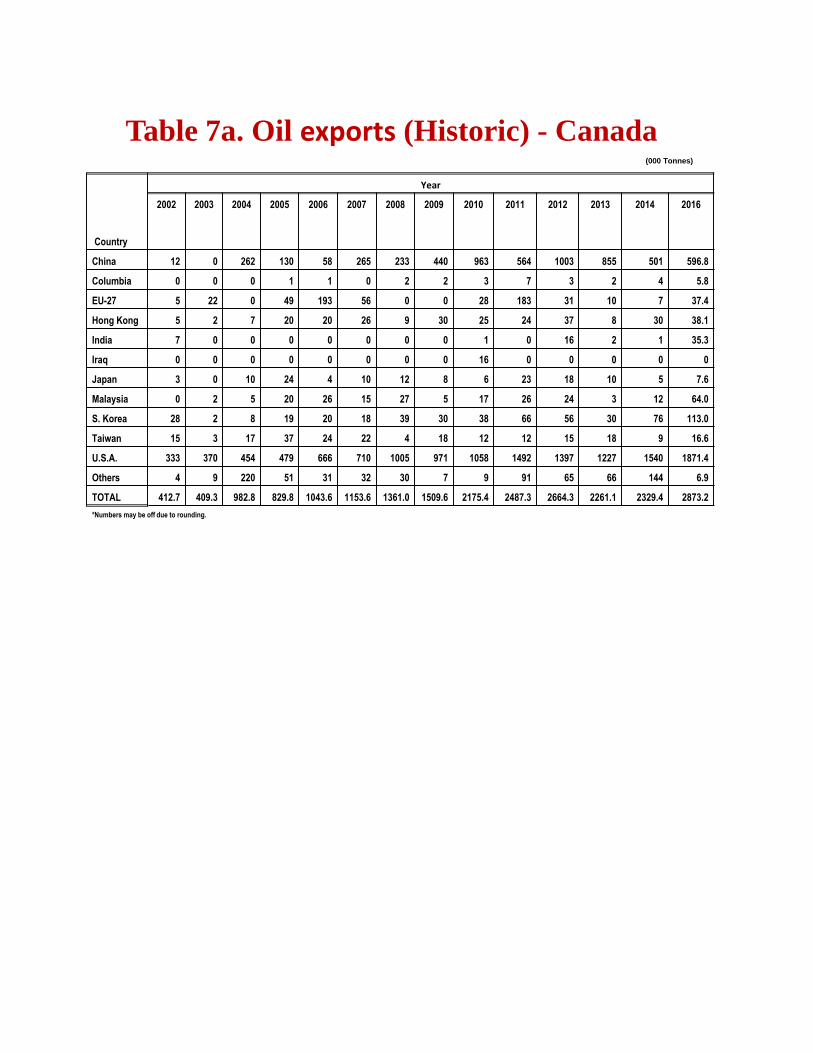
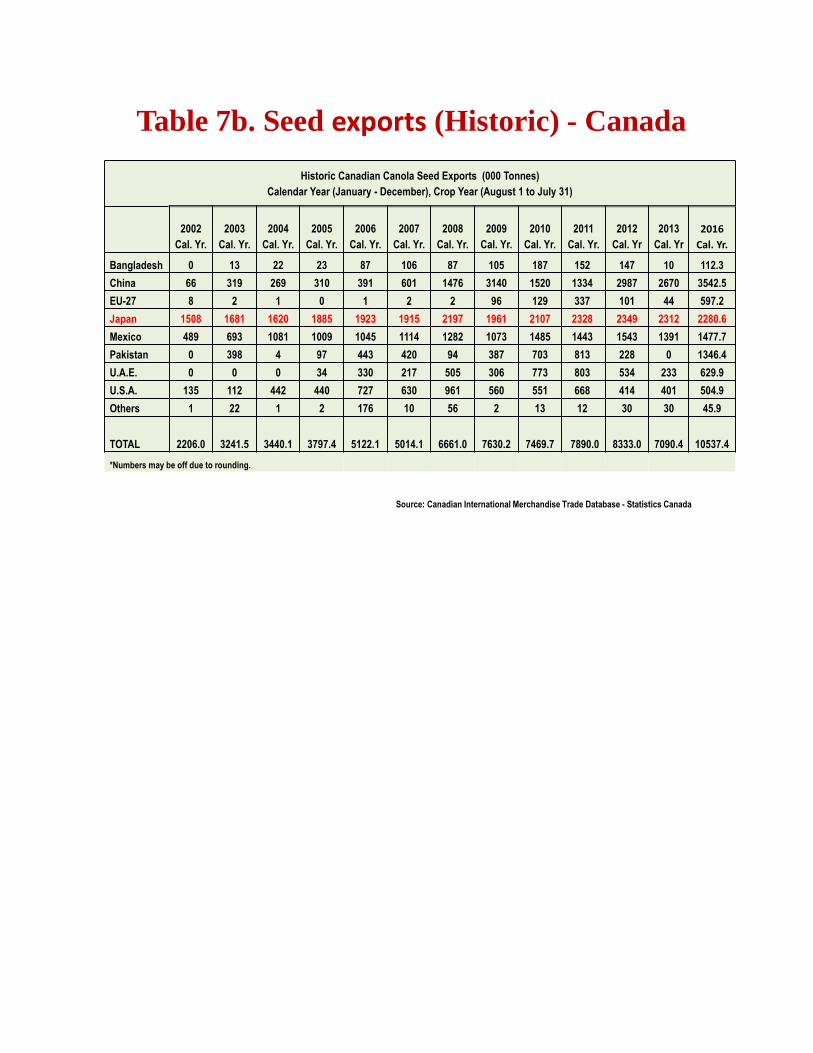
GM method of hybrid seed production used in mustard was introduced in the sister crop rapeseed in Canada in 1996 and later in USA and Australia after very involved biosafety studies. Inspite of almost 20 years of prior safe consumption record – all the biosafety studies stipulated by GoI have been carried out on GM mustard. Since 1996, huge amount of oil and seed meal extracted from GM rapeseed has been consumed worldwide – oil by human beings, meal by livestock. In 2016 alone, Canada exported 10.5 MT of seed, 2.8 MT of oil and 4.4 MT of seed meal of rapeseed to many countries around the world, including Japan and India (Annexure 9). There are no reports of ill-effects from any of the growing or consuming countries. If there are any such reports – why GM bashers are not bringing these to public attention? They cannot – as no such reports exist.
Productivity of oilseed crops is stagnating in India for more than ten years (Annexure 10). Last financial year we imported around Rs. 68,000 crore worth of edible oils (Annexure 11). This amount should have been earned by our farmers. Our national goal should be to double the edible oil production in the country in the next ten years. Developments in mustard breeding – a robust hybrid seed production
system and finding of divergent gene pools – will help in achieving higher productivity in one of the most important oilseed crop of India. NAAS endorses environment release of GM mustard hybrid DMH-11 and its parental lines as recommended by GEAC. Benefit of public funded research must reach our farmers. Falsehood of GM bashers will not help Indian agriculture, proper use of science and technology will.

Annexure 1 Resolution passed by NAAS General Body in its meeting held on June 5, 2017.

National Academy of Agricultural Sciences (NAAS), New Delhi
Resolution on Commercialization of GM Mustard
Adopted at the 24th Annual General Body Meeting of the Academy
June 5, 2017
Whereas, The National Academy of Agricultural Sciences (NAAS), presently comprising nearly 625
Fellows, is the national think-tank for analyzing technological, socio-economic, and eco-environmental
aspects of agricultural and food systems transformation and for suggesting holistic solutions for
sustained, inclusive and accelerated agriculture-led development;
Whereas, The best bet for alleviating the stubbornly high incidences of hunger, undernutrition, and
poverty in an agriculturally important country like India, and that efficacy of such an agriculture will be
underpinned by the development of ever-improving technologies and technological innovations as well
as their effective adoption to produce More from Less for More (MLM);
Whereas, Despite ushering in the Green Revolution during the past 50 years and achieving food self-
sufficiency and Right to Food based on home-grown food and becoming a formidable exporter of rice,
cotton and other commodities, the situation of edible oilseeds remains gloomy;
Whereas, India meets 60% of its demand for edible oils through imports, costing nearly Rs. 80,000
crore annually, let alone the opportunity lost for the farmers to enhance their agricultural productivity
and income, and national average yield of oilseed crops is low and sluggish;
Whereas, Brassica/rapeseed mustard is an important oilseed crop of India, occupying 6.6 million
hectares of the 33 m ha global area, of which 8.5 m ha in Australia, Canada, and USA is under GE
Mustard, and farmers in these countries have been reaping socio-economic and environmental benefits
from GM canola since 1996, rendering Canada as the foremost exporter to India;
Whereas, In order to enable India also to benefit from GM mustard, our scientists have toiled hard
during the past 20 years to develop promising biotech mustard varieties, such as mustard hybrid DMH-
11, using barnase-barstar system to produce stable male sterile and fertility restorer lines for hybrid
seed production;
Whereas, In field trials, DMH-11 has out-yielded the national and zonal checks by 20 to 30%, and
future breeding using these two transgenic events will provide mustard hybrids with canola quality and
better yield through mustering extensive diversity available in mustard in the country for creating
progressively higher yielding superior multi-trait hybrids;
Whereas, Appreciating that regulatory approval is an essential requirement for commercialization of GE
crops, India has developed a multi-tier regulatory system, which is one of the most robust regulatory
systems in the world to address the biosafety and environmental concerns;
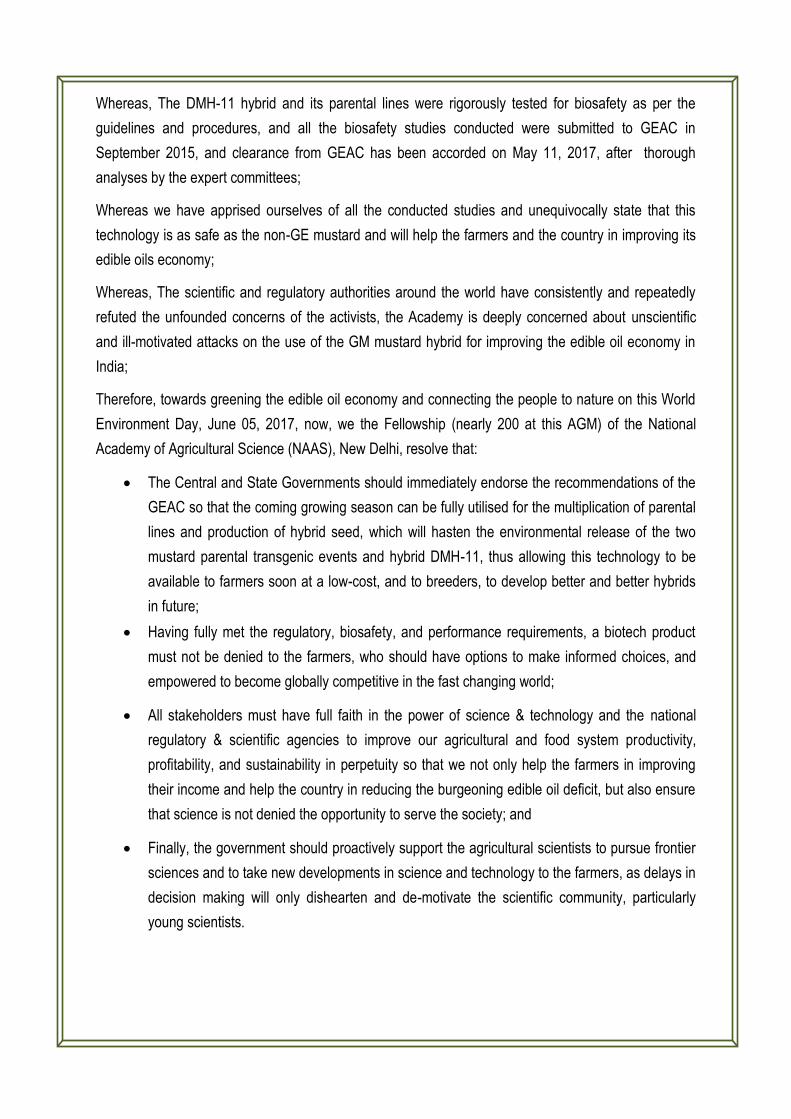
Whereas, The DMH-11 hybrid and its parental lines were rigorously tested for biosafety as per the
guidelines and procedures, and all the biosafety studies conducted were submitted to GEAC in
September 2015, and clearance from GEAC has been accorded on May 11, 2017, after thorough
analyses by the expert committees;
Whereas we have apprised ourselves of all the conducted studies and unequivocally state that this
technology is as safe as the non-GE mustard and will help the farmers and the country in improving its
edible oils economy;
Whereas, The scientific and regulatory authorities around the world have consistently and repeatedly
refuted the unfounded concerns of the activists, the Academy is deeply concerned about unscientific
and ill-motivated attacks on the use of the GM mustard hybrid for improving the edible oil economy in
India;
Therefore, towards greening the edible oil economy and connecting the people to nature on this World
Environment Day, June 05, 2017, now, we the Fellowship (nearly 200 at this AGM) of the National
Academy of Agricultural Science (NAAS), New Delhi, resolve that:
The Central and State Governments should immediately endorse the recommendations of the
GEAC so that the coming growing season can be fully utilised for the multiplication of parental
lines and production of hybrid seed, which will hasten the environmental release of the two
mustard parental transgenic events and hybrid DMH-11, thus allowing this technology to be
available to farmers soon at a low-cost, and to breeders, to develop better and better hybrids
in future;
Having fully met the regulatory, biosafety, and performance requirements, a biotech product
must not be denied to the farmers, who should have options to make informed choices, and
empowered to become globally competitive in the fast changing world;
All stakeholders must have full faith in the power of science & technology and the national
regulatory & scientific agencies to improve our agricultural and food system productivity,
profitability, and sustainability in perpetuity so that we not only help the farmers in improving
their income and help the country in reducing the burgeoning edible oil deficit, but also ensure
that science is not denied the opportunity to serve the society; and
Finally, the government should proactively support the agricultural scientists to pursue frontier
sciences and to take new developments in science and technology to the farmers, as delays in
decision making will only dishearten and de-motivate the scientific community, particularly
young scientists.

Annexure 2 Contains a Figure (Fig 1) used by GM bashers – comparing yields of rapeseed (Brassica napus) in Europe, Canada, USA, India and China showing non-GM rapeseed in Europe yielding more than GM rapeseed in Canada. An analysis of the data is given along with the figure.
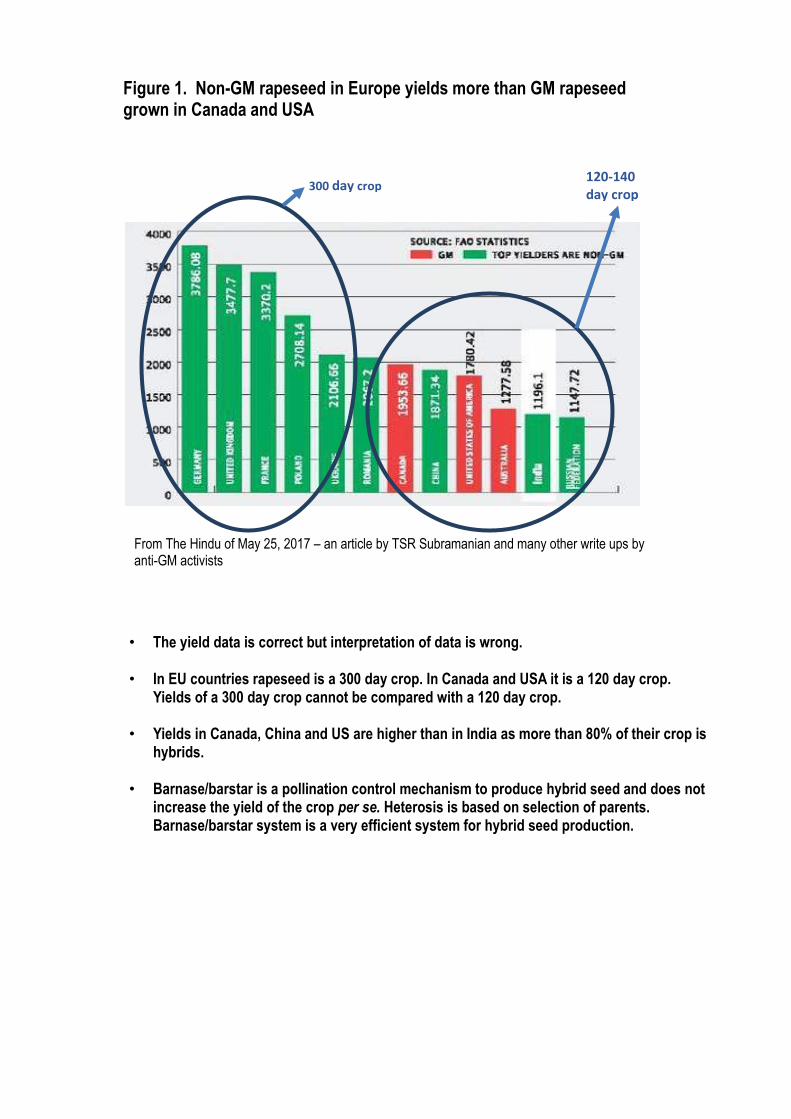
From The Hindu of May 25, 2017 – an article by TSR Subramanian and many other write ups by anti-GM activists
300 day crop 120-140 day crop
Figure 1. Non-GM rapeseed in Europe yields more than GM rapeseed grown in Canada and USA
• The yield data is correct but interpretation of data is wrong.
• In EU countries rapeseed is a 300 day crop. In Canada and USA it is a 120 day crop. Yields of a 300 day crop cannot be compared with a 120 day crop.
• Yields in Canada, China and US are higher than in India as more than 80% of their crop is hybrids.
• Barnase/barstar is a pollination control mechanism to produce hybrid seed and does not increase the yield of the crop per se. Heterosis is based on selection of parents. Barnase/barstar system is a very efficient system for hybrid seed production.
Annexure 3 Data from ICAR-AICRP trials on rapeseed/mustard comparing – yield of national check and zonal checks. Table 1 - Comparison of yield of Kranti (National check) with RL-1359 (Zonal check)
in zone-II. Table 2 - Comparison of yield of Kranti (National check) with Maya (Zonal check) in zone-III.
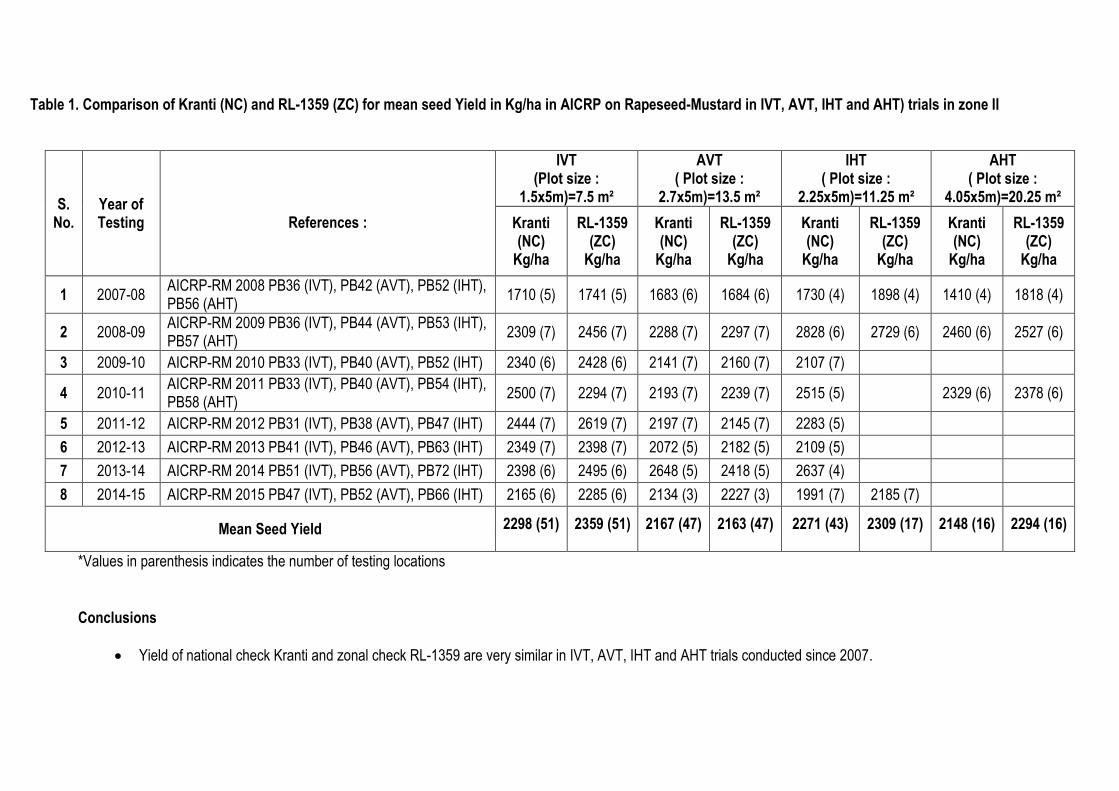
Table 1. Comparison of Kranti (NC) and RL-1359 (ZC) for mean seed Yield in Kg/ha in AICRP on Rapeseed-Mustard in IVT, AVT, IHT and AHT) trials in zone II
*Values in parenthesis indicates the number of testing locations
Conclusions
Yield of national check Kranti and zonal check RL-1359 are very similar in IVT, AVT, IHT and AHT trials conducted since 2007.
S. No.
Year of Testing
References :
IVT (Plot size :
1.5x5m)=7.5 m²
AVT ( Plot size :
2.7x5m)=13.5 m²
IHT ( Plot size :
2.25x5m)=11.25 m²
AHT ( Plot size :
4.05x5m)=20.25 m²
Kranti (NC)
Kg/ha
RL-1359 (ZC)
Kg/ha
Kranti (NC)
Kg/ha
RL-1359 (ZC)
Kg/ha
Kranti (NC)
Kg/ha
RL-1359 (ZC)
Kg/ha
Kranti (NC)
Kg/ha
RL-1359 (ZC)
Kg/ha
1 2007-08 AICRP-RM 2008 PB36 (IVT), PB42 (AVT), PB52 (IHT), PB56 (AHT)
1710 (5) 1741 (5) 1683 (6) 1684 (6) 1730 (4) 1898 (4) 1410 (4) 1818 (4)
2 2008-09 AICRP-RM 2009 PB36 (IVT), PB44 (AVT), PB53 (IHT), PB57 (AHT)
2309 (7) 2456 (7) 2288 (7) 2297 (7) 2828 (6) 2729 (6) 2460 (6) 2527 (6)
3 2009-10 AICRP-RM 2010 PB33 (IVT), PB40 (AVT), PB52 (IHT) 2340 (6) 2428 (6) 2141 (7) 2160 (7) 2107 (7)
4 2010-11 AICRP-RM 2011 PB33 (IVT), PB40 (AVT), PB54 (IHT), PB58 (AHT)
2500 (7) 2294 (7) 2193 (7) 2239 (7) 2515 (5)
2329 (6) 2378 (6)
5 2011-12 AICRP-RM 2012 PB31 (IVT), PB38 (AVT), PB47 (IHT) 2444 (7) 2619 (7) 2197 (7) 2145 (7) 2283 (5)
6 2012-13 AICRP-RM 2013 PB41 (IVT), PB46 (AVT), PB63 (IHT) 2349 (7) 2398 (7) 2072 (5) 2182 (5) 2109 (5)
7 2013-14 AICRP-RM 2014 PB51 (IVT), PB56 (AVT), PB72 (IHT) 2398 (6) 2495 (6) 2648 (5) 2418 (5) 2637 (4)
8 2014-15 AICRP-RM 2015 PB47 (IVT), PB52 (AVT), PB66 (IHT) 2165 (6) 2285 (6) 2134 (3) 2227 (3) 1991 (7) 2185 (7)
Mean Seed Yield 2298 (51) 2359 (51) 2167 (47) 2163 (47) 2271 (43) 2309 (17) 2148 (16) 2294 (16)
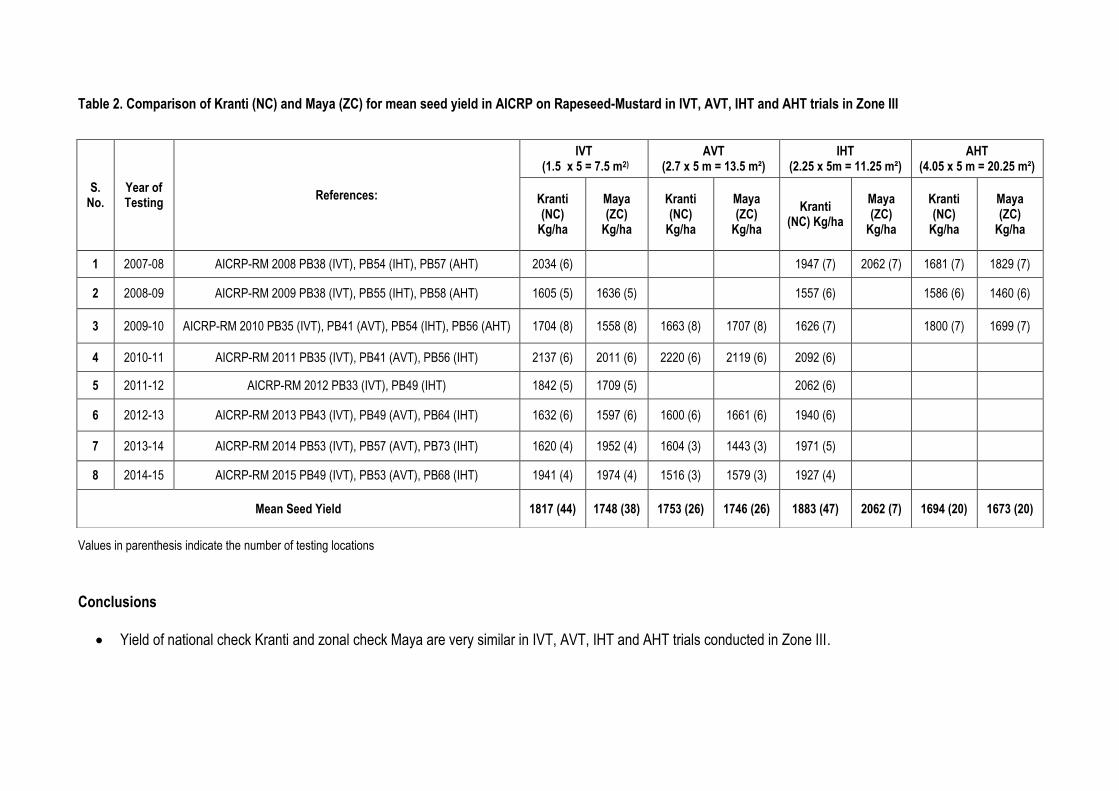
Table 2. Comparison of Kranti (NC) and Maya (ZC) for mean seed yield in AICRP on Rapeseed-Mustard in IVT, AVT, IHT and AHT trials in Zone III
Values in parenthesis indicate the number of testing locations
Conclusions
Yield of national check Kranti and zonal check Maya are very similar in IVT, AVT, IHT and AHT trials conducted in Zone III.
S. No.
Year of Testing
References:
IVT (1.5 x 5 = 7.5 m2)
AVT (2.7 x 5 m = 13.5 m²)
IHT (2.25 x 5m = 11.25 m²)
AHT (4.05 x 5 m = 20.25 m²)
Kranti (NC)
Kg/ha
Maya (ZC)
Kg/ha
Kranti (NC)
Kg/ha
Maya (ZC)
Kg/ha
Kranti (NC) Kg/ha
Maya (ZC)
Kg/ha
Kranti (NC)
Kg/ha
Maya (ZC)
Kg/ha
1 2007-08 AICRP-RM 2008 PB38 (IVT), PB54 (IHT), PB57 (AHT) 2034 (6) 1947 (7) 2062 (7) 1681 (7) 1829 (7)
2 2008-09 AICRP-RM 2009 PB38 (IVT), PB55 (IHT), PB58 (AHT) 1605 (5) 1636 (5) 1557 (6) 1586 (6) 1460 (6)
3 2009-10 AICRP-RM 2010 PB35 (IVT), PB41 (AVT), PB54 (IHT), PB56 (AHT) 1704 (8) 1558 (8) 1663 (8) 1707 (8) 1626 (7) 1800 (7) 1699 (7)
4 2010-11 AICRP-RM 2011 PB35 (IVT), PB41 (AVT), PB56 (IHT) 2137 (6) 2011 (6) 2220 (6) 2119 (6) 2092 (6)
5 2011-12 AICRP-RM 2012 PB33 (IVT), PB49 (IHT) 1842 (5) 1709 (5) 2062 (6)
6 2012-13 AICRP-RM 2013 PB43 (IVT), PB49 (AVT), PB64 (IHT) 1632 (6) 1597 (6) 1600 (6) 1661 (6) 1940 (6)
7 2013-14 AICRP-RM 2014 PB53 (IVT), PB57 (AVT), PB73 (IHT) 1620 (4) 1952 (4) 1604 (3) 1443 (3) 1971 (5)
8 2014-15 AICRP-RM 2015 PB49 (IVT), PB53 (AVT), PB68 (IHT) 1941 (4) 1974 (4) 1516 (3) 1579 (3) 1927 (4)
Mean Seed Yield 1817 (44) 1748 (38) 1753 (26) 1746 (26) 1883 (47) 2062 (7) 1694 (20) 1673 (20)

Annexure 4 Contains a Table (Table 3) giving data on performance of GM hybrid DMH-11 and its parental lines. Variety RL-1359 was the zonal check at six out of eight locations, Maya was zonal check at one location.
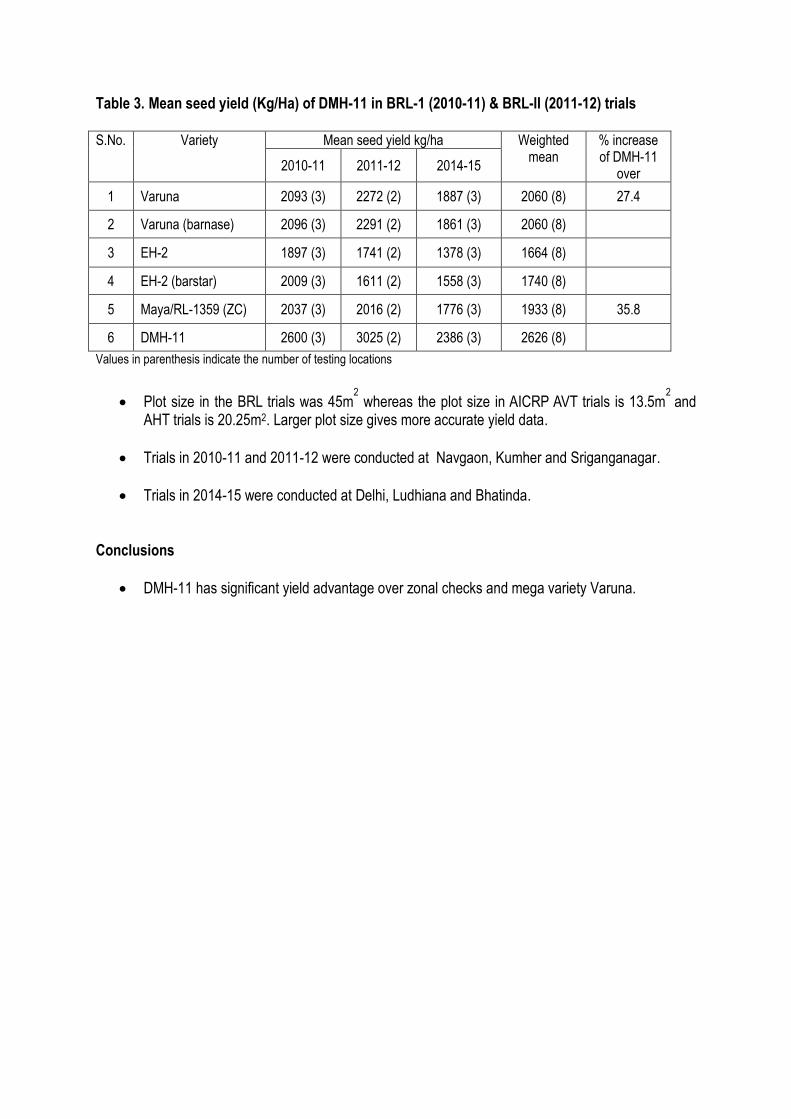
Table 3. Mean seed yield (Kg/Ha) of DMH-11 in BRL-1 (2010-11) & BRL-II (2011-12) trials
S.No. Variety Mean seed yield kg/ha Weighted mean
% increase of DMH-11
over 2010-11 2011-12 2014-15
1 Varuna 2093 (3) 2272 (2) 1887 (3) 2060 (8) 27.4
2 Varuna (barnase) 2096 (3) 2291 (2) 1861 (3) 2060 (8)
3 EH-2 1897 (3) 1741 (2) 1378 (3) 1664 (8)
4 EH-2 (barstar) 2009 (3) 1611 (2) 1558 (3) 1740 (8)
5 Maya/RL-1359 (ZC) 2037 (3) 2016 (2) 1776 (3) 1933 (8) 35.8
6 DMH-11 2600 (3) 3025 (2) 2386 (3) 2626 (8)
Values in parenthesis indicate the number of testing locations
Plot size in the BRL trials was 45m2 whereas the plot size in AICRP AVT trials is 13.5m
2 and
AHT trials is 20.25m2. Larger plot size gives more accurate yield data.
Trials in 2010-11 and 2011-12 were conducted at Navgaon, Kumher and Sriganganagar.
Trials in 2014-15 were conducted at Delhi, Ludhiana and Bhatinda.
Conclusions
DMH-11 has significant yield advantage over zonal checks and mega variety Varuna.
Annexure 5 Contains the following Figures and Tables. Fig 2 - Showing improper comparison between mustard grown under SMI with yields of DMH-1 and
DMH-11. Fig 3 - A misleading comparison of yields of DMH-11 with other hybrids developed using non-GM
(CMS) systems. Table 4 - Original data from NDDB/CGMCP trials showing yield potential of DMH series of hybrids – all
DMH hybrids are based on crosses between Indian x east European lines.
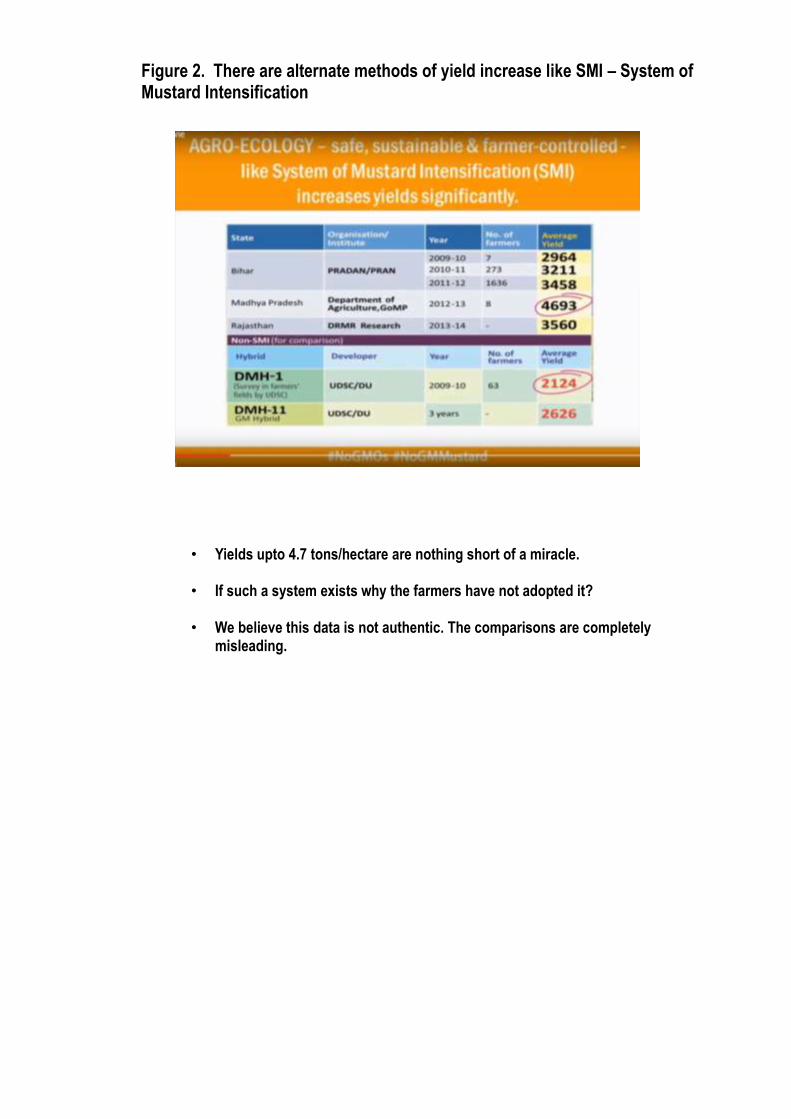
Figure 2. There are alternate methods of yield increase like SMI – System of Mustard Intensification
• Yields upto 4.7 tons/hectare are nothing short of a miracle.
• If such a system exists why the farmers have not adopted it?
• We believe this data is not authentic. The comparisons are completely misleading.
Business Standard: May 16, 2017 by Devinder Sharma and many other write ups
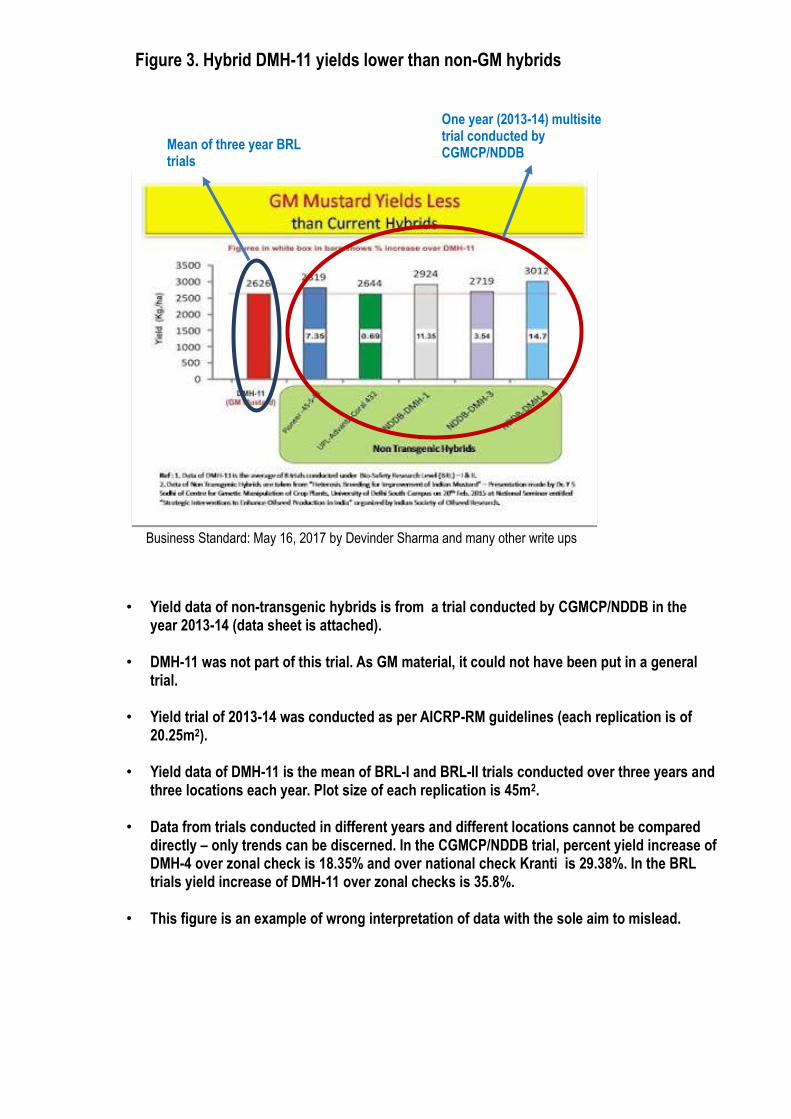
One year (2013-14) multisite trial conducted by CGMCP/NDDB
Mean of three year BRL trials
Figure 3. Hybrid DMH-11 yields lower than non-GM hybrids
• Yield data of non-transgenic hybrids is from a trial conducted by CGMCP/NDDB in the year 2013-14 (data sheet is attached).
• DMH-11 was not part of this trial. As GM material, it could not have been put in a general trial.
• Yield trial of 2013-14 was conducted as per AICRP-RM guidelines (each replication is of 20.25m2).
• Yield data of DMH-11 is the mean of BRL-I and BRL-II trials conducted over three years and three locations each year. Plot size of each replication is 45m2.
• Data from trials conducted in different years and different locations cannot be compared directly – only trends can be discerned. In the CGMCP/NDDB trial, percent yield increase of DMH-4 over zonal check is 18.35% and over national check Kranti is 29.38%. In the BRL trials yield increase of DMH-11 over zonal checks is 35.8%.
• This figure is an example of wrong interpretation of data with the sole aim to mislead.
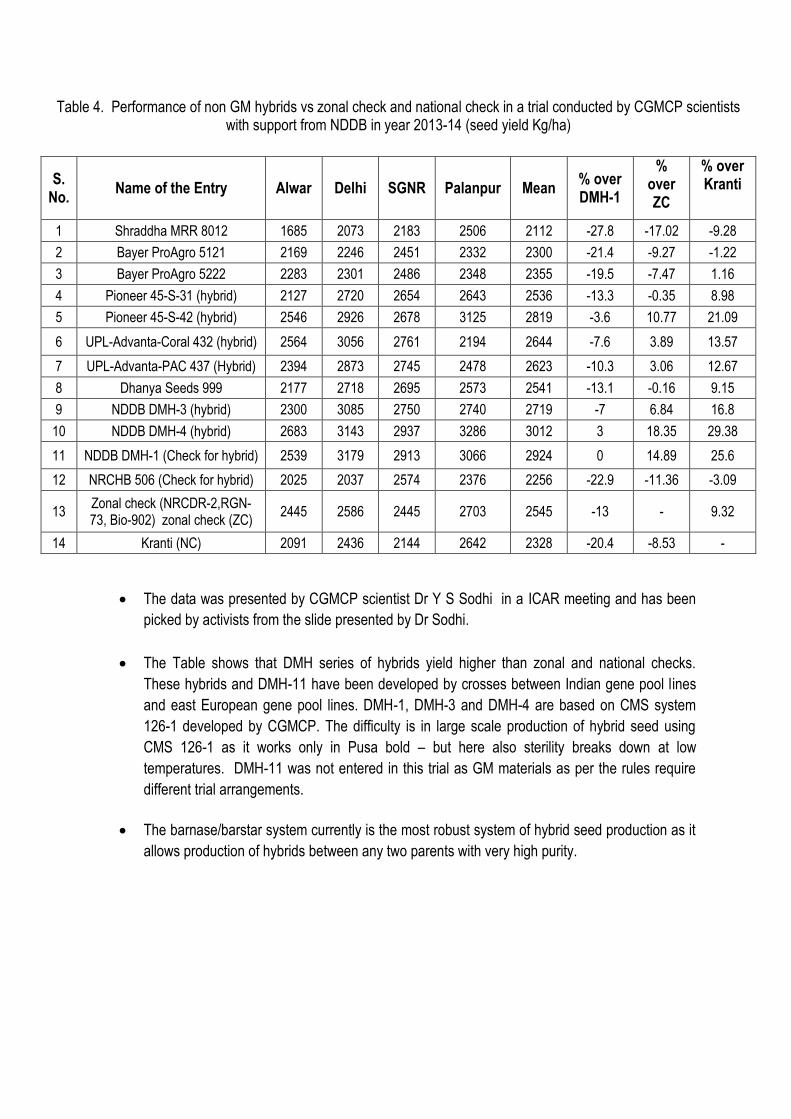
Table 4. Performance of non GM hybrids vs zonal check and national check in a trial conducted by CGMCP scientists with support from NDDB in year 2013-14 (seed yield Kg/ha)
S. No.
Name of the Entry Alwar Delhi SGNR Palanpur Mean % over DMH-1
% over ZC
% over Kranti
1 Shraddha MRR 8012 1685 2073 2183 2506 2112 -27.8 -17.02 -9.28
2 Bayer ProAgro 5121 2169 2246 2451 2332 2300 -21.4 -9.27 -1.22
3 Bayer ProAgro 5222 2283 2301 2486 2348 2355 -19.5 -7.47 1.16
4 Pioneer 45-S-31 (hybrid) 2127 2720 2654 2643 2536 -13.3 -0.35 8.98
5 Pioneer 45-S-42 (hybrid) 2546 2926 2678 3125 2819 -3.6 10.77 21.09
6 UPL-Advanta-Coral 432 (hybrid) 2564 3056 2761 2194 2644 -7.6 3.89 13.57
7 UPL-Advanta-PAC 437 (Hybrid) 2394 2873 2745 2478 2623 -10.3 3.06 12.67
8 Dhanya Seeds 999 2177 2718 2695 2573 2541 -13.1 -0.16 9.15
9 NDDB DMH-3 (hybrid) 2300 3085 2750 2740 2719 -7 6.84 16.8
10 NDDB DMH-4 (hybrid) 2683 3143 2937 3286 3012 3 18.35 29.38
11 NDDB DMH-1 (Check for hybrid) 2539 3179 2913 3066 2924 0 14.89 25.6
12 NRCHB 506 (Check for hybrid) 2025 2037 2574 2376 2256 -22.9 -11.36 -3.09
13 Zonal check (NRCDR-2,RGN-73, Bio-902) zonal check (ZC)
2445 2586 2445 2703 2545 -13 - 9.32
14 Kranti (NC) 2091 2436 2144 2642 2328 -20.4 -8.53 -
The data was presented by CGMCP scientist Dr Y S Sodhi in a ICAR meeting and has been
picked by activists from the slide presented by Dr Sodhi.
The Table shows that DMH series of hybrids yield higher than zonal and national checks.
These hybrids and DMH-11 have been developed by crosses between Indian gene pool lines
and east European gene pool lines. DMH-1, DMH-3 and DMH-4 are based on CMS system
126-1 developed by CGMCP. The difficulty is in large scale production of hybrid seed using
CMS 126-1 as it works only in Pusa bold – but here also sterility breaks down at low
temperatures. DMH-11 was not entered in this trial as GM materials as per the rules require
different trial arrangements.
The barnase/barstar system currently is the most robust system of hybrid seed production as it
allows production of hybrids between any two parents with very high purity.

Annexure 6 Yield data on some of the new varieties of mustard released by ICAR. Table 5a - Yield performance of some of the new varieties in zone-II – both pre-release and post-
release performance is given. Table 5b - Yield performance of a new varieties for zone-III – both pre-release and post-release data
is provided.
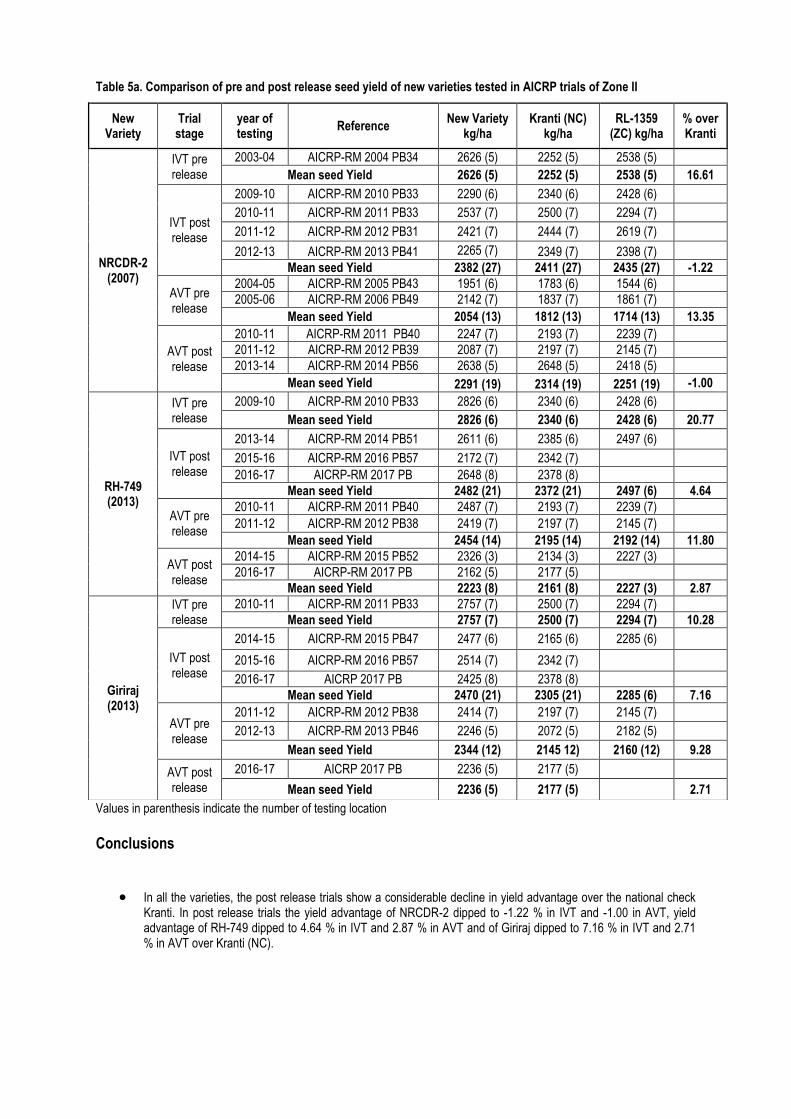
Values in parenthesis indicate the number of testing location Conclusions
In all the varieties, the post release trials show a considerable decline in yield advantage over the national check Kranti. In post release trials the yield advantage of NRCDR-2 dipped to -1.22 % in IVT and -1.00 in AVT, yield advantage of RH-749 dipped to 4.64 % in IVT and 2.87 % in AVT and of Giriraj dipped to 7.16 % in IVT and 2.71 % in AVT over Kranti (NC).
Table 5a. Comparison of pre and post release seed yield of new varieties tested in AICRP trials of Zone II
New Variety
Trial stage
year of testing
Reference New Variety
kg/ha Kranti (NC)
kg/ha RL-1359
(ZC) kg/ha % over Kranti
NRCDR-2 (2007)
IVT pre release
2003-04 AICRP-RM 2004 PB34 2626 (5) 2252 (5) 2538 (5)
Mean seed Yield 2626 (5) 2252 (5) 2538 (5) 16.61
IVT post release
2009-10 AICRP-RM 2010 PB33 2290 (6) 2340 (6) 2428 (6)
2010-11 AICRP-RM 2011 PB33 2537 (7) 2500 (7) 2294 (7)
2011-12 AICRP-RM 2012 PB31 2421 (7) 2444 (7) 2619 (7)
2012-13 AICRP-RM 2013 PB41 2265 (7) 2349 (7) 2398 (7)
Mean seed Yield 2382 (27) 2411 (27) 2435 (27) -1.22
AVT pre release
2004-05 AICRP-RM 2005 PB43 1951 (6) 1783 (6) 1544 (6)
2005-06 AICRP-RM 2006 PB49 2142 (7) 1837 (7) 1861 (7)
Mean seed Yield 2054 (13) 1812 (13) 1714 (13) 13.35
AVT post release
2010-11 AICRP-RM 2011 PB40 2247 (7) 2193 (7) 2239 (7)
2011-12 AICRP-RM 2012 PB39 2087 (7) 2197 (7) 2145 (7)
2013-14 AICRP-RM 2014 PB56 2638 (5) 2648 (5) 2418 (5)
Mean seed Yield 2291 (19) 2314 (19) 2251 (19) -1.00
RH-749 (2013)
IVT pre release
2009-10 AICRP-RM 2010 PB33 2826 (6) 2340 (6) 2428 (6)
Mean seed Yield 2826 (6) 2340 (6) 2428 (6) 20.77
IVT post release
2013-14 AICRP-RM 2014 PB51 2611 (6) 2385 (6) 2497 (6)
2015-16 AICRP-RM 2016 PB57 2172 (7) 2342 (7)
2016-17 AICRP-RM 2017 PB 2648 (8) 2378 (8)
Mean seed Yield 2482 (21) 2372 (21) 2497 (6) 4.64
AVT pre release
2010-11 AICRP-RM 2011 PB40 2487 (7) 2193 (7) 2239 (7)
2011-12 AICRP-RM 2012 PB38 2419 (7) 2197 (7) 2145 (7)
Mean seed Yield 2454 (14) 2195 (14) 2192 (14) 11.80
AVT post release
2014-15 AICRP-RM 2015 PB52 2326 (3) 2134 (3) 2227 (3)
2016-17 AICRP-RM 2017 PB 2162 (5) 2177 (5)
Mean seed Yield 2223 (8) 2161 (8) 2227 (3) 2.87
Giriraj (2013)
IVT pre release
2010-11 AICRP-RM 2011 PB33 2757 (7) 2500 (7) 2294 (7)
Mean seed Yield 2757 (7) 2500 (7) 2294 (7) 10.28
IVT post release
2014-15 AICRP-RM 2015 PB47 2477 (6) 2165 (6) 2285 (6)
2015-16 AICRP-RM 2016 PB57 2514 (7) 2342 (7)
2016-17 AICRP 2017 PB 2425 (8) 2378 (8)
Mean seed Yield 2470 (21) 2305 (21) 2285 (6) 7.16
AVT pre release
2011-12 AICRP-RM 2012 PB38 2414 (7) 2197 (7) 2145 (7)
2012-13 AICRP-RM 2013 PB46 2246 (5) 2072 (5) 2182 (5)
Mean seed Yield 2344 (12) 2145 12) 2160 (12) 9.28
AVT post release
2016-17 AICRP 2017 PB 2236 (5) 2177 (5)
Mean seed Yield 2236 (5) 2177 (5) 2.71
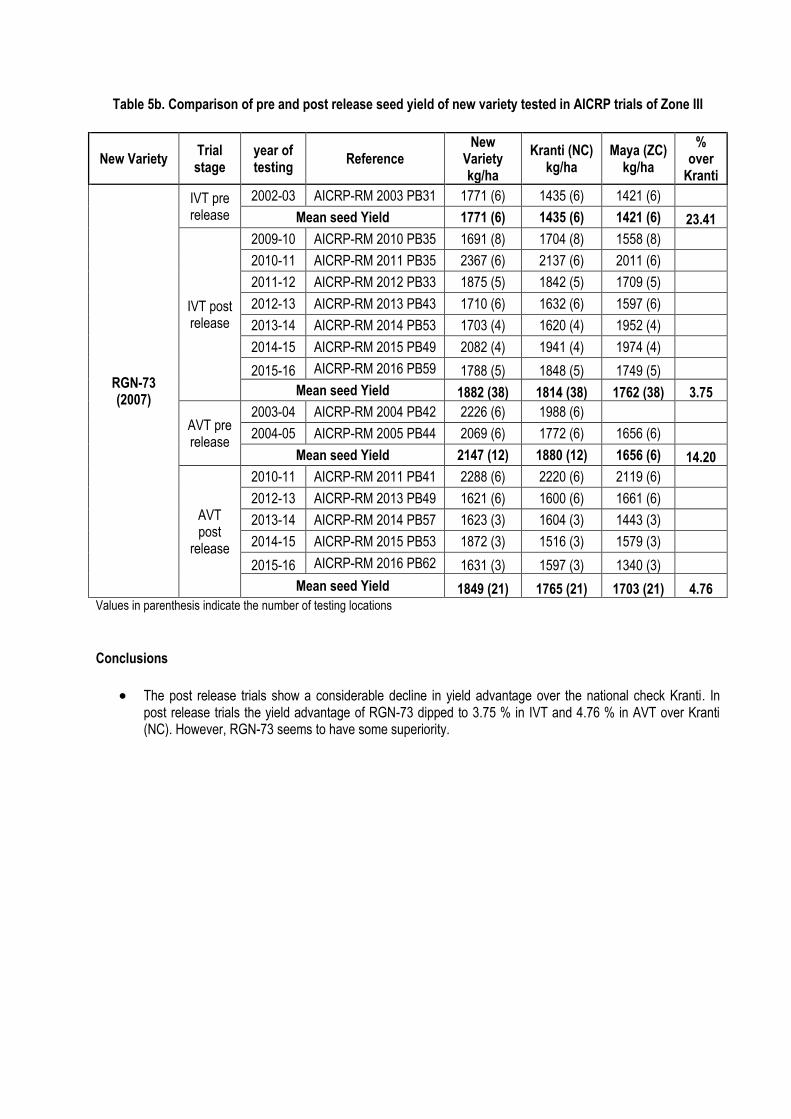
Table 5b. Comparison of pre and post release seed yield of new variety tested in AICRP trials of Zone III
New Variety Trial stage
year of testing
Reference New
Variety kg/ha
Kranti (NC) kg/ha
Maya (ZC) kg/ha
% over
Kranti
RGN-73 (2007)
IVT pre release
2002-03 AICRP-RM 2003 PB31 1771 (6) 1435 (6) 1421 (6)
Mean seed Yield 1771 (6) 1435 (6) 1421 (6) 23.41
IVT post release
2009-10 AICRP-RM 2010 PB35 1691 (8) 1704 (8) 1558 (8)
2010-11 AICRP-RM 2011 PB35 2367 (6) 2137 (6) 2011 (6)
2011-12 AICRP-RM 2012 PB33 1875 (5) 1842 (5) 1709 (5)
2012-13 AICRP-RM 2013 PB43 1710 (6) 1632 (6) 1597 (6)
2013-14 AICRP-RM 2014 PB53 1703 (4) 1620 (4) 1952 (4)
2014-15 AICRP-RM 2015 PB49 2082 (4) 1941 (4) 1974 (4)
2015-16 AICRP-RM 2016 PB59 1788 (5) 1848 (5) 1749 (5)
Mean seed Yield 1882 (38) 1814 (38) 1762 (38) 3.75
AVT pre release
2003-04 AICRP-RM 2004 PB42 2226 (6) 1988 (6)
2004-05 AICRP-RM 2005 PB44 2069 (6) 1772 (6) 1656 (6)
Mean seed Yield 2147 (12) 1880 (12) 1656 (6) 14.20
AVT post
release
2010-11 AICRP-RM 2011 PB41 2288 (6) 2220 (6) 2119 (6)
2012-13 AICRP-RM 2013 PB49 1621 (6) 1600 (6) 1661 (6)
2013-14 AICRP-RM 2014 PB57 1623 (3) 1604 (3) 1443 (3)
2014-15 AICRP-RM 2015 PB53 1872 (3) 1516 (3) 1579 (3)
2015-16 AICRP-RM 2016 PB62 1631 (3) 1597 (3) 1340 (3)
Mean seed Yield 1849 (21) 1765 (21) 1703 (21) 4.76 Values in parenthesis indicate the number of testing locations
Conclusions
The post release trials show a considerable decline in yield advantage over the national check Kranti. In post release trials the yield advantage of RGN-73 dipped to 3.75 % in IVT and 4.76 % in AVT over Kranti (NC). However, RGN-73 seems to have some superiority.

Annexure 7 Contains a Table (Table 6) showing DAC’s (Department of Agriculture and Cooperation) indent for breeder seed of different varieties over the last seven years.

Conclusions
In the last seven years maximum demand seems to be for Pusa bold followed by Varuna.
There is very poor demand for the four new releases – NRCDR-2, RGN-73, RH-749 and Giriraj. Is it due to poor extension or is there some problem with these varieties?
Table 6. Quantity of the breeder seed Indented of Centrally released varieties in quintals
Year of seed Production
Reference : Varuna (1976)
Kranti (1983)
RH-30 (1983)
Pusa Bold
(1984)
Rohini (1986)
Pusa Jai
Kissan (1993)
Maya (2003)
NRCDR-2 (2007)
RGN-73 (2007)
RH-749
(2013)
Giriraj (2013)
2009-10 AICRP-RM 2010 PB 19 1.71 0.55 2.98 12.15 1.42 3.38 1.55 0.20 0.47 - -
2010-11 AICRP-RM 2011 PB 19 3.76 1.30 2.23 8.32 0.74 4.89 1.30 0.53 0.59 - -
2011-12 AICRP-RM 2012 PB 18-19 2.21 1.90 2.16 3.62 1.08 3.79 0.15 0.10 0.41 - -
2012-13 AICRP-RM 2013 PB 21-22 10.26 5.40 2.16 16.18 1.08 6.34 1.65 0.30 0.41 - -
2013-14 AICRP-RM 2014 PB 32-34 1.18 1.40 1.70 13.71 1.53 3.14 0.25 0.10 0.5 0.04 -
2014-15 AICRP-RM 2015 PB 24-26 11.40 0.05 1.84 30.21 3.16 1.66 0.15 0.8 0.27 0.26 0.22
2015-16 AICRP-RM 2016 PB 31-32 3.06 0.00 1.59 7.91 2.43 2.43 0.15 1.6 0.17 0.65 0.02
Mean 5.21 0.48 1.71 17.28 2.37 2.41 0.18 0.83 0.31 0.32 0.12
Annexure 8 Contains data on yield trends in mustard in India and a comparison of rapeseed/mustard yields in Canada, China and India. Fig 4 - Yield trend in mustard in India since 1982-83. Fig 5 - Three country yield comparison of rapeseed/mustard.
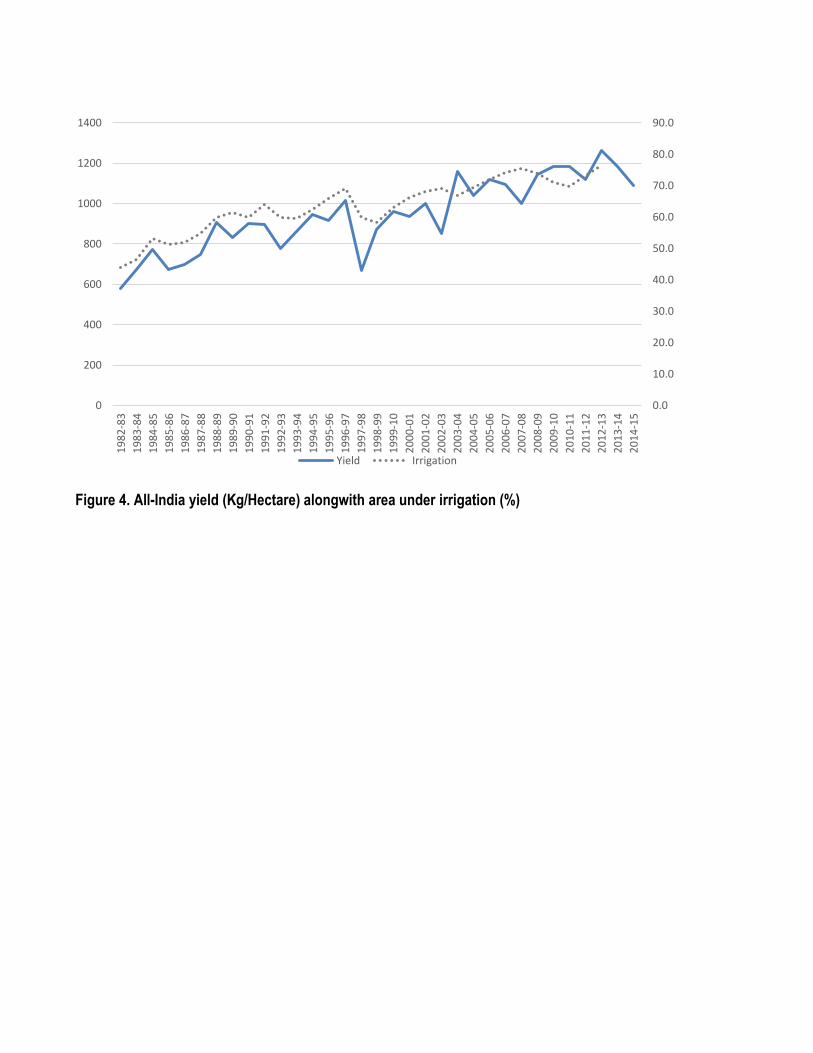
Figure 4. All-India yield (Kg/Hectare) alongwith area under irrigation (%)
0.0
10.0
20.0
30.0
40.0
50.0
60.0
70.0
80.0
90.0
0
200
400
600
800
1000
1200
1400 1
98
2-8
3
19
83
-84
19
84
-85
19
85
-86
19
86
-87
19
87
-88
19
88
-89
19
89
-90
19
90
-91
19
91
-92
19
92
-93
19
93
-94
19
94
-95
19
95
-96
19
96
-97
19
97
-98
19
98
-99
19
99
-10
20
00
-01
20
01
-02
20
02
-03
20
03
-04
20
04
-05
20
05
-06
20
06
-07
20
07
-08
20
08
-09
20
09
-10
20
10
-11
20
11
-12
20
12
-13
20
13
-14
20
14
-15
Yield Irrigation
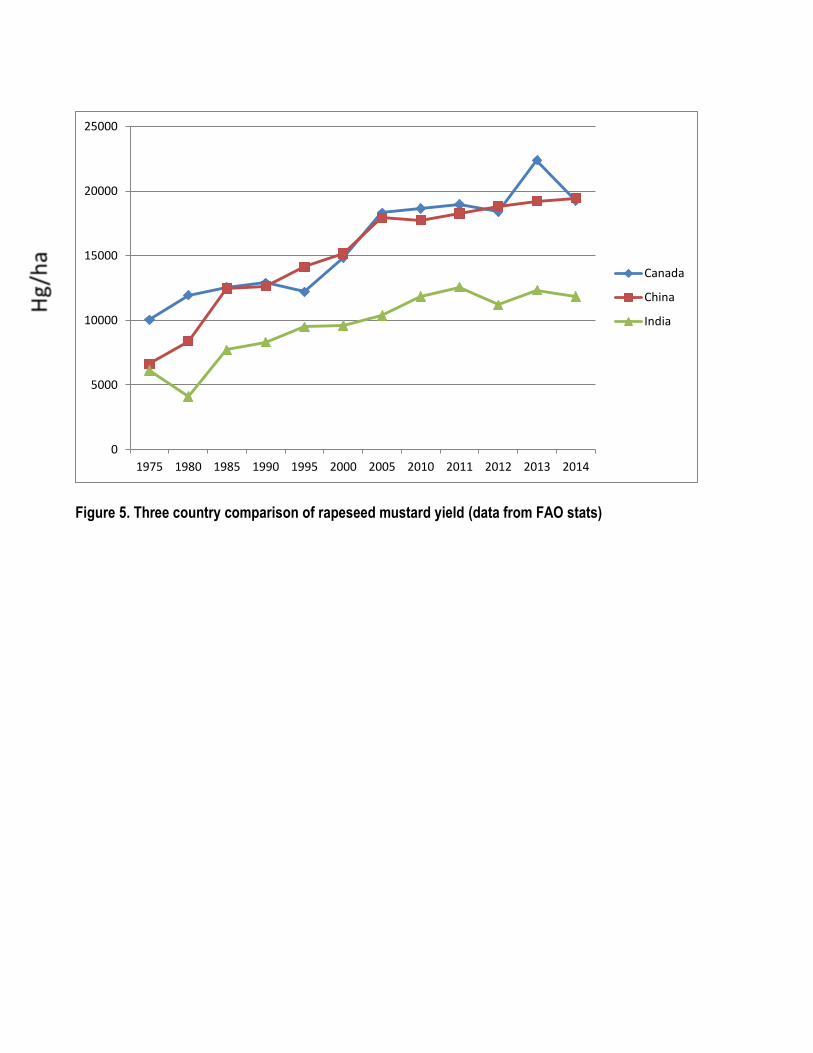
Figure 5. Three country comparison of rapeseed mustard yield (data from FAO stats)
0
5000
10000
15000
20000
25000
1975 1980 1985 1990 1995 2000 2005 2010 2011 2012 2013 2014
Canada
China
India

Annexure 9 Contains data on export of GM Canola oil, seed and meal from Canada to different countries all over the world (Table 7 a b c).
Country
Year
2002 2003 2004 2005 2006 2007 2008 2009 2010 2011 2012 2013 2014 2016
China 12 0 262 130 58 265 233 440 963 564 1003 855 501 596.8
Columbia 0 0 0 1 1 0 2 2 3 7 3 2 4 5.8
EU-27 5 22 0 49 193 56 0 0 28 183 31 10 7 37.4
Hong Kong 5 2 7 20 20 26 9 30 25 24 37 8 30 38.1
India 7 0 0 0 0 0 0 0 1 0 16 2 1 35.3
Iraq 0 0 0 0 0 0 0 0 16 0 0 0 0 0
Japan 3 0 10 24 4 10 12 8 6 23 18 10 5 7.6
Malaysia 0 2 5 20 26 15 27 5 17 26 24 3 12 64.0
S. Korea 28 2 8 19 20 18 39 30 38 66 56 30 76 113.0
Taiwan 15 3 17 37 24 22 4 18 12 12 15 18 9 16.6
U.S.A. 333 370 454 479 666 710 1005 971 1058 1492 1397 1227 1540 1871.4
Others 4 9 220 51 31 32 30 7 9 91 65 66 144 6.9
TOTAL 412.7 409.3 982.8 829.8 1043.6 1153.6 1361.0 1509.6 2175.4 2487.3 2664.3 2261.1 2329.4 2873.2
*Numbers may be off due to rounding.
(000 Tonnes)
Table 7a. Oil exports (Historic) - Canada
Historic Canadian Canola Seed Exports (000 Tonnes)
Calendar Year (January - December), Crop Year (August 1 to July 31)
2002
Cal. Yr.
2003
Cal. Yr.
2004
Cal. Yr.
2005
Cal. Yr.
2006
Cal. Yr.
2007
Cal. Yr.
2008
Cal. Yr.
2009
Cal. Yr.
2010
Cal. Yr.
2011
Cal. Yr.
2012
Cal. Yr
2013
Cal. Yr
2016
Cal. Yr.
Bangladesh 0 13 22 23 87 106 87 105 187 152 147 10 112.3
China 66 319 269 310 391 601 1476 3140 1520 1334 2987 2670 3542.5
EU-27 8 2 1 0 1 2 2 96 129 337 101 44 597.2
Japan 1508 1681 1620 1885 1923 1915 2197 1961 2107 2328 2349 2312 2280.6
Mexico 489 693 1081 1009 1045 1114 1282 1073 1485 1443 1543 1391 1477.7
Pakistan 0 398 4 97 443 420 94 387 703 813 228 0 1346.4
U.A.E. 0 0 0 34 330 217 505 306 773 803 534 233 629.9
U.S.A. 135 112 442 440 727 630 961 560 551 668 414 401 504.9
Others 1 22 1 2 176 10 56 2 13 12 30 30 45.9
TOTAL 2206.0 3241.5 3440.1 3797.4 5122.1 5014.1 6661.0 7630.2 7469.7 7890.0 8333.0 7090.4 10537.4
*Numbers may be off due to rounding.
Table 7b. Seed exports (Historic) - Canada
Source: Canadian International Merchandise Trade Database - Statistics Canada

Total Canadian Canola Meal (230641 + 230649) (000 Tonnes)
Calendar Year, Crop Year - August 1st to July 31st
2002
Cal.
Yr.
2003
Cal.
Yr.
2004
Cal.
Yr.
2005
Cal.
Yr.
2006
Cal.
Yr.
2007
Cal.
Yr.
2008
Cal.
Yr.
2009
Cal.
Yr.
2010
Cal.
Yr.
2011
Cal.
Yr.
2012
Cal.
Yr.
2013
Cal.
Yr.
2016
Cal
Yr
China 0 0 0 0 0 0 1 33 825 586 303 77 656.7
EU-27 0 31 37 18 0 24 10 7 40 61 72 90 20.6
Indonesia 0 0 0 0 0 1 0 9 7 0 1 2 0.8
Mexico 0 0 13 0 0 9 35 161 153 65 66 32 27.2
S. Korea 0 0 0 0 0 0 0 0 23 0 0 0 0
Taiwan 1 20 27 16 9 9 9 6 7 4 1 1 0
Thailand 0 0 6 7 0 1 0 41 18 22 42 42 77.8
U.S.A. 756 1075 1445 1361 1505 1542 1837 1468 1347 2337 2879 3060 3590.2
Vietnam 0 0 0 0 0 1 0 26 47 15 57 68 11.4
Others 8 1 11 10 15 2 1 0 6 10 24 35 0
TOTAL 764.8 1126.7 1538.7 1412.2 1528.6 1589.4 1892.7 1751.5 2472.2 3100.4 3347.1 3409.9 4384.7
*Numbers may be off due to rounding.
Table 7c. Meal exports (Historic) - Canada
Source: Canadian International Merchandise Trade Database - Statistics Canada

Annexure 10
Contains Table 8 showing yield of major oil seed crops of the country during the past ten years.
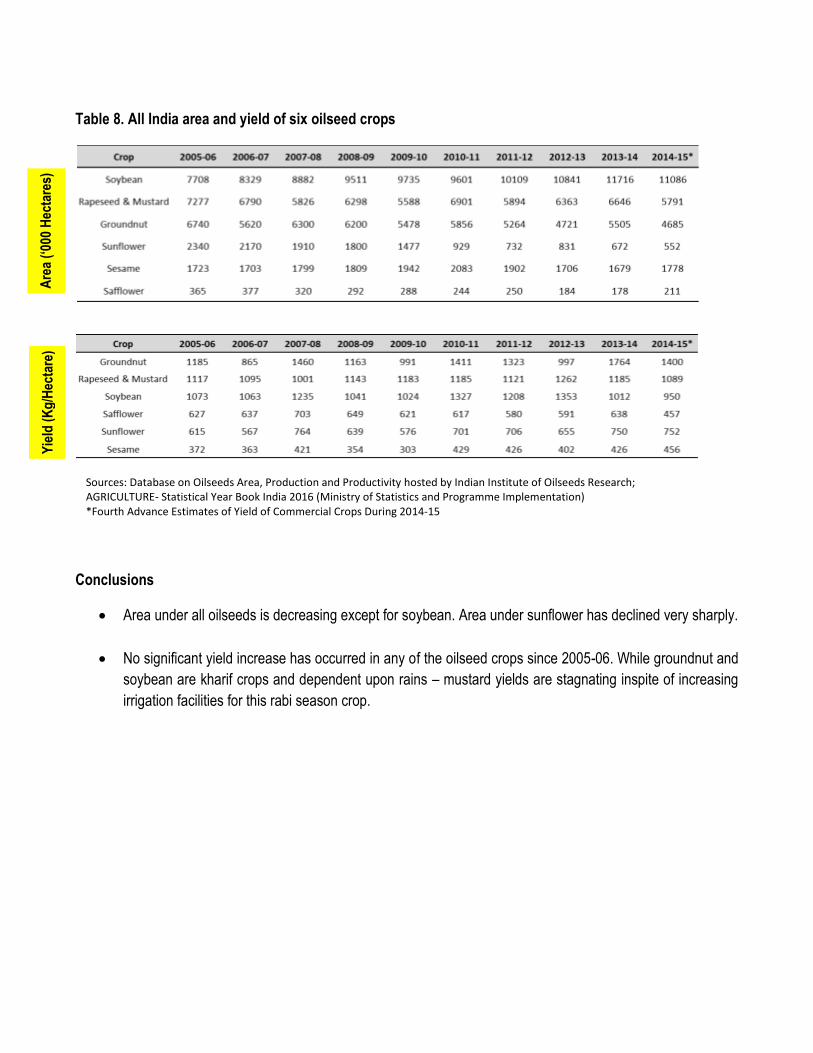
Table 8. All India area and yield of six oilseed crops
Conclusions
Area under all oilseeds is decreasing except for soybean. Area under sunflower has declined very sharply.
No significant yield increase has occurred in any of the oilseed crops since 2005-06. While groundnut and
soybean are kharif crops and dependent upon rains – mustard yields are stagnating inspite of increasing
irrigation facilities for this rabi season crop.
Are
a (‘
000
Hec
tare
s)
Yie
ld (
Kg
/Hec
tare
)
Sources: Database on Oilseeds Area, Production and Productivity hosted by Indian Institute of Oilseeds Research; AGRICULTURE- Statistical Year Book India 2016 (Ministry of Statistics and Programme Implementation) *Fourth Advance Estimates of Yield of Commercial Crops During 2014-15

Annexure 11
Contains data on domestic production and imports of vegetable oils by India (Table 9).
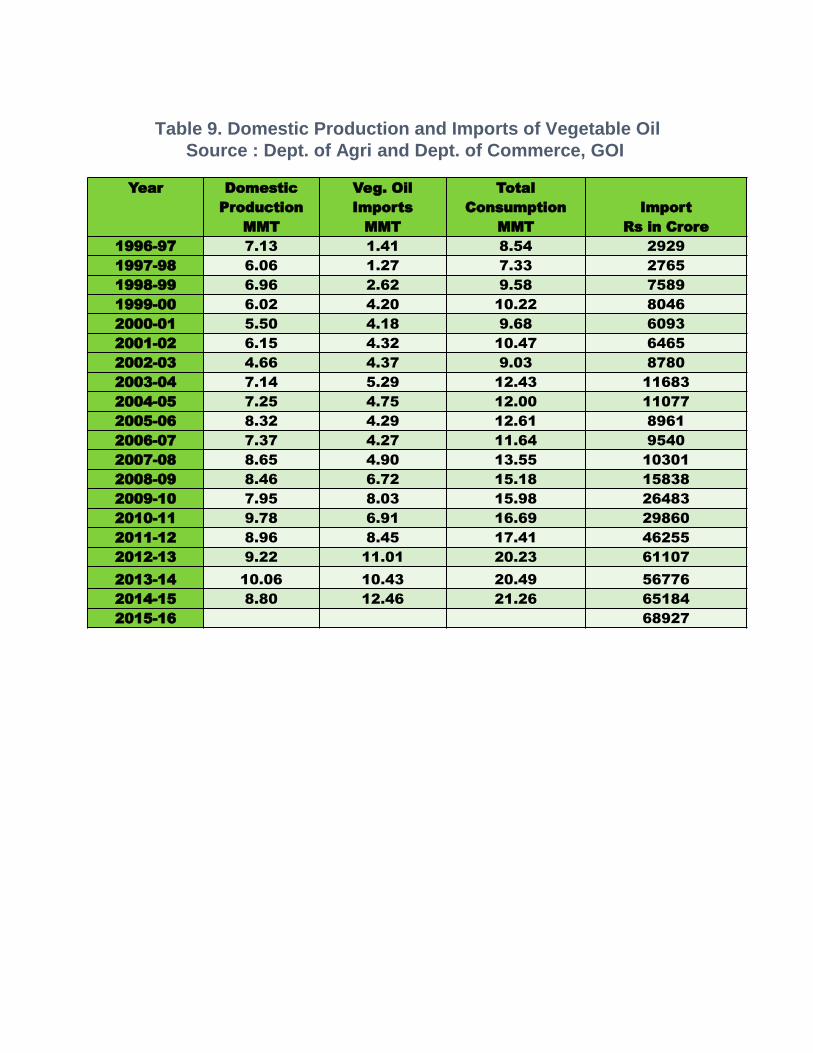
Table 9. Domestic Production and Imports of Vegetable Oil
Source : Dept. of Agri and Dept. of Commerce, GOI
Year Domestic
Production
MMT
Veg. Oil
Imports
MMT
Total
Consumption
MMT
Import
Rs in Crore
1996-97 7.13 1.41 8.54 2929
1997-98 6.06 1.27 7.33 2765
1998-99 6.96 2.62 9.58 7589
1999-00 6.02 4.20 10.22 8046
2000-01 5.50 4.18 9.68 6093
2001-02 6.15 4.32 10.47 6465
2002-03 4.66 4.37 9.03 8780
2003-04 7.14 5.29 12.43 11683
2004-05 7.25 4.75 12.00 11077
2005-06 8.32 4.29 12.61 8961
2006-07 7.37 4.27 11.64 9540
2007-08 8.65 4.90 13.55 10301
2008-09 8.46 6.72 15.18 15838
2009-10 7.95 8.03 15.98 26483
2010-11 9.78 6.91 16.69 29860
2011-12 8.96 8.45 17.41 46255
2012-13 9.22 11.01 20.23 61107
2013-14 10.06 10.43 20.49 56776
2014-15 8.80 12.46 21.26 65184
2015-16 68927