
Falling Behind: Ontario's Backslide into Widening Inequality, Growing Poverty and Cuts to Social
48
Ontario’s Backslide into Widening Inequality, Growing Poverty and Cuts to Social Programs ONTARIO COMMON FRONT ›››››››› AUG 29 2012 A REPORT OF THE
Transcript of Falling Behind: Ontario's Backslide into Widening Inequality, Growing Poverty and Cuts to Social

Ontario’s Backslide into Widening Inequality,Growing Poverty and Cuts to Social Programs
ONTARIO COMMON FRONT›››››››› AUG 29
2012A REPORT OF THE

The Ontario Common Front brings togetherorganizations, groups and individuals acrossOntario that are working to expose growinginequality and propose workable solutionsto fix it.
Our mandate is to: • Support local campaigns with provincial coordination and resources; • Garner media attention in local commun- ities through high-lighting the negative fall-out of cuts to jobs and social progams, while also providing alternatives; and • Move the Ontario government to adopt legislation and policies that create greater economic and social justice for everyone.
This report has been written for the OntarioCommon Front by Natalie Mehra, Director ofthe Ontario Health Coalition. We aregrateful for the help of the many individualsand organizations whose work we cited,as well as those who provided valuable editsand input.
Ontario Common Front416.441.2731 or [email protected] Gervais Dr., Ste. 202Toronto, Ontario M3C 1Y8www.WeAreOntario.ca

Falling Behind 2012
3
Contents
I. Summary page 5
Ontario’s Backslide by the Numbers page 8
II. Budget Measures page 9
“Austerity” in the Context of Soaring Inequality page 11
III. Income Inequality and Poverty page 13
Disproportionate Impacts of Income Inequality page 19 Women and the Income Gap page 19 The Racialization of Poverty page 20 Unfair Shares: Aboriginal People, Unemployment and Poverty page 21 Economic Insecurity Among Seniors page 22 Child Poverty page 22
Housing and Homelessness page 25
Food Security page 27
The Social Determinants of Health page 28 Racialized Health Disparities page 28
IV. The Squeeze on Social Programs page 29
Health Care: Burgeoning Unmet Needs page 30 Downloading the Cost of Education Onto Families page 31 Community Services Overwhelmed page 37 Cuts to Youth Programs page 38 Cuts to Social Assistance and Disability Support Programs page 39 The Erosion of Unemployment Insurance Protection page 41
V. The Race to the Bottom: Tax Cuts and Inequality page 43
VI. Conclusion and Recommendations page 47


Falling Behind 2012
5
I. Summary Thirteen million of the most highly educated people in the world call Ontario home. Endowed with rich natural resources, vast tracts of farmland, quadrillions of litres of freshwater, the rugged beauty of the Canadian Shield, and an industrial hub that stretches across its southern reaches; it is almost inconceivable that this province houses a generation of residents who are experiencing the largest increase in inequality in this province’s history. Yet the evidence is indisputable. Ontario is falling behind the rest of Canada in terms of growing poverty, increasing inequality and flagging financial support for vital public services.
Undeniable, also, is the fact that it is not the inexorable march of global economics alone, but rather choices – choices in public budgets, and in economic and social policy – that have failed to rein in the increasing income inequality distributed by the private market and aided in propelling us down this path. Today, six hundred thousand Ontario families find their incomes stalled or falling behind, while the richest ten per cent gallop away with the bounty from the sustained period of economic growth stretching from the mid-1990s to 2008.1 A decade-and-a-half of budgets that, with few exceptions, prioritized tax cuts for the wealthy over equality-creating public programs, have elongated the gap. These policy choices have helped turn surpluses into deficits at both the provincial and federal levels. Now, having deliberately emptied its cupboards, the Ontario government’s commitment to reduce child poverty by 25 per cent by 2013 is being swept aside.
In a departure from previous generations ranging back to the post-World War era, Ontario’s rising income inequality has persisted for an entire generation. It has now outpaced the rest of the 1 Armine Yalnizyan, Canadian Centre for Policy
Alternatives. Ontario’s Growing Gap: Time for
Leadership (2007), 5.
country. From 1945 to 1980, all across Canada, economic growth was accompanied by increasing income shared by a comparatively wide segment of the population (though of course this sharing was uneven and historically marginalized groups continued to experience real disproportionate disadvantage): children of all economic classes were expected to live better lives than their parents. But over the last 30 years an immoderate proportion of the yields from economic growth have been taken by the wealthiest. Today, the average CEO takes home 250 times the income of the average Canadian, while a generation ago that ratio was 25 times the average. 2 The chief means by which families have stabilized their incomes is through putting more hours into the workforce. But despite the intensification of work among the middle and lower income brackets in the last generation, Ontario has seen among the biggest jumps in poverty rates and intensity of all provinces.3
Ontario now holds the dubious distinction of providing less funding for all programs and services provided by government -- programs from environmental protections to justice, from health care to the entire social safety net – than any other province. Ontarians are paying for the shortfall in reduced services and a burgeoning array of user fees. Tuition fees are highest in Ontario universities – and have seen the largest increases – of anywhere in Canada. School fees in elementary and secondary schools are on the rise, and parents are now faced with unprecedented fundraising and student fee requirements. Ontario
2 Linda McQuaig and Neil Brooks, The Trouble with
Billionaires (Toronto: Penguin Canada: Toronto, 2011),
xvii. Also see: Linda McQuaig “Canada Discovers
Trickle Up Economics” Toronto Star, December 28,
2010. 3 Lars Osberg and Andrew Sharpe, Centre for the Study
of Living Standards. Beyond GDP: Measuring
Economic Well-Being in Canada and the Provinces
1981 – 2010 (September 2011), 40.

now funds its hospitals less than any other province. Consequently we have among the fewest hospital beds and the worst level of hospital overcrowding of the industrialized world and more than 30,000 Ontarians are waiting for a hospital bed, long-term care bed or home care service. Community agencies are inadequately funded to meet population need, and thousands of Ontario families of children and adults with disabilities are waiting for access to services.
Ontario’s income gap between the richest and poorest families is now at levels not seen since the Great Depression of the 1930s. Fifteen per cent of Ontario’s children live below the Low Income Measure, according to Statistics Canada.4 And the gap is even wider for marginalized groups. Within the Greater Toronto Area, for example, one child in ten live in low income among global European groups. That figures is one child in five for East Asian groups; one child in four for Aboriginal, South Asian, Caribbean, South & Central American groups; one child in three for children of Arab and West Asian groups; and one child in two for children of African groups.5
The most recent budget announcements from the Ontario government – that Ontario is facing five years of “austerity” budgets—will only widen the chasm if left unchecked.
In this paper, we draw from – and introduce ourselves into -- the conversation that has been led by innumerable activists, academics, media, and concerned community members before us. We have endeavoured to pull together the existing work and add to it our own research to sketch the increasing inequality in Ontario. And we have tried to show how the consequences of our policy choices are suffered disproportionately by women, seniors, persons with disabilities, children, and racialized communities.
The fact that incomes are becoming so skewed in favour of the wealthy -- that almost half the population of an entire generation now finds itself
4 Statistics Canada, CANSIM Table 202-0802.
5 Childrens Aid Society of Toronto, Greater Trouble
in Greater Toronto: Child Poverty in the GTA
(2008).
0
50
100
150
200
250
1980 2011
Average CEO salary has grown from 25 times the average Canadian income in 1980 to 250 times the average income in 2011
AverageCanadian'sincome
AverageCanadian CEOsalary

Falling Behind 2012
7
falling behind -- these are among the most important issues of our times. Yet there has been little debate among the mainstream political parties, nor in most of the media, about the impacts of public budgets and policy on rising inequality. The extraordinary efforts of the “Occupy Movement” that forced the top-heavy wealth distribution into the headlines last year have been superseded – not incidentally -- by a renewed panic about deficits. Yet persistent poverty and the distortion of income distribution towards extremes of wealth are issues that will shape the future of our province, contributing to the relative degree of social cohesion, violence, suffering or hopefulness in years to come; fundamentally changing our democracy and impacting the ability for millions among us to live to our human potential.
It is time for Ontarians – including our policy makers -- to face the disturbing facts about inequality in our province. It is far from too late. We can -- and we must -- insist that the public debate reflects the stark reality that the rising wealth of the few is not floating all boats higher – that buoyant public program funding, robust income security programs, stable social services, and public policy that addresses the rising tide of income inequity are more vital in our globalized economy than ever. We can choose to address our province’s current fiscal outlook with a strong sense of our shared value in social justice and social inclusion. Another half-decade of cuts to services we all need and a government-created recession in the public sector are not the only answers – indeed they are not the answer at all. We hope that this report contributes meaningfully to a renewed public dialogue about these issues.

Ontario’s Backslide By the Numbers Ontario is Falling Behind the Rest of Canada in terms of Increasing Income Inequality,
Growing Poverty and Flagging Support for Social Programs
Largest Increase in Income Inequality
Over the generation stretching from 1981 – 2012, Ontario experienced the largest change in income equality of anywhere in Canada, in percentage terms at 17.2 per cent, followed by British Columbia at 14.4 per cent. (Source: Lars Osberg and Andrew Sharpe, Centre for the Study of Living Standards, Beyond GDP: Measuring Economic Well-Being in Canada and the Provinces 1981-2010 (September 2011).)
Today, the widest income disparities between the top 20 per cent and the bottom 20 per cent of income earners in Canada are in British Columbia and Ontario. (Source: Human Resources and Skills Development Canada, Indicators of Well-Being in Canada: Financial Security – Income Distribution.)
The average earned income (before tax) of the richest 10 per cent of Ontario families raising children was 27 times as great that of the poorest 10 per cent in 1976. By 2004, the gap had ballooned to 75 times. While the highest income earners have enjoyed large income increases over the last generation, the bottom 40 per cent have seen stagnant or declining incomes, despite putting more hours into the workforce each year. (Source: Armine Yalnizyan, Canadian Centre for Policy Alternatives. Ontario’s Growing Gap: Time for Leadership (2007).)
2nd Highest in Poverty Increases
Across Canada the poverty rate fell in five provinces between 1981 and 2010. In the other five provinces, the poverty rate grew. Over this period, Ontario had the second-highest increase in poverty in the country. (Source: Lars Osberg and Andrew Sharpe, Centre for the Study of Living Standards, Beyond GDP: Measuring Economic Well-Being in Canada and the Provinces 1981-2010 (September 2011).)
The most recent poverty figures available from Statistics Canada reveal that Ontario’s poverty rate in 2009 was 13.1 per cent, equalling 1,689,000 people. The child poverty rate is even higher – at 14.6 per cent, meaning that 393,000 or 1 in every 7 children in Ontario live in poverty. (Source: Campaign 2000, “Poverty Reduction in an Age of Uncertainty and Change” 2011 Report Card on Child and Family Poverty in Ontario (February 2012).)
Racialized Ontarians are far more likely than the rest of Ontarians to live in poverty, experience barriers to employment, and earn less even when they get a job. In 2005, while 6 per cent of non-racialized Ontario families lived in poverty, 18.7 per cent of racialized families lived in poverty. Discrimination is amplified for racialized women, who earned 53.4 cents for every dollar non-racialized men made in 2005. (Source: Sheila Block, Canadian Centre for Policy Alternatives, Ontario’s Growing Gap: The Role of Race and Gender (June 2010)).
Worst record on Affordable Housing
With more than 152,000 Ontario households on wait lists for assisted housing, Ontario has the worst record of all provinces in affordable housing investments. In 2009, Ontario spent $64 per person on affordable housing compared to the average among all provinces of $115 per person. (Source: Michael Shapcott, Wellesley institute (March 23, 2011).)
Poorest Funding of Public Services
Ontario now funds all our public programs and services – from health care to education, from justice to disability benefits – less than any other province in Canada. (Source: Ontario Ministry of Finance, Ontario Budget 2012.)
Ontarians are paying for poor public program funding through burgeoning user fees and reduced services:
Ontario’s hospitals are funded less than anywhere else in Canada and as a consequence, this province has the fewest hospital beds per person of any province. More than 30,000 Ontarians are waiting for a hospital bed, long-term care placement or home care. Ontarians face the highest proportion of out-of-pocket or privately-funded health care costs in the country at 32.5 per cent versus the Canadian average of 29.7 per cent. (Source: Ontario Health Coalition, Fist Do No Harm (February 2012); Canadian Institute for Health Information, National Health Expenditure Trends 1975-2011.)
Parents are now faced with unprecedented user fees for secondary school activities from labs, materials, science classes, and sports. (Source: People for Education Private Money in Public Schools (August 2010).)
University tuition fees in Ontario universities are the most expensive of anywhere in Canada, according to Statistics Canada, and have seen the highest increases in recent years. (Source: Canadian Association of University Teachers, CAUT Almanac 2011-2012; Canadian Federation of Students.)

Falling Behind 2012
9
II. “Austerity” in the context of soaring inequality
Economists describe the Ontario government’s fiscal plan as “austerity”, meaning a severe or harsh approach to budgeting. Ontario’s austerity budget, passed in June of this year, includes cuts from social assistance funding for emergencies to school closures; cancelled hospital projects, delayed and curtailed child benefits, eroded affordable housing budgets, and restructuring across the public sector that will result in thousands of job cuts. Occurring in a context of burgeoning inequality, Ontario’s social programs from justice to child protection are under renewed threat.
In 2010, Ontario’s level of funding for all programs and services provided by government for Ontario residents was third lowest of any province in the country. By this year, it has dropped to dead last. Once Canada’s economic heartland, touted as a “just and equitable society”, Ontario public policy choices are driving us backwards. Despite widening inequality, Ontario’s 2012 budget continues a trend of favouring tax cuts that benefit the wealthy while curtailing income security programs, public sector jobs and public services that mitigate inequalities and raise the standard of living for all of Ontario’s families.
In a dubious first, Ontario leads the country in tax cuts, having engaged in the deepest and most prolonged personal income and corporate tax cuts of any province. These tax cuts have mainly benefitted the wealthy and corporations, and have not resulted in increasing business investment. Combined with the devastating impact of the 2008 recession on jobs, tax cuts have further depleted provincial resources,
putting the province into deficit. Despite the clear evidence of the impact of tax cuts and Ontario’s declining investment in public programs and services, Ontario’s government is responding to a record-setting deficit by eschewing virtually all revenue-raising measures. Instead, it is engaging in a round of severe cutbacks and cost curtailment. Public services such as education and health care that redistribute wealth and create a more egalitarian society are under renewed threat. Erosion to Social assistance will ensure that people in poverty fall further behind as inflation outstrips a miserly 1 per cent increase forced by the legislative opposition and public pressure. Equity and equality-creating social policies, devastated in the 1990s, have never been restored and are now being further dismantled. A tsunami of cuts to public service jobs that buoy full-time employment opportunities and lift women’s wages is rolling towards us.
The result? Ontario’s slow recovery from the 2008 recession and devastating losses to employment in the manufacturing and resource sectors will now be further challenged by cuts in the public sector and income transfer programs. Ontario’s austerity budget – heralding five years of retrenchment and a government -created recession in the public sector -- will undoubtedly accelerate Ontario’s growing inequality and poverty unless a more balanced approach to public policy is restored.
Ontario’s current sprint toward austerity is occurring in the context of grave inequality. Income inequality has outpaced the rest of the country since the 1990s. While the wealthiest

have bolted ahead, the bottom 40 per cent of Ontarians’ incomes are flagging. This province has seen the biggest jump in poverty rates in Canada. Yet Ontario’s budget plan asks almost nothing of high-income Ontarians who are taking home more than ever. In fact, the province’s 2008 five-year commitment to reduce child poverty by 25 per cent has been abandoned in the budget; rather, child benefits have been cut and delayed. The province’s deficit will be paid primarily through job cuts in public sector, service cuts, and public funding curtailments to income support and other programs.
Economist Hugh Mackenzie reports:
“The budget strategy is not balanced. On its own numbers, the government’s strategy is based on four dollars of expenditure reductions for every dollar of revenue increases. Upon a closer look, nearly half the amount claimed on the revenue side is not a revenue increase. Instead, it is the value of a delay in implementation of a tax cut [that mainly benefits the wealthy]…
The budget is decidedly not fair. High-income Ontarians, those who have benefited most from Ontario’s growth and from Ontario’s tax cuts, will contribute nothing, except high-income seniors will pay more for prescription medicine. The corporate sector does even better. Its pain will be in the form of a brief delay in future tax cuts. At the other end of the spectrum, by the end of the 2012-13 fiscal year, Ontarians who rely on social assistance and disability benefits will have lost $200 million to inflation, thanks to only a 1 per cent increase in benefits in 2011 and none in 20126…
..It also fails to consider the impact on Ontario’s economy of cuts of the magnitude
6 Since this article was written, the government was
forced, under pressure from the legislative opposition
and public interest groups, to increase social assistance
by 1 per cent in 2012. This increase mitigates the
numbers reported here slightly but does not change the
net effect. The 1 per cent increase is still far less than the
current 3.1 per cent rate of inflation and means that
Ontarians living on social assistance or disability
benefits will fall further behind.
being proposed. A cut of $10 billion in expenditures, $8 billion of which takes place over two years, equates to a reduction of 1.5 per cent of GDP and at least that amount of fiscal drag. In the current economic environment, that is irresponsible.”7
7 Hugh Mackenzie, “Ontario’s 2012 budget: Completing
the job Mike Harris started” in Rabble.ca (March 28,
2012), 2-4.

Falling Behind 2012
11
2012 Ontario Austerity Budget Measures Children’s Aid Societies will be restructured and wages frozen to find $9 million in “efficiencies”. Child Protection Service Programs will see their budgets dramatically curtailed.8
Child benefit increases are delayed and cut -- to resume at half the promised rate after a year’s delay, in 2013 – contrary to the government’s stated commitment to reduce child poverty by 25 per cent by 2013.
Social assistance and disability benefits are lower in real dollars now, than they were in 1986. In the original budget plan, social assistance and disability rates would be frozen. Under pressure from the legislative opposition and public interest groups, the government modified the budget to include a 1 per cent increase for 2012. The increase is far less than inflation (which is currently at 3.1 per cent9). Social assistance rates will continue to lose ground, worsening Ontario’s poverty rate.
Special allowances under Social Assistance – available to people if they have to move, flee an abusive situation, replace bed-bug infested furniture, fix plumbing or pay for power when it has been cut off – has been eliminated. In addition, funding for health emergencies, dental emergencies, eye glasses and funeral costs will be capped at lower levels for people on welfare and disability benefits. 10
Infrastructure projects are cancelled including badly needed hospitals in Grimsby, Wingham and Kincardine, as well as the Sunnybrook Hospital hemodialysis unit.11
Municipal and local infrastructure funding will be cut by $48 million from 2011 levels12 including roads, bridges, water, and wastewater.
Public housing budgets will see cuts for the fourth year in a row. The Ministry of Municipal Affairs and Housing will see a 12 per cent reduction from 2009 levels.13
8 Ontario Auditor General, Review of the 2011 Pre-election Report
on Ontario’s Finances (June 28, 2011), 32-33. 9 Ontario Ministry of Finance, Ontario Fact Sheet (July 2012). 10 Chiefs of Ontario, First Nations in Ontario to be Impacted by
Social Assistance Cuts (June 4, 2012); Ontario Coalition Against
Poverty, OCAP Statement on 2012 Budget (March 29, 2012). 11 Kelly Lapointe, “Ontario Budget Preserves Three-Year $35
Billion Infrastructure Funding” Daily Commercial News and
Construction Record (March 28, 2012). 12 Kelly Lapointe, “Ontario Reduces Municipal Infrastructure
Funding in 2012 Budget”, Daily Commercial News and
Construction Record (March 28, 2012). 13 Michael Shapcott, The Wellesely Institute, Ontario Budget 2012
Continues Erosion of Affordable Housing Investments (March 28,
2012).
Elementary and secondary education will see cuts of $500 million and $160 million will be cut from post-secondary education, including14: Caps on the number of credits students are allowed
to take in high school – for a total funding cut of $36 million.
Cuts to funding and changes to policy so that more schools are closed – for a total cut of $116 million. Amalgamations of school boards – a cut of $27 million over 3 years.
Cuts to funding for busing for a total cut of $34 million over 3 years.
Cuts to program grants such as healthy schools initiatives, programs to support math acquisition, extra library staff – for a total cut of $107 million over 3 years. Elimination of the program enhancement grants supporting the arts and other school programs – for a total cut of $66 million over 3 years. Changes to funding for school operations and renewal for a total cut of $32 million over 3 years.
Cuts to funding for curriculum specialists for a total cut of $91 million.
A cut of 2.5 per cent from the budget of the Education Quality and Accountability Office.
A 2-year wage freeze. Elimination of $100 million in financial assistance
programs for university students.15 Increase in university tuition fees by 5-8 per cent.
This is the seventh consecutive year of tuition increases.
Northern Ontario programs will see a $100 million in cuts. Ontario Northland train service will be axed and its other divisions privatized.
Health care funding will be curtailed by more than $4 billion over the next three years: hospitals will have to find $1 billion in “savings” in addition to a wage freeze; OHIP will have to find $1.5 billion in cuts in addition to a wage freeze; long-term care funding increases will be halved and home care funding increases will be a third of what they have been over the last seven years.16
Correctional Services, policing and legal aid budgets will be cut by 1.6 per cent per year.17
14 People for Education, Education Cut in 2012 Budget (March 27,
2012). 15 Canadian Federation of Students, Ontario Budget Gets Failing
Grade From Students (June 20,2012). 16 See Ontario Auditor General, Review of the 2011 Pre-election
Report on Ontario’s Finances (June 28, 2011), 23-28; and Ontario
Health Coalition, First Do No Harm: Putting Improved Access and
Accountability at the Centre of Ontario’s Health Care Reform
(Feburary 10, 2012), 7. 17
Ontario Auditor General, page 33.


Falling Behind 2012
13
III. Income Inequality and Poverty
Ontario’s income gap between the richest and poorest families is at an all-time high. For the last generation, incomes meted out by the private market place have become increasingly disparate. Public policy has failed to mitigate this trend. For fifteen years governments have chosen – with few exceptions – to set budgets that prioritize tax cuts for the wealthy and curtail public services and programs that create equity. Most families in the middle and lower income brackets have lost ground, even after taxes and income transfers are factored in. In fact, of all the provinces in Canada, Ontario has experienced the largest change in income equality over the last generation. Today, Ontario is at or near the bottom of the country in measures of income inequality and economic security. While there are some provinces that have higher levels of poverty, Ontario has suffered among the highest increases in poverty rates and poverty intensification of anywhere in the country. In Ontario, the girth of the gap between the richest and poorest first expanded beyond the Canadian average in the late 1990s. It has ballooned ever since. 18 Today, the widest income disparities between the top 20 per cent and the bottom 20 per cent income groups in Canada are in British Columbia and Ontario.19 Despite prolonged economic growth prior to 2008, almost
18
Armine Yalnizyan, Canadian Centre for Policy
Alternatives. Ontario’s Growing Gap: Time for
Leadership (2007), 3. 19
Human Resources and Skills Development Canada,
Indicators of Well-Being in Canada: Financial Security
– Income Dsitribution, statistics are from 2007. See
http://www4.hrsdc.gc.ca/[email protected]?iid=22
half of Ontario’s families have seen anemic or dwindling real incomes since at least 2000.20 In fact, the distending gap between the richest and poorest in Ontario is occurring despite the fact that middle and low income families are better educated than ever and have increased their hours in the workforce. The average earned income (before tax) of the richest 10 per cent of Ontario families raising children was 27 times as great that of the poorest 10 per cent in 1976. By 2004 the gap has expanded to 75 times.21 In her 2007 study of Ontario’s growing gap in income and wealth economist Armine Yalnizyan reports that even prior to the economic recession of 2008, in a period of prolonged economic growth, income inequality worsened in Ontario:
“Income disparities in Ontario have soared for the past decade, though the economy has been strong. And it’s not just a story about the tail ends of the distribution, the richest and the poorest. Fully 40% of Ontario’s families have seen almost no income gains or, worse, actual income losses compared to their predecessors 30 years ago. These kinds of trends are expected during recessionary periods, but this is occurring during one of Ontario’s most sustained periods of economic expansion.”22
20
“Real income”, an economists’ term, refers to
incomes adjusted for inflation to reflect real buying
power. 21
Armine Yalnizyan, page 3. 22
Ibid, page 4.

Source: Armine Yalnizyan, Canadian Centre for Policy Alternatives. Ontario’s Growing Gap: Time for Leadership (2007).
The highest income earners (Decile #10) have enjoyed great income increases over the last generation while the bottom 40 per cent (Deciles #4 to #1) sees stagnant or declining incomes.23
23
Ibid, page 8.
Median Earnings by Income Decile 1976-2004 (Constant 2004 $) For Families With Children

Falling Behind 2012
15
Source: Armine Yalnizyan, Canadian Centre for Policy Alternatives. Ontario’s Growing Gap: Time for Leadership (2007).
Working Harder is Not Paying Off For More than Half of Ontario’s Families With Kids
Percentage change in average annual weeks worked and annual (inflation adjusted) earnings at the median of each income decile for families with children,
comparing the periods 1976–1979 and 2001–2004
Income Decile Average Annual Number of Weeks Worked
Average Median Incomes
1976-1979
2001-2004
Average Difference
Percentage Change
1976-1979
2001-2004
Percentage Change
1st Decile (Poorest
10%) 45 51 +6 +14% $4,220 $1,681 -60%
2nd Decile (2
nd Poorest 10%)
64 67 +3 +5% $28,920 $20,225 -30%
3rd Decile 69 78 +9 +13% $40,686 $35,842 -12%
4th Decile 73 85 +12 +17% $49,124 $48,698 -1%
5th Decile 81 90 +9 +11% $56,089 $61,183 +9%
6th Decile 84 98 +15 +18% $63,578 $72,536 +14%
7th Decile 91 100 +9 +10% $71,370 $84,367 +18%
8th Decile 99 109 +10 +10% $81,799 $99,485 +22%
9th Decile (2
nd Richest 10%)
108 114 +6 +6% $95,507 $122,869 +29%
10th Decile (Richest 10%)
125 113 -12 -10% $128,264 $180,683 +41%
Many middle class and working families did not see gains during the recent period of economic growth. This chart shows the increase in work intensity (number of weeks put into the workplace per year) for families with children compared to the change in their income over the last generation. While the 3rd decile, for example, spent 13 per cent more weeks working, their earned incomes declined by 12 per cent. In fact, the bottom 40 per cent - equalling roughly 600,000 families) have not seen income gains since 2000 in real terms, despite economic growth and despite putting more hours into the workforce.24 Conversely, the richest 10 per cent have seen huge income gains despite putting less hours into the workforce.25
24
Ibid, page 5. 25
Ibid.

The Centre for the Study of Living Standards echoes many of Yalnizyan’s findings. They report that despite increases in wealth and consumption measures from 1981 to 2010, inequality and economic security worsened in Ontario. Across Canada as a whole, by their measures economic equality fell by 0.152 points (or 23.6 per cent) from 0.642 to 0.490. Economic security declined by 0.147 points (or 23.3 per cent) from 0.632 to 0.485.26 All Canadians have cause to be concerned. But a look at Ontario’s record reveals that this province is on the vanguard of advancing inequality. The Gini coefficient measures income inequality. Statistics Canada uses after-tax income to construct the Gini coefficient. A Gini coefficient of zero means perfect equality (wherein all have an equal income). A Gini coefficient of one means total inequality (wherein one person has all the income).
The Centre for the Study of Living Standards reports that inequality across Canada as measured by the Gini coefficient is up 13.2 per cent from 1981 to 2010.27 Among the provinces, the highest Gini coefficient (i.e. highest income inequality) in 2010 was 0.405 for British Columbia, followed by Ontario's 0.396 and Alberta's 0.395. Over the 1981-2010 period, Ontario experienced the largest change in income inequality as measured by the Gini coefficient, in percentage terms, at 17.2 per cent, followed by British Columbia at 14.4 per cent.28
Across Canada, the poverty rate29 for all persons is estimated at 13.3 per cent in 2010, up from the relatively high point of 12.0 per cent in the depths of the recession in 1981. It peaked at 13.0 per cent in 1984, hit a low point of 10.5 per cent in 1989, rebounded to a high point of 12.9 per cent 1998, after which it fell to 12.4 per cent in 1999. For the next decade – a decade in which there was
26 Lars Osberg and Andrew Sharpe, Centre for the
Study of Living Standards. Beyond GDP: Measuring
Economic Well-Being in Canada and the Provinces
1981 – 2010 (September 2011), vi. 27
Ibid. page 38. 28
Ibid. 29
As measured by the Low Income Measure (LIM).
significant economic growth right through 1999 – 2008, the poverty rate has remained above this level and has increased to 13.3 per cent in 2010.30
Across Canada, the poverty rate fell in five provinces between 1981 and 2010. In the other half of the provinces, the poverty rate grew. At the extreme ends of this trend, poverty rates in Prince Edward Island and New Brunswick dropped 9.0 and 5.9 percentage points between 1981 and 2010, while those of British Columbia and Ontario increased 4.8 and 3.7 percentage points, respectively.31
Poverty intensity is the product of the poverty rate and poverty gap. Over the 1981-2010 period, the greatest drops in poverty intensity were in Prince Edward Island and New Brunswick, at 51.1 per cent and 27.6 per cent, respectively. Poverty intensity increased over the period in three provinces: Alberta, Ontario, and British Columbia.32
The most recent poverty figures available from Statistics Canada reveal that Ontario’s poverty rate in 2009 was 13.1 per cent, equalling 1,689,000 people.33 The child poverty rate is even higher – at 14.6 per cent,34 meaning that 393,000 or 1 in every 7 children in Ontario live in poverty.35
30
Ibid, page 39. 31
Ibid, page 40. 32
Ibid. 33
Statistics Canada, CANSIM Table 202-0802 34
Ibid. 35
Campaign 2000, “Poverty Reduction in an Age of
Uncertainty and Change” 2011 Report Card on Child
and Family Poverty in Ontario (February 2012), 2.

Falling Behind 2012
17
While Ontario does not have the highest poverty rates in Canada, it has seen the second highest increase in poverty rates over the last generation.36 While half the provinces reduced their poverty rates, Ontario’s and British Columbia’s escalated significantly.
36
Lars Osberg and Andrew Sharpe, page 41.
9.4 8.7
9.9
13.1
0
2
4
6
8
10
12
14
1981 1991 2001 2009
Data from Statistics Canada, CANSIM Table 202-0802
Ontario's Increasing Poverty (Percentage of Ontarians Living Below the Low Income Measure after tax)
Poverty Rate Canada and the Provinces, 1981 and 2010 (as per cent, based on Low Income Measure)

0
20,000
40,000
60,000
80,000
100,000
120,000
140,000
160,000
180,000
200,000
1976 2004
Ontario's Growing Income Inequality: The Gap Between the Highest 10 Per Cent of Families with Children
and the Lowest 10 Per Cent 1976 - 2004
Bottom 10%
Top 10%

Falling Behind 2012
19
Disproportionate Impacts of Income Inequality Income disparity has a corrosive impact on all society. Infused with increasing poverty, as is the formula in Ontario, it creates a caustic brew; eroding social cohesion, eating away hope for the future and wasting human potential. Ontario’s widening income inequality and escalating poverty are occurring as trends in the labour market see soaring incomes in the highest income brackets and falling incomes in the bottom 40 per cent. More and more, labour market restructuring has replaced job security with temporary, contract, part-time and precarious labour. While historically, periods of economic growth were accompanied by increasing incomes shared by a wider swath of society; in the most recent period of economic growth, income inequality expanded rather than shrinking. Government budgets and social policy have failed to mitigate these trends. Even after taxes and transfers, most of the bottom 50 per cent of income earners lost ground over the last generation. In this half of society, even those that gained, gained little. Conversely, those at the top saw unprecedented income growth. These inequities are felt more severely by some groups. Women and persons with disabilities of all ages and educational attainment levels still earn significantly less than Ontario’s men. The gap for racialized women is wider. For aboriginal women it is wider still. Racialized communities are disproportionately represented among the working poor. The data show higher labour force
participation for racialized Ontarians. Despite this this willingness to work, unemployment rates for racialized Ontarians are higher than non-racialized workers.37 Immigrants, despite high education levels, face barriers to employment and far too often suffer from precarious work. Aboriginal populations receive woefully unfair shares of Ontario’s wealth with high rates of poverty, disability and unemployment. Seniors’ poverty rates are going up for the first time in decades. Disgracefully, one in 7 Ontario children lives in poverty. That number is one in three for racialized children.38
Women and the Income Gap Ontario’s Pay Equity Act is almost a generation old, having been introduced 20 years ago. It has succeeded in narrowing the wage gap for Ontario’s women significantly, but income inequality stubbornly persists. Today, Ontario women earn on average 71 cents for every dollar earned by men. This 29 per cent income gap is down from 38 per cent in 1988, but it is still far too high.39 In fact, Canada’s gender pay gap ranks 17th among 22 OECD countries.40 And the gap is
37
Sheila Block, page 5. 38
Campaign 2000, 2011 Report Card, page 4. 39
Cornish, Mary and Faraday, Fay. “Ontario’s gender
pay gap cheats women” The Toronto Star, September
17, 2008. 40
The Organization for Economic Co-Operation and
Development (OECD) is comprised of the
“industrialized” nations of the world.

not equally shared among all women. According to lawyers Mary Cornish and Fay Faraday,
“Ontario’s pay gap hits women regardless of where they work, the size of their workplace or whether their work is full-time or part-time, contract or temporary. But some women suffer more than others. Racial minority women earn 36 per cent less than men and aboriginal women earn 54 per cent less. Women with disabilities earn much less than women and men without disabilities. While women’s increasing levels of education have helped, a gap remains regardless of education. Female high school graduates earn 27 per cent less than male graduates. Female university graduates earn 16 per cent less than male graduates….Married women face the widest pay gap at 33 per cent because they bear an unequal share of care responsibilities. The gap continues into retirement as a lifetime of unequal pay and benefits results in retired women receiving a median income just half that of retired men.”
Women’s unequal pay is compounded by labour force trends, anemic enforcement, and rollbacks of the laws and structures that promoted women’s employment and pay equality. In the workforce, seven of every 10 part-time workers are women. Women make up the majority of multiple job workers, and outnumber men in nine of the 10 lowest paying occupations.41 Changes to Employment Insurance disproportionately impact women workers. Because women’s work is well-known to be “precarious” – often part time, seasonal, contract, or off-market – and because 1996 changes to EI deny benefits to those working less than 35 hours per week during qualifying periods disqualifying part-time workers; women now receive less than half the EI benefits to which they were previously entitled
41
From: http://www.equalpaycoalition.org/about-pay-
equity/about-the-pay-gap/
unless they have been able to work full time. To illustrate the gender differences in EI coverage, Professor Kathleen Lahey of Queen’s University notes that nearly three times as many men qualified for EI during the latest reporting period as did women.42 Compounding these trends, in Ontario, Employment equity legislation was repealed in the mid-1990s. And despite the continued need to promote gender equity, since the early 1990s, Ontario’s Pay Equity Commission and Tribunal have seen their budgets halved.
The Racialization of Poverty Despite higher workforce participation, people of colour (racialized people) are more likely to be un- or under-employed or living in poverty.43 While a larger share of racialized workers is looking for work, fewer of them have found jobs compared to the rest of Ontarians.44 Even when employed, racialized people suffer lower wages and are disproportionately represented among the ranks of precarious and unprotected workers.45 Immigrants have extremely high levels of education – almost 75 per cent have a university education – and yet find their training and work experience in other countries is too often undervalued in Canada.46 A 2011 report found that racialized Canadian workers earned 81.4 cents for every dollar paid to their Caucasian counterparts.47 Racialized immigrants are at a double disadvantage when it comes to labour market participation and are shamefully over-represented among the working
42
Lahey, Kathleen, Professor of Law, Queen’s
University, “Gender Analysis of Budget 2009” in
Progressive Economics Forum. 43
Sheila Block, CCPA, page 3; and Colour of Poverty,
Fact Sheet #5 (2007). 44
Sheila Block, page 3. 45
Jason Gilmore, Statistics Canada. The 2008 Canadian
Immigrant Labour Market: Analysis of Quality of
Employment (2009). 46
Colour of Poverty, Fact Sheet #5 (2007). 47
Sheila Block and Grace-Edward Galabuzi, Canada’s
Colour Coded Labour Market: the gap for racialized
workers (Wellesley Institute and Canadian Centre for
Policy Alternatives, 2011)

Falling Behind 2012
21
poor in Canada.48 Across the country, nearly one in five immigrants experiences a state of chronic low income – double the rate of Canadian-born individuals.49 Data from Ontario -- which remains the destination of choice for most immigrants -- shows that racialized people in this province experience lower pay and barriers to labour force participation. These groups have been hit hardest by the 2008 recession and are taking longest to recover. According to the Ontario Council of Agencies Serving Immigrants:
“Almost 25% of Ontario workers earn wages below the poverty line. Racialized communities (people of non-European background or heritage) experience ongoing, disproportionate levels of poverty, and low wages is a major factor. Almost one third of women and racialized workers are low paid, while the number jumps to 38% for racialized women. There is a growing colour-coded wage gap between racialized and non-racialized workers in Canada. Many workers of racialized background are working in precarious employment that pays minimum wage or less. Ontario’s minimum wage lags far behind the low-income cut-off (LICO). Even those working full-time hours are living in a situation of severe poverty and make barely enough to pay for shelter, food and other basic necessities.
Ontario has made strong progress in addressing some of the systemic barriers that internationally trained immigrants face in gaining labour market access in their field by creating the Office of the Fairness Commissioner and investing in bridging programs. Yet many challenges remain such as the lengthy and challenging process to become accredited, cost, lack of opportunities to complete the on-the-job practical component of accreditation, and labour market access.”
48
Ibid. 49
Ibid.
Families and individuals from racialized communities -- many of them immigrants -- are overrepresented among Ontario’s poor. Racialized families are 2 to 4 times more likely than white families to fall below the low income cut-off (LICO).50 The disproportionate impact of growing income inequality is all-too evident in Ontario’s largest city where ethno-racial minority families make up 37 per cent of all Toronto families, but comprise 59 per cent of families living in poverty.51 Labour market restructuring hits immigrant communities harder than others. Most domestic and garment industry workers are immigrant women of colour, whose precarious work is low-paying, unprotected by basic employment standards and without pensions. In 2007, Colour of Poverty reported that the highest unemployment rates were found among Canadian-born men of colour (11.5 per cent) and women of colour (10 per cent).52 Government policy has not helped. Successive provincial budgets have failed to acknowledge the persistence of economic insecurity among thousands of immigrants and refugees and members of racialized communities. Despite evidence of widespread systemic discrimination, Ontario’s Employment Equity Act was repealed in 1995. Increased barriers in access to Employment Insurance over the last generation is impacting racialized and immigrant communities disproportionately as precarious working conditions and higher risk of unemployment mean that although workers pay into the program, they are not able to access unemployment insurance when it is needed.53
50
Ontario Council of Agencies Serving Immigrants,
Priorities – Ontario Election 2011. 51
Colour of Poverty, Fact Sheet #1 (2007). 52
Colour of Poverty, Fact Sheet #1 (2007). 53
Ontario Council of Agencies Serving Immigrants,
Brief to the Standing Committee on Finance (2011 Pre-
Budget Consultations).
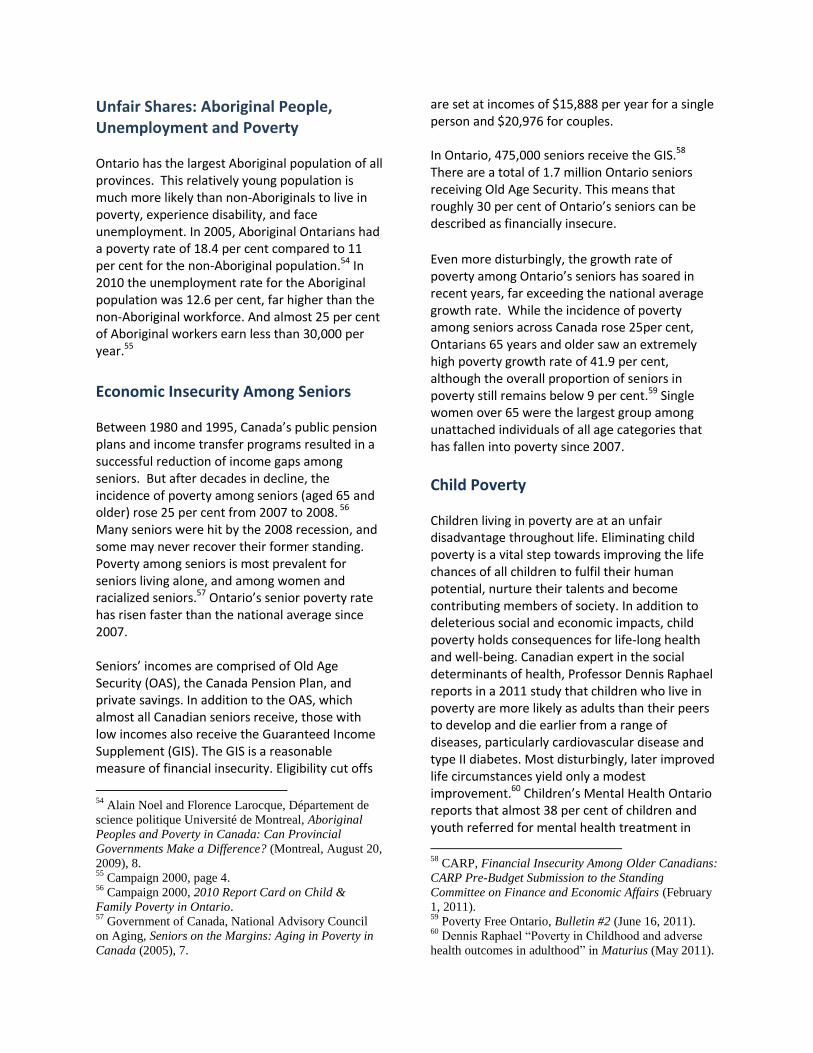
Unfair Shares: Aboriginal People, Unemployment and Poverty Ontario has the largest Aboriginal population of all provinces. This relatively young population is much more likely than non-Aboriginals to live in poverty, experience disability, and face unemployment. In 2005, Aboriginal Ontarians had a poverty rate of 18.4 per cent compared to 11 per cent for the non-Aboriginal population.54 In 2010 the unemployment rate for the Aboriginal population was 12.6 per cent, far higher than the non-Aboriginal workforce. And almost 25 per cent of Aboriginal workers earn less than 30,000 per year.55
Economic Insecurity Among Seniors Between 1980 and 1995, Canada’s public pension plans and income transfer programs resulted in a successful reduction of income gaps among seniors. But after decades in decline, the incidence of poverty among seniors (aged 65 and older) rose 25 per cent from 2007 to 2008. 56 Many seniors were hit by the 2008 recession, and some may never recover their former standing. Poverty among seniors is most prevalent for seniors living alone, and among women and racialized seniors.57 Ontario’s senior poverty rate has risen faster than the national average since 2007. Seniors’ incomes are comprised of Old Age Security (OAS), the Canada Pension Plan, and private savings. In addition to the OAS, which almost all Canadian seniors receive, those with low incomes also receive the Guaranteed Income Supplement (GIS). The GIS is a reasonable measure of financial insecurity. Eligibility cut offs
54
Alain Noel and Florence Larocque, Département de
science politique Université de Montreal, Aboriginal
Peoples and Poverty in Canada: Can Provincial
Governments Make a Difference? (Montreal, August 20,
2009), 8. 55
Campaign 2000, page 4. 56
Campaign 2000, 2010 Report Card on Child &
Family Poverty in Ontario. 57
Government of Canada, National Advisory Council
on Aging, Seniors on the Margins: Aging in Poverty in
Canada (2005), 7.
are set at incomes of $15,888 per year for a single person and $20,976 for couples. In Ontario, 475,000 seniors receive the GIS.58 There are a total of 1.7 million Ontario seniors receiving Old Age Security. This means that roughly 30 per cent of Ontario’s seniors can be described as financially insecure.
Even more disturbingly, the growth rate of poverty among Ontario’s seniors has soared in recent years, far exceeding the national average growth rate. While the incidence of poverty among seniors across Canada rose 25per cent, Ontarians 65 years and older saw an extremely high poverty growth rate of 41.9 per cent, although the overall proportion of seniors in poverty still remains below 9 per cent.59 Single women over 65 were the largest group among unattached individuals of all age categories that has fallen into poverty since 2007.
Child Poverty Children living in poverty are at an unfair disadvantage throughout life. Eliminating child poverty is a vital step towards improving the life chances of all children to fulfil their human potential, nurture their talents and become contributing members of society. In addition to deleterious social and economic impacts, child poverty holds consequences for life-long health and well-being. Canadian expert in the social determinants of health, Professor Dennis Raphael reports in a 2011 study that children who live in poverty are more likely as adults than their peers to develop and die earlier from a range of diseases, particularly cardiovascular disease and type II diabetes. Most disturbingly, later improved life circumstances yield only a modest improvement.60 Children’s Mental Health Ontario reports that almost 38 per cent of children and youth referred for mental health treatment in
58
CARP, Financial Insecurity Among Older Canadians:
CARP Pre-Budget Submission to the Standing
Committee on Finance and Economic Affairs (February
1, 2011). 59
Poverty Free Ontario, Bulletin #2 (June 16, 2011). 60
Dennis Raphael “Poverty in Childhood and adverse
health outcomes in adulthood” in Maturius (May 2011).

Falling Behind 2012
23
Growth in Poverty Rates in Ontario Compared to the Rest of Canada
By Age/Adults Living Alone 2007 and 2009
2007 % Living Below the Low Income
Measure
2009 % Living Below the Low Income
Measure
% Rate of Growth(+) or Decrease (-) 2008-2009
LIM-AT
Regional Poverty In Canada
Atlantic Provinces 16.3 15.6 -4.3
Quebec 14.6 13.7 -6.2
Ontario 11.2 13.1 +17.0
Prairies 10.0 10.8 +8.0
British Columbia 13.5 15.0 +11.1
CANADA 12.5 13.3 +6.4
Life Stage Poverty (Ontario)
Children (>18 yrs) 14.1 14.6 +3.5
Adults (18-64 yrs) 11.2 13.4 +19.6
Seniors (65 and over yrs) 6.2 8.8 +41.9
Adults Living Alone (Ontario)
Unattached Males Under 65 yrs 24.5 26.2 +6.9
Unattached Females Under 65 yrs 30.4 28.2 -7.2
Unattached Males 65 and over 13.9 14.3 +2.9
Unattached Females 65 and over 16.9 20.3 +20.1 Source: Poverty Free Ontario, Bulletin #2 (June 16, 2011) from Statistics Canada CANSIM Table 202-0802

2010 were from households with incomes less
than $30,000.61
In 2008, the Ontario government adopted a poverty reduction strategy aimed at reducing child poverty in Ontario by 25 per cent by 2013. Poverty statistics lag two years behind, but Statistics Canada data from 2009 show some early signs of improvement in child poverty rates. Unfortunately this progress is not enough to undo the significant increase in child poverty over the last generation. Moreover, the most recent Ontario budget virtually ignored the promise to reduce poverty for the youngest of Ontarians.
Children live in poverty because their families live in poverty. It is therefore not surprising that the significant growth in child poverty over the last decade in Ontario mirrors the growth in overall poverty. From 1981 to 2009, the percentage of children living below the low income measure in Ontario jumped from 11.4 per cent to 14.6 per
61
Campaign 2000, 2011 Report Card, page 7.
cent. 62 The 2010 Ontario Deprivation Index found that 8.7 per cent of Ontario children are being raised in families that could not afford at least two of 10 essential items. Unemployment for youth is more than double the overall unemployment rate in Ontario – standing at 15.6 per cent as of December 2011.63 The experience of child poverty is segmented. At higher risk are children in female lone-parent families. In 2009, more than 1 in 3 children of single mothers lived in poverty, compared to 1 in 9 children in two-parent families.64 Similarly at risk are children in ethno-racial minorities. According to the 2006 Census, 1 in 3 racialized children in Ontario live in poverty.65
62
Statistics Canada, CANSIM Table 202-0802 accessed
July 2012. 63
Campaign 2000, 2011 Report Card, page 4. 64
Ibid, page 2. 65
Ibid, page 4.
0
2
4
6
8
10
12
14
16
1981 1991 2001 2009
Data from Statistics Canada CANSIM Table 202-0802
Child Poverty in Ontario is Increasing Percentage of children under 18 living below the Low Income
Measure
Falling Behind 2012
25
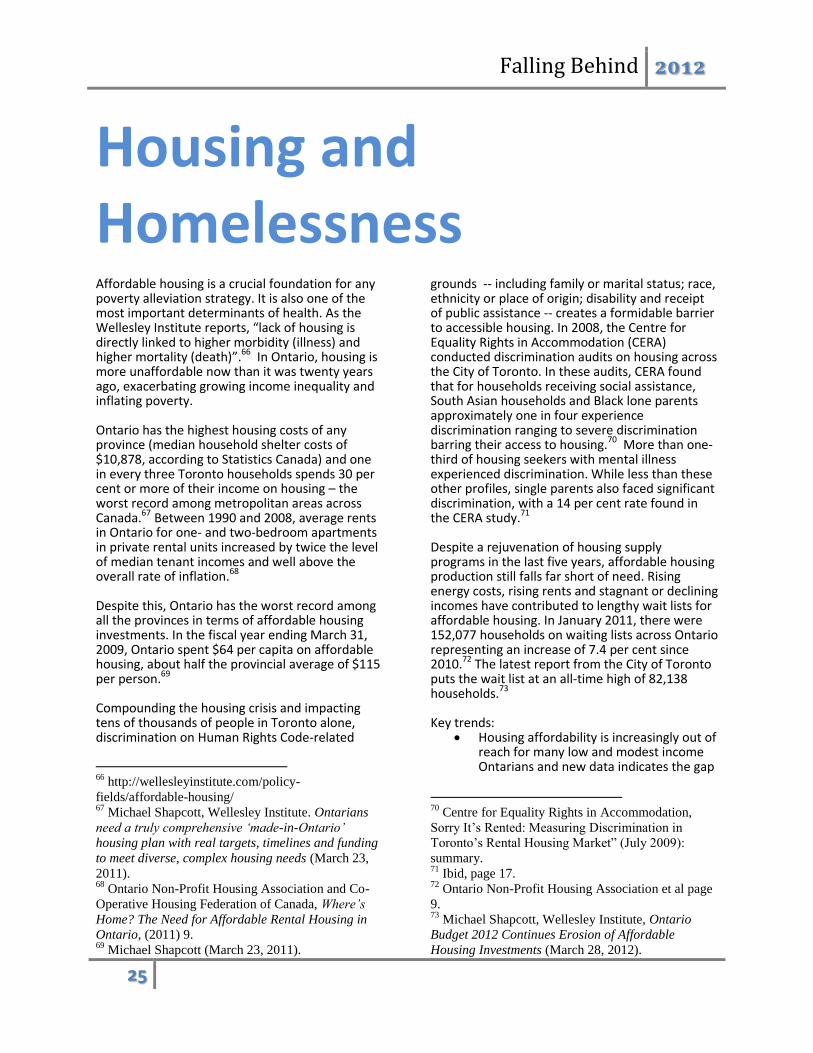
Housing and Homelessness Affordable housing is a crucial foundation for any poverty alleviation strategy. It is also one of the most important determinants of health. As the Wellesley Institute reports, “lack of housing is directly linked to higher morbidity (illness) and higher mortality (death)”.66 In Ontario, housing is more unaffordable now than it was twenty years ago, exacerbating growing income inequality and inflating poverty. Ontario has the highest housing costs of any province (median household shelter costs of $10,878, according to Statistics Canada) and one in every three Toronto households spends 30 per cent or more of their income on housing – the worst record among metropolitan areas across Canada.67
Between 1990 and 2008, average rents in Ontario for one- and two-bedroom apartments in private rental units increased by twice the level of median tenant incomes and well above the overall rate of inflation.68 Despite this, Ontario has the worst record among all the provinces in terms of affordable housing investments. In the fiscal year ending March 31, 2009, Ontario spent $64 per capita on affordable housing, about half the provincial average of $115 per person.69 Compounding the housing crisis and impacting tens of thousands of people in Toronto alone, discrimination on Human Rights Code-related
66
http://wellesleyinstitute.com/policy-
fields/affordable-housing/ 67
Michael Shapcott, Wellesley Institute. Ontarians
need a truly comprehensive ‘made-in-Ontario’
housing plan with real targets, timelines and funding
to meet diverse, complex housing needs (March 23,
2011). 68
Ontario Non-Profit Housing Association and Co-
Operative Housing Federation of Canada, Where’s
Home? The Need for Affordable Rental Housing in
Ontario, (2011) 9. 69
Michael Shapcott (March 23, 2011).
grounds -- including family or marital status; race, ethnicity or place of origin; disability and receipt of public assistance -- creates a formidable barrier to accessible housing. In 2008, the Centre for Equality Rights in Accommodation (CERA) conducted discrimination audits on housing across the City of Toronto. In these audits, CERA found that for households receiving social assistance, South Asian households and Black lone parents approximately one in four experience discrimination ranging to severe discrimination barring their access to housing.70 More than one-third of housing seekers with mental illness experienced discrimination. While less than these other profiles, single parents also faced significant discrimination, with a 14 per cent rate found in the CERA study.71 Despite a rejuvenation of housing supply programs in the last five years, affordable housing production still falls far short of need. Rising energy costs, rising rents and stagnant or declining incomes have contributed to lengthy wait lists for affordable housing. In January 2011, there were 152,077 households on waiting lists across Ontario representing an increase of 7.4 per cent since 2010.72 The latest report from the City of Toronto puts the wait list at an all-time high of 82,138 households.73 Key trends:
Housing affordability is increasingly out of reach for many low and modest income Ontarians and new data indicates the gap
70
Centre for Equality Rights in Accommodation,
Sorry It’s Rented: Measuring Discrimination in
Toronto’s Rental Housing Market” (July 2009):
summary. 71
Ibid, page 17. 72
Ontario Non-Profit Housing Association et al page
9. 73
Michael Shapcott, Wellesley Institute, Ontario
Budget 2012 Continues Erosion of Affordable
Housing Investments (March 28, 2012).

between homeowners and tenants’ incomes is growing wider.
Waiting lists for assisted housing are long and have swelled to over 152,000 Ontario households.
Overall vacancy rates have tightened considerably across the province – most noticeably in Ontario’s major urban centers.
One in five renters pays more than 50 per cent of their income on rent, putting them at risk for homelessness.
Affordable housing production remains a small fraction of what is required to meet housing need (est. requirement is 10,000 new units per year over the next decade).
Tenants who are required to pay high proportions of their incomes on rent are forced to forego other needs, and are at risk of homelessness. In 2005, 261,000 or a fifth of all households living in rental housing in Ontario were in this category, paying 50 per cent or more of their income on rent. Almost one quarter of single parent families (24 per cent) - equalling 43,100 families - were paying 50 per cent or more of their income on rent. In addition 142,300 individuals (or 26 per cent of single renters) were paying 50 per cent or more of their income on rent.74
74
Ibid, page 28.

Falling Behind 2012
27
Food Security Three per cent of Ontario’s population do not have the means to feed themselves and their families, causing them to turn to food banks. Job losses in the 2008 recession inflamed already- increasing poverty and income inequality, propelling hunger in Ontario to record levels. Fifty per cent of Ontario’s food banks reported that they had to purchase more food than usual and 41 per cent had to cut back on their hamper sizes.75 The trends in food bank usage illuminate the picture of growing inequality in Ontario. Families and individuals, already experiencing increased inequities since the early 1980s, never recovered fully after the last recession in the 1990s. Social assistance was dramatically cut and has never been restored, and income inequality took off. A year after the recession of 2008, food banks saw a 19 per cent spike in the number of people who needed emergency food help, compared to a 10 per cent increase during the recession of the early 1990s. One in every ten households that food banks helped after the recession was accessing a food bank for the first time. Though there is little data measuring food insecurity specifically among racialized groups, food insecurity is closely linked with low income and a disproportionate number of low income households consist of people of colour.76 Food banks across the Greater Toronto Area affirm that they have seen an increase in the number of food bank users from racialized communities.77 Immigrants – and particularly new immigrants – are heavily burdened with food insecurity, according to these food banks.78 Despite this, people of colour with low incomes are more likely to be without a food bank in their neighbourhoods compared to white people with low incomes79 and food banks report a lack of resources reducing their ability to provide culturally appropriate food.80 Although food bank usage has decreased slightly since the recession, by 2011 increased deep poverty persisted. The Ontario Association of Food Banks reports that every month 246,887 adults and 148,219 children look to food banks for help.
75
Debra Hubner, Ontario Association of Food Banks, Hunger Count 2011 – Ontario Provincial Report. 76
Auvniet Kaur Tehara, Approaches to People of Colour and Food Bank Use in the City of Toronto, Peel Region
andYork Region: 77
Ibid, page 36. 78
Ibid, pages 23 and 36. 79
Ibid, page 32. 80
Ibid, page 33.
Food Bank Use By the Numbers
March 2011
395,106 the number of individuals turning to food banks for help
37.5 per cent who are children under age 18 63 per cent using food banks who are rental market tenant households
10 per cent turning to food banks for help for the first time 15 per cent of food banks that ran out of food during the survey period

The Social Determinants of Health Income is perhaps the most important social determinant of health. Eminent Canadian researcher, Dennis Raphael, reports, “Level of income shapes overall living conditions, affects psychological functioning, and influences health-related behaviours such as quality of diet, extent of physical activity, tobacco use, and excessive alcohol use. In Canada, income determines the quality of other social determinants of health such as food security, housing, and other basic prerequisites of health.”81 The evidence shows that income has a significant impact on chronic disease and death rates. Researchers have found that men in the wealthiest 20 per cent of neighbourhoods in Canada live on average more than four years longer than men in the poorest 20 per cent of neighbourhoods. Women in poorer neighbourhoods live two years less than their wealthy counterparts.82 This Canadian study also found out that those living in the most deprived neighbourhoods had death rates that were 28 per cent higher than the least deprived neighbourhoods. The suicide rates in the lowest income neighbourhoods were found to be almost twice those in the wealthiest neighbourhoods. A host of studies show that adult-onset diabetes and heart attacks are far more common among low- income Canadians.
Racialized Health Disparities Recent reports and studies demonstrate that discrimination is associated with differential health effects over and above income differences, behavioural risk factors and genetic
81
Mikkonen, Juha and Dennis Raphael, Social
Determinants of Health: The Canadian Facts, York
University, 2010. 82 Wilkins, R. “Mortality by Neighbourhood Income in
Urban Canada from 1971 to 2001” HAMG Seminar,
January 16, 2007. Ottawa: Statistics Canada.
susceptibility.83 Despite this, too often, racialized groups are invisible in studies of health. Racism and structural issues particularly experienced by racialized communities are frequently not included in analysis of the social determinants of health. Often racialized groups are invisible in health promotion campaigns, experience differential treatment in health services, have a lack of access to culturally appropriate health promotion and health information.84 Racialized groups disproportionately experience food insecurity, have less access to agricultural land, face the dangerous work of food processing and agricultural labour, and migrant workers have no right to unionize.85 More than 78 per cent of recent immigrants are in racialized groups. Recent immigrants are disproportionately represented among low income households. After initial settlement challenges, underlying determinants such as racism, social exclusion, housing and employment discrimination and lack of social support continue to impact the life chances and health of newcomers.86 Refugee claimants, migrant workers and non-status/undocumented persons face additional barriers and threats to health.87
83
Diane Patychuk, Health Equity Council, Health
Equity and Racialized Groups: A Literature Review
(June 10, 2011):38. 84
Ibid, page 49. 85
Ibid, page 50. 86
Ibid, page 33. 87
Ibid.

Falling Behind 2012
29
IV. Squeezing Social
Programs Jodie is a middle-income mother in a fictional Ontario family we can all relate to. She and her husband – we’ll call him Raj—work, pay their taxes, and rely on the services that tax funding provides. Like most of us, her children went to public schools and now they are in publicly-subsidized colleges and universities. She had her children at her local public hospital and she was paid during her maternity leave through the public employment insurance system. Jodie’s good friend – let’s call her Maria -- lived on social assistance for a year when she first got out of school and couldn’t find a job. When Raj was laid off, he was supported by Employment Insurance for a few months. Now her mother lives in a tax-payer subsidized long-term care home and receives a public pension. When her father needed care for heart problems and cancer towards the end of his life, his health care was publicly funded. Jodie is not an exceptional user of public services – these are the public programs we all use every day and every year of our lives. We all benefit from tax-funded public services more than we realize. Our public services put out fires, keep our streets safe, ensure our food and water are safe, care for our most vulnerable, preserve our culture, support our environment, fund our health care and education, and do much much more. In fact, the average individual Canadian receives $17,000 in tax-funded public services every year, report economists Hugh Mackenzie and Richard Shillington. For an average household, public services are a huge boon, amounting to a benefit of $41,000 per year in tax-funded programs and services.88 Just over half of 88
Hugh Mackenzie and Richard Shillington,
Canadian Centre for Policy Alternatives, Canada’s
that benefit is made up of publicly-funded health care, education and personal transfers.
Economist Jim Stanford describes the income redistribution function of public services as follows:
I would argue that most modern government fiscal activity now fits into the broad category of efforts to redistribute both cash income and access to final consumption (including the consumption of non-cash public services), in the interests of greater equality, basic security and social inclusiveness. This is explicitly true for transfer payment programs, which redistribute cash income on the basis of concerns regarding equity and economic security for those (such as children, the elderly and the unemployed) whose market incomes may be inadequate to meet basic income standards. This is also clearly the case for the “big ticket” social programs such as health care and education. These services could be provided through private markets, but public concern over the immense personal consequences for those who might be unable to access those services through a private market system has led to public provision. In this case, again, the motive is clearly redistributional in nature…. Even more mundane forms of government program activity — such as garbage
Quiet Bargain: The Benefits of Public Spending
(April 2009), 3.

collection, transportation infrastructure, recreational facilities and environmental protection — are aimed at providing Canadians of modest means with more of these particular forms of consumption than they would typically be able to access through private market transactions alone. This redistributive motive for government fiscal activity carries various broader economic effects. For example, public provision of education may result in a better-educated population than would be possible with private education systems…. For the lowest quintile [20 per cent] of Canadian households, their consumption of non-cash public services more than doubles their total household consumption possibilities (relative to the private consumption possibilities provided by their total disposable cash income, including government transfers). Even for the middle quintile of Canadians, their share of non-cash public services is equivalent to 50 per cent of their total private (cash) consumption possibilities.”89
In the mid-1990s, budget deficits in virtually every province and at the federal level were eliminated primarily by reducing public program expenditure and cutting public services.90 While this was a nation-wide trend, Ontario led the race to cut taxes and public programs, cutting taxes more deeply and for a more prolonged period than any other province. The record on taxes is reviewed in Section V of this report. The record on public program spending is reported in the 2012 Ontario Budget. Ontario now funds all of our programs and services – from health care to education, from justice to disability benefits – less than anywhere else in Canada. Ontarians are paying for these cuts
89
Jim Stanford, “The Economic and Social
Consequences of Fiscal Retrenchment in Canada in
the 1990s” in The Review of Economic and Social
Progress – The Longest Decade: Canada in the
1990s (eds Keith Banting, Andrew Sharpe, Francis
St-Hilaire, Vol. 1, June 2001), 142-145. 90
Ibid, page 141.
in new user fees, reduced access to services, increased property taxes at the municipal level, and growing inequality.
Health Care: Burgeoning Unmet Needs The public in Ontario has been subject to a barrage of propaganda dedicated to creating a crisis to justify major health care restructuring. But contrary overheated rhetoric about health spending out-of-control, the evidence shows that Ontario’s health spending is almost the lowest in the country. As a proportion of our economic output – or GDP – health spending may be growing. But again, the evidence shows that it is near the bottom of any province and the growth rate is less than most industrialized countries.
In fact, Ontario now funds our hospitals at the lowest rate in Canada. The result? A whopping 18,500 hospital beds have been closed since 1990, cutting this province’s acute and chronic care bed capacity in half. These cuts have never been offset by investments in community care. In fact, data from Ontario’s Community Care Access Centres shows that home care funding has been declining as a proportion of health care funding since the early 2000s.
Health care cutbacks over recent decades have reduced health care services to less than the public’s need for those services, and have resulted in burgeoning wait lists and urgent unmet care needs that risk health and safety of patients and caregivers. Indeed, Ontario’s shortage of hospital beds has contributed to truly extraordinary and unprecedented levels of hospital overcrowding risking the health and safety of patients. While constant erosion has damaged access to local hospital care in many smaller and rural communities, Ontario’s larger urban centres suffer with hospital occupancy rates that are higher than virtually anywhere in the industrialized world.

Falling Behind 2012
31
Dead Last: Ontario Funds Public Programs and Services Less Than Any Other Province
Public Health Care Funding - Per Person 2010 Ontario 8th of 10 Provinces
Newfoundland $ 4,982.9
Alberta $ 4,762.9
Manitoba $ 4,611.5
Saskatchewan $ 4,602.1
PEI $ 4,389.6
New Brunswick $ 4,210.5
Nova Scotia $ 4,192.9
Ontario $ 3,911.7
British Columbia $ 3,801.8
Quebec $ 3,603.3
Ontario Ministry of Finance, Budget 2012
Figures calculated from CIHI 2011 National Health Expenditures data (CIHI)

Urgent and Unmet Care Needs Across the Health Care Continuum
More than 30,000 Ontarians are waiting for a hospital bed, long-term care placement or home care.
24,000 Ontarians are on wait lists for long-term care placement.
10,000 Ontarians are on wait lists for home care.
At any given time, 592 Ontarians are waiting in emergency departments for hospital beds.
Ontario ranks at the bottom of comparable jurisdictions in emergency department wait times, a key indicator of hospital bed shortages. Wait times for long-term care and home care are at or above the high levels of the late 1990s. Home care funding per client declined by 14 per cent between 2003 and 2009. From Ontario Health Coalition, First Do No Harm: Putting Improved Access and Accountability at the Centre of Ontario’s Health Care Reform (February 10, 2012). Wait times data from the Ministry of Health, Ontario Auditor General, Health Quality Ontario.
Across the province, hospital occupancy rates are at 98 per cent. Well-publicized emergency department backlogs and long ambulance offload delays are the most visible consequence of hospital overcrowding. But equally serious are the cancellations of surgeries and other procedures, high hospital-acquired infection rates, and greater risk for patients’ health and safety that result. Not captured in the bed cuts and emergency department wait times are the consistent cutbacks to hospital outpatient services including rehabilitation, laboratories and a host of needed services. Care for tens of thousands of seniors has been downloaded from hospitals to nursing homes, without adequate care standards to protect residents. Home care is more tightly rationed than ever, with budgets less per client now than they were in the early 2000s. Constraints on publicly-funded health care, combined with marketing by drug companies, have pushed out-of-pocket health costs up all across Canada. Ontario has almost the highest out-of-pocket health care burden paid by residents of any province. The Centre for the Study of Living Standards reports that the decline in economic security across Canada was driven largely by a decrease in security from the financial risk of illness, as measured by out-of-pocket healthcare expenditures. In Canada, the proportion of personal disposable income being spent on healthcare increased from 2.65 per cent in 1981 to 5.59 per cent in 2010.91 The Canadian Institute for Health Information reports that Ontario has the highest share of private (out-of-pocket) health care spending in the country at 32.5 per cent, compared to the Canadian average of 29.7 per cent.92
91 Osberg, Lars and Sharpe, Andrew. “Beyond GDP:
Measuring Economic Well-Being in Canada and the
Provinces 1981 – 2010” Centre for the Study of Living
Standards, September 2011. Page vi. 92
Canadian Institute for Health Information, National
Health Expenditure Trends 1975-2011, page 33.

Falling Behind 2012
33
Downloading Education Costs Onto Families Ontario families are feeling the effects of tight school budgets in their pocket books. An array of new user fees, fundraising requirements and soaring tuition costs greet families at every stage as children move through the school system from elementary schools to colleges and universities. Ontario school boards report their schools now raise over half a billion dollars in “school-generated funds,” a combination of fundraising, fees, corporate donations, and things like vending machines and cafeterias.93 University tuitions in Ontario have seen the biggest jump of anywhere in the country. The majority of school councils now report fundraising as the activity on which they spend the most time. While parents continue to raise funds for traditional items such as graduation ceremonies and student awards, more than half of school councils also report raising funds for basics such as computers, classroom supplies and text books. In addition to increased pressure to fundraise for basic school needs, user fees for student’s families are prolific. Parents across Ontario now pay out-of-pocket for everything from student activities to science classes in their children’s schools. People for Education found in their 2010/11 surveys that high school students not only pay student activity fees, but in many cases they must pay fees for labs and materials and for after-school sports. The average student activity fee has increased by 55 per cent since 2001.94 Participating in athletics costs even more. Nearly three quarters of Ontario high schools charge fees for athletics and the top amount charged has doubled since 2002, from $250 in 2002 to $500 in 2009. The rise in user fees does not stop when students graduate to university. While across Canada universities are relying increasingly on private
93
People for Education, Private Money in Public
Schools (August 2010). 94
Ibid.
income sources -- primarily tuition fees -- to fund university operations; Ontario’s record is worse than the rest of Canada. Between 1979 and 2009 the proportion of Canadian university operating revenue provided by government sources has declined from 84 per cent to 58 per cent while the proportion funded by student tuition fees has increased from 12 per cent to 35 per cent.95 In Ontario, university operating revenue from government sources declined even further, from 82 per cent to 49.5 per cent, whereas students’ tuition fees went up from 16 per cent to 44.5 per cent. 96
Tuition fees in Ontario are the most expensive of anywhere in the country, according to Statistics Canada. Increases in tuition fees have outpaced inflation leaving students with larger debt-loads. The cost of undergraduate tuition has grown markedly over the past twenty years, increasing by more than 200 per cent. Over the same period, the cost of living (inflation) increased by only 41 per cent. Tuition costs grew the fastest in Ontario (+247 per cent in 2010-2011) and the slowest at Memorial University in Newfoundland (+70 per cent).97 Between 2010 and 2012, Ontario had the largest jump in university tuition fees of anywhere in Canada. The privatization of the costs for education disproportionately impact marginalized groups. Racialised people find themselves as lower income earners, on average. Soaring tuition fees at Ontario’s schools and high student debt are a barrier to opportunities for racialized students. Downloading the cost of post-secondary education from the public and onto individual students undermines the role that education can
95
Canadian Association of University Teachers,
CAUT Almanac 2011-2012, page 3. 96
Ibid, page 4. 97
Ibid, page 23; Canadian Federation of Students,
The Racialized Impact of Tuition Fees: Assessing the
Social Cost of Post-Secondary Education, pages 2-3.

play in furthering socio-economic equity and, in contrast, stands to deepen existing inequities.98 The Native Women’s Association of Canada reports that current funding levels of First Nations
98
Canadian Federation of Students- Ontario, The
Racialized Impact of Tuition Fees: Assessing the
Social Cost of Post Secondary Education: 2.
education are well below levels given to provincial governments by the federal government. Many First Nations on-reserve schools are described as being in miserable condition and disrepair.99
99
Native Women’s Association of Canada
Submission to the International Convention on the
Elimination of All Forms of Racial Discrimination
(2012):4. 100
Statistics Canada at
http://www.statcan.gc.ca/daily-
quotidien/110916/t110916b1-eng.htm
Ontario Has the Highest Average University Undergraduate Tuition Fees 100
2010/2011r 2011/2012p 2010/2011 to 2011/2012
current dollars % change
Canada 5,146 5,366 4.3
Newfoundland and Labrador 2,649 2,649 0.0
Prince Edward Island 5,131 5,258 2.5
Nova Scotia 5,497 5,731 4.3
New Brunswick 5,647 5,853 3.6
Quebec 2,411 2,519 4.5
Ontario 6,316 6,640 5.1
Manitoba 3,593 3,645 1.4
Saskatchewan 5,431 5,601 3.1
Alberta 5,505 5,662 2.9
British Columbia 4,758 4,852 2.0

Falling Behind 2012
35
0
1,000
2,000
3,000
4,000
5,000
6,000
7,000
University Undergraduate Tuition Fees Canada and the Provinces 2011-12
$5,366
$6,640
$5,853 $5,731 $5,662 $5,601
$5,258
$4,852
$3,645
$2,649 $2,519
0
1,000
2,000
3,000
4,000
5,000
6,000
7,000
8,000
University Graduate Tuition Fees Canada and the Provinces 2011-12
(eg. Ph.D., Master's Students)
$5,599
$7,578 $7,326 $7,303
$5,258
$4,676
$4,173 $3,992
$3,504
$2,731 $2,456

$-
$1,000
$2,000
$3,000
$4,000
$5,000
$6,000
$7,000
University Undergraduate Tuition Fees Compared to Inflation
Actual tuition fees
Tuition fees by rate of inflation
Data from Colleges Ontario 2011, Statistics Canada 2011; Bank of Canada 2011
$-
$500
$1,000
$1,500
$2,000
$2,500
$3,000
College Tuition Fees Compared to Inflation
Actual tuition fees
Tuition fees by rate of inflation
Data from Colleges Ontario 2011; Statistics Canada 2011; Bank of Canada 2011

Falling Behind 2012
37
Community Services Overwhelmed
The Community and Social Services sector in Ontario is made up of about 9,000 organizations that provide critical supports and services to people in need.101 In periods of economic downturn, the role of this sector is more vital than ever. But decades of underfunding and cutbacks have left community agencies and programs overextended. While Ontario’s government has curtailed public services, relying more on the non-profit community service sector to meet peoples’ needs, improved funding to provide services has not been forthcoming. (Clutterbuck, 2007).
Wait lists for services are so long that some vital programs are virtually closed. Special Services at Home – a government program that provides funding for families caring for children with developmental or physical disabilities -- has a wait list of 9,600 families, according to Ontario’s Auditor General.102 Families report that no new applicants have received placement since 2007. The Passport Program, another government program that provides funding for adults with developmental disabilities who are waiting for community-based services, had 4,500 people on its wait list in 2010-11.103 Families are waiting years for access to funding for Intensive Behavioural Intervention for their autistic children.104
In a 2007 study of Ontario’s social services sector, researchers revealed the following trends:
Despite the significant creativity and determination of organizations and workers juggling these complex challenges day-to-day, the cumulative impact has been
101
Peter Clutterbuck et al, Heads Up Ontario!
Current Conditions and Promising Reforms to
Strengthen Ontario’s Nonprofit Community Services
Sector (2007). 102
Ontario Auditor General 2011 Annual Report,
page 290. 103
Ibid, page294. 104
Pauline Tam, “Children with autism in Ontario
face an uphill battle when seeking provincially
funded treatment” Ottawa Citizen (November 22,
2010).
disheartening. The sector is now one of the most dependent areas of our economy on part-time precarious work arrangements.
Wage rates are consistently below those of other public and private sector comparators. Wages and benefits have been essentially stagnant for the last decade, as inflation climbed by more than 23 per cent. Many workers have seen absolute reductions in pension and other benefits; some workers have no benefits or pension at all.
The administrative infrastructure of organizations has been hollowed out to stretch resources to shore up programs underfunded by government.
Large amounts of staff time that
agencies used to be able to commit
to community-building and service
delivery are being siphoned off to
attend to ever-increasing
fundraising and administrative
requirements.105
105
Peter Clutterbuck et al, Heads Up Ontario! Current
Conditions and Promising Reforms to Strengthen
Ontario’s Nonprofit Community Services Sector
(2007).

Cuts to Youth Programs
Violence – and particularly youth violence -- is often a focus of dramatic media attention. But the trends in violent crime are not often included in media stories. Murder rates are now at their lowest level since 1966 and youth (12 – 17 years old) account for one in ten persons accused of homicide.106 Despite the overall trend of deceased violent crime, murder rates in which youth are accused have increased slightly over the last generation (since 1980). Youth homicide is associated more closely with gangs; 25 per cent of homicides in which youth are accused are gang-related compared to 12 per cent for adults.107
Poverty, racism, social exclusion and lack of family support are often cited as risk factors for youth violence. Across Canada, almost one million young people are not in education, employment or training and unemployment rates for young people in Ontario are higher than those of the general population.108 Community-based programs can be effective tools for positively changing the lives and attitudes of at-risk youth.109
106
Tina Hotton Mahony, Statistics Canada. Homicide
in Canada, 2010. http://www.statcan.gc.ca/pub/85-
002-x/2011001/article/11561-eng.htm#a13 107
Ibid. 108
The Agenda with Steve Paiken. Canada’s Jobless
Generation (June 1, 2012). 109
Public Safety Canada. Prevention of Youth Gang
Violence: overview of Strategies and Approaches
(February 21, 2012).
After a period of gains in youth programs, the recent austerity budget paves the way for a retraction. Between 2005 and 2008, Ontario created a network of youth outreach workers and expanded summer youth programs.110 The 2012 Ontario budget announced a 20 per cent reduction in spending on youth services. These cuts appear to be part of a pattern of shifting funding from preventative and supportive programs to penalties. Community sanctions and other effective alternatives to the court system receive less than 10 per cent of the funding that the youth justice system receives111. While policing funding is increasing in Toronto, youth programs and services are at risk under the new cuts announced in the provincial budget
110
Frances Lankin, Toronto Star Op Ed. Echoes Still
Reverberate from Summer of the Gun (June 25,2008). 111
http://www.children.gov.on.ca/htdocs/English/topics/
youthandthelaw/roots/addressing.aspx
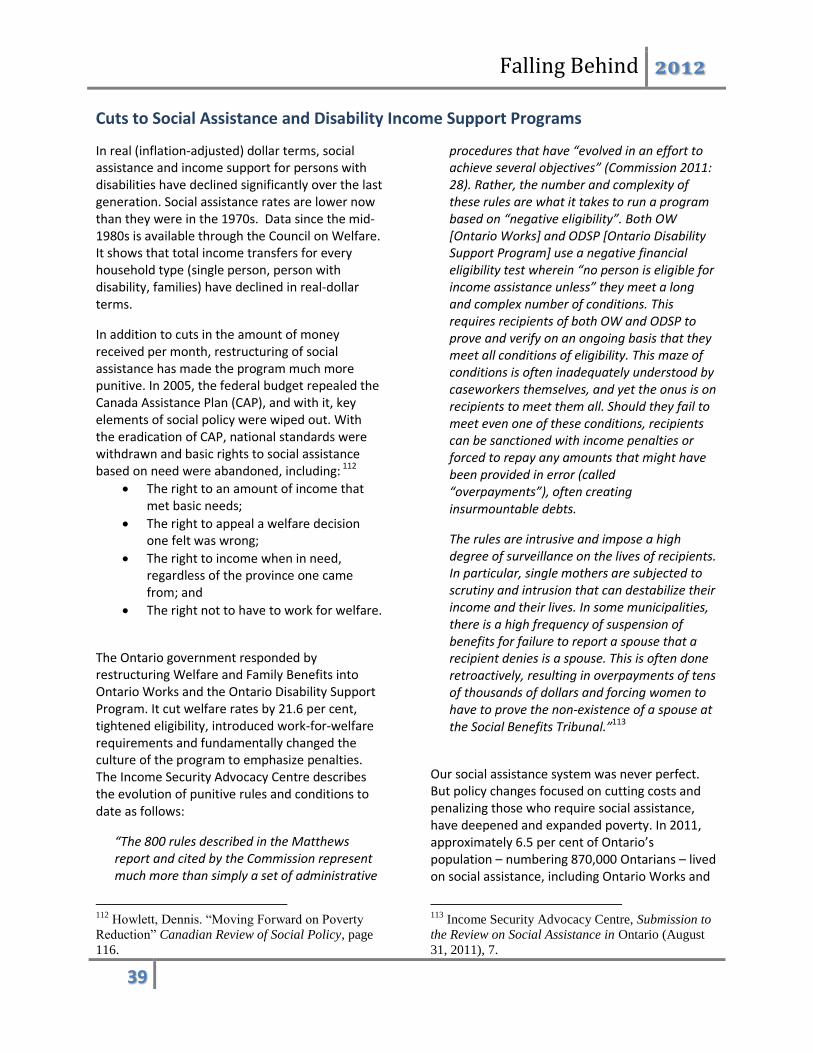
Falling Behind 2012
39
Cuts to Social Assistance and Disability Income Support Programs
In real (inflation-adjusted) dollar terms, social assistance and income support for persons with disabilities have declined significantly over the last generation. Social assistance rates are lower now than they were in the 1970s. Data since the mid-1980s is available through the Council on Welfare. It shows that total income transfers for every household type (single person, person with disability, families) have declined in real-dollar terms.
In addition to cuts in the amount of money received per month, restructuring of social assistance has made the program much more punitive. In 2005, the federal budget repealed the Canada Assistance Plan (CAP), and with it, key elements of social policy were wiped out. With the eradication of CAP, national standards were withdrawn and basic rights to social assistance based on need were abandoned, including: 112
The right to an amount of income that met basic needs;
The right to appeal a welfare decision one felt was wrong;
The right to income when in need, regardless of the province one came from; and
The right not to have to work for welfare.
The Ontario government responded by restructuring Welfare and Family Benefits into Ontario Works and the Ontario Disability Support Program. It cut welfare rates by 21.6 per cent, tightened eligibility, introduced work-for-welfare requirements and fundamentally changed the culture of the program to emphasize penalties. The Income Security Advocacy Centre describes the evolution of punitive rules and conditions to date as follows:
“The 800 rules described in the Matthews report and cited by the Commission represent much more than simply a set of administrative
112
Howlett, Dennis. “Moving Forward on Poverty
Reduction” Canadian Review of Social Policy, page
116.
procedures that have “evolved in an effort to achieve several objectives” (Commission 2011: 28). Rather, the number and complexity of these rules are what it takes to run a program based on “negative eligibility”. Both OW [Ontario Works] and ODSP [Ontario Disability Support Program] use a negative financial eligibility test wherein “no person is eligible for income assistance unless” they meet a long and complex number of conditions. This requires recipients of both OW and ODSP to prove and verify on an ongoing basis that they meet all conditions of eligibility. This maze of conditions is often inadequately understood by caseworkers themselves, and yet the onus is on recipients to meet them all. Should they fail to meet even one of these conditions, recipients can be sanctioned with income penalties or forced to repay any amounts that might have been provided in error (called “overpayments”), often creating insurmountable debts.
The rules are intrusive and impose a high degree of surveillance on the lives of recipients. In particular, single mothers are subjected to scrutiny and intrusion that can destabilize their income and their lives. In some municipalities, there is a high frequency of suspension of benefits for failure to report a spouse that a recipient denies is a spouse. This is often done retroactively, resulting in overpayments of tens of thousands of dollars and forcing women to have to prove the non-existence of a spouse at the Social Benefits Tribunal.”113
Our social assistance system was never perfect. But policy changes focused on cutting costs and penalizing those who require social assistance, have deepened and expanded poverty. In 2011, approximately 6.5 per cent of Ontario’s population – numbering 870,000 Ontarians – lived on social assistance, including Ontario Works and
113
Income Security Advocacy Centre, Submission to
the Review on Social Assistance in Ontario (August
31, 2011), 7.

the Ontario Disability Support Program. A family led by a single parent in 2011 is forced, under the current social assistance system, to live on $9,122 less than the low income measure.114
114
Campaign 2000, 2011 Report Card, page 6.
With rates set far below any reasonable measure of poverty, social assistance recipients are forced into a daily struggle, unable to meet even the basic necessities of life.
Social Assistance Rates Are Decreasing Ontario Welfare and Disability Benefits By Year, Constant Dollars 1986-2011
Household Type
1986 1991 1996 2001 2006 2011
Single Person $9374 $11 705 $9 183 $8 372 $7 754 $7 595
Person with a Disability
$16 339 $15 859 $14 421 $13 363 $13 227
Lone Parent, One Child
$18 733 $23 311 $18 445 $16 953 $17 071 $18 069
Couple, Two Children
$24 784 $31093 $24 379 $22 472 $22 150 $24 010
Source: National Council on Welfare: data accessed July 2012. Total welfare incomes include basic social assistance and additional welfare benefits, plus child benefits, tax credits, the GST credit and resource rebates.

Falling Behind 2012
41
The Erosion of Unemployment Insurance Protection The erosion of social assistance has been compounded by deterioration in Unemployment Insurance eligibility. Unlike the other social programs covered in this section, Unemployment Insurance is a federal program, funded through payroll deductions. For decades, access to Unemployment Insurance has been corroded despite regular surpluses in the unemployment insurance fund. Federal-level budgets have prioritized tax cuts for corporations and the wealthy for decades and Unemployment Insurance surpluses have been used to pay down federal deficits when they occur, while coverage for unemployed workers has been severely curtailed. Racialized Ontarians want work, but have trouble finding it, reports Sheila Block in her analysis of the 2006 Census data. Higher unemployment rates are impact 90 per cent of the racialized population. Even before the 2008 recession levied its destruction, in 2005 the unemployment rate for racialized workers in Ontario was 8.7 per cent, compared to a 5.8 per cent for the rest of Ontarians.115
115
Sheila Block, Canadian Centre for Policy
Alternatives, Ontario’s Growing Gap: the Role of
Race and Gender (June 2010).
If unemployed workers are able to meet ever more stringent eligibility criteria for the EI benefits that they have paid into, they find that in real dollars, benefits have been cut. In 1996, the maximum weekly benefit was $604. Today’s maximum is only $435, and the average benefit is just $335 per week.116 Across Canada only 40 per cent of unemployed workers are eligible for the program.117 Ontario has among the most austere eligibility regimes. Here, as of April 2012, only 26 per cent of unemployed workers were able to access EI, even before the more stringent guidelines for applicants were imposed by the 2012 Federal Budget.
116
Canadian Labour Congress at:
http://www.canadianlabour.ca/issues/unemployment-
insurance 117
Erin Weir, Canadian Centre for Policy
Alternatives, EI: More Workers Fall Through the
Cracks (June 21, 2012).


Falling Behind 2012
43
V. The Race to the Bottom: Tax Cuts and Inequality
Tax cuts have reduced Ontario’s provincial revenue potential by more than $15 billion per year. This means that $15 billion annually is no longer available to fund public programs and income supports that create equity and support our quality of life. Despite rhetoric about tax cuts driving economic investment, in fact, business investment in new equipment and machinery is down in Ontario, and has been waning throughout the entire period of tax cuts.118 At the same time, labour market trends have delivered more unequal salaries and wages and more precarious, contract and insecure work. As public revenues recoiled with the retraction of taxes, cuts and curtailments to public services and income supports were launched. The result? Inequality has been driven up, and it has risen steeply. Starting in the mid-1990s, Ontario led the country in precipitous race to cut both corporate taxes and income taxes; policies that have disproportionately benefitted the wealthy. A study by economist Marc Lee has found that almost all Canadians see no benefit from tax cuts. Only the top 10 per cent of the income scale (individuals earning $120,000 -$266,000 or more per year) have profited from the tax cuts that began in the early 1990s. The study, which is the first comprehensive review of tax changes at all levels of government in Canada within the past 15 years, finds the tax system is delivering larger tax
118
Erin Weir, Canadian Centre for Policy
Alternatives, Corporate Taxes and Investment in
Ontario (January 23, 2010)
savings for high income families, reinforcing the growing gap in income between high income families and the rest of Canadians.119 Dr. Michael Rachlis and economist Hugh Mackenzie report that the sustainability of public services such as health care has been brought into question, not because of out-of-control spending on these programs, but rather as a result of the negative impact of tax cuts on provincial revenues. They note Ontario’s role in leading the race to gut provincial tax revenues: “All provinces participated in the tax cut competition of the late 1990s and early 2000s, but not to the same extent…. While the dollar revenue losses in aggregate were substantial both in absolute and relative terms, there were significant differences among provinces, both in the relative size of the cuts and their timing. In that period, three of the four Atlantic Provinces did not implement substantial cuts in either personal or corporate income taxes; Ontario made the deepest corporate tax cuts and the second-deepest personal income tax cuts….In particular, the role of Ontario as the tax cut leader is evident from the timing of provincial level personal income tax cuts announced in budgets up to and including 2002.120
119
Marc Lee, Canadian Centre for Policy
Alternatives Eroding Tax Fairness:Tax Incidence in
Canada 1990-2005 (November 2007). 120
Hugh Mackenzie and Dr. Michael Rachliss,
Canadian Federation of Nurses Unions, The
Sustainability of Medicare (2010), 26-28.

Cuts proceeded through the mid-late 1990s. In 2002, the Ernie Eves government suspended the deep corporate tax cuts announced in the 2000
budget. In 2004, the McGuinty government enacted a partial reversal, but U-turned in the
2010 budget when it announced a new
schedule of corporate tax cuts. Ontario is now one of the lowest corporate tax jurisdictions in North America. Public program spending has suffered in tandem with the cuts to Ontario’s revenues as a result of the tax cuts.
Corporate Income Tax Cuts
Impact of Cuts 2005-6 (millions
of dollars)
2005-6 actual revenue (millions
of dollars)
Relative impact of cut
Newfoundland and Labrador 0 198 0.0%
Prince Edward Island 2 38 5.3%
Nova Scotia 0 363 0%
New Brunswick -78 165 -44.2%
Quebec -1 099 3 667 -30.0%
Ontario -3 978 8 296 -48.0%
Manitoba -81 352 -23.0%
Saskatchewan -39 393 -9.9%
Alberta -565 4 728 -12.0%
British Columbia -461 1 570 29.4%
Total -6 294 19 770 -31.8% Source: Mackenzie and Rachlis, taken from Income tax cuts by province, budgets between 1996 and 2002 – annual revenue loss, unpublished data, Finance Canada, October 2002. CANSIM Table 385-001, Statistics Canada 2010.
Source: economist Hugh Mackenzie in Steering Ontario Out of Recession (March 2010).

Falling Behind 2012
45
Personal Income Tax Cuts
Impact of Cuts 2005-6 (millions of dollars)
2005-6 actual revenue (millions of
dollars)
Relative impact of cut
Newfoundland and Labrador -62 821 -7.6%
Prince Edward Island -22 205 -10.7%
Nova Scotia -241 1 565 -15.4%
New Brunswick -269 1080 -24.9%
Quebec -5 395 19 527 -27.6%
Ontario -12 129 24 291 -49.9%
Manitoba -411 1 941 -21.2%
Saskatchewan -673 1 449 -46.4%
Alberta -2 210 2 889 -76.5%
British Columbia -2 744 5 943 -46.2%
Total -24 155 59 711 -40.5% Source: Mackenzie and Rachlis, taken from Income tax cuts by province, budgets between 1996 and 2002 – annual revenue loss, unpublished data, Finance Canada, October 2002. CANSIM Table 385-001, Statistics Canada 2010.
There has been far too little public accounting of the costs and consequences of the tax cuts. In fact, the evidence shows that while Ontarians are paying for tax cuts in new user fees and declining programs, the economic merit of the tax cuts is dubious at best. As economist Erin Weir reports,
Last week, Ontario’s Ministry of Finance released the Ontario Economic Accounts for the third quarter of 2011. As The Globe reported, business investment was less than impressive:
. . . investment in machinery and equipment fell slightly by 0.2 per cent between June and September, 2011, prompting Ontario Finance Minister Dwight Duncan to fire a shot across the bow of corporations.
Mr. Duncan said Ontario has the most competitive tax system in North America thanks to reforms introduced by the governing Liberals that have eliminated capital taxes and reduced the corporate rate to 11.5 per cent from 14 per cent in
2010. The rate is set to decline further, to 11 per cent this June and 10 per cent in June, 2013.
“I expect businesses to invest and create jobs,” Mr. Duncan said. “They’ve got to step up to the table and invest here in Ontario.”
As Duncan waits impatiently for a deluge of investment following his recent corporate tax cuts, he should consider that corporate tax rates have been falling for more than a decade. The Ontario Economic Accounts show that we are still waiting for the promised pickup in business investment.
In fact, economist Hugh Mackenzie notes that a reduction in the combined federal-provincial tax rate below the U.S. standard tax rate of 35 per cent achieves nothing but a transfer of income to the American treasury. The United States taxes its corporations based on world-wide income: “For U.S. based corporations operating in Canada, every percentage point that Canada’s combined

corporate income tax rate falls below the standard U.S. rate of 35 per cent ultimately results in a transfer of that percentage of corporate profits earned in Canada to the U.S. Treasury. A cut in Canada’s combined corporate tax rate below the U.S. federal rate of 35 per cent does not result in tax savings for the corporate taxpayer. It simply transfers the revenue from Canadian provinces and the federal government to the government of the United States.” (Ontario’s combined federal-provincial corporate tax rate was 28 per cent in 2011.)121
121
Hugh Mackenzie, Canadian Centre for Policy
Alternatives, Steering Ontario Out of Recession
Moreover, Mackenzie argues, most of the benefit from reduced tax rates on large corporations will flow to the financial services and energy sectors. Economic activity in these sectors is clearly driven by factors other than differences in corporate income tax rates.122
122
Hugh Mackenzie, Canadian Centre for Policy
Alternatives, Steering Ontario Out of Recession
Business Investment is Down: Ontario’s Low Corporate Taxes Have Not Resulted in
Increased Investment Year Ontario
Corporate Income Tax
Combined (Fed/Prov)
Corporate Income Tax
Corporate Investment / GDP
1999 15.5 % 44.6 % 8.3 %
2000 14.5 % 43.6 % 8.0 %
2001 14.0 % 42.1 % 7.6 %
2002 12.5 % 38.6 % 6.8 %
2003 12.5 % 36.6 % 6.6 %
2004 14.0 % 36.1 % 6.5 %
2005 14.0 % 36.1 % 6.7 %
2006 14.0 % 36.1 % 6.8 %
2007 14.0 % 36.1 % 6.3 %
2008 14.0 % 33.5 % 6.4 %
2009 14.0 % 33.0 % 5.5 %
2010 12.0 % 30.0 % 5.6 %
2011* 11.5 % 28.0 % 6.0 %
Source: economist Erin Weir Ontario’s provincial corporate income tax rate, the combined federal-Ontario corporate income tax rate, and business investment in machinery and equipment as a share of provincial Gross Domestic Product at market prices. The 2011 figure covers the first three quarters.

Falling Behind 2012
47
VI. Conclusion Ontario remains a beautiful province of vast promise. But growing inequality resulting from runaway incomes at the top and a harshly restructured labour force for middle and lower income earners, have meant that almost half the population of an entire generation of Ontario’s families has worked harder but not enjoyed the rewards of their increased labour. The long stretches of economic growth experienced in this province since 1980 have been hijacked by the wealthiest at the expense of middle and lower income brackets. In fact, most of these families are falling behind, despite putting more hours into the workforce. These trends have disproportionately impacted women, racialized communities, aboriginals, seniors and children. Ontario’s governments have failed to mitigate the growing inequality distributed by the private market. Government choices – in budgets and in economic and social policy – have relentlessly favoured the interests of the wealthy over the rest. Ontario’s budgets for the last fifteen years have repeatedly prioritized tax cuts while casting concomitant cuts to social programs as necessities rather than choices. Social policies that temper inequalities experienced by women and racialized communities have been dismantled. Social programs that benefit all Ontarians and redistribute income through free public services such as education and health care face relentless budget pressure. User fees and requirements for out-of-pocket payment for public services are on the rise. Public sector restructuring is aping the private sector trend of soaring incomes at the top and precarious job security for many. Income transfer programs such as social assistance and disability have declined precipitously as inflation has outpaced meager increases. Paltry support for assisted housing and cuts to community service budgets has left families and individuals to suffer the impacts of growing inequality without aid. Federal program cuts to unemployment insurance have had a grave impact on Ontario
workers suffering from the 2008 recession. The result is that Ontario has the fastest growing income inequality and among the largest leaps in poverty rates of anywhere in Canada. There are alternatives. No province is perfect, but trends from across the country show that Ontario’s budget and social policy choices are just that – choices. Ontario – a province with a relatively large GDP, extraordinary education attainment levels and vast economic resources -- now ranks at the very bottom of Canada in funding all social programs and services. Corporate tax cuts have dominated Ontario’s budgets to the point that this province in now one of the lowest tax jurisdictions in all of North America, despite evidence that corporations are not using their largess to invest in Ontario. Economic strategy is rarely debated – and aside from continual tax cuts and privatization of social programs, it appears to be virtually nonexistent. Ontario ranks at or near the bottom of the country in funding for vital public programs such as housing and health care while tuitions and user fees here are the highest in Canada. There is no question that Ontario can and should take action to improve our record on equality. Across Canada, many provinces are doing much better than Ontario in supporting income transfers and public programs. Around the world, even in this era of global economic restructuring, there are plentiful examples of countries that develop economic policies to benefit the public interest and social policies that promote social inclusion and relative equity. Within Ontario, reams of policy recommendations have been made by academics, policy experts and public interest groups. It is not by necessity, but by choice that our governments are making policies that benefit the few at the expense of the public interest. We all have the ability to pressure our governments to make better choices. Indeed, it is our obligation to the next generation to do so.

Buoyant public program funding, robust income security programs, stable social services, and public policy that address the rising tide of income are vital to protect Ontarians against growing inequality. As this report is distributed, we will be consulting with a broad array of groups and interested individuals about alternatives. We will be compiling these for public release.
Tax Fairness and Restored Sustainability
Here are some potential revenue-generating alternatives that would help to restore sustainability and contribute to tax fairness:
Fair Taxes for Corporations Restore corporate income tax rate to 2009 levels (14%) Revenue impact: + $2 billion per year Restore corporate capital tax Revenue impact: + $700 million per year Financial transactions tax at 0.1% Revenue impact: + $1 billion per year Suspend phase-in of HST tax credit for energy purchases by corporations Revenue impact: + $1.3 billion per year Uniform rate for Business Education Taxes & indexation education taxes Revenue impact: + $1 billion per year
Fair Taxes for High Income Earners Make permanent the raised income tax rate on incomes over $500,000 by 2% Revenue impact: + $500 million per year Raise income tax rate on incomes over $300,000 by 2% Revenue impact: + $800 million per year
Close Tax Loopholes Eliminate tax preferences for stock options and capital gains Revenue impact: + $1.5 billion per year Close Ontario’s Employer Health Tax Loopholes Revenue impact: + $2.3 billion per year Tax audit collection and compliance measures Revenue impact: + $2 billion per year
There Are Alternatives to Cuts, Rising Inequality and Austerity
The following groups are members of the Common Front Steering Committee. Each group has policy analysis and alternatives to share – and there are many other organizations concerned with growing inequality that also have resources. Please see our website at www.weareontario.ca for more. You can also friend us on Facebook or follow us on Twitter.
Acorn Canada www.acorncanada.org
Alliance of Seniors/Older Canadians Network www.opatoday.com
Canadian Federation of Students-Ontario www.cfsontario.ca
Canadian Pensioners Concerned www.canpension.ca
Coalition of Black Trade Unionists-Ontario www.cbtu.ca
Colour of Poverty.Colour of Change www.facebook.com/groups/colourofpoverty.colourofchange
Faith Communities in Action Against Poverty www.isarc.ca
Latin American Trade Unionists Coalition www.latuc.ca
Nia Centre for the Arts www.niacentre.org
ODSP Action Coalition www.odspaction.ca
Ontario Council of Agencies Serving Immigrants www.ocasi.org
Ontario Federation of Labour www.ofl.ca
Ontario Health Coalition www.web.net.ohc
Step It Up Ontario www.stepitupontario.ca
Social Planning Network of Ontario www.spno.ca
Workers Action Centre www.workersactioncentre.org