Fallacies of Agreement: A Critical Review of Consensus ...fanis/docs/gelicitation.pdf · Fallacies...
50
Fallacies of Agreement: A Critical Review of Consensus Assessment Methods for Gesture Elicitation THEOPHANIS TSANDILAS, Inria, Université Paris-Saclay, and Univ Paris-Sud, France Discovering gestures that gain consensus is a key goal of gesture elicitation. To this end, HCI research has developed statistical methods to reason about agreement. We review these methods and identify three major problems. First, we show that raw agreement rates disregard agreement that occurs by chance and do not reliably capture how participants distinguish among referents. Second, we explain why current recommen- dations on how to interpret agreement scores rely on problematic assumptions. Third, we demonstrate that significance tests for comparing agreement rates, either within or between participants, yield large Type I error rates (> 40% for α = .05). As alternatives, we present agreement indices that are routinely used in inter-rater reliability studies. We discuss how to apply them to gesture elicitation studies. We also demonstrate how to use common resampling techniques to support statistical inference with interval estimates. We apply these methods to reanalyze and reinterpret the findings of four gesture elicitation studies. CCS Concepts: • Human-centered computing → Interaction design process and methods; Gestural input; User centered design; HCI theory, concepts and models; Additional Key Words and Phrases: Gesture elicitation, gestures, agreement rates, agreement indices, bias, chance agreement, kappa coefficients, confidence intervals, replication, statistics, content analysis ACM Reference Format: Theophanis Tsandilas. 2018. Fallacies of Agreement: A Critical Review of Consensus Assessment Methods for Gesture Elicitation. ACM Trans. Comput.-Hum. Interact. 1, 1 (April 2018), 50 pages. https://doi.org/10.1145/ nnnnnnn.nnnnnnn 1 INTRODUCTION Gesture elicitation is widely used in Human-Computer Interaction (HCI) for identifying gesture vocabularies that are self-discoverable or easy to learn [Wobbrock et al. 2009]. In a typical gesture elicitation study, participants are shown the outcome of user interface actions or commands and are asked to propose gestures that would trigger these actions. While the hope is that consistent gesture-to-action associations will emerge, participants may also not agree in their proposals. Thus, analyzing agreement between participants is a key aspect of the method [Vatavu and Wobbrock 2015, 2016; Wobbrock et al. 2009]. Agreement analysis can guide the design of gesture vocabularies and help understand why some commands or actions naturally map to gestures. A widely used measure for quantifying agreement in gesture elicitation studies is the index A introduced by Wobbrock et al. [2005]. The index has been recently superseded by a more accurate measure of agreement, the agreement rate AR [Findlater et al. 2012; Vatavu and Wobbrock 2015]. Vatavu and Wobbrock [2015] argued for the adoption of the new index and provided guidelines on how to interpret agreement rates by suggesting ranges of low, medium, high, and very high agreement. Furthermore, they proposed the V rd significance test for comparing agreement rates within participants. More recently, Vatavu and Wobbrock [2016] introduced the V b significance test for comparing agreement rates between independent groups of participants. Author’s addresses: T. Tsandilas, Laboratoire de Recherche en Informatique, Bat. 650 Ada Lovelace, Université Paris-Sud, 91405 Orsay Cedex France. Email: [email protected]. © 2018 Association for Computing Machinery. This is the author’s version of the work. It is posted here for your personal use. Not for redistribution. The definitive Version of Record was published in ACM Transactions on Computer-Human Interaction, https://doi.org/10.1145/nnnnnnn.nnnnnnn. ACM Transactions on Computer-Human Interaction, Vol. 1, No. 1, Article . Publication date: April 2018.
Transcript of Fallacies of Agreement: A Critical Review of Consensus ...fanis/docs/gelicitation.pdf · Fallacies...

Fallacies of Agreement: A Critical Review of ConsensusAssessment Methods for Gesture Elicitation
THEOPHANIS TSANDILAS, Inria, Université Paris-Saclay, and Univ Paris-Sud, France
Discovering gestures that gain consensus is a key goal of gesture elicitation. To this end, HCI research hasdeveloped statistical methods to reason about agreement. We review these methods and identify three majorproblems. First, we show that raw agreement rates disregard agreement that occurs by chance and do notreliably capture how participants distinguish among referents. Second, we explain why current recommen-dations on how to interpret agreement scores rely on problematic assumptions. Third, we demonstrate thatsignificance tests for comparing agreement rates, either within or between participants, yield large TypeI error rates (> 40% for α = .05). As alternatives, we present agreement indices that are routinely used ininter-rater reliability studies. We discuss how to apply them to gesture elicitation studies. We also demonstratehow to use common resampling techniques to support statistical inference with interval estimates. We applythese methods to reanalyze and reinterpret the findings of four gesture elicitation studies.
CCS Concepts: • Human-centered computing → Interaction design process and methods; Gesturalinput; User centered design; HCI theory, concepts and models;
Additional Key Words and Phrases: Gesture elicitation, gestures, agreement rates, agreement indices, bias,chance agreement, kappa coefficients, confidence intervals, replication, statistics, content analysis
ACM Reference Format:Theophanis Tsandilas. 2018. Fallacies of Agreement: A Critical Review of Consensus Assessment Methods forGesture Elicitation. ACM Trans. Comput.-Hum. Interact. 1, 1 (April 2018), 50 pages. https://doi.org/10.1145/nnnnnnn.nnnnnnn
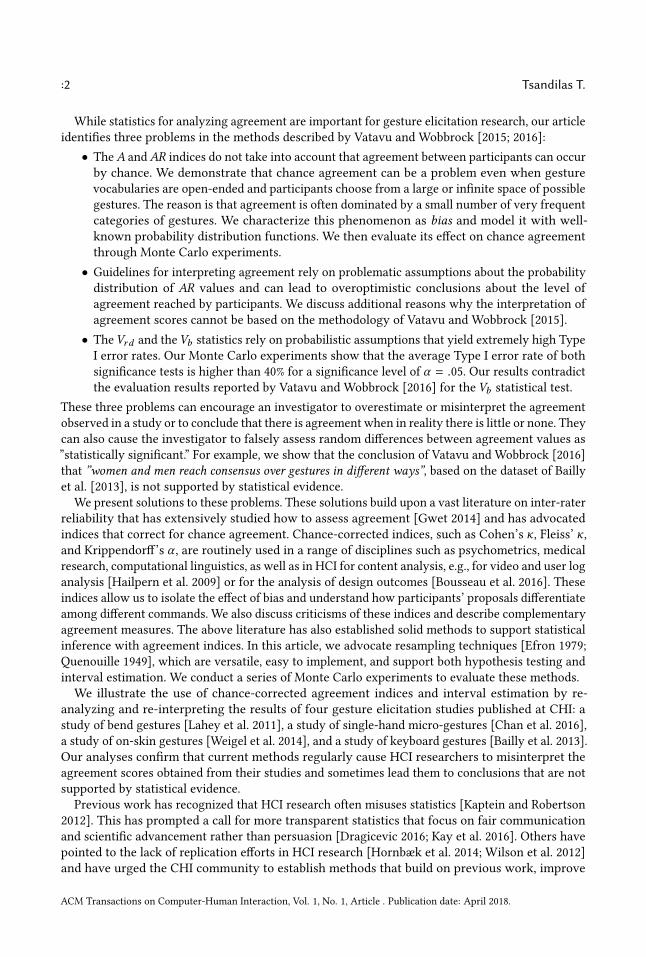
1 INTRODUCTIONGesture elicitation is widely used in Human-Computer Interaction (HCI) for identifying gesturevocabularies that are self-discoverable or easy to learn [Wobbrock et al. 2009]. In a typical gestureelicitation study, participants are shown the outcome of user interface actions or commands andare asked to propose gestures that would trigger these actions. While the hope is that consistentgesture-to-action associations will emerge, participants may also not agree in their proposals. Thus,analyzing agreement between participants is a key aspect of the method [Vatavu and Wobbrock2015, 2016; Wobbrock et al. 2009]. Agreement analysis can guide the design of gesture vocabulariesand help understand why some commands or actions naturally map to gestures.A widely used measure for quantifying agreement in gesture elicitation studies is the index A
introduced by Wobbrock et al. [2005]. The index has been recently superseded by a more accuratemeasure of agreement, the agreement rate AR [Findlater et al. 2012; Vatavu and Wobbrock 2015].Vatavu and Wobbrock [2015] argued for the adoption of the new index and provided guidelineson how to interpret agreement rates by suggesting ranges of low, medium, high, and very highagreement. Furthermore, they proposed the Vrd significance test for comparing agreement rateswithin participants. More recently, Vatavu and Wobbrock [2016] introduced the Vb significancetest for comparing agreement rates between independent groups of participants.
Author’s addresses: T. Tsandilas, Laboratoire de Recherche en Informatique, Bat. 650 Ada Lovelace, Université Paris-Sud,91405 Orsay Cedex France. Email: [email protected].
© 2018 Association for Computing Machinery.This is the author’s version of the work. It is posted here for your personal use. Not for redistribution. The definitive Versionof Record was published in ACM Transactions on Computer-Human Interaction, https://doi.org/10.1145/nnnnnnn.nnnnnnn.
ACM Transactions on Computer-Human Interaction, Vol. 1, No. 1, Article . Publication date: April 2018.
:2 Tsandilas T.
While statistics for analyzing agreement are important for gesture elicitation research, our articleidentifies three problems in the methods described by Vatavu and Wobbrock [2015; 2016]:• TheA andAR indices do not take into account that agreement between participants can occurby chance. We demonstrate that chance agreement can be a problem even when gesturevocabularies are open-ended and participants choose from a large or infinite space of possiblegestures. The reason is that agreement is often dominated by a small number of very frequentcategories of gestures. We characterize this phenomenon as bias and model it with well-known probability distribution functions. We then evaluate its effect on chance agreementthrough Monte Carlo experiments.• Guidelines for interpreting agreement rely on problematic assumptions about the probabilitydistribution of AR values and can lead to overoptimistic conclusions about the level ofagreement reached by participants. We discuss additional reasons why the interpretation ofagreement scores cannot be based on the methodology of Vatavu and Wobbrock [2015].• TheVrd and theVb statistics rely on probabilistic assumptions that yield extremely high TypeI error rates. Our Monte Carlo experiments show that the average Type I error rate of bothsignificance tests is higher than 40% for a significance level of α = .05. Our results contradictthe evaluation results reported by Vatavu and Wobbrock [2016] for the Vb statistical test.
These three problems can encourage an investigator to overestimate or misinterpret the agreementobserved in a study or to conclude that there is agreement when in reality there is little or none. Theycan also cause the investigator to falsely assess random differences between agreement values as”statistically significant.” For example, we show that the conclusion of Vatavu and Wobbrock [2016]that ”women and men reach consensus over gestures in different ways”, based on the dataset of Baillyet al. [2013], is not supported by statistical evidence.
We present solutions to these problems. These solutions build upon a vast literature on inter-raterreliability that has extensively studied how to assess agreement [Gwet 2014] and has advocatedindices that correct for chance agreement. Chance-corrected indices, such as Cohen’s κ, Fleiss’ κ,and Krippendorff’s α , are routinely used in a range of disciplines such as psychometrics, medicalresearch, computational linguistics, as well as in HCI for content analysis, e.g., for video and user loganalysis [Hailpern et al. 2009] or for the analysis of design outcomes [Bousseau et al. 2016]. Theseindices allow us to isolate the effect of bias and understand how participants’ proposals differentiateamong different commands. We also discuss criticisms of these indices and describe complementaryagreement measures. The above literature has also established solid methods to support statisticalinference with agreement indices. In this article, we advocate resampling techniques [Efron 1979;Quenouille 1949], which are versatile, easy to implement, and support both hypothesis testing andinterval estimation. We conduct a series of Monte Carlo experiments to evaluate these methods.We illustrate the use of chance-corrected agreement indices and interval estimation by re-
analyzing and re-interpreting the results of four gesture elicitation studies published at CHI: astudy of bend gestures [Lahey et al. 2011], a study of single-hand micro-gestures [Chan et al. 2016],a study of on-skin gestures [Weigel et al. 2014], and a study of keyboard gestures [Bailly et al. 2013].Our analyses confirm that current methods regularly cause HCI researchers to misinterpret theagreement scores obtained from their studies and sometimes lead them to conclusions that are notsupported by statistical evidence.
Previous work has recognized that HCI research often misuses statistics [Kaptein and Robertson2012]. This has prompted a call for more transparent statistics that focus on fair communicationand scientific advancement rather than persuasion [Dragicevic 2016; Kay et al. 2016]. Others havepointed to the lack of replication efforts in HCI research [Hornbæk et al. 2014; Wilson et al. 2012]and have urged the CHI community to establish methods that build on previous work, improve
ACM Transactions on Computer-Human Interaction, Vol. 1, No. 1, Article . Publication date: April 2018.

Fallacies of Agreement: A Critical Review of Consensus Assessment Methods for GestureElicitation :3
results, and accumulate scientific knowledge [Kostakos 2015]. We hope that the critical stance weadopt in this article will contribute to a fruitful dialogue, encourage HCI researchers to questionmainstream practices, and stress the need for our discipline to consolidate its research methods bydrawing lessons from other scientific disciplines.
2 PRELIMINARIESWe start with background material that will later help us clarify our analysis. We introduce keyconcepts of gesture elicitation. We clarify the steps of the process and define our terminology.Finally, we introduce the main questions that we investigate in this article and summarize theoverall structure of our analysis.
2.1 Referents, Gestures, and SignsMany of the key concepts of gesture elicitation were introduced by Good et al. [1984], Nielsen etal. [2004], and Wobbrock et al. [2005; 2009]. Wobbrock et al. [2009] summarize the approach asfollows: participants are prompted with referents, or the effects of actions, and perform signs thatcause those actions.
The analysis of Wobbrock et al. [2009] makes no distinction between gestures and signs. In ouranalysis, we distinguish between the physical gestures performed by participants and their signs. Asign can be thought of as the interpretation of an observed gesture, or otherwise, an identity ”label”that provides meaning. A sign can also be considered as a category that groups together ”equal”or ”similar” gestures. For example, a ”slide” sign can group together all sliding touch gestures,regardless of the number of fingers used to perform the gesture.
Classifying gestures into signs is rarely straightforward because their interpretation often relieson subjective human judgment. It also depends on the scope and the quality of the media usedto record gestures, e.g., a video recording cannot capture a finger’s force as the finger slides ona table. Data recording and interpretation issues are important for our analysis, as they largelyaffect agreement assessment. To account for data recording, we distinguish between the physicalgesture and its recorded gesture description. To account for data interpretation, we then distinguishbetween the actual gesture elicitation study and the classification process, which takes place afterthe study and is responsible for classifying gesture descriptions into signs.
2.2 Gesture Elicitation and Data CollectionFigure 1 illustrates a gesture elicitation study, where n participants (P1, P2, ..., Pn) propose (orperform) gestures form referents (R1,R2, ...,Rm ). Gestures are recorded digitally, e.g., with a videocamera and motion sensors, or manually, e.g., through questionnaires and observation notes. Theoutput of a gesture elicitation study is a dataset {дi j | i = 1..m, j = 1..n} that describes all theproposed gestures, where дi j denotes the piece of data that describes the gesture proposed byparticipant Pj for referent Ri . This dataset may combine diverse representations, such as log files,video recordings, and observation notes.
We take as an example a fictional scenario inspired by a real study [Wagner et al. 2012]. Suppose ateam of researchers seek a good gesture vocabulary for a future tablet device that senses user grasps.Their specific goal is to determine which grasp gestures naturally map to document navigationoperations such as “scroll down” or “previous page”. To this end, they recruit n = 20 participantsto whom they showm = 10 navigation operations, i.e., referents, in the form of animations onthe tablet. Each participant is asked to propose a grasp gesture for each referent. Suppose datacollection is exclusively based on video recordings that capture (i) how the participants performthe grasp gestures, and (ii) how they describe them by thinking aloud. The researchers collect a
ACM Transactions on Computer-Human Interaction, Vol. 1, No. 1, Article . Publication date: April 2018.

:4 Tsandilas T.
Referents
ParticipantsP1 PnPj
RiR1 RmR2
…
P2
…
… …
data recordingGesture Descriptions ( logs, videos, notes )
Gesture Proposals {gij} i=1...m, j=1...n
Fig. 1. Overview of a gesture elicitation study. Each participant Pj (j = 1...n) proposes a gesture for eachreferent Ri (i = 1...m). Gestures are recorded digitally, e.g., with a touch device or a video camera, or manually,e.g., by taking notes. Thus, a gesture description дi j can combine various representations: log files, videorecordings, observation notes, etc.
total of 20 × 10 = 200 grasp descriptions, where each grasp description consists of a distinct videorecording. We use variations of this scenario to explain key issues throughout the article.
2.3 Gesture Classification Process and Sign VocabulariesTo analyze the findings of a gesture elicitation study, the researchers must first interpret theirrecorded gesture descriptions by classifying them into signs. Figure 2 illustrates a typical gestureclassification process. We define this process as a function C that takes as input a set of gesturedescriptions {дi j } and produces a set of sign assignments {дi j → σk | k = 1..q_}, such that eachgesture description дi j is assigned a sign σk that belongs to a sign vocabulary of size q. In the restof the article, we make a distinction between q, which is the total number of possible signs, andq_ ≤ q, which is the number of signs produced for a specific gesture elicitation study.
Gesture classification is most often performed by humans. However, for well-defined gesturalalphabets such as EdgeWrite [Wobbrock et al. 2005], it can be automated and performed by acomputer program. As shown in Figure 2, a different classification function C ′ will generallyproduce a different set of assignments over a different sign vocabulary. Gestures are often classifiedalong multiple dimensions. For example, Weigel et al. [2014] classify on-skin gestures along twoorthogonal dimensions: their on-body location (fingers, wrist, upper arm, etc.) and their inputmodality (pinch, twist, tap, etc.). Similarly, Bailly et al. [2013] classify separately the key and thegesture applied to the key of a Métamorphe keyboard. For other studies, gestures are grouped
Classification Process( computer program or human coders )
Gesture Descriptions Sign assignments
{gij}C
C 0 {gij ! �0k | k = 1..q0}
{gij ! �k | k = 1..q }
Fig. 2. Gesture classification process. Descriptions of proposed gestures are classified either automatically bya computer program or manually by humans. The result is a set of assignments of gestures descriptions дi j tosigns σk . Here, two different classification processes (C and C ′) produce two different sign vocabularies {σk }and {σ ′k } and two different sets of assignments.
ACM Transactions on Computer-Human Interaction, Vol. 1, No. 1, Article . Publication date: April 2018.

Fallacies of Agreement: A Critical Review of Consensus Assessment Methods for GestureElicitation :5
together into larger classes [Chan et al. 2016; Piumsomboon et al. 2013; Troiano et al. 2014] byconsidering a subset of gesture parameters. In this case, different grouping strategies result indifferent sign vocabularies.
In the simplest case, a sign vocabulary is defined through a set of discrete signs, where each signmaps to a unique combination of gesture parameters. In most cases, however, sign vocabulariesare open-ended, i.e., they are not known or fixed in advance. Instead, they are defined indirectlythrough an identity or a similarity measure that determines whether any two gestures correspondto the same or two different signs. For example, Wobbrock et al. [2005; 2009] group ”identical” (or’’equal” ) gestures together, while other approaches [Chan et al. 2016; Piumsomboon et al. 2013]have used less stringent criteria of gesture similarity.As a consequence, the number of possible signs q is often unknown. Thus, it can be claimed
to be infinite (q → ∞) such that given a similarity function, one can always find a gesture that isdifferent (”unequal” or ”not similar”) than all currently observed gestures. For example, one cantrivially invent a new sign by taking the sequence of two existing signs. It could be argued that theassumption of an infinite sign vocabulary is artificial. However, it is an elegant abstraction thatenables us to assess various agreement statistics in the more general case, when sign vocabulariesare large, or at least larger than a small handful of five to ten signs.
2.4 Agreement AssessmentGiven a set of assignments of gesture descriptions to signs, one can check which signs are attributedto each referent and count their occurrences. Consider again our gesture elicitation study on graspgestures. Suppose that a human coder reviews the video descriptions produced by the study – sheinspects each video and classifies the proposed grasp gesture into a sign. Table 1 presents somefictitious results, where five unique signs (”A”, ”B”, ”C”, ”D”, and ”E”) are identified. For each referent(R1, R2 ... R10), the table shows the number of occurrences of each sign. Such tables are known ascontingency tables and can be used to summarize the results of a gesture elicitation study to assessparticipants’ agreement. If a sign occurs more than once for a referent, we infer that at least twoparticipants agree on this sign. Researchers usually seek signs that enjoy wide agreement amongusers. The larger the number of occurrences of a sign for a given referent, the greater is consideredto be the evidence that the gesture is intuitive or a good match for that referent. Thus, agreementassessment has taken a key role in the analysis of gesture-elicitation results [Vatavu and Wobbrock2015, 2016; Wobbrock et al. 2005, 2009].
Table 1. Data from our fictitious gesture elicitation study
R1 R2 R3 R4 R5 R6 R7 R8 R9 R10 Total
A 0 1 0 1 1 1 0 0 0 1 5B 7 2 6 4 10 3 10 3 10 5 60C 6 5 9 4 5 10 3 10 3 5 60D 4 6 2 4 4 4 3 4 4 5 40E 3 6 3 7 0 2 4 3 3 4 35
Note: 20 participants each propose a grasp gesture for 10 different referents (R1 – R10). Each grasp gesture is classifiedinto a sign: ”A”, ”B”, ”C”, ”D”, or ”E”. Each cell shows the number of sign occurrences for a given referent.
ACM Transactions on Computer-Human Interaction, Vol. 1, No. 1, Article . Publication date: April 2018.

:6 Tsandilas T.
2.5 The Notion of BiasImagine that the five signs (q_ = 5) that emerged from our fictitious study is only a subset of amuch larger sign vocabulary. In this case, how would one explain that fact that only these five signsappeared? Moreover, why are ”B” and ”C” so frequent (see Total in Table 1) while ”A” is rare? Werefer to this overall tendency of some signs to appear more frequently than others, independentlyof the actual referents, as bias.Research in Linguistics and Cognitive Psychology has extensively studied the role of bias in
the evolution and learning of both human and artificial languages. For example, Markman [1991]argues that young children acquire biases that help them rule out alternative hypotheses for themeaning of words and progressively induce the correct mappings between words and referents,such as objects and actions. Culbertson et al. [2012] characterize as bias universal constraints inlanguage learning that shape the space of human grammars. Through experiments with artificiallanguages, they show that such biases are not simply due to external factors, such as historical orgeographic influences, but instead, they are part of the learners’ cognitive system. In particular, theyshow that learners favor grammars with less variation (regularization bias) and prefer harmonicordering patterns (harmonic bias) [Culbertson et al. 2012]. Garrett and Johnson [2012] study thephonetic evolution of languages and identify a range of bias factors that cause certain phoneticpatterns to appear more frequently than others: motor-planning processes, speech aerodynamicconstraints, gestural mechanics, and speech perceptual constraints.
The role of such biases has not been fully understood in the context of gesture elicitation, but wecan name several factors that may lead participants to focus on certain gestures or their propertiesand disregard others. Those include usability issues such as the conceptual, cognitive, and physicalcomplexity of gestures, their discoverability, memorability, etc. Considerations about the socialacceptability of available gestures [Rico and Brewster 2010] can also shape participants’ choices.The effect of such biases is usually of great interest for a gesture elicitation study, as it can helpresearchers understand if certain gestures are more appropriate, e.g., easier to conceive, execute orsocially accept, than others.
Other bias factors, however, can hamper the generalizability or the usefulness of gesture elicitationresults. Morris et al. [2014] argue that ”users’ gesture proposals are often biased by their experiencewith prior interfaces and technologies” and refer to this type of bias as legacy bias. According to theauthors, legacy bias has some benefits (e.g., participants ”draw upon culturally-shared metaphors” )and increases agreement scores but ”limits the potential of user elicitation methodologies.” It is thusoften considered that it hinders the novelty of the gestures produced by a gesture elicitation study.The elicitation study procedure can also introduce bias. According to Ruiz and Vogel [2015],
time-limited studies bias participants against considering long-term performance and fatigue. Othersources of procedural bias include the low fidelity of device prototypes presented to participants,which may prevent or reinforce the execution or detection of certain gestures, or the lack of clarityin investigators’ instructions. Finally, the classification of gesture proposals into signs can introduceadditional bias. Gesture classification is often performed by the investigators, who also need todecide on how to differentiate among signs. This process usually relies on a mix of objective andsubjective criteria, and thus, investigators risk adding their own biases.
Usability, social, legacy, procedural, and classification biases are additive, so overall bias will beobserved as an imbalance in the distribution of signs across all referents. The notion of bias has acentral role in our analysis of agreement.
ACM Transactions on Computer-Human Interaction, Vol. 1, No. 1, Article . Publication date: April 2018.

Fallacies of Agreement: A Critical Review of Consensus Assessment Methods for GestureElicitation :7
2.6 Questions and Structure of the ArticleA gesture elicitation study can serve a range of design and research goals. The focus of this articleis on questions that concern participants’ consensus on the choice of signs, where these questionsmostly derive from earlier work by Wobbrock et al. [2005; 2009] and more recent work by Vatavuand Wobbrock [2015; 2016]:• Do participants agree on their gestures? Is their level of consensus high, either for individualreferents or overall, for the full set of referents?• How does agreement compare across different referents? Do some referents or groups ofreferents lead to lower or higher agreement?• Do different groups of participants (e.g., novices vs. experts) demonstrate the same level ofagreement? Does agreement vary across different user groups?
A visual inspection of the data in Table 1 reveals a mix of agreement and disagreement. Sincesome signs appear multiple times for many referents, one may argue that such patterns demonstrateagreement. However, given the uncertainty in the sample, is this agreement substantial or highenough to justify a user-defined vocabulary of gestures? Is it intrinsic or should it rather be attributedto chance? Furthermore, do all agreements have the same importance? For example, isn’t it easierto agree when the number of possible or obvious options is small? One may also try to compareagreement among different referents and conclude that agreement is higher for referents for whichproposals are spread less uniformly (e.g., for R5), revealing one or a few ”winning” signs. To whatextent does statistical evidence support this conclusion? Do such patterns reveal real differences orare they random differences that naturally emerge by chance?
The above are all questions that we try to answer in this article. Specifically, we investigate thefollowing three problems: (i) how to measure agreement (Sections 3 and 4), (ii) how to assess themagnitude of agreement (Section 5), and (iii) how to support statistical inference over agreementmeasures (Section 6). For each of these three problems, we review existing solutions, focusing onrecent statistical methods introduced by Vatavu and Wobbrock [2015; 2016]. We identify a series ofproblems in these methods. Inspired by related work in the context of inter-rater reliability studies(see Gwet’s [2014] handbook for an overview of this work), we introduce alternative statisticalmethods, which we then use to re-analyze the results of four gesture elicitation studies (Section 7). Akey argument of our analysis is that any kind of bias can deceive researchers about how participantsagree on signs. The agreement measures that we recommend remove the effect of bias. We showhow researchers can investigate bias separately with more appropriate statistical tools.We explained that participants do not directly propose signs. However, in certain sections
(Sections 5 and 6), we will write that participants ”propose” and ”agree on their signs” or refer to”participants’ sign proposals.” Although these expressions do not accurately describe howparticipants’proposals are assigned to signs, they simplify our presentation without impairing the validity ofour analysis.
3 MEASURING AGREEMENTTo quantify agreement over a referent Ri , a great number of elicitation studies have used theformula of Wobbrock et al. [2005]:
Ai =
q_∑k=1
(nikni
)2(1)
where q_ is the total number of signs produced by the gesture classification process, nik is thenumber of occurrences of sign σk for referent Ri , and ni is the total number of gesture proposals forreferent Ri . Table 2 further explains this notation. In the common situation where all participants are
ACM Transactions on Computer-Human Interaction, Vol. 1, No. 1, Article . Publication date: April 2018.

:8 Tsandilas T.
Table 2. Contingency table summarizing the results of a gesture elicitation study, where nik is the number ofoccurrences of sign σk for referent Ri , and ni is the total number of proposals for this referent.
Referents
R1 . . . Ri . . . Rm
Sign
s
σ1 n11 ni1 nm1...
.... . .
.... . .
...
σk n1k nik nmk...
.... . .
.... . .
...
σq_ n1q_ niq_ nmq_
Total: n1 . . . ni . . . nm
presentedwith all the referents,ni is the number of participants in the study. For example, for the firstreferent in Table 1, we calculate agreement as follows:A1 = ( 0
20 )2+( 7
20 )2+( 6
20 )2+( 4
20 )2+( 3
20 )2 = .275.
To obtain the overall agreement A, Wobbrock et al. [2005] average Ai across all referents. For ourexample, the overall agreement is A = .302.
Later on, Findlater et al. [2012] refine Ai with a slightly different index, which can be written asfollows:
ARi =
q_∑k=1
nik (nik − 1)ni (ni − 1)
(2)
Vatavu and Wobbrock [2015] further advocate the use of this index and call it the agreement rate.They point out that in contrast to Ai , the ARi index takes values in the entire interval [0..1] andhas a clear interpretation: ARi is the proportion of participant pairs who are in agreement. ARiis lower than Ai but for large samples, it reduces to Ai . As before, Vatavu and Wobbrock [2015]average ARi across all referents to obtain an overall agreement rate AR. For our example in Table 1,the overall agreement rate is AR = .265.
It is worth noting that neither ARi nor its approximation Ai are new. They have been used in arange of disciplines as measures of homogeneity for nominal data. They have been independentlyreinvented several times in the history of science [Ellerman 2010] and are most commonly referredto as the Simpson’s [1949] index. The AR index is also well known and is commonly referred to asthe percent agreement [Gwet 2014]. However, it is also widely known to be problematic, as we willnow explain.
3.1 The Problem of Chance AgreementConsider again our fictitious study of grasp gestures. The overall agreement rate AR = .265 canbe valued as respectable, as it is slightly higher than the average AR reported by Vatavu andWobbrock [2015] from 18 gesture elicitation studies. According to their recommendations, it can beinterpreted as a medium level of agreement.However, the researchers have reasons to be worried. Suppose the study is replicated, but
participants are now blindfolded and cannot see any of the referents presented to them — they aresimply asked to guess. Their grasp proposals will thus be random. Suppose the researchers followthe same gesture classification process, classifying gestures into five signs (q = 5). If all five signsare equally likely, they will all appear with a probability of 1/5 = 0.2. Thus, the probability thatany pair of participants ”agree” on the same sign is 0.2 × 0.2. Since two participants can agree on
ACM Transactions on Computer-Human Interaction, Vol. 1, No. 1, Article . Publication date: April 2018.

Fallacies of Agreement: A Critical Review of Consensus Assessment Methods for GestureElicitation :9
any of the five signs, the probability of agreement for a pair of participants on any given referent is5 × 0.2 × 0.2 = 0.2. Therefore, the expected proportion of participant pairs who are in agreement —that is, the expected overall agreement rate AR — is 0.2.Surprisingly, this value is not far from the previously observed value (AR = .265) and can be
interpreted again as medium agreement [Vatavu and Wobbrock 2015]. However, given that thereis no intrinsic agreement between participants, one would rather expect an agreement index togive a result close to zero. Furthermore, one would certainly not label such a result as a “medium”agreement. We should note that the exact same result would emerge if participants were notblindfolded but, instead, the gesture classification process was fully random.Arguably, the blindfolded study is purely fictional, and no gesture elicitation study involves
participants who make completely random decisions. Nevertheless, gesture elicitation involvessubjective judgments, where randomness can play a role. A participant may be uncertain aboutwhich gesture is the best, and in some situations, the participant may even respond randomly. Suchsituations may arise as a result of highly abstract referents for which there is no intuitive gesture,poor experimental instructions, gesture options that are too similar, or a lack of user familiaritywith the specific domain or context of use. Due to sources of randomness in participants’ choice ofgestures, any value of AR reflects both intrinsic and spurious agreement. The amount of spuriousagreement depends on the likelihood of chance agreement, which in turn depends on the numberof signs.The vocabulary of five signs used in our example is rather small. One could argue that if
participants chose from a large space of possible signs, then chance agreement would be practicallyzero. However, a large space of possible signs does not eliminate the problem of chance agreement.We will next show that bias can greatly increase the likelihood of chance agreement and inflateagreement rates even if the size of a sign vocabulary is large or infinite (q → ∞).
3.2 Modeling Bias and Showing its Effect on Chance AgreementWe first illustrate the problem of bias with a scenario from a different domain. Suppose two medicaldoctors independently evaluate the incidents of death of hospitalized patients. For each case, theyassess the cause of each patient’s death by using the classification scheme of the World HealthOrganization1, which includes 132 death cause categories. Suppose information about some patientsis incomplete or missing. For these cases, the two doctors make uncertain assessments or simplytry to guess. How probable is it that their assessments agree by chance?
If one assumes that the doctors equally choose among all 132 categories, the probability of agree-ment by chance is negligible, as low as 1/132 = 0.76%. However, the assumption of equiprobablecategories is not realistic in this case. Most death causes are extremely rare, while the two mostcommon causes, the ischaemic heart disease and the stroke, are alone responsible for more of 25%of all deaths. The ten most frequent ones are responsible for more than 54% of all deaths2. It is notunreasonable to assume that uncertain assessments of the two doctors will be biased towards themost frequent diseases. In this case, the problem of chance agreement can be serious, as resultsthat appear as agreement on frequent categories may hide uncertain or even random assessments.In the above example, the source of bias is prior knowledge about the frequency of diseases,
where in the absence of enough information, doctors tend to minimize the risk of a false diagnosis byfavoring frequent over rare diseases. In gesture elicitation, bias has other sources – we have alreadydiscussed them in Section 2. To understand how bias affects chance agreement, we mathematically
1World Health Organization: Cause-Specific Mortality. Estimates for 2000-2012 (global summary estimates): http://www.who.int/healthinfo/global_burden_disease/estimates/en/index1.html2World Health Organization: The top 10 causes of death. http://www.who.int/mediacentre/factsheets/fs310/en
ACM Transactions on Computer-Human Interaction, Vol. 1, No. 1, Article . Publication date: April 2018.

:10 Tsandilas T.
0
10
20
30
40
0
10
20
30
40
...
...
...
...
...
...
prob
abili
ty (%
)pr
obab
ility
(%)
B = .646 B = .306 B = .151
(a) Zipf-Mandelbrot Probability Distribution (s=2)
sd = 2.58 sd = 5.42 sd = 11.02
(b) Discrete Half-Normal Probability Distribution (mean = 1)Increasing bias
20% 10% 5%chance agreement:
z1 z2 z3
n1 n2 n3
Fig. 3. Dots represent signs (k = 1..∞) ranked by their bias probabilities. We model bias with two probabilitydistributions: (a) the Zipf-Mandelbrot and (b) the discrete half-normal distribution. Here, eachmodel requires asingle parameter to determine the bias level: B for the Zipf-Mandelbrot and sd for the half-normal distribution.As bias increases (from right to left), the probability of chance agreement also increases. Chance agreementvalues presented at the bottom of the graphs are estimations from Monte Carlo experiments.
describe it as a monotonically-decreasing probability-distribution functionb (k ), k = 1, 2, ..∞, wherethe bias function gives the probability of selecting the kth most probable sign when ignoring orhaving no information about the referent. The function is assumed to be asymptotically decreasingsuch that b (k ) → 0 when k → ∞.We focus on two well-known probability distributions that have the above properties: (i) the
discrete half-normal distribution, and (ii) the Zipf-Mandelbrot distribution [Mandelbrot 1967]. Thefirst is the discrete version of the well-known normal (Gaussian) distribution when we only considerits right half. We set its mean to k = 1 and control the bias level by varying the standard deviationsd (see Figure 3b). The distribution converges to uniform (bias disappears) as sd → ∞.
The second is a generalization of Zipf’s [1949] law and is widely used in Computational Linguisticsto model word frequencies in text corpora. Zipfian distributions occur for a diverge range ofphenomena [Newman 2005]. They have also applications in HCI, as several studies have shownthat they are good models for predicting the frequency of command use [Cockburn et al. 2007].The original explanation given by Zipf [1949] for his law was based on the principle of least effort,according to which the distribution of word use is due to a tendency to communicate efficiently withleast effort. Mandelbrot [1967], in turn, argued that such distributions may arise from minimizinginformation-theoretic notions of cost. Although several other generative mechanisms have beenproposed, the theoretical explanation of Zipf’s law is still an open research problem [Newman2005]. Interestingly, an early experiment by Piantadosi [2014] shows that Zipfian distributions caneven occur for completely novel words, whose frequency of use could not be explained by anyoptimization mechanism of language change. According to the author, a possible explanation ofthe law is its link with power-law phenomena in human cognition and memory [Piantadosi 2014].
While the Zipf law has a single parameter s , the Zipf-Mandelbrot distribution has two parameterss and B, where the latter allows us to control for bias:
b (k ) =constant
(1 + Bk )s (3)
ACM Transactions on Computer-Human Interaction, Vol. 1, No. 1, Article . Publication date: April 2018.

Fallacies of Agreement: A Critical Review of Consensus Assessment Methods for GestureElicitation :11
The constant is directly calculated through normalization and can be ignored. A typical range ofvalues for the exponent s in real-world data is between s = 1.5 and s = 3 [Newman 2005]. Tosimplify our analysis, we set this parameter to s = 2. This choice may seem arbitrary, but the scopeof our analysis does not require a higher-precision model. We later show (see Section 7) that thisvalue provides a reasonable approximation for modeling sign frequencies of several past gestureelicitation studies. Finally, we vary the parameter B to account for the bias level (see Figure 3a).As B approaches zero (B → 0), the contribution of the power-law component diminishes, thedistribution converges to uniform, and bias disappears.
The two distribution functions are not the only possible alternatives. Nevertheless, they have verydistinct shapes and allow us to experimentally demonstrate the effect of bias on agreement undertwo different model assumptions. Notice that we can generate an infinite range of intermediateprobability functions by taking a linear combination of the two base functions: b (k ) = αbzipf (k ) +(1 − α )bnormal (k ), where α ∈ [0..1]. Finally, we can trivially use the same distributions to describenon-infinite sign vocabularies by constraining their tails, i.e., by setting b (k ) = 0 for k > q.Experiment 3.1. We demonstrate how bias increases chance agreement with a Monte Carloexperiment implemented in R. The experiment simulates the situation where participants makefully random proposals under bias. More specifically, we consider that 20 blindfolded participantsare presented 40 different referents, and for each referent, they are asked to propose a gesture.Participants’ gestures are then classified into signs, where the number of possible signs is infinite.We test all the six bias distributions presented in Figure 3. For each, we take 5000 random samples,and each time we calculate AR. The mean value of AR can be considered as an estimate of chanceagreement, since any agreements occur by chance – participants cannot see any referents presentedto them.The experiment results in chance agreement scores that are very close to the ones presented
in Figure 3: (i) 20% for the bias distributions z1 and n1, (ii) 10% for the bias distributions z2 and n2,and (iii) 5% for the bias distributions z3 and n3. Such levels of chance agreement are not negligible.They are also realistic, as we later demonstrate in Section 7. The mean number of unique signs q_that we observed in our experiment is as follows:
Distribution: z1 n1 z2 n2 z3 n3
mean(q_) : 60.9 9.4 87.4 17.9 122.3 33.6
Not surprisingly, higher bias leads to smaller sign vocabularies. Notice that the Zipf-Mandelbrotdistribution clearly leads to a larger number of signs. This is an expected result because Zipfiandistributions are well known to have long tails, i.e., a large portion of occurrences far from thedistribution’s head.
3.3 Chance-Corrected AgreementA large volume of research has examined the issue of chance agreement in the context of inter-rater reliability studies, i.e., studies that involve subjective human assessments [Gwet 2014]. Suchassessments are made in studies that involve qualitative human judgments, such as classifyingpatients into disease categories, interpreting medical images, annotating speech, or coding opensurvey responses. If reliability is of concern, typically two or more people (raters) are asked toperform the same judgments, and their agreement is used as a proxy for reliability.Inter-rater reliability studies employ a different terminology from gesture elicitation studies,
but the mapping between the two is straightforward. Study participants become raters (also calledjudges or coders), referents become items (also called subjects), and signs become categories [Gwet2014].
ACM Transactions on Computer-Human Interaction, Vol. 1, No. 1, Article . Publication date: April 2018.

:12 Tsandilas T.
Work on chance-corrected agreement dates back to the 50 – 60’s. Early on, Jacob Cohen [1960]proposed the κ (Kappa) coefficient to measure the agreement between two raters:
κ =pa − pe1 − pe
(4)
where pa is the proportion of items on which both raters agree, and pe is the chance agreement,i.e., the agreement that would have occurred by chance. According to Cohen [1960], the nominatorcaptures the observed beyond-chance agreement, while the denominator is a normalizing termthat captures maximum beyond-chance agreement. The quotient κ measures “the proportion ofagreement after chance agreement is removed from consideration” [Cohen 1960].
Note that κ can take negative values: while a positive value means agreement beyond chance, anegative value means disagreement beyond chance — although this rarely happens in practice. Alsonote that if pa = 1, then κ = 1 (provided that pe , 1). Thus, chance correction does not penalizeperfect agreement.Most chance-corrected agreement indices known today are based on Equation 4. Each index
makes different assumptions and has different limitations [Gwet 2014]. Early indices such asCohen’s [1960] κ and Scott’s [1955] π assume two raters. As gesture elicitation involves moreparticipants, we will not discuss them further. A widely used index that extends Scott’s π to multipleraters is Fleiss’ [1971] κF coefficient. For the term pa in Equation 4, Fleiss uses the “proportion ofagreeing pairs out of all the possible pairs of assignments” [Fleiss 1971], also called percent agreement.This formulation for pa has been used in many other indices and is identical to the AR index ofVatavu and Wobbrock [2015].
For the chance agreement term pe , Fleiss uses:
pe =
q_∑k=1
π 2k , πk =
1m
m∑i=1
nikni
(5)
wherem is the total number of items, nik is the number of ratings for item i having category k ,and ni is the total number of ratings for item i . The term πk estimates the probability that a raterclassifies an item into category k , based on how many times this category has been used across theentire study. Thus, it does not assume equiprobable selection of categories, so it takes bias intoaccount. However, it assumes that all raters share the same preferences for categories. For the datain Table 1, Fleiss’ chance agreement is pe = .251, and therefore, κF = .265−.251
1−.251 = .018, reflecting aclose-to-chance overall agreement.In gesture elicitation, raters’ (i.e., participants’) proposals are classified into categories (i.e.,
signs) after the end of the study by a separate gesture-classification process. The interpretationof chance agreement now changes because chance agreement also captures the additional biasof this higher-level classification process (see Section 2.5). Notice that sign vocabularies can beopen-ended. However, this open-endedness does not affect how Fleiss’ κF coefficient is computed,because the coefficient requires no prior knowledge or assumption about the number of possiblesigns q. Equations 2 and 5 only depend on the number of observed signs q_ and their frequencies.An alternative index is the κq coefficient of Brennan and Prediger [1981], which uses the same
pa but a simpler estimate of chance agreement: pe = 1/q, where q is the total number of cate-gories. The index assumes equiprobable selection of categories. Under this assumption, the chanceagreement for Table 1 is pe = .200, and thus, κq = .081. However, as we explained earlier, thisassumption is generally not realistic, as it does not account for bias. The index has been furthercriticized for giving researchers the incentive to add spurious categories in order to artificiallyinflate agreement [Artstein and Poesio 2008]. If one assumes an infinite number of categories, thenpe = 0. For all these reasons, the index is rarely used in practice.
ACM Transactions on Computer-Human Interaction, Vol. 1, No. 1, Article . Publication date: April 2018.

Fallacies of Agreement: A Critical Review of Consensus Assessment Methods for GestureElicitation :13
Another measure of agreement, widely used in content analysis, is Krippendorff’s α [Krippendorff2013]. Krippendorff’s α uses a different formulation for both pa and pe and can be used for studieswith any number of raters, incomplete data (i.e., not all raters rate all items), and different scalesincluding nominal, ordinal and ratio. For simple designs, its results are generally very close to Fleiss’κF , especially when there are no missing data and the number of raters is greater than five [Gwet2014]. We use both indices in our analyses with a preference for Fleiss’ κF , as it is simpler andeasier to contrast to the AR index.Experiment 3.2.We repeat the Monte Carlo experiment presented in Section 3.2, but this time,we also calculate Fleiss’ chance agreement pe , Fleiss’ κF , and Krippendorff’s α . Mean estimates foreach bias distribution (see Figure 3) are presented below:
Distribution: z1 n1 z2 n2 z3 n3AR (mean): .201 .200 .100 .100 .050 .050
Fleiss’ pe (mean): .202 .201 .101 .101 .051 .051Fleiss’ κF (mean): −.001 −.001 −.001 −.001 −.001 −.001
Krippendorff’s α (mean): .000 .000 .000 −.000 .000 .000
We see that Fleiss’ pe provides a very good estimate of chance agreement for all six distributions.Thus, it can be considered as a good measure for assessing the effect of bias on agreement, even ifone assumes an infinite number of signs. Both Fleiss’ κF and Krippendorff’s α completely removethe effect of bias, returning consistent agreement scores that are very close to zero. We haverepeated the experiment with other bias distributions, e.g., by taking the linear combination of theabove distributions with variable weights. Again, results were the same.The above chance-corrected coefficients do not only work on average. For the 30000 iterations
(6 distributions ×5000 iterations) of our experiment, Fleiss’ κF ranged from κF ,min = −.018 toκF ,max = .019, while Krippendorff’s α ranged from αmin = −.017 to αmax = .020, which meansthat the full range of chance-corrected scores was very close to zero. We expect the spread of valuesto increase for experiments with a smaller number of participants (n < 20) or a smaller number ofreferents (m < 40).
3.4 Agreement over Individual or Groups of ReferentsSo far, we have discussed how to correct overall agreement scores. In gesture elicitation studiesthough, researchers are often interested in finer details concerning agreement, i.e., situations inwhich agreement is high and situations that exhibit little consensus. To this end, the analysis ofagreement scores for individual items (i.e., referents) is a useful and commonly employed method.The state-of-the art approach in HCI is to use Equation 2, but unfortunately, this method does notaccount for chance agreement.Research on inter-rater agreement has mostly focused on the use of overall agreement scores,
but agreement indices for individual items also exist. For example, O’Connell and Dobson [1984]introduced an agreement index that can be computed on an item-per-item basis, and Posner etal. [1990] further explained its calculation. For the most practical cases the we study here, the indexis identical to Fleiss’ κF calculated for individual items, using a pooled pe . Specifically, one cancompute pa for each referent of interest and then use Equation 5 to estimate a common pe across allreferents. The rationale is that, by definition, chance agreement does not depend on any particularreferent. The same method can be employed for assessing agreement over groups of referents.
We apply the approach to the data in Table 1. The observed percent agreement for R5 is pa = .321,and the overall chance agreement is pe = .251, computed over all referents of the study (see
ACM Transactions on Computer-Human Interaction, Vol. 1, No. 1, Article . Publication date: April 2018.

:14 Tsandilas T.
Equation 5). Thus, Fleiss’ chance-corrected agreement for this referent is κF ,5 = .321−.2511−.251 = .094.
For R10, the agreement is κF ,10 = .190−.2511−.251 = −.082. This negative value may suggest disagreement.
3.5 Is Correction for Chance Agreement always Necessary?Chance correction is a monotonically decreasing function that scales and offsets all per-referentpa scores but preserves their order. Thus, if only ordinal information is of interest (e.g., which arethe most and the least consensual referents within a single study?), the use of standard agreementrates (ARi ) as in Equation 2 is acceptable. Similarly, if two different groups share the same chanceagreement pe , using AR to compare their difference in agreement is a valid approach. The reasonis that ∆pa = pa,1 − pa,2 scales ∆κ = κ1 − κ2 by a fixed amount (1 − pe ) without distorting theunderlying distribution (see Equation 4). So the results of such comparisons should also generalizeto κ. Section 6 further discusses this point.
There is a last question to answer. Bias is not necessarily harmful. In particular, it may be largelydue to considerations about the effectiveness or cognitive complexity of different signs, irrespectiveof the referent to which these signs apply. Thus, bias may reflect participants’ overall agreementabout which signs are appropriate candidates for a future gesture vocabulary. Since understandingsuch bias may be crucial, one could argue that chance-corrected coefficients like Fleiss’ κF orKrippendorff’s α are not appropriate in this case.We agree that the analysis of bias is important. However, we argue that bias should be studied
separately. We present three main reasons:• Researchers need to know how participants distinguish among referents and whether naturalmappings between signs and referents emerge. In the presence of any source of bias, the ARindex provides misleading information about how participants agree or disagree on theirsign assignments.• The bias distribution can be easily derived from the overall distribution of sign frequencies.This distribution is enough to fully describe bias and reveals which signs are frequent andwhich signs are absent or rare. Therefore, the reasoning behind translating a bias distributioninto an agreement score is unclear. However, if investigators still want to quantify bias asagreement, a possible measure for this purpose is Fleiss’ chance agreement pe , which can bereported in addition to κ.• Distinguishing between different bias factors may not be feasible so the interpretation ofan AR score can be extremely problematic. Participants’ proposals are often dominated byobvious or ”default” signs, e.g., the ”top” sign in the study by Bailly et al. [2013], or signs thatrepresent common gestures in widespread interfaces, e.g., multitouch gestures in the studyby Weigel et al. [2014]. Bias does not only concern participants’ original proposals. As wediscussed, their classification is also subject to bias, and AR gives investigators the incentiveto invent frequent signs to artificially inflate agreement scores.
For all these reasons, correcting for chance agreement is important. However, given that chance-corrected coefficients have received multiple criticisms (see next section) and the HCI communityhas not yet arrived to a consensus, we advice authors to report both chance-corrected and uncor-rected agreement values. Reporting both values increases transparency and can help researchersto better interpret their results. A separate investigation of the observed bias distribution is alsorecommended for every gesture elicitation study.
4 CRITICISMS OF CHANCE-CORRECTED AGREEMENT INDICESChance-corrected agreement coefficients are the norm in inter-rater reliability studies but have alsoreceived criticism. We address two types of criticism: (i) questioning the appropriateness of chance
ACM Transactions on Computer-Human Interaction, Vol. 1, No. 1, Article . Publication date: April 2018.

Fallacies of Agreement: A Critical Review of Consensus Assessment Methods for GestureElicitation :15
correction for gesture elicitation, and (ii) arguing that chance correction can lead to ”paradoxically”low and unstable values for κ. After responding to these criticisms, we discuss some complimentaryagreement measures.
4.1 Criticism 1: Chance Correction Is Not Appropriate for Gesture ElicitationIn a previous report, we recommended the use of chance-corrected agreement indices in addition toor as a replacement of the AR index [Tsandilas and Dragicevic 2016]. Vatavu and Wobbrock [2016]included a short discussion about this issue, where they argued that chance-corrected agreementindices are not appropriate for gesture elicitation studies:
”Unfortunately, the above statistics are not appropriate to evaluate agreement for elici-tation studies, during which participants suggest proposals for referents without beingoffered any set of predefined categories. The particularity of an elicitation study is thatthe researcher wants to understand participants’ unconstrained preferences over sometask, which ultimately leads to revealing participants’ conceptual models for that task.Consequently, the range of proposals is potentially infinite, only limited by participants’power of imagination and creativity.” [pp. 3391 - 3392]
Gesture elicitation studies have certainly unique features. We agree that most gestures elicitationstudies do not enforce a fixed set of sign categories. However, as we already discussed, the problemof chance agreement is still present. The argumentation of Vatavu and Wobbrock [2016] overlookssome key points:
Kappa coefficients do not require choosing from a predefined set of categories. The a-posteriori classification of items to categories is not unique to gesture elicitation. For example,medical doctors do not use predefined classification schemes for diagnosis. They usuallywrite open-ended reports or notes. Later, medical coders translate these reports into medicalcodes [O’Malley et al. 2005]. Assessing agreement between diagnosis methods often requiresmedical experts with diverse roles to make assessments at multiple steps. For example, psy-chiatric clinicians prepare a brief psychiatric narrative of each case, and those narrativesare reviewed by independent psychiatrists, who then classify the cases into diagnosis cate-gories [Deep-Soboslay et al. 2005]. As with gesture elicitation, the classification of cases intodiagnosis categories only happens at the very end of the process and is not performed bythe actual clinicians who evaluate the patients. A κ coefficient is again computed over thosetop-level categories [Deep-Soboslay et al. 2005].
Sign vocabularies can be limited. In practice, agreement is not assessed over an infinite setof gesture possibilities. Participants’ gesture proposals are first classified into signs (seeSection 2), and agreement is assessed over the sign vocabulary defined by that specificclassification process. We show in Section 7 that a sign vocabulary can be limited becauseinvestigators may use a particularly small number of signs to classify proposals.
Proposals are often biased towards a small number of signs. Even if one assumes an in-finite number of signs, chance agreement is still a problem due to various sources of biasthat result in uneven distributions of sign frequencies. A major strength of Fleiss’ κF (andKrippendorff’s α ) is the fact that it corrects for bias by estimating chance agreement based onthe distribution of observed signs. By taking into account this distribution, chance-correctedindices reward variability in participants’ proposals and highlights methodological problems.
Chance-corrected indices are the norm in content analysis where data are often open-ended andcoders choose from codebooks that contain a large number of codes. According to MacQueen etal. [1998], ”coders can reasonably handle 30 - 40 codes at one time,” while coding with codebooks of
ACM Transactions on Computer-Human Interaction, Vol. 1, No. 1, Article . Publication date: April 2018.

:16 Tsandilas T.
”more than 40 codes” is common, but the coding process needs to be done in stages. In ComputationalLinguistics, vocabularies can be even larger. In their coder’s manual, Jurafsky et al. [1997] reporton language modeling projects involving as many as 220 unique coding tags, where these tags arelater clustered under 42 larger classes. Despite the use of such large vocabularies in these domains,chance agreement is always taken seriously, because codes typically do not occur with the samefrequency, and coders are often biased towards a small subset of the coding vocabulary.Arguably, chance agreement does not equally concern all gesture elicitation studies. The issue
can be minor or nonexistent if three conditions are met: (i) participants choose from a large spaceof gestures, (ii) their proposals discriminate between many of these gestures with low bias, and (iii)the gesture classification process differentiates between subtle gesture variations. Nevertheless, thedecision of whether chance correction is needed is best not to be left to the subjective discretionof each researcher — it is safer to always report chance-corrected agreement indices in additionto raw agreement rates (percent agreement). As their use is a well-established practice in manydisciplines, there is no reason why gesture elicitation studies cannot benefit from them.
4.2 Criticism 2: Chance Correction Can Lead to ParadoxesChance-corrected coefficients such as Cohen’s and Fleiss’ κ penalize imbalanced distributions,where some categories are frequent while others are rare. Feinstein and Cicchetti [1990] argue thatthis can lead to ”paradoxes”, where (i) κ can be particularly low despite the fact that the observedpercent agreement pa is high, and (ii) κ can be very sensitive to small changes in the distribution ofmarginal totals.
We demonstrate their argument with two fictional datasets (see Table 3), where three participantspropose signs for 10 referents. Participants are almost in full agreement for Dataset 1, and percentagreement is pa = .93. However, Fleiss applies a high chance correction pe = .76, which results inκF = .72. Dataset 2 is almost identical to Dataset 1, where the only difference is P3’s proposal forR7. Percent agreement has only slightly dropped (pa = .87), but Fleiss’ κF has dropped radically(κF = .28). Why is κF so low even if data suggest high consensus among participants? Furthermore,why does a small change cause κF to drop so radically?
Feinstein and Cicchetti [1990] explain that the source of such paradoxes is the assumption ofκ coefficients that raters are biased, i.e., they have a ”relatively fixed prior probability” of makingresponses. Referring to their experience in clinical research, the authors argue that there is noreason to assume that such prior (bias) probabilities are established in advance. They complain thatpenalizing observed imbalances as evidence of prior bias and thus chance agreement may not befair. The way κ coefficients estimate chance agreement has been criticized by other authors [Gwet2014; Uebersax 2015] for very similar reasons.
Kraemer et al. [2002] reject the argument that these situations indicate a flaw of κ or a paradox.In response to the above criticism, they argue that ”it is difficult to make clear distinctions” betweencases when ”those distinctions are very rare or fine. In such populations, noise quickly overwhelms thesignals.” Krippendorff [2011] further discusses the above issues. He explains that in such scenarios,percent agreement is high but ”uninformative” due to the ”lack of variability.”Consider a different scenario where two medical tests are evaluated for the diagnosis of HIV.
Suppose the two tests highly agree (> 98%) on negative results (i.e., HIV is not present) butdemonstrate zero agreement on positive results (i.e., HIV is present). Given the rareness of positiveresults (e.g., 1% of all cases), percent agreement will be extremely high. However, a high agreementscore is misleading, since the two tests completely fail to agree on the presence of HIV. In contrast,Fleiss’ (or Cohen’s) κ would be low in this case, since chance agreement is high. In most cases,this is a desirable behavior rather than a drawback of κ coefficients. Whether the two tests makea deliberate choice when assessing negative cases or whether they make a random choice, the
ACM Transactions on Computer-Human Interaction, Vol. 1, No. 1, Article . Publication date: April 2018.

Fallacies of Agreement: A Critical Review of Consensus Assessment Methods for GestureElicitation :17
Table 3. Two similar datasets used to demonstrate the ”paradoxes” of chance-corrected agreement indices.Three participants (P1, P2, P3) propose signs for 10 different referents (R1 to R10). The only difference betweenthe two datasets is P3’s proposal for R7.
R1 R2 R3 R4 R5 R6 R7 R8 R9 R10
Dataset 1P1 A A A A A A B A A AP2 A A A A A A B A A AP3 A A A A A A B C A A
Dataset 2P1 A A A A A A B A A AP2 A A A A A A B A A AP3 A A A A A A A C A A
high chance correction applied by κ is justified by the fact that such results are practically notmeaningful and cannot be trusted. As Kraemer et al. [2002] explain, a ”κ = 0 indicates either thatthe heterogeneity of the patients in the population is not well detected by the raters or ratings, or thatthe patients in the population are homogeneous.”In our example in Table 3, participants have used only three signs, and the ”A” sign has highly
dominated their preferences. The fact that they agree on ”A” is not informative, as there is verylittle evidence about consensus on other signs. The higher Fleiss’ κF that we found for Dataset 1can be explained by a perfect consensus on ”B”, in addition to a high consensus on ”A.” In Dataset2, consensus on ”B” decreases while signs other than ”A” become extremely rare, causing Fleiss’ κFto radically drop.Krippendorff [2011] discusses that chance-corrected agreement indices are more sensitive to
rare than to frequent cases. However, the high sensitivity that we observe in our example is due tothe low number of samples. Using three or two raters is common in inter-rater reliability studiesbut very unlikely in the context of gesture elicitation studies, where the number of participantsis typically greater than ten. Furthermore, we argue later that agreement values should not bereported alone. Interval estimates can capture and communicate the uncertainty or sensitivity ofestimated chance-corrected agreement values.
To increase the amount of information of a study, Krippendorff [2011] suggests that researchersshould try to ensure variability. To paraphrase his statement, unless there is evidence for partici-pants (”coders” ) to have exercised their ability to distinguish among signs (”units” ), ”the data theygenerate are meaningless” [Krippendorff 2011]. In such cases, a high percent agreement can be verymisleading, while a low κ must always alarm researchers. For example, did participants focus ona very small set of signs? Did the researchers in the above example tend to classify proposals as”A” to artificially inflate agreement? A strong bias towards obvious or ”default” signs, inadequateinstructions (e.g., ones that would encourage participants to explore a larger variety of gestures),bias in the gesture classification process, or a poorly chosen design space are all possible problems,where each requires a different treatment.
Ensuring variability is especially important for designing rich and meaningful gesture vocab-ularies. Therefore, establishing measures that encourage variability has very practical designimplications. We further argue that κ coefficients are especially appropriate for the analysis ofgesture elicitation results, since the presence of a prior bias probability is a very realistic assumption(see Sections 2.5 and 3.2). Assuming that participants equally choose among an infinite number of
ACM Transactions on Computer-Human Interaction, Vol. 1, No. 1, Article . Publication date: April 2018.

:18 Tsandilas T.
possible signs by only considering the individual properties of each referent is a naive approachthat, in several situations, could result in suboptimal design solutions.
4.3 Alternative Measures: Agreement Specific to CategoriesOthers have argued that a single agreement score cannot fully describe how raters agree with eachother [Cicchetti and Feinstein 1990; Spitzer and Fleiss 1974; Uebersax 2015]. Consider again thescenario of the two HIV diagnosis tests. Instead of a single measure of agreement, two separatemeasures could be used: (i) a measure specific to positive and (ii) a measure specific to negative testresults. In this case, the investigators would aim for high agreement for both result categories. Theadvantage of the approach is that one can distinguish between high agreement for one category,e.g., negative test results, and low agreement for the other, e.g., positive test results. The approach isanalogous to the use of sensitivity, otherwise recall, and specificity measures for the evaluation ofbinary classification tasks. Cicchetti and Feinstein [1990] recommended using these two indices inconjunction with chance-corrected agreement, viewing the apporach as a remedy to the paradoxesof κ coefficients.
To deal with multiple agreement categories, which is our focus here, Uebersax [1982] describes amore generic formulation of agreement specific to categories, or specific agreement:
SAk =
∑mi=1 nik (nik − 1)∑mi=1 nik (ni − 1)
(6)
where we use again the notation of Table 2. SAk is the proportion of agreement specific to categoryk and is computed by dividing the total number of agreements on category k by the total numberof opportunities for agreement on this category. In the context of gesture elicitation, it can beinterpreted as the conditional probability that a randomly chosen participant assigns a referent tosign k given that another randomly chosen participant has also assigned the same referent to thatsign.3 For the dataset in Table 1, specific agreement is as follows:
Sign: A B C D ESpecific Agreement: .00 .34 .32 .17 .18
We observe that specific agreement is higher for the two frequent signs (”B” and ”C”). It is zero for”A”, which appears rarely and with no consensus among participants.
Specific agreement can be used as a complementary measure, as it helps investigators to identifywhere low or high agreement occurs. However, its interpretation for more than two categories isnot straightforward. As a general principle, observing high agreement over a few very frequentsigns may indicate a low overall agreement. Spitzer and Fleiss [1974] further argued that specificagreement itself should be corrected for chance agreement. If the bias distribution is commonacross all participants, the proportion of chance agreement specific to a sign k is given by theterm πk in Equation 5 [Uebersax 1982]. This term represents the occurrence frequency of that signacross all participants and all referents. Then, we can use Equation 4 to derive the proportion ofchance-corrected agreement specific to each individual sign. For the previous example, results areas follows:
Sign: A B C D ESpecific Chance Agreement: .03 .30 .30 .20 .18
Specific Chance-Corrected Agreement: .00 .06 .03 -.04 .01
3As we explained earlier, participants do not directly propose signs. However, we can make this assumption to simplify ourpresentation.
ACM Transactions on Computer-Human Interaction, Vol. 1, No. 1, Article . Publication date: April 2018.

Fallacies of Agreement: A Critical Review of Consensus Assessment Methods for GestureElicitation :19
After chance correction, specific agreement is close to zero for all four signs.For our analyses in Section 7, we report raw, i.e., without chance correction, specific agree-
ment. Nevertheless, our interpretation also considers the observed frequencies of signs. Krippen-dorff [2011] has proposed additional information measures as companions of chance-correctedcoefficients, but we will not discuss them in this article.
5 INTERPRETING THE MAGNITUDE OF AGREEMENTHow much agreement is sufficient for a vocabulary of user-defined gestures? What criteria caninvestigators use to differentiate between low and high consensus? In response to these questions,Vatavu and Wobbrock [2015] have proposed some generic guidelines on how to interpret themagnitude of agreement: AR < .100 is low agreement, .100 < AR < .300 is medium, .300 <AR < .500 is high, and AR > .500 is very high agreement. These guidelines derive from two typesof analysis: (i) a probabilistic reasoning, and (ii) a survey of agreement rates from past gestureelicitation studies.
In this section, we review the above guidelines. Our analysis indicates that both the probabilisticreasoning and the survey of past studies can lead to incorrect conclusions. We examine how otherdisciplines interpret agreement values and discuss the implication of these practices for gestureelicitation studies.
5.1 Probabilistic ReasoningVatavu and Wobbrock [2015] present an analytical approach to derive the probability distributionof agreement rates (AR) and use this distribution to identify the low, medium, and high range ofprobable agreement rates (see Figure 4). They then use these ranges to interpret the magnitude ofobserved agreement rates. For example, they estimate that the probability of obtaining an agreementrate AR > .500 is less than 1%, so they interpret observed agreement rates of this magnitude asvery high. In contrast, they interpret agreement rates near the middle range of the probabilitydistribution as medium agreement.
We identify two flaws in this reasoning:
0 0.1 0.2 0.3 0.4 0.5 0.6 0.7 0.8 0.9 1AR
prob
abili
ty (%
)
0
10
20
30
n = 20 participants
low medium high very high
Fig. 4. The probability distribution of AR values and recommended ranges of agreement (low, medium, high,and very high) based on the probabilistic reasoning of Vatavu and Wobbrock [2015]. We show it here for20 participants and a bin size of h = .05. Problem: The distribution is derived based on assumptions of fullyrandom proposals, which means that medium or higher agreement can simply occur by chance with a veryhigh probability (≈ 81%).
ACM Transactions on Computer-Human Interaction, Vol. 1, No. 1, Article . Publication date: April 2018.

:20 Tsandilas T.
Flaw 1. It relies on a null distribution, i.e., a probability distribution of agreement rates byassuming completely random proposals. Yet, the authors’ analysis overlooks this fact and han-dles the null distribution as a distribution of observed agreement rates under no assumptionof how agreement between participants takes place. Given the use of a null distribution, thederived interpretation guidelines are absurd. For example, the average of their distribution isAR = .214 for n = 20 participants and AR = .159 for n = 40 participants. Values close to theseaverages are interpreted as medium agreement despite the fact that they correspond to fullyrandom proposals. According to the authors, values in the interval of medium agreement(.100 − .300) occur (simply by chance) with a 59% probability. Wouldn’t it make more senseto look for agreement (low, medium, or high) away from these ranges? Shouldn’t we ratherinterpret values in these ranges as ”no agreement?”
Flaw 2. To derive the probability distribution, Vatavu and Wobbrock [2015] enumerate allpossible partitions of integer n, where n is the total number of participants. According to thissolution, each partition represents a distinct configuration of sign proposals. For example,suppose we partition six participants into four groups with one, one, two, and two participantseach: 1 + 1 + 2 + 2 = 6. In this case, there are four distinct signs, and there is one agreement(i.e., two participants propose the same sign) for two of these signs. The authors assume thatall such partitions occur with the exact same probability. For example, for a study with sixparticipants (see Table 4), they assume that the probability that all six participants agree(partition t11: 6) is equal to the probability that participants completely disagree (partition t1:1 + 1 + 1 + 1 + 1 + 1) or only agree in pairs (partition t8: 2 + 2 + 2).
Unfortunately, this assumption is incorrect for two reasons. First, the number of alternativeways to assign participants to each partition is not the same. As shown in Table 4, there are
Table 4. Example showing how Vatavu and Wobbrock [2015] calculate the probability distribution overpossible proposal configurations. For six participants, they identify 11 possible partitions ti and assumethat they all occur with the same probability. Under this assumption, the mean agreement rate (of randomproposals) is calculated by averaging the individual agreement rates ARi .
Proposal Partitions ARi fi
t1: 1 + 1 + 1 + 1 + 1 + 1 .000 1t2: 1 + 1 + 1 + 1 + 2 .067 15t3: 1 + 1 + 1 + 3 .200 20t4: 1 + 1 + 2 + 2 .133 45t5: 1 + 1 + 4 .400 15t6: 1 + 2 + 3 .267 60t7: 1 + 5 .667 6t8: 2 + 2 + 2 .200 15t9: 2 + 4 .467 15t10: 3 + 3 .400 10t11: 6 1.000 1
Mean: .345Problem: Assuming equiprobable partitions is incorrect for two reasons: (i) The number fi of alternative ways to createeach partition is not the same, e.g., f6 = 60× f1. Thus, partitions do not all occur with the same frequency. (ii) Agreementand disagreement do not occur with the same probability. For example, full agreement (t11) and full disagreement (t1)cannot occur with the same probability unless chance agreement is exactly 50%, e.g., if participants choose betweentwo only signs with no bias.
ACM Transactions on Computer-Human Interaction, Vol. 1, No. 1, Article . Publication date: April 2018.

Fallacies of Agreement: A Critical Review of Consensus Assessment Methods for GestureElicitation :21
0 0.1 0.2 0.3
0
20
40
60
80
100
0 0.1 0.2 0.3 0 0.1 0.2
0 0.1 0.2 0.3
0
20
40
60
80
100
0 0.1 0.2 0.3 0 0.1 0.2
prob
abili
ty (%
)pr
obab
ility
(%)
AR
AR
[ n = 20 participants ]
[ n = 10 participants ]
-0.05 0.050 -0.05 0.050 -0.05 0.050
-0.05 0.050 -0.05 0.050 -0.05 0.050
AR AR
AR AR
κF κF κF
κF κF κF
z1 z2 z3
Bias Distribution
Fig. 5. Histograms showing the probability distribution of AR (in blue) and κF (in orange) when participantsrandomly choose signs for 40 referents under bias. Distributions were generated with Monte Carlo simulationsof 1000 iterations. The bin size of all the histograms is h = .0125.
f8 = 15 different ways to partition six participants into pairs, but there is only f11 = 1 way tocreate a single group of six. As a result, the two partitions t8 and t11 must occur with verydifferent probabilities. We see later that the analysis of Vatavu and Wobbrock [2016] for theirVb statistic corrects this mistake.
Second, agreement and disagreement do not generally occur with the same probability.For example, full agreement (t11: 6) is very unlikely to occur when participants randomlychoose from a very large set of possible signs. Full disagreement (t1: 1 + 1 + 1 + 1 + 1 + 1) isfar more likely to occur in this case. The authors’ later analysis for the Vb statistic repeatsthis second mistake.
Can we correct the above mistakes and still rely on a probabilistic reasoning to interpret themagnitude of agreement rates? To answer this question, we first need to infer the correct null distri-bution of agreements. This is not feasible unless we know how participants choose signs. Analyticalsolutions to this problem are not trivial. Fortunately, such distributions can be approximated withMonte Carlo simulations. Specifically, we simulate a gesture elicitation study as a computerizedprocess, where n participants randomly propose signs form referents. This process is repeated alarge number of times, and each time, a new agreement score is computed.As in Section 3.2, we assume that participants choose from an infinite number of signs under
bias. Figure 5 shows six distributions for two sample sizes (n = 10 and n = 20) and three bias levels.Here, we use the Zipf-Mandelbrot distribution to model bias (see Figure 3), but one can run MonteCarlo simulations with other prior bias-distribution assumptions. In all cases, the mean agreementrate approximates the chance agreement pe , and the larger the number of participants, the morelikely it becomes to find agreement rates close to pe . In orange, Figure 5 presents the distributionsof Fleiss’ κF . As expected, all these distributions are centered around zero.
ACM Transactions on Computer-Human Interaction, Vol. 1, No. 1, Article . Publication date: April 2018.

:22 Tsandilas T.
Given such distributions, on can visually assess if an observed agreement value is likely tohave occurred by chance. The further the value from the null distribution, the greater are thechances that agreement is different than zero. Such distributions are commonly known as samplingdistributions of a statistic and serve as the basis for constructing confidence intervals and significancetests [Baguley 2012]. However, they say very little about the magnitude of agreement, i.e., whetheran observed agreement value is low, medium, or high. Unfortunately, this is a more complexproblem that solutions based on probabilities and statistics cannot address.
5.2 Survey of Past StudiesIn addition to their probabilistic reasoning, Vatavu and Wobbrock [2015] review agreement ratesfrom a total of 15 papers with gesture elicitation results. They find that average A scores rangefrom .160 to .468, while average AR scores range from .108 to .430, where the mean value is .261.They rely on these results to further justify their guidelines.
However, comparing agreement rates across different studies can be misleading because chanceagreement can be high for some studies and low for others (see Section 3). We further show inSection 7 that a higherAR score does not always translate into a higher chance-corrected agreement.The approach is problematic for additional reasons. Setting standards based on results from paststudies seems a reasonable approach, but it can discourage efforts to raise our standards. Indeed,there does not seem to be any valid reason to be satisfied with a gesture agreement rate of .2 or .4.
Gwet [2014] dedicates a full chapter on how to interpret the magnitude of an agreement. Severalauthors suggest conventional thresholds to help researchers in this task – Fleiss, for example, labelsκ < .400 as “poor” and κ > .750 as “excellent.” Krippendorff [2004] suggests α > .667 and then laterα > .800 as thresholds below which data must be rejected as unreliable. However, he and manyothers recognize that such thresholds are largely arbitrary and should be chosen depending on theapplication domain and on the “costs of drawing invalid conclusions from these data” [Krippendorff2004]. It has also been emphasized that the magnitude of an agreement cannot be interpreted ifconfidence intervals are not provided [Gwet 2014; Krippendorff 2004].
In gesture elicitation studies, the bar for an agreement score to be considered acceptable is waylower, even when ignoring chance agreement. As much as we would like to have objective rules tohelp us distinguish between acceptable and unacceptable agreement scores, it is wise to refrain fromusing any such rule until these can be grounded in cost-benefit analyses that integrate usabilitymetrics.
6 STATISTICAL INFERENCEStatistical inference is the process of drawing conclusions about populations by observing randomsamples. It includes deriving estimates and testing hypotheses. Vatavu and Wobbrock [2015; 2016]have proposed two statistical tests to support hypothesis testing: (i) the Vrd statistic for comparingagreement rates within participants [Vatavu and Wobbrock 2015], and (ii) the Vb statistic forcomparing agreement rates between independent participant groups [Vatavu and Wobbrock 2016].
We explained earlier (see Section 3.5) that comparing raw agreement rates is a valid approach aslong as chance agreement is common across all compared groups. For within-participants designs,this is a valid assumption. In contrast, when comparing independent participant groups, chanceagreement may vary, particularly when making comparisons across studies that test different signvocabularies or employ different setups. Nevertheless, if groups are tested under similar conditions,and their data are analyzed with identical methods, there is no reason to expect bias differences. Inthis case, one can assume that chance agreement is equal for both groups, and therefore, comparingagreement rates with the Vb statistic could be considered as valid. However, we show that both the
ACM Transactions on Computer-Human Interaction, Vol. 1, No. 1, Article . Publication date: April 2018.

Fallacies of Agreement: A Critical Review of Consensus Assessment Methods for GestureElicitation :23
-0.5 -0.3 -0.1 0.1 0.3 0.5
0
20
40
60
80
-0.5 -0.3 -0.1 0.1 0.3 0.5 -0.5 -0.3 -0.1 0.1 0.3 0.5
-0.5 -0.3 -0.1 0.1 0.3 0.5
0
20
40
60
80
-0.5 -0.3 -0.1 0.1 0.3 0.5 -0.5 -0.3 -0.1 0.1 0.3 0.5
prob
abili
ty (%
)pr
obab
ility
(%)
B = 0.306B = 2.25 B = 18.4
sd = 5.42 sd = 0.88 sd = 0.416
Agreement rate of source populations
.1 .5 .9
Zipf-Mandelbrot
Half-N
ormal
δAR δAR δAR
δAR δAR δAR
Fig. 6. Histograms showing the sampling distribution of agreement rate differences (δAR = ARi −ARj ) when20 participants propose signs for two referents Ri and Rj and δAR = 0. Each distribution corresponds to adifferent distribution of sign preferences (common for both referents) and is generated with a Monte Carlosimulation of 5000 iterations. The bin size of all the histograms is h = .05.
Vrd and theVb statistic are based on incorrect probabilistic assumptions, and therefore, they shouldnot be used.
6.1 Modeling Agreement for Individual ReferentsBefore we examine the significance tests of Vatavu and Wobbrock [2015; 2016], we explore prob-abilistic models that describe how participants’ sign proposals reach agreement for individualreferents. As with bias, modeling agreement for individual referents will enable us to systematicallyevaluate the significance tests through Monte Carlo experiments.
Suppose that n participants propose signs form referents, and let ARi be the agreement rate forreferent Ri . We model sign preferences for this referent as a monotonically-decreasing probability-distribution function pi (k ), k = 1, 2, ...∞, which expresses the probability of selecting the kth mostlikely sign for referent Ri . Note that each referent Ri will generally have its own distribution pi , andthe order of preferences over signs may also be different. The distribution function is assumed tobe asymptotically decreasing such that pi (k ) → 0 when k → ∞. Clearly, the closer the distributionfunction to uniform is, i.e., no preferences over particular signs emerge, the lower is expected to bean observed agreement rate ARi .The above formulation is very similar to our bias formulation in Section 3.2. As for bias, we
simplify our analysis by focusing on two probability distribution functions: (i) the discrete half-normal distribution withmean = 1, and (ii) the Zipf-Mandelbrot distribution with s = 2. Given thesedistributions, one can generate source populations with a specific ARi by varying their parameterssd or B. For example, for the half-normal distribution function, we choose sd = 5.42 for ARi = .1,sd = 0.88 for ARi = .5, and sd = 0.416 for ARi = .9. For the Zipf-Mandelbrot distribution function,we choose B = 0.306 for ARi = .1, B = 2.25 for ARi = .5, and B = 18.4 for ARi = .9.
Significance tests focus on differences between agreement rates rather than individual agreementrates. Figure 6 shows the sampling distribution (n = 20) of the difference in agreement (δAR =ARi − AR j ) between two referents Ri and R j , when sign preferences for those referents follow
ACM Transactions on Computer-Human Interaction, Vol. 1, No. 1, Article . Publication date: April 2018.

:24 Tsandilas T.
Table 5. Example showing how Vatavu and Wobbrock [2015] apply Cochran’s [1950] Q test to test differencesin agreement among referents (R1,R2, ...,Rµ ). Participant pairs (Pi , Pj ) are handled as independent cases,which are randomly sampled from a population of participant pairs. For six participants, there is a total of 15participant pairs. Agreement observations are represented by binary values, where participants either agree(1) or disagree (0).
ReferentsParticipant pairs R1 R2 R3
(P1, P2) 1 1 0(P1, P3) 0 1 0(P1, P4) 1 1 0(P1, P5) 1 1 0(P1, P6) 0 0 0(P2, P3) 0 1 1(P2, P4) 1 1 1(P2, P5) 1 1 1(P2, P6) 0 0 1(P3, P4) 0 1 1(P3, P5) 0 1 1(P3, P6) 1 0 1(P4, P5) 1 1 1(P4, P6) 0 0 1(P5, P6) 0 0 1
the same probability distribution, and δAR = 0. We examine six different distributions of signpreferences, which produce sampling distributions for three agreement levels: .1, .5, and .9. Noticethat the spread of the sampling distribution is narrower for the half-normal distribution. It becomesespecially narrow, when the agreement level of the source population is low (ARi = .1).
6.2 The Vrd Statistic: Testing Within-Participants EffectsThe Vrd statistic [Vatavu and Wobbrock 2015] can be used to compare agreement rates of differentreferents (or groups of referents) and test hypotheses such as (i) ”there is an effect of the referenttype on agreement” or (ii) ”participants demonstrate higher agreement for directional than non-directional referents.”The test is a direct application of Cochran’s [1950] Q non-parametric test, which is used to
test differences on a dichotomous dependent variable (with values coded as 0 or 1) among µrelated groups.4 Cochran’s Q test is analogous to the one-way repeated-measures ANOVA but fora dichotomous rather than a continuous dependent variable. For example, one can test whetherthere are differences in student performance (1 = pass or 0 = fail) among three different courses(e.g.,Mathematics, Physics, and Chemistry). A key assumption of Cochran’s Q test is that cases, suchas students in the above example, are randomly sampled from a population, and thus, they are allindependent.
In order to apply Cochran’s Q test, Vatavu and Wobbrock [2015] enumerate all the possible pairsof participants and handle pairs as independent cases (see Table 5). Then, they consider agreementas a dichotomous variable that can take two values: 1 for agreement or 0 for disagreement. Given
4When µ = 2, the test is equivalent to McNemar’s test.
ACM Transactions on Computer-Human Interaction, Vol. 1, No. 1, Article . Publication date: April 2018.

Fallacies of Agreement: A Critical Review of Consensus Assessment Methods for GestureElicitation :25
P1 P2 P3 P4 P5 P6
a26 = 0
a25 = 1
a12 = 1 a45 = 1a23 = 0 a34 = 0 a56 = 0
aij = 1 (agreement)
aij = 0 (disagreement)
Fig. 7. Example with six participants (P1 - P6) that demonstrates how to use dependencies to derive agreementpairs. Given the five observations of consecutive agreement pairs in blue (a12, a23,..., a56), we can infer otheragreement pairs ai j (in red), where ai j = 1 if and only if the number of disagreeing pairs between participantsPi and Pj is even. For example, a25 = 1 because there are two disagreeing pairs between P2 and P5, whilea25 = 0 because there are three disagreeing pairs between P2 and P6.
this approach, applying Cochran’s Q test is straightforward, since the goal is to test differences inagreement among µ referents, or otherwise, µ related groups.Unfortunately, this solution is problematic because agreement pairs are highly interdependent,
which is against the independence assumption of Cochran’s Q test. For example, if participant Paagrees both with participant Pb and participant Pc , we can safely deduce that participants Pb andPc agree with each other. Similarly, if Pa agrees with participant Pb but disagrees with participantPc , then we can deduce that participants Pb and Pc disagree. By assuming that agreement pairsare independent cases, the solution artificially increases the number of independent observations:µ ×n independent observations from n participants are transformed to µ × n (n−1)
2 observations. Forthe six participants of our example, Figure 7 explains how to infer agreement for all 15 participantpairs from five only observations.As this approach greatly overestimates the statistical power of the significance test, one can
predict that the test is too sensitive to observations of random differences, or it rejects the nullhypothesis too often. We demonstrate the problem with two Monte Carlo experiments that estimatethe Type I error rate of the Vrd test.Experiment 6.1.We re-implemented the Vrd statistic by using the implementation of Cochran’sQ test in coin’s [Hothorn et al. 2008] statistical package for R. Our implementation accuratelyreproduces the values reported by Vatavu and Wobbrock [2015] for the study of Bailly et al. [2013].This confirms that our implementation is correct.
Our simulation experiment is as follows. We repeatedly generate n random samples of proposalsfor µ = 2 referents, where n represents the number of participants in a gesture elicitation study.We repeat the process by taking samples from nine source populations, where each approximatesa different agreement rate AR, from .10 to .90. To generate populations for each AR level, we useeither the Zipf-Mandelbrot or the discrete half-normal probability distribution, as explained inSection 6.1.
We estimate Type I error rates for two significance levels: α = .05 and α = .01. For each sourcepopulation, we run a total of 1600 iterations, where each time, we generate two random samplesof size n. Given that these two samples are randomly generated from the same population, thepercentage of iterations where the statistical test rejects the null hypothesis provides an estimateof its Type I error. Type I error rates should be close to 5% for α = .05 and close to 1% for α = .01.We test n = 20, which is a typical size for gesture elicitation studies.
Table 6 summarizes our results. All error rates are extremely higher than their nominal values,reaching an average of 40 to 60% for the Zipf-Mandelbrot distributions. For the discrete half-normaldistributions, error rates are lower but still unacceptably high. We can easily explain the lower
ACM Transactions on Computer-Human Interaction, Vol. 1, No. 1, Article . Publication date: April 2018.

:26 Tsandilas T.
Table 6. Experiment 6.1: Type I error rates for the Vrd statistical test [Vatavu and Wobbrock 2015]. The test isapplied over randomly generated proposals of 20 participants for µ = 2 referents (1600 iterations). The sourcepopulation of sign proposals follows either a Zipf-Mandelbrot or a discrete half-normal distribution thatapproximates the target agreement rate: AR = .10, .20, ... .90.
(α = .05) (α = .01)AR Zipf-Mandelbrot Half-Normal Zipf-Mandelbrot Half-Normal.10 .31 .11 .17 .04.20 .42 .19 .31 .07.30 .51 .22 .40 .13.40 .56 .31 .45 .17.50 .56 .37 .48 .23.60 .61 .50 .51 .35.70 .62 .57 .52 .47.80 .67 .66 .50 .51.90 .67 .69 .53 .54
error rates that we observe in this case by considering the narrower spread of the correspondingsampling distributions in Figure 6. One can test the Vrd statistic with other prior distributions, e.g.,by taking linear combinations of our two model distributions. Type I error rates will be within theabove ranges of error, where the discrete half-normal distribution serves as a lower bound.Experiment 6.2. The second experiment is similar to the first, but we now use real data fromBailly et al. [2013] to generate populations from which we draw random samples. Bailly et al. [2013]elicited gestures applied to the keys of a keyboard from 20 participants for a total of 42 referents. Weuse the sign distribution within each referent to create a large population of 6000 sign proposals byrandom sampling with replacement. This process produces a total of 42 populations with agreementrates, ranging from AR = .12 to AR = .91 (median = .32). Then, for each population, we repeatedlygenerate n = 20 random samples of proposals for µ = 2 referents. As before, we apply the Vrdstatistic to test whether the difference between their agreement rates is statistically significant.
After 1600 iterations, we find the following Type I error rates:
(α = .05) (α = .01)Average Min Max Average Min Max
Type I Error Rate: .41 .12 .68 .29 .05 .53These results are consistent with the results of Experiment 6.1. Error rates are extremely high forall tested populations.
6.3 The Vb Statistic: Comparing Agreement between Independent Participant GroupsTheVb statistic [Vatavu andWobbrock 2016] can be used to compare agreement rates of independentparticipant groups and test hypotheses such as: (i) ”women demonstrate higher agreement thanmen”or (ii) ”touch gestures receive higher agreement than full-body gestures on referents that representnavigation actions.” Previous work [Vanbelle and Albert 2009] has developed agreement indices toevaluate agreement between independent rater groups, but these indices answer a different type ofquestions, such as ”do women agree with men?” Since such questions are out of the scope of theVbstatistic, we do not discuss them here.
ACM Transactions on Computer-Human Interaction, Vol. 1, No. 1, Article . Publication date: April 2018.

Fallacies of Agreement: A Critical Review of Consensus Assessment Methods for GestureElicitation :27
Table 7. Example on how Vatavu and Wobbrock [2016] calculate the probability of proposal partitions. Forseven participants, there are 15 possible partitions, where each partition ti appears with a different frequencyfi . Each probability πi is calculated by dividing fi by all 877 possible proposal configurations. Each partitionti corresponds to a different number ai of agreeing pairs.
Proposal Partitions ai fi πit1: 1 + 1 + 1 + 1 + 1 + 1 + 1 0 1 .0011t2: 1 + 1 + 1 + 1 + 1 + 2 1 21 .0239t3: 1 + 1 + 1 + 1 + 3 3 35 .0399t4: 1 + 1 + 1 + 2 + 2 2 105 .1197t5: 1 + 1 + 1 + 4 6 35 .0399t6: 1 + 1 + 2 + 3 4 210 .2395t7: 1 + 1 + 5 10 21 .0239t8: 1 + 2 + 2 + 2 3 105 .1197t9: 1 + 2 + 4 7 105 .1197t10: 1 + 3 + 3 6 70 .0798t11: 1 + 6 15 7 .0080t12: 2 + 2 + 3 5 105 .1197t13: 2 + 5 11 21 .0239t14: 3 + 4 9 35 .0399t15: 7 21 1 .0011
Total: 877 1.0000Problem:We highlight the two extreme cases in purple: full agreement (t15) and full disagreement (t1). Their probabilitiesare always assumed as equal (π15 = π1), even if observed levels of agreement are very high or very low. Unfortunately,this assumption is not justified.
Vatavu and Wobbrock [2016] are inspired by Fisher’s [1954] exact test to construct their test,but this time, they develop their own probabilistic framework to account for dependencies amongparticipant pairs (see Figure 7). Their reasoning is similar to the one they previously used [Vatavuand Wobbrock 2015] to derive the probability distribution of ARi values (see Section 5.1). Theygenerate all possible proposal partitions ti and estimate their probabilities πi (see Table 7). Then,they use these partial probabilities to estimate the overall probability of agreement. Here, wefocus on how the authors derive the probabilities πi of individual partitions. For further detailsabout the full test construction, we refer the reader to its original presentation by Vatavu andWobbrock [2016].
As discussed in Section 5 (see Table 4), different partitions do not generally appear with thesame frequency fi . Table 7 shows how Vatavu and Wobbrock [2016] calculate the probability πi ofall 15 possible partitions for seven participants, where frequencies fi are now taken into account.However, this solution still does not consider how difficult or how easy it is to reach agreement.For example, it relies again on the assumption that full agreement (i.e., all participants propose thesame sign) and full disagreement (i.e., each participant proposes a different sign) always occur withthe same probability. This assumption is unfortunately not realistic.
The authors’ own evaluation of the Vb statistic demonstrate extremely low Type I error rates forAR ≥ .200. As shown in Table 8 (grey columns), Vatavu and Wobbrock [2016] report error ratesthat are orders of magnitude lower than their nominal significance levels. Such error rates areproblematic, and one could suspect that the test is too conservative. Nevertheless, the authors alsopresent results from a number of case studies, where the Vb test is shown to be powerful enough
ACM Transactions on Computer-Human Interaction, Vol. 1, No. 1, Article . Publication date: April 2018.

:28 Tsandilas T.
Table 8. Experiment 6.3: Type I error rates for the Vb test statistic. The significance test is applied on twoindependent groups of 20 participants for 1600 iterations. The source population of sign proposals followseither a Zipf-Mandelbrot or a discrete half-normal distribution that approximates the target agreement rate:AR = .10, .20, ... .90. Estimations of Type I error rates reported by Vatavu and Wobbrock [2016] (copied frompage 3396) are shown in grey.
(α = .05) (α = .01)AR author estim. Zipf-Mandelbrot Half-Normal author estim. Zipf-Mandelbrot Half-Normal.10 .190 .13 .03 .103 .06 .003.20 .041 .40 .15 .017 .22 .05.30 .004 .54 .26 .002 .38 .14.40 .000 .59 .36 .000 .45 .21.50 .000 .62 .40 .000 .50 .25.60 .003 .62 .52 .000 .52 .39.70 .001 .64 .56 .000 .51 .48.80 .002 .72 .61 .000 .43 .45.90 .000 .68 .66 .000 .25 .26
to reject the null hypothesis for many comparisons of practical interest. To clarify this issue, were-evaluated the Type I error rate of the test with two simulation experiments.Experiment 6.3. We re-implemented the Vb statistic and the authors’ original algorithm thatderives the probability distribution for two independent participant groups. Our implementationaccurately reproduces p-values reported by Vatavu and Wobbrock [2016] for their case studies,which confirms that our implementation is correct.5 Our simulation method is similar to the onereported by the authors. We repeatedly generate populations of 100 participants, from which wedraw two samples of equal size (20 participants each). We repeat this process for nine populations,where each population approximates a different agreement rate, from .10 to .90.
Vatavu and Wobbrock [2016] do not explain how they generate populations with controlledagreement rates, so we use again the Zipf-Mandelbrot and the discrete half-normal probabilitydistribution functions. For each, we run a total of 1600 iterations and estimate the Type I error ratefor two significance levels: α = .05 and α = .01.
Table 8 summarizes our evaluation results. Type I error rates are again extremely high for bothdistribution functions. Surprisingly, with the exception of AR = .10, our estimations are orders ofmagnitude higher than the ones reported by Vatavu and Wobbrock [2016] (see grey columns).Experiment 6.4. As for Experiment 6.2, we use the dataset of Bailly et al. [2013] to generatepopulations, from which we draw random samples. We first generate a large population of 6000users by random sampling with replacement from the sign proposals of the 20 participants ofthe original study. This process produces a total of 42 referent populations with agreement ratesranging fromAR = .12 toAR = .91 (median = .33). We then repeatedly sample from this populationto create two groups of 20 participants, and each time, we apply the Vb statistic to test whether theagreement rates of the two independent groups are different for each of the 42 referents.
After 1600 iterations, we find the following Type I error rates:
5However, we found that the authors’ calculations for their own example (p. 3396) are incorrect. The probability for twogroups of size 7, with 10 and 6 pairs of agreement (AR1 = .476 andAR1 = .285), is Π10,6|21,21 = .171. Since Π10,6|21,21 > .05,the null hypothesis should not be rejected.
ACM Transactions on Computer-Human Interaction, Vol. 1, No. 1, Article . Publication date: April 2018.

Fallacies of Agreement: A Critical Review of Consensus Assessment Methods for GestureElicitation :29
(α = .05) (α = .01)Average Min Max Average Min Max
Type I Error Rate: .42 .05 .70 .27 .02 .56Results are consistent with the results of Experiment 6.3. Error rates are again unacceptably highfor nearly all tested populations – only 2 out of 42 referent populations lead to Type I error ratesthat are close to their nominal levels.
6.4 Alternative Inference Methods: Jackknifing and BootstrappingInventing new statistics can be dangerous, as the HCI community lacks the expertise to validatethem and check their correctness. Other research disciplines have long established methods tosupport statistical inference for agreement indices [Gwet 2014; Hayes and Krippendorff 2007; Wood2005]. These are the methods that we present in this section.The sampling distribution of an agreement index can be hard to approximate with analytical
methods. However, resampling methods such as jackknifing [Quenouille 1949] and bootstrap-ping [Efron 1979] can be used to produce variance estimates, standard errors and confidenceintervals for almost any agreement index, including agreement rates, κ coefficients, and agreementspecific to categories. Confidence intervals can be used both to communicate uncertainty and totest hypotheses [Dragicevic 2016]. We show how to use such methods to (i) provide an intervalestimate of an agreement score, (ii) compare agreement between two groups of referents, and (iii)compare agreement between two independent participant groups.
6.4.1 Estimating Agreement Scores. To draw samples, it is crucial to first determine what israndomly sampled and what is not. In gesture elicitation studies, referents are fixed: any conclu-sion typically only applies to these referents. Participants, in contrast, are chosen randomly, andinvestigators may need to generalize their conclusions to the entire population of potential users.Gwet [2014] explains how to use the jackknife method to derive estimates of agreement indices insuch situations, when raters are randomly chosen, while rated items are fixed.
Given observations from n participants, estimation is based on n subsamples, where each time, asubsample i is produced by leaving out all the observations from the ith participant. The confidenceinterval of an agreement index κ is constructed by first estimating the variance of its samplingdistribution:
υjack =n − 1n
n∑i=1
(κ̂i − κ̂)2 (7)
where κ̂ is an estimate based on the full set of observations, and κ̂i is an estimate when leaving outthe ith participant. The square root of this variance gives the standard error: SEjack =
√υjack .
Assuming that κ coefficients follow a normal distribution, the (1 − α )% confidence interval isκ̂±SEjack ×q, where q = q(1− α
2 ,n−1) is the (1−α2 )–quantile of Student’s t-distribution with n−1
degrees of freedom. Gwet [2008] shows that normality is a reasonable assumption as long as thenumber of raters (i.e., participants) and items (i.e., referents) are reasonable high, and the agreementscore is not close to its boundary values. Our evaluation further examines this assumption.
6.4.2 Comparing Agreement Scores of Related Samples. The same technique can be used to com-pare agreement scores obtained from the same participants between different groups of referents,i.e., for within-participants estimation and hypothesis testing. To this end, a jackknife confidenceinterval is computed on their difference ∆κ = κR1 − κR2 , where κR1 and κR2 are the agreementscores of the two referent groups. Alternatively, one can use the bootstrap method [Hayes andKrippendorff 2007; Wood 2005], which does not make any assumption about normality but uses alarger number of resampling iterations, e.g., more than 3000 bootstrap samples are typically used
ACM Transactions on Computer-Human Interaction, Vol. 1, No. 1, Article . Publication date: April 2018.

:30 Tsandilas T.
to estimate a 95% confidence interval. The method relies on random sampling with replacement: ateach iteration, it generates a new random sample of size n, where each sign proposal can re-appearmultiple times. For our analyses, we will focus on the jackknife technique because it is considerablyfaster and thus easier to evaluate through Monte Carlo simulations.6
6.4.3 Comparing Agreement Scores of Independent Samples. In contrast, we use bootstrappingfor between-participants estimation and hypothesis testing, as we found no jackknife techniqueto apply to this case. The bootstrap method is applied as follows. At each iteration, the twoparticipant groups are resampled independently, and their difference is computed: ∆κ = κG1 − κG2 ,where κG1 and κG2 are the agreement scores of the two groups. We then use the percentile bootstrapmethod [Carpenter and Bithell 2000], which takes the α
2 and the (1− α2 ) percentile of the distribution
of computed differences to construct the (1 − α )% confidence interval.
6.5 EvaluationWe ran a series of Monte Carlo experiments to evaluate the above techniques.Experiment 6.5. The goal of the first experiment is to compare the jackknife method with theVrd statistic under the same experimental conditions. As our experimental method is identicalto the one for Experiment 6.1, we omit any further details here. To derive Type I error rates, weconstruct the jackknife confidence interval of the difference (95% and 99% for α = .05 and α = .01,respectively), and reject the null hypothesis if the interval does not include zero.6See our supplementary material for early comparisons between the two techniques.
Table 9. Experiments 6.5 and 6.6: Type I error rates for the jackknife (related samples of 20 participants) andbootstrap (independent samples from two groups of 20 participants) techniques applied to agreement rates ofindividual referents. Estimations are based on 1600 iterations. Source populations follow a Zipf-Mandelbrotor a discrete half-normal distribution that approximates the target agreement rate: AR = .10, .20, ... .90.
(α = .05) (α = .01)AR Zipf-Mandelbrot Half-Normal Zipf-Mandelbrot Half-Normal
[Related]Jackk
nife
.10 .011 .008 .000 .000
.20 .019 .014 .001 .003
.30 .039 .016 .004 .003
.40 .051 .030 .009 .007
.50 .048 .028 .012 .003
.60 .065 .046 .019 .013
.70 .059 .064 .018 .020
.80 .053 .089 .016 .018
.90 .019 .056 .003 .003
[Independ
ent]Bo
otstrap .10 .030 .004 .004 .000
.20 .041 .016 .011 .001
.30 .056 .016 .014 .004
.40 .064 .027 .016 .006
.50 .071 .025 .018 .004
.60 .064 .039 .023 .006
.70 .053 .042 .026 .011
.80 .044 .038 .011 .012
.90 .007 .014 .002 .002
ACM Transactions on Computer-Human Interaction, Vol. 1, No. 1, Article . Publication date: April 2018.

Fallacies of Agreement: A Critical Review of Consensus Assessment Methods for GestureElicitation :31
Table 9 (top) presents our results, where error rates can be compared to the ones of the Vrdtest in Table 6. For α = .05, error rates are generally close to their nominal values. However, theyare not uniform across all AR levels. Error rates are lower near the extremes and the lower rangeof agreement rates. Fluctuations are stronger for α = .01, which implies a lower accuracy of thetechnique at this significance level.Experiment 6.6. The goal of the second experiment is to compare the bootstrap method with theVb statistic. The experimental method is identical to the one used for Experiment 6.2. Again, weconstruct the bootstrap confidence interval of the difference, and reject the null hypothesis if theinterval does not include zero.Error rates are presented in Table 9 (bottom) and can be contrasted to the ones of the Vb test
in Table 8. We observe that the discrete half-normal distribution results in more conservativeconfidence intervals. Again, error rates are higher near the middle range of agreement rates.Experiment 6.7. The third experiment provides a more holistic evaluation of the jackknife tech-nique. In particular, we evaluate the coverage probability of its confidence intervals when usingFleiss’ κF to assess agreement. As for Experiment 6.2, we randomly sample with replacement fromthe dataset of Bailly et al. [2013] to generate a large population of 6000 sign proposals, from whichwe then draw random samples.
We conduct a number of different tests. First, we estimate the coverage of the intervals for theoverall κF (≃ .28) estimated over the full set of referents. We also divide the 42 referents into threeequal groups of 14 referents, where each corresponds to a different κF level: lowest (κF ≃ .12),medium (κF ≃ .20), and highest (κF ≃ .49). We estimate coverage for all these groups. After 1600iterations, results are as follows:
Conf. Level = 95% (α = .05) Conf. Level = 99% (α = .01)Groups: All Lowest Medium Highest All Lowest Medium Highest
Coverage (%): 96.3 95.3 95.8 95.9 99.0 99.1 99.1 98.8
Overall, coverage probabilities are close to their confidence levels, although one can notice that thetechnique may produce conservative confidence intervals.
Second, we evaluate the technique on Fleiss’ κF for individual referents (see Section 3.4), wherewe test all 42 referents of the study. We also evaluate it with random groups of referents. We testa total of 200 random groups, where half contain five referents, and the other half contain tenreferents. After 1600 iterations, results are as follows:
Conf. Level = 95% (α = .05) Conf. Level = 99% (α = .01)Num of Referents: Single Five Ten Single Five Ten
Coverage (%): 93.0 95.3 95.6 97.5 99.0 99.2(sd=2.6) (sd=0.7) (sd=0.6) (sd=1.1) (sd=0.3) (sd=0.3)
Each estimate is based on many samples, so we also report standard deviations. We observe thatconfidence intervals for individual referents are less precise, resulting in lower coverage probabilitieswith a larger variance. This is possibly due to larger deviations from the normality assumption asthe number of referents becomes too low.
Finally, we evaluate the jackknife technique for differences in Fleiss’ κF within the same groupof participants. We test differences between individual references and between equal groups of fouror eight referents. We run a total of 3 × 50 = 150 tests, and for each test, we compute the coverageprobability of the jackknife confidence intervals for 1600 iterations:
ACM Transactions on Computer-Human Interaction, Vol. 1, No. 1, Article . Publication date: April 2018.

:32 Tsandilas T.
Conf. Level = 95% (α = .05) Conf. Level = 99% (α = .01)Num of Referents per Group: Single Four Eight Single Four Eight
Coverage (%): 95.4 95.7 95.7 97.7 99.1 99.2(sd=2.9) (sd=0.6) (sd=0.6) (sd=3.8) (sd=0.2) (sd=0.3)
We observe again that confidence intervals may be less precise when comparing differences betweenindividual referents.Experiment 6.8. Evaluating the bootstrap method on populations generated by sampling withreplacement is less appropriate because bootstrap confidence intervals are produced with the exactsame approach. Furthermore, the method relies on a large number of resampling iterations sorunning large-scale Monte Carlo simulations on κ coefficients requires significant computationresources. Therefore, we run a smaller experiment on the original dataset of Bailly et al. [2013].Our method is as follows. We randomly divide the 20 participants of the study into two equal
groups and count the number of referents for which the bootstrap confidence interval of theirdifference ∆κF does not include zero. We repeat this process a large number of times and calculatethe mean error. This allows us to produce an estimate of the technique’s Type I error rate. Dueto computational constraints, we focus on a significance level of α = .05 and limit the number ofbootstrap iterations to 1000. We also set the number of times that we randomly partition participantsinto groups to 100. The mean number of referents for which the technique rejects the null hypothesisis 1.8, which corresponds to a Type I error rate of 1.8/42 = .043.
6.6 SummaryThe significance tests of the Vrd and Vb statistics yield large Type I errors. The jackknife techniqueis a good alternative for estimating within-participants agreement differences, while differencesbetween independent groups of participants can be estimated with bootstrapping methods. Thejackknife can be further used to construct confidence intervals for the overall κ of a study and forthe κ of smaller groups of referents.
To the best of our knowledge, these techniques are the only viable solutions. However, they alsohave limitations. Depending on the source population, they may produce conservative confidenceintervals or inflate Type I error rates when applied to agreement scores of individual referents. HCIresearchers should be attentive to such limitations, in particular when they use small sample sizesand rely on statistical significance to draw conclusions.
7 REANALYSIS OF PAST GESTURE ELICITATION STUDIESWe reanalyze the results of four gesture elicitation studies, all published in the proceedings ofCHI. Through our analyses, we demonstrate the use of chance-corrected coefficients and specificagreement. For estimation and hypothesis testing, we apply the resampling methods discussed inSection 6. We discuss how our analyses affect the authors’ original interpretation of their findings.
7.1 Bend Gestures for Flexible Displays – Lahey et al. [2011]The gesture elicitation study by Lahey et al. [2011] explored a vocabulary of bend gestures forflexible portable displays. The investigators identified symmetrical pairs of actions (e.g., ”open-close”and ”play-pause”) and then looked for appropriate matchings with bend gesture pairs. Thus, signsrepresented gesture pairs rather than individual gestures.
The study involved 10 participants and was divided into three sessions. In Session 1, participantswere asked to define eight unique bend gesture pairs. In Session 2, participants were presented
ACM Transactions on Computer-Human Interaction, Vol. 1, No. 1, Article . Publication date: April 2018.
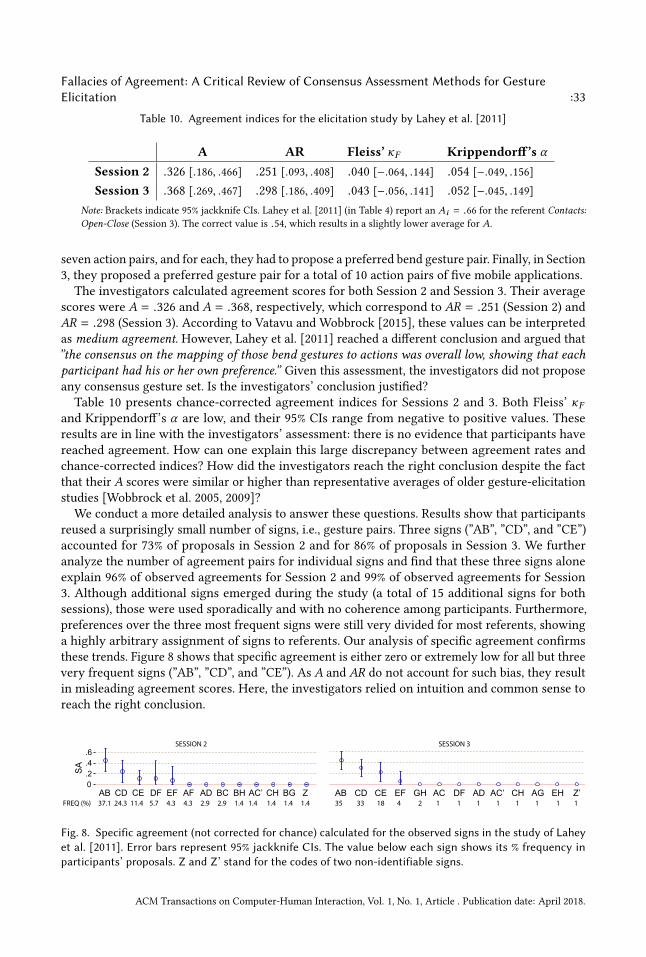
Fallacies of Agreement: A Critical Review of Consensus Assessment Methods for GestureElicitation :33
Table 10. Agreement indices for the elicitation study by Lahey et al. [2011]
A AR Fleiss’ κF Krippendorff’s αSession 2 .326 [.186, .466] .251 [.093, .408] .040 [−.064, .144] .054 [−.049, .156]Session 3 .368 [.269, .467] .298 [.186, .409] .043 [−.056, .141] .052 [−.045, .149]
Note: Brackets indicate 95% jackknife CIs. Lahey et al. [2011] (in Table 4) report an Ai = .66 for the referent Contacts:Open-Close (Session 3). The correct value is .54, which results in a slightly lower average for A.
seven action pairs, and for each, they had to propose a preferred bend gesture pair. Finally, in Section3, they proposed a preferred gesture pair for a total of 10 action pairs of five mobile applications.The investigators calculated agreement scores for both Session 2 and Session 3. Their average
scores were A = .326 and A = .368, respectively, which correspond to AR = .251 (Session 2) andAR = .298 (Session 3). According to Vatavu and Wobbrock [2015], these values can be interpretedas medium agreement. However, Lahey et al. [2011] reached a different conclusion and argued that”the consensus on the mapping of those bend gestures to actions was overall low, showing that eachparticipant had his or her own preference.” Given this assessment, the investigators did not proposeany consensus gesture set. Is the investigators’ conclusion justified?Table 10 presents chance-corrected agreement indices for Sessions 2 and 3. Both Fleiss’ κF
and Krippendorff’s α are low, and their 95% CIs range from negative to positive values. Theseresults are in line with the investigators’ assessment: there is no evidence that participants havereached agreement. How can one explain this large discrepancy between agreement rates andchance-corrected indices? How did the investigators reach the right conclusion despite the factthat their A scores were similar or higher than representative averages of older gesture-elicitationstudies [Wobbrock et al. 2005, 2009]?We conduct a more detailed analysis to answer these questions. Results show that participants
reused a surprisingly small number of signs, i.e., gesture pairs. Three signs (”AB”, ”CD”, and ”CE”)accounted for 73% of proposals in Session 2 and for 86% of proposals in Session 3. We furtheranalyze the number of agreement pairs for individual signs and find that these three signs aloneexplain 96% of observed agreements for Session 2 and 99% of observed agreements for Session3. Although additional signs emerged during the study (a total of 15 additional signs for bothsessions), those were used sporadically and with no coherence among participants. Furthermore,preferences over the three most frequent signs were still very divided for most referents, showinga highly arbitrary assignment of signs to referents. Our analysis of specific agreement confirmsthese trends. Figure 8 shows that specific agreement is either zero or extremely low for all but threevery frequent signs (”AB”, ”CD”, and ”CE”). As A and AR do not account for such bias, they resultin misleading agreement scores. Here, the investigators relied on intuition and common sense toreach the right conclusion.
0.2.4.6
AB CD CE DF EF AF AD BC BH AC’ CH BG Z
SA
AB CD CE EF GH AC DF AD AC’ CH AG EH Z’ 37.1 24.3 11.4 5.7 4.3 4.3 2.9 2.9 1.4 1.4 1.4 1.4 1.4 35 33 18 4 2 1 1 1 1 1 1 1 1 FREQ (%)
SESSION 2 SESSION 3
Fig. 8. Specific agreement (not corrected for chance) calculated for the observed signs in the study of Laheyet al. [2011]. Error bars represent 95% jackknife CIs. The value below each sign shows its % frequency inparticipants’ proposals. Z and Z’ stand for the codes of two non-identifiable signs.
ACM Transactions on Computer-Human Interaction, Vol. 1, No. 1, Article . Publication date: April 2018.
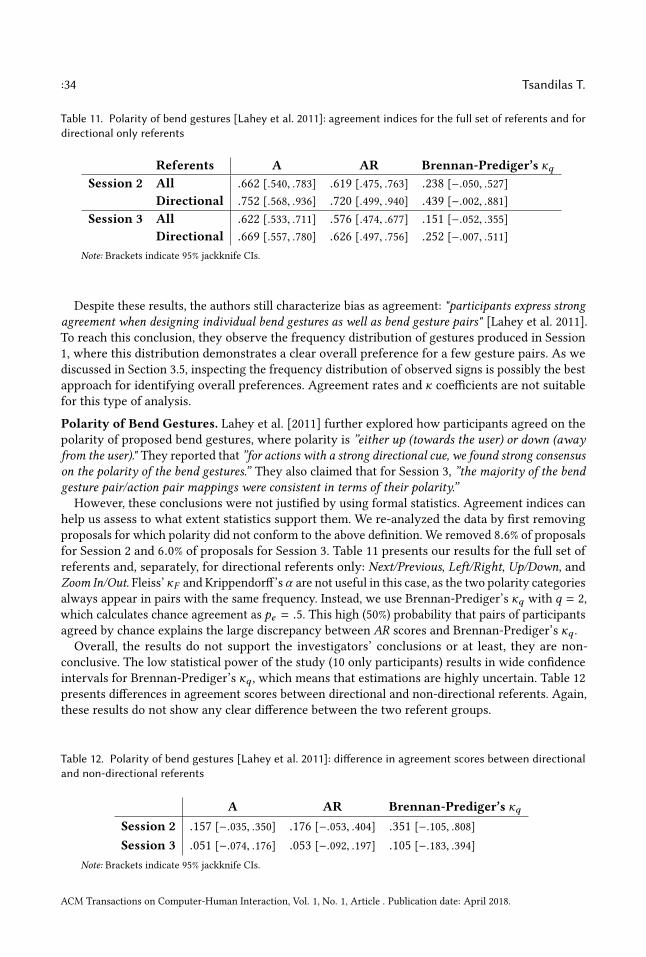
:34 Tsandilas T.
Table 11. Polarity of bend gestures [Lahey et al. 2011]: agreement indices for the full set of referents and fordirectional only referents
Referents A AR Brennan-Prediger’s κqSession 2 All .662 [.540, .783] .619 [.475, .763] .238 [−.050, .527]
Directional .752 [.568, .936] .720 [.499, .940] .439 [−.002, .881]Session 3 All .622 [.533, .711] .576 [.474, .677] .151 [−.052, .355]
Directional .669 [.557, .780] .626 [.497, .756] .252 [−.007, .511]Note: Brackets indicate 95% jackknife CIs.
Despite these results, the authors still characterize bias as agreement: "participants express strongagreement when designing individual bend gestures as well as bend gesture pairs" [Lahey et al. 2011].To reach this conclusion, they observe the frequency distribution of gestures produced in Session1, where this distribution demonstrates a clear overall preference for a few gesture pairs. As wediscussed in Section 3.5, inspecting the frequency distribution of observed signs is possibly the bestapproach for identifying overall preferences. Agreement rates and κ coefficients are not suitablefor this type of analysis.Polarity of Bend Gestures. Lahey et al. [2011] further explored how participants agreed on thepolarity of proposed bend gestures, where polarity is ”either up (towards the user) or down (awayfrom the user)." They reported that ”for actions with a strong directional cue, we found strong consensuson the polarity of the bend gestures.” They also claimed that for Session 3, ”the majority of the bendgesture pair/action pair mappings were consistent in terms of their polarity.”
However, these conclusions were not justified by using formal statistics. Agreement indices canhelp us assess to what extent statistics support them. We re-analyzed the data by first removingproposals for which polarity did not conform to the above definition. We removed 8.6% of proposalsfor Session 2 and 6.0% of proposals for Session 3. Table 11 presents our results for the full set ofreferents and, separately, for directional referents only: Next/Previous, Left/Right, Up/Down, andZoom In/Out. Fleiss’κF and Krippendorff’s α are not useful in this case, as the two polarity categoriesalways appear in pairs with the same frequency. Instead, we use Brennan-Prediger’s κq with q = 2,which calculates chance agreement as pe = .5. This high (50%) probability that pairs of participantsagreed by chance explains the large discrepancy between AR scores and Brennan-Prediger’s κq .Overall, the results do not support the investigators’ conclusions or at least, they are non-
conclusive. The low statistical power of the study (10 only participants) results in wide confidenceintervals for Brennan-Prediger’s κq , which means that estimations are highly uncertain. Table 12presents differences in agreement scores between directional and non-directional referents. Again,these results do not show any clear difference between the two referent groups.
Table 12. Polarity of bend gestures [Lahey et al. 2011]: difference in agreement scores between directionaland non-directional referents
A AR Brennan-Prediger’s κqSession 2 .157 [−.035, .350] .176 [−.053, .404] .351 [−.105, .808]Session 3 .051 [−.074, .176] .053 [−.092, .197] .105 [−.183, .394]
Note: Brackets indicate 95% jackknife CIs.
ACM Transactions on Computer-Human Interaction, Vol. 1, No. 1, Article . Publication date: April 2018.

Fallacies of Agreement: A Critical Review of Consensus Assessment Methods for GestureElicitation :35
Table 13. Agreement indices for the elicitation study by Chan et al. [2016]
A AR Fleiss’ κF Krippendorff’s α
.242 [.137, .347] .191 [.079, .304] .091 [.000, .182] .093 [.002, .183]Note: Brackets indicate 95% jackknife CIs.
7.2 Single-Hand Micro-Gestures – Chan et al. [2016]Chan et al. [2016] conducted a gesture elicitation study to explore the design of single-hand micro-gestures (SHMGs). This study is one of the first to report AR (instead of A) and to closely followthe interpretation of agreement rates proposed by Vatavu and Wobbrock [2015]. Specifically, Chanet al. [2016] reported an average AR = .191 and interpreted this value as medium agreement. Thisallowed them to define a consensus gesture set, consisting of eight unique signs for a total of 35referents. They then extended this set to 16 unique signs based on variations of those signs.
The interpretation given by Chan et al. [2016] does not consider the problem of chance agreement.During their analysis, the investigators observed that participants frequently mixed up the numberof fingers used. To deal with this issue, they separated ”gestures that used two or less fingers fromthose with three or more fingers.” By relaxing the constraints on how signs were classified as similaror different, the investigators succeeded in increasing agreement rates, as agreement now reflecteda smaller number of gesture parameters. However, as this strategy constrains the vocabulary ofactive signs, it may as well increase chance agreement.
We re-analyzed the 560 gesture proposals (16 participants × 35 referents) as identified by Chan etal. [2016]7. Table 13 presents estimates of overall agreement scores. Chance-corrected coefficientsare particularly low, while Fleiss’κF 95%CI includes zero. These agreement values are slightly higherthan ones calculated for the previous study of Lahey et al. [2011], and proponents of significancetests could argue that chance-corrected agreement is (at least marginally) significantly higher thanzero. However, statistical significance by itself provides very little information about the level ofobserved agreement. A closer look into the results of the study shows that participants tended toprefer tap-like micro-gestures for referents that represent discrete actions such as ”select single”,and swipe-like micro-gestures for referents that represent continuous actions such as ”scrolling”.Yet, apart from those two referents, results do not clearly show that participants reached consensus(see Figure 9). For example, for referents that represented discrete but directional actions, e.g.,”previous” and ”next”, preferences were highly divided between swipe and tap-like micro-gestures.7Chan et al. [2016] present a total of 35 referents but incorrectly count only 34 referents and 544 proposals. In addition, wefound 46 unique signs, instead of 47 unique signs reported in their paper.
.0
.2
.4
.6
.8
1.0
Selec
t Sing
leSc
rollin
gNex
tPr
eviou
sCut
Zoom
Out
Acce
ptPa
n OffSe
lect G
roup
Rotat
eZo
om In On
Copy
Move
Minimize
Enlar
geOpe
nVo
lume
Down
Close
Paste
Show
Men
uUnd
oPa
use
Shrin
kFin
dPl
aySt
opVo
lume
UpDele
teMax
imize
Reject
HelpSa
veMut
e
Flei
ss’ K
appa
Fig. 9. Fleiss’ κF calculated for individual referents for single-hand micro-gestures [Chan et al. 2016]. Errorbars represent 95% jackknife CIs.
ACM Transactions on Computer-Human Interaction, Vol. 1, No. 1, Article . Publication date: April 2018.

:36 Tsandilas T.
0
.2
.4
.6
SA
22.7 16.1 12.3 7.5 5.9 5.0 4.3 3.4 2.9 2.1 2.1 1.8 1.6 1.6 1.2 1.1 0.9 0.5 0.5 0.5 0.4 0.4 0.4 0.4 0.4 0.4 0.4 0.2 0.2 0.2 0.2 0.2 0.2 0.2 0.2 0.2 0.2 0.2 0.2 0.2 0.2 0.2 0.2 0.2 0.2 0.2FREQ (%)
Index: 1 2 3 4 5 6 7 8 9 10 11 12 13 14 15 16 17 18 19 20 21 22 23 24 25 26 27 28 29 30 31 32 33 34 35 36 37 38 39 40 41 42 43 44 45 46
Fig. 10. Specific agreement (not corrected for chance) for observed sign categories in the study of Chan etal. [2016]. Error bars represent 95% jackknife CIs. Signs are sorted by their frequencies.
Our analysis further indicates that there was a bias towards a small number of signs. Amongthe 46 unique signs defined by the investigators, a single sign (”tap thumb with two or lessfingers”) represented alone 23% of all proposals and accounted for 38% of all observed agreements.Moreover, the four most frequent signs represented 59% of all proposals and accounted for 82% ofall agreements. Figure 10 further shows that specific agreement is spread over a small number ofsigns. For less frequent signs, agreement is generally low, with two notable exceptions: the 12th sign(”tap two or less fingers”) and the 15th sign (”tap thumb and more than two fingers”). Agreementover these two signs is relatively high despite their low frequency. In such cases, agreement is lesslikely to have occurred by chance.
Bias towards a small number of signs can also produce conflicts. In particular, the most popularproposal for 30 out of 35 referents was within four only signs. To resolve such conflicts, theinvestigators re-examined their data to identify recurring patterns in participants’ use of individualfingers. Based on such patterns, they produced new gesture variations. This approach allowed theinvestigators to combine observations from real data and their own design skills to give a solutionto a rather complex design problem. Yet, agreement scores only partially reflect the final consensusgesture set where such variations are present. We discuss methodological issues related to theanalysis of sign vocabularies in Section 8.
7.3 On-Skin Gestures – Weigel et al. [2014]Weigel et al. [2014] conducted a gesture elicitation study to explore a vocabulary of on-skin gestures.The study investigated a large, open-ended design space that involved diverse input modalities(multitouch, grab, pull, press, scratch, shear, squeeze, twist) and several locations on the upper limb(fingers, wrist, back of the hand, palm, forearm, elbow, upper arm). 22 volunteers participated inthe study and proposed gestures for a total of 40 referents, where 33 referents represented commoncommands and seven referents represented expressions of emotions. The investigators calculatedindividual per-referent Ai agreement scores, which ranged from .08 to .69. The overall average wasA = .25, which corresponds to AR = .21. As those values were close to the ones of other relatedgesture elicitation studies [Lee et al. 2010; Wobbrock et al. 2009], Weigel et al. [2014] argued: ”scoresare comparable with those in prior work [...], despite the larger input space of our study.”
However, a larger input space does not always lead to lower chance agreement because partici-pants may disregard the extra input modalities and only agree on a small set of obvious gestures.For example, the five highest agreement scores that Weigel et al. [2014] report for commandgestures correspond to common direct-manipulation gestures dedicated to content rotation andresizing actions. As these gestures are widely available on today’s multitouch devices, the authorsacknowledge: ”these findings show that participants transferred conventional multitouch gesturesto on-skin input”. For the rest of the commands, agreement scores (Ai ) were considerably lower,with a highest value of .31, where again, agreement was largely due to the use of conventionalmultitouch gestures. Furthermore, agreement depends on the strategy that investigators follow
ACM Transactions on Computer-Human Interaction, Vol. 1, No. 1, Article . Publication date: April 2018.

Fallacies of Agreement: A Critical Review of Consensus Assessment Methods for GestureElicitation :37
Table 14. Agreement indices for the elicitation study by Weigel et al. [2014]
A AR Fleiss’ κF Krippendorff’s α
On-Body Location .328 [.252, .404] .296 [.216, .376] .004 [−.016, .024] .005 [−.015, .025]
Input Modality .336 [.297, .375] .304 [.263, .345] .119 [.085, .154] .120 [.086, .155]Note: Brackets indicate 95% jackknife CIs. A scores are not consistent with the ones reported by Weigel et al. [2014]because we follow a different approach to classify proposals into signs.
to classify gesture descriptions to signs. The higher the granularity of the classification process,the harder it is to reach agreement, since participants need to agree on a larger number of gestureparameters. Our following analysis attempts to account for these issues.Weigel et al. [2014] identify three dimensions that describe an on-skin gesture: (i) the body
location on which the gesture takes place, e.g., fingers, palm, and forearm, (ii) its input modality,e.g., multitouch, grab, and twist, and (iii) other gesture properties, e.g., number of fingers, direction,and movement dynamics.On-Body Location.We first investigate if participants agreed on the on-body location of gesturesby considering eight basic locations (upper arm, elbow, forearm, back of the hand, palm, fingers,wrist, and shoulder), as well as combinations of multiple locations (e.g., palm + fingers). Afterinspecting Fleiss’ κF and Krippendorff’s α in Table 14, we conclude that participants did not reachconsensus. Again, the A and AR indices provide very misleading information about the level ofintrinsic agreement.Input Modality + Other Gesture Properties. The original agreement analysis of Weigel etal. [2014] disregarded the on-body gesture location and focused on the input modality of the gesturein combination with individual gesture properties. For example, all the ”pinch” gestures wereclassified as identical, regardless of whether they were executed on the palm or the forearm. Toassess if different gesture proposals belonged to the same unique sign, the investigators consideredvarious movement properties, such as the gesture direction or its force and intensity, e.g., tappingwith force versus tapping gently. However, other properties, such as the number of fingers, weregenerally not considered. Unfortunately, the classification strategy that the investigators followedis not fully known.For our analysis, we relied on textual gesture descriptions, i.e., textual tags provided by the
authors in a spreadsheet. These textual tags were used by the investigators to describe individualgesture proposals. They principally represent input modalities, but for some modalities, the touchmodality in particular, they describe additional variations. Representative examples of such tags are:tap, slide, slide/swipe, poke, scratch, squeeze+shake, tap+twist, etc. We extracted these tags directlyfrom the spreadsheet and handled them as signs. Unfortunately, these signs do not coincide withthe actual signs considered by the investigators to calculate agreement. As a result, our analysisdoes not reproduce the actual agreement scores reported by Weigel et al. [2014].
Overall, we counted 65 unique signs, but only 21 of those signs had at least one agreement. Table 14(Input Modality) presents agreement scores calculated over the full set of referents. Interestingly, ouraverageA is considerably higher than the one (A = .25) reported by Weigel et al. [2014]. The reasonis that our gesture classification is less stringent, causing agreement to happen more easily. At thesame time, this approach increases the probability of agreement by chance, which explains the largediscrepancy between the overall agreement rate and chance-corrected coefficients. A more detailedanalysis shows that the slide sign alone represented 43% of all proposals and was responsible for80% of all observed agreements. Tap was the second most popular sign (14%), while twist was
ACM Transactions on Computer-Human Interaction, Vol. 1, No. 1, Article . Publication date: April 2018.
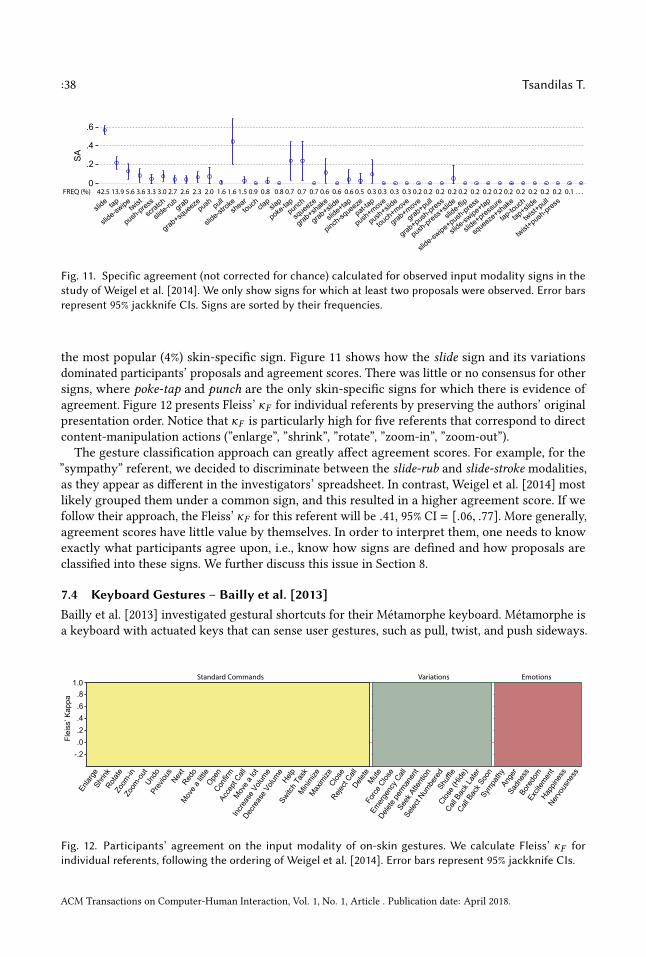
:38 Tsandilas T.
0
.2
.4
.6
slide tap
slide-sw
ipetwist
push-press
scratch
slide-ru
bgrab
grab+squeeze
push pull
slide-st
rokesh
eartouch cla
psla
p
poke-ta
ppunch
squeeze
grab+shake
grab+slide
slide+tap
pinch-sq
ueezepat-ta
p
push+move
push+slid
e
touch+move
grab+move
grab+pull
grab+push-press
push-press+
slide
slide-fli
p
slide-sw
ipe+push-press
slide-sw
ipe+tap
slide+pressu
re
squeeze
+shake
tap-touch
tap+slide
twist+pull
twist+push
-press
SA
FREQ (%) 42.5 13.9 5.6 3.6 3.3 3.0 2.7 2.6 2.3 2.0 1.6 1.6 1.5 0.9 0.8 0.8 0.7 0.7 0.7 0.6 0.6 0.6 0.5 0.3 0.3 0.3 0.3 0.2 0.2 0.2 0.2 0.2 0.2 0.2 0.2 0.2 0.2 0.2 0.2 0.2 0.1 . . .
Fig. 11. Specific agreement (not corrected for chance) calculated for observed input modality signs in thestudy of Weigel et al. [2014]. We only show signs for which at least two proposals were observed. Error barsrepresent 95% jackknife CIs. Signs are sorted by their frequencies.
the most popular (4%) skin-specific sign. Figure 11 shows how the slide sign and its variationsdominated participants’ proposals and agreement scores. There was little or no consensus for othersigns, where poke-tap and punch are the only skin-specific signs for which there is evidence ofagreement. Figure 12 presents Fleiss’ κF for individual referents by preserving the authors’ originalpresentation order. Notice that κF is particularly high for five referents that correspond to directcontent-manipulation actions (”enlarge”, ”shrink”, ”rotate”, ”zoom-in”, ”zoom-out”).The gesture classification approach can greatly affect agreement scores. For example, for the
”sympathy” referent, we decided to discriminate between the slide-rub and slide-stroke modalities,as they appear as different in the investigators’ spreadsheet. In contrast, Weigel et al. [2014] mostlikely grouped them under a common sign, and this resulted in a higher agreement score. If wefollow their approach, the Fleiss’ κF for this referent will be .41, 95% CI = [.06, .77]. More generally,agreement scores have little value by themselves. In order to interpret them, one needs to knowexactly what participants agree upon, i.e., know how signs are defined and how proposals areclassified into these signs. We further discuss this issue in Section 8.
7.4 Keyboard Gestures – Bailly et al. [2013]Bailly et al. [2013] investigated gestural shortcuts for their Métamorphe keyboard. Métamorphe isa keyboard with actuated keys that can sense user gestures, such as pull, twist, and push sideways.
-.2.0.2.4.6.8
1.0
Enlar
geSh
rink
Rotat
eZo
om-in
Zoom
-out
Undo
Prev
ious
Next
Redo
Move
a litt
leOpe
nCon
firmAc
cept
Call
Move
a lot
Incre
ase
Volum
e
Decre
ase
Volum
eHelp
Switc
h Ta
skMini
mizeMax
imize
Close
Reject
CallDele
teMut
eFo
rce C
lose
Emer
genc
y Call
Delete
per
manen
t
Seek
Atte
ntion
Selec
t Num
bere
dSh
uffle
Close
(Hide
)
Call B
ack L
ater
Call B
ack S
oon
Sympa
thy
Ange
rSa
dnes
sBo
redo
mEx
citem
ent
Happin
ess
Nervo
usne
ss
Flei
ss’ K
appa
Standard Commands Variations Emotions
Fig. 12. Participants’ agreement on the input modality of on-skin gestures. We calculate Fleiss’ κF forindividual referents, following the ordering of Weigel et al. [2014]. Error bars represent 95% jackknife CIs.
ACM Transactions on Computer-Human Interaction, Vol. 1, No. 1, Article . Publication date: April 2018.

Fallacies of Agreement: A Critical Review of Consensus Assessment Methods for GestureElicitation :39
Table 15. Agreement indices for the elicitation study by Bailly et al. [2013]
A AR Fleiss’ κF Krippendorff’s α
Keys .320 [.213, .427] .284 [.172, .397] .260 [.148, .371] .261 [.149, .372]
Gestures .370 [.323, .417] .336 [.287, .386] .240 [.192, .289] .241 [.193, .289]Note: Brackets indicate 95% jackknife CIs.
The study was later re-analyzed by Vatavu and Wobbrock [2015; 2016], thus it provides a goodbasis for comparisons.In this study, 20 participants suggested a keyboard shortcut for 42 referents on a Métamorphe
mockup. Proposing a shortcut required choosing (i) a key and (ii) the gesture applied to the key.Bailly et al. [2013] treated shortcuts as a whole but also analyzed keys and gestures separately.Here, we analyze keys and gestures separately. Participants produced a total of 71 different signsfor keys and 27 different signs for gestures.8
Table 15 shows overall agreement scores for keys and for gestures. An investigator who uses theA or AR measures may infer that participants’ consensus was higher for gestures than for keys.However, chance-corrected coefficients reveal that this difference is most likely due to chanceagreement. As the number of signs was lower for gestures than for keys and participants exhibited astrong bias for the “top push” sign, agreement was more likely to occur by chance. Overall, the “toppush” sign represented 28% of proposals and was alone responsible for 37% of observed agreements.Figure 13 presents the specific agreement for individual gestures. Although the ”top push” signdominated participants’ proposals, the distribution of specific agreement is more uniform acrosssigns than in our previous case studies. Furthermore, the evidence that agreement is above zero ishigh for most signs of interest. These trends explain the higher chance-corrected agreement scoresthat we found for this study.We can also use confidence intervals to back up the authors’ claim on the effect of directional
referents on agreement: “highly directional commands [...] tended to have a high gesture agree-ment” [Bailly et al. 2013]. The difference in Fleiss’ κF between the eight directional referentscontaining the terms top, bottom, left, right, previous or next and all other referents is ∆κF = .41,95% CI = [.24, .58], so the evidence supporting this claim is overwhelming.8Bailly et al. [2013] considered only 15 signs for gestures by grouping uncommon signs into “combo” and “other”. We keptall 27 signs to be consistent with the analysis of Vatavu and Wobbrock [2015], but results are very similar.
0.2.4.6.8
top push
push away
push le
ftpull
push to
right
push to
wards
CCW rotatio
n
CW rotatio
n
front-b
ack sq
ueeze
left-right s
queeze
directio
nal
CW/CCW rotatio
n
left/right p
ush
SA
28.1 8.8 8.8 8.7 8.2 7.9 5.7 5.1 4.2 4.2 3.5 2.5 1.7 0.6 0.4 0.2 0.2 0.2 0.1 0.1 0.1 0.1 0.1 0.1 0.1 0.1 0.1FREQ (%)other signs...
double top push
Fig. 13. Specific agreement (not corrected for chance) for the observed signs of key gestures in the study ofBailly et al. [2013]. Error bars represent 95% jackknife CIs. Signs are sorted by their frequencies.
ACM Transactions on Computer-Human Interaction, Vol. 1, No. 1, Article . Publication date: April 2018.

:40 Tsandilas T.
Women vs. Men. Bailly et al. [2013] collected proposals from 11 women and 9 men. Vatavu andWobbrock [2016] reanalyzed their dataset to test differences in agreement between genders butobserved similar overall agreement rates between women and men (.353 vs. .322). If we use Fleiss’κF to estimate this difference, we find that ∆κF = .06, 95% CI = [−.11, .16], where we use thebootstrap method to construct the confidence interval. Vatavu and Wobbrock [2016] continuedtheir analysis and used the Vb statistic to compare agreement differences between genders forindividual referents. They found9 ”significant differences (p < .05) for 7 referents.” Based on thisfinding, they concluded: ”these results show that women and men reach consensus over gestures indifferent ways that depend on the nature of the referent [...]”We showed, however, that the Type I error rate of the Vb test is unacceptably high (see Section
6), thus such differences may be random, rather than the result of a gender effect. To verify theconclusion of Vatavu and Wobbrock [2016], we run a simulation experiment over the originaldataset of Bailly et al. [2013]. The experiment draws inspiration from permutation tests [Hesterberget al. 2005]. It evaluates theVb test on participant groups that are randomly chosen from the pool of
20 participants of the original study. There are(209
)= 167960 ways to partition 20 participants into
two independent groups of 9 and 11 participants. Since testing all these partitions can be extremelylong, we randomly create 1000 such partitions. We then apply the Vb test to each random partitionand count the number of referents for which the difference between the AR of the two groups issignificantly different than zero (α = .05).
The results confirm our concerns. The mean number of referents per partition for which the nullhypothesis is rejected is 8.8 (sd = 2.6). Therefore, the 7 referents that Vatavu and Wobbrock [2016]report when comparing agreement between women and men is a well-expected result, below theaverage number of significant differences observed for fully random partitions. The Type I errorrate of the Vb test for this dataset can be estimated as 8.8/42 = .21, which is again very high, morethan four times higher than its nominal value.
For comparison purposes, we re-evaluate the bootstrap method with the exact same procedure.10We produce 95% confidence intervals by using 3000 bootstrap samples, and for each confidenceinterval, we reject the null hypothesis if the interval does not include zero (α = .05). The meannumber of referents per partition for which the method rejects the null hypothesis is 1.94, whichgives a Type I error rate of 1.94/42 = .046. This error rate is very close to the one we found inExperiment 6.8 and further confirms the good behavior of the bootstrap method.
Can we then use the method to test gender differences for individual referents? We discouragesuch practices for several reasons. Making comparisons between women and men was out of thescope of the original study of Bailly et al. [2013]. The size of the two groups was particularly low,while the study did not control for confounding variables, such as computer skills or experiencewith novel input devices, which might highly correlate with gender. We argue against makingunplanned post-hoc comparisons over uncontrolled samples of such small sizes, as those can resultin misleading conclusions. Furthermore, jackknife and bootstrap confidence intervals for individualreferents may not be precise, especially when sample sizes are low. As a result, using them to testsuch hypotheses may not be appropriate.
7.5 Synthesis of FindingsResults from the four case studies confirm that the AR index is problematic. In several cases, itprovides misleading information about the level of consensus reached by participants. Table 169Vatavu and Wobbrock [2016] did not account for multiple comparisons for this case study.10Notice that in Experiment 6.8, we applied fewer iterations to evaluate the bootstrap method because calculating κ isconsiderably slower than calculating AR , which is the case here.
ACM Transactions on Computer-Human Interaction, Vol. 1, No. 1, Article . Publication date: April 2018.

Fallacies of Agreement: A Critical Review of Consensus Assessment Methods for GestureElicitation :41
Table 16. Summary of agreement scores for all four case studies
Case Study A AR Fleiss’ κ Krippendorff’s α
Lahey et al. [2011] .326 [.186, .466] .251 [.093, .408] .040 [−.064, .144] .054 [−.049, .156].368 [.269, .467] .298 [.186, .409] .043 [−.056, .141] .052 [−.045, .149]
Chan et al. [2016] .242 [.137, .347] .191 [.079, .304] .091 [.000, .182] .093 [.002, .183]
Weigel et al. [2014] .328 [.252, .404] .296 [.216, .376] .004 [−.016, .024] .005 [−.015, .025].336 [.297, .375] .304 [.263, .345] .119 [.085, .154] .120 [.086, .155]
Bailly et al. [2013] .320 [.213, .427] .284 [.172, .397] .260 [.148, .371] .261 [.149, .372].370 [.323, .417] .336 [.287, .386] .240 [.192, .289] .241 [.193, .289]
Note: Brackets indicate 95% jackknife CIs.
combines the results of Tables 10, 13, 14, and 15. We observe that similar AR scores can result invery different chance-corrected values.
The source of such discrepancies is the difference in size of different sign vocabularies or,more generally, bias in the frequency distribution of signs. Figure 14 presents the observed biasdistribution for each study. For each bias distribution, the figure also presents our closest modelof bias based on a Zipf-Mandelbrot or a half-normal probability distribution (see Section 3.2). Weexperimentally determined the bias parameters (B or sd) of these functions such that the chanceagreement they produce approximates Fleiss’ pe . Notice that chance agreement can be particularly
01020304050
01020304050
01020304050
01020304050
01020304050
01020304050
prob
abili
ty (%
)pr
obab
ility
(%)
prob
abili
ty (%
)
prob
abili
ty (%
)pr
obab
ility
(%)
prob
abili
ty (%
)
Lahey et al. [2011] - Session 2 Lahey et al. [2011] - Session 3
Chan et al. [2016] Weigel et al. [2014]
Bailly et al. [2013] - Gestures Bailly et al. [2013] - Keys
pe = .22 pe=.27
pe=.11 pe=.21
pe=.13 pe=.03
Zipf-Mandelbrot, B =.712
Zipf-Mandelbrot, B =.341
Zipf-Mandelbrot, B =.390
Zipf-Mandelbrot, B =.679
Zipf-Mandelbrot, B =.100
Half-Normal, sd =1.87
modelobserved
Fig. 14. Observed bias distributions (in orange) for our four case studies. In blue, we show the closest modelof bias distribution (Zipf-Mandelbrot or discrete half-normal) by choosing the bias parameter (B or sd) withrespect to the observed chance agreement pe . We only show the 12 most frequent signs (k = 1, 2..12) – thecontribution of additional signs to chance agreement can be considered as negligible.
ACM Transactions on Computer-Human Interaction, Vol. 1, No. 1, Article . Publication date: April 2018.

:42 Tsandilas T.
high. For example, chance agreement is over 20% for the studies of Lahey et al. [2011] and Weigelet al. [2014]. In contrast, bias for keys was very low in the study of Bailly et al. [2013]. Chanceagreement was very low (pe = .03) in this case, despite the fact that the number of keys in a physicalkeyboard is hard-constrained.We already discussed that bias may reveal overall preferences over highly usable gestures and
help investigators disregard gestures that participants seem to avoid. For example, Lahey et al. [2011]did not find clear mappings between referents and signs, but the study helped them identify strongpreferences for a small set of bend-gesture pairs. In other cases, bias may not be a desired artifact.In the study of Weigel et al. [2014], participants’ proposals were highly dominated by signs thatcorrespond to common multi-touch gestures, thus bias was partly due to legacy bias [Morris et al.2014]. Finally, in the study of Bailly et al. [2013], bias was largely due to the frequent use of theobvious ”top push” as a default sign, which might have happened when participants could notthink of meaningful associations between commands and key gestures.
Regardless of the source of bias, chance-corrected agreement indices allow researchers to isolateits effect on agreement and analyze it independently from agreement that considers the semanticsof referents. When participants cannot differentiate among referents, so clear mappings betweensigns and referents do not emerge, chance-corrected agreement is expected to be low. In such cases,it may be wiser to investigate gesture customization approaches [Oh and Findlater 2013], insteadof insisting on unique mappings that cannot be characterized as ”user-defined.”
In addition to bias, we analyze how sign preferences are distributed in the proposals of individualreferents in all four studies. To this end, we collect proposals for a total of 156 referents. For thestudy of Bailly et al. [2013], we count proposals for both gestures and keys. For the study of Laheyet al. [2011], we count proposals for both Session 2 and Session 3. We then group referents into fourranges of agreement according to their observed agreement rate ARi , where ARi ∈ [.1, .3], [.3, .5],[.5, .7] or [.7, .9]. For each referent, we rank the proposed signs based on their relative frequenciesand then aggregate these frequencies over all the referents of each agreement range to produce anoverall probability distribution of sign preferences (see Section 6.1).
Figure 15 summarizes our results, where for each observed distribution, we also show the Zipf-Mandelbrot model that approximates the mean ARi of the group. The bottom part of the figureshows the same distributions with log-log plots. Such plots are commonly used to illustrate howwell observed frequencies follow a power-law model [Newman 2005]. Although we only vary asingle model parameter, the observed sign frequencies are generally close to our Zipf-Mandelbrotmodels. This is clearer for the highest frequency ranks that dominate agreement. We acknowledgethat the probability estimation for lower ranks is more noisy and uncertain, but the contribution ofrare signs to agreement is negligible. More precise power-law models require the analysis of largerparticipant samples. This is out of the scope of this article, but it is an interesting future direction.
8 METHODOLOGICAL ISSUESAgreement largely depends on the process investigators follow to classify participant proposals.This process requires first defining a sign vocabulary and then using this vocabulary to classifyobserved gestures. We discuss methodological issues that HCI researchers should consider whenthey carry out these tasks.
8.1 Defining a Sign VocabularyAn agreement value cannot be interpreted unless a clear frame of reference is provided becauseone needs to know what participants agree upon. Therefore, sign vocabularies need to be welldefined, e.g., through an identity or a similarity measure that clearly determines if any two gesturedescriptions belong to the same or two distinct signs.
ACM Transactions on Computer-Human Interaction, Vol. 1, No. 1, Article . Publication date: April 2018.
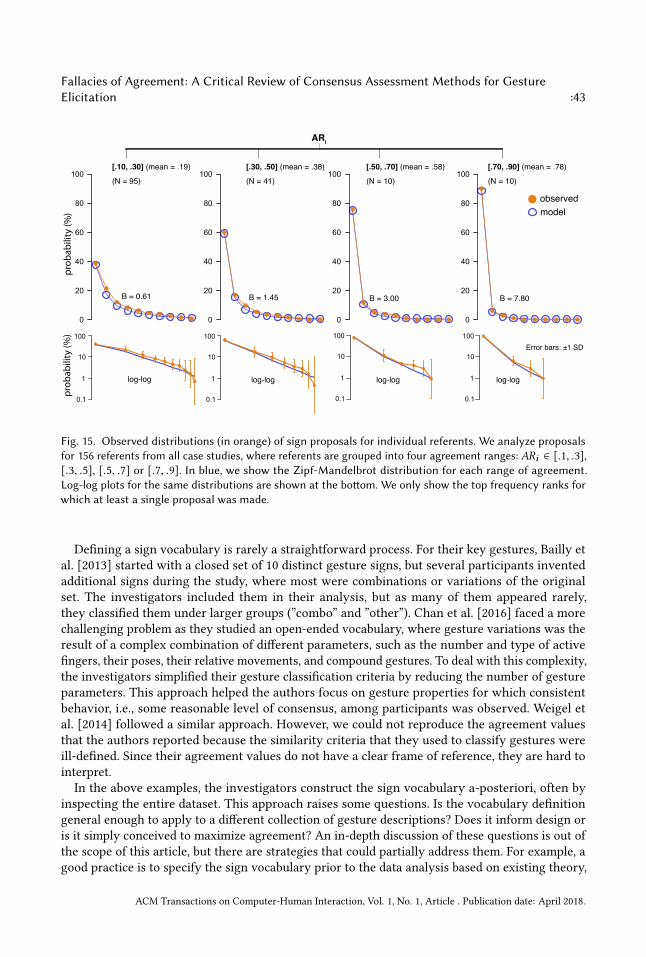
Fallacies of Agreement: A Critical Review of Consensus Assessment Methods for GestureElicitation :43
0
20
40
60
80
100
0
20
40
60
80
100
0
20
40
60
80
100
0
20
40
60
80
100
prob
abili
ty (%
)
[.10, .30] (mean = .19)
(N = 95)
[.30, .50] (mean = .38)
(N = 41)
[.50, .70] (mean = .58)
(N = 10)
[.70, .90] (mean = .78)
(N = 10)
B = 0.61 B = 1.45 B = 3.00 B = 7.80
modelobserved
ARi
0.1
1
10
100
0.1
1
10
100
0.1
1
10
100
0.1
1
10
100
log-log log-log log-log log-log
Error bars: ±1 SD
prob
abili
ty (%
)
Fig. 15. Observed distributions (in orange) of sign proposals for individual referents. We analyze proposalsfor 156 referents from all case studies, where referents are grouped into four agreement ranges: ARi ∈ [.1, .3],[.3, .5], [.5, .7] or [.7, .9]. In blue, we show the Zipf-Mandelbrot distribution for each range of agreement.Log-log plots for the same distributions are shown at the bottom. We only show the top frequency ranks forwhich at least a single proposal was made.
Defining a sign vocabulary is rarely a straightforward process. For their key gestures, Bailly etal. [2013] started with a closed set of 10 distinct gesture signs, but several participants inventedadditional signs during the study, where most were combinations or variations of the originalset. The investigators included them in their analysis, but as many of them appeared rarely,they classified them under larger groups (”combo” and ”other”). Chan et al. [2016] faced a morechallenging problem as they studied an open-ended vocabulary, where gesture variations was theresult of a complex combination of different parameters, such as the number and type of activefingers, their poses, their relative movements, and compound gestures. To deal with this complexity,the investigators simplified their gesture classification criteria by reducing the number of gestureparameters. This approach helped the authors focus on gesture properties for which consistentbehavior, i.e., some reasonable level of consensus, among participants was observed. Weigel etal. [2014] followed a similar approach. However, we could not reproduce the agreement valuesthat the authors reported because the similarity criteria that they used to classify gestures wereill-defined. Since their agreement values do not have a clear frame of reference, they are hard tointerpret.In the above examples, the investigators construct the sign vocabulary a-posteriori, often by
inspecting the entire dataset. This approach raises some questions. Is the vocabulary definitiongeneral enough to apply to a different collection of gesture descriptions? Does it inform design oris it simply conceived to maximize agreement? An in-depth discussion of these questions is out ofthe scope of this article, but there are strategies that could partially address them. For example, agood practice is to specify the sign vocabulary prior to the data analysis based on existing theory,
ACM Transactions on Computer-Human Interaction, Vol. 1, No. 1, Article . Publication date: April 2018.

:44 Tsandilas T.
previous evidence, or pilot studies. Creating a gesture taxonomy [Wobbrock et al. 2009] to explorethe design space of possible gestures and identify their dimensions and categories could help to thisdirection. Another strategy is to assign the task to multiple investigators or ask external experts toverify the sign definition approach.
Finally, we recommend that investigators inspect gesture descriptions in a random order byhiding their referents. Given this approach, any bias in the sign-definition and classification processwill appear as overall referent-independent bias, and chance-corrected indices will eliminate itseffect on agreement. The approach may also discourage data-analysis strategies that artificiallyoptimize agreement.
8.2 Classifying Participants’ Proposals into SignsGesture classification is typically performed by humans. Since this process can rely on subjectivecriteria, its reliability needs to be verified. In the previous sections, we investigated agreementindices for assessing consensus among participants. However, the exact same indices can be usedto verify the reliability of gesture classification results. We explain the approach with our fictitiousstudy on user-elicited grasps (see Section 2). Imagine that three independent coders review thevideo recordings of a random sample of 10 grasp proposals (G1 – G10) and classify them into uniquesigns. Suppose Table 17 summarizes their results.
To verify the reliability of this classification, we assess how the three coders agree with each other.To this end, we calculate Fleiss’ κF : the percent agreement is pa = .733, the chance agreement ispe = .291, and therefore,κF = .624. ThisκF value is a measure of reliability. A low score may requirethe investigators to update their sign definitions and rerun the classification process. For example,the investigators may decide to group the signs ”D” and ”E” together because distinguishing betweenthem seems to be difficult or highly random.Notice that κF is calculated over the exact same sign vocabulary that we used to calculate
agreement among the participants of the study (see Table 1). As before, one may assume aninfinite vocabulary of signs (q → ∞) from which coders choose, and bias has the exact sameeffect on chance agreement. Here, the role of chance-corrected coefficients is to ensure that codersdifferentiate among cases – they do not simply assign the most prevalent signs in random. However,the assumptions for constructing the confidence interval of an agreement index are now different.Coders are shown gesture descriptions (not referents), and those should not be considered as fixed.For a detailed explanation of how to construct confidence intervals in this case, we refer the readerto Gwet’s [2014] handbook.
Table 17. Verifying the reliability of the data analysis for our fictitious study on grasps
G1 G2 G3 G4 G5 G6 G7 G8 G9 G10 Total
A 0 0 0 0 0 0 0 0 0 0 0B 3 0 3 0 0 0 0 3 0 2 11C 0 3 0 0 3 0 3 0 0 1 10D 0 0 0 2 0 1 0 0 2 0 5E 0 0 0 1 0 2 0 0 1 0 4
Note: Three independent coders classify a sample of 10 random grasp descriptions (G1 – G10) through video analysis.Each cell gives the number of coders who classify a grasp into a specific sign. For those 10 grasp descriptions, the threecoders have made use of four unique signs (”B”, ”C”, ”D”, ”E”).
ACM Transactions on Computer-Human Interaction, Vol. 1, No. 1, Article . Publication date: April 2018.

Fallacies of Agreement: A Critical Review of Consensus Assessment Methods for GestureElicitation :45
Gesture elicitation studies that have used κ coefficients to verify the reliability of their gestureclassification results, either fully or for part of their analysis, include the studies of Micire etal. [2009], Gleeson et al. [2013], Weigel et al. [2014], and Troiano et al. [2014]. Classifying proposalsto signs can be especially tedious and time-consuming, but previous work [Grijincu et al. 2014] hasdeveloped crowdsourcing methods to facilitate this task.
9 LIMITATIONS AND FUTUREWORKThere are issues that this article has not addressed. We discuss limitations of our analysis andidentify directions for future work.
9.1 Complex Gesture Elicitation DesignsGesture elicitation can employ complex design features that are not well supported by the statisticsthat we discussed in this article. For example, previous work [Morris 2012] has examined experi-mental protocols that allow participants to propose multiple gestures per referent. Such designsare not unique to gesture elicitation. For example, Gwet [2014] discusses similar scenarios in thefield of medical coding, where coders assign multiple codes to each item, sometimes by order ofpriority. In these scenarios, inter-coder agreement can be assessed by re-organizing the data andusing weighted κ coefficients [Gwet 2014], where weights express varying degrees of agreement ordisagreement. Gwet [2014] also discusses indices that measure agreement with respect to a goldstandard. In the context of gesture elicitation, such indices could be used to assess how participants’proposals agree with a state-of-the-art vocabulary or, alternatively, with a vocabulary specified bya design expert.
Other study designs may violate certain assumptions of standard agreement indices. In particular,the use of non-overlapping gestures sets and semantic grouping [Bailly et al. 2013; Piumsomboonet al. 2013] may affect the way chance agreement is estimated, as the gestures proposed by par-ticipants for different referents may not be assumed as independent. Future work needs to studyalternative probabilistic models that account for inter-referent relationships and constraints.
9.2 Symbolic Gestures vs. Direct-Manipulation ActionsThe four gesture elicitation studies that we reanalyzed focus on vocabularies of symbolic or abstractgestures, which usually serve as shortcuts to discrete, non-contextual operations. However, severalstudies [Piumsomboon et al. 2013; Wobbrock et al. 2009] have investigated contextual, direct-manipulation gestures. In such studies, the problem of chance agreement may be lower becausedirect-manipulation operations such as selection, manipulation, and transformation, have uniqueconstraints (e.g., continuous vs. discrete control and spatial constraints), which may make bias andconflicts across different referents less likely to happen.
This hypothesis remains to be verified. Although Piumsomboon et al. [2013] provided access totheir gesture classification spreadsheet, we could not use it to assess chance-corrected (or specific)agreement. The reason is that their classification approach compares gestures on a per-referentbasis but does not result in a common sign vocabulary for all referents. Since gestures are notcomparable for similarity across referents, we cannot produce a contingency table as in Table 2 tocompute chance-corrected (Equation 5) or specific agreement (Equation 6).
9.3 Characterizing Low or High AgreementThe article does not provide any guidelines about which levels of chance-corrected agreementcan be considered as high or low. We acknowledge, however, that interaction designers and HCIresearchers may need to use such guidelines in order to take concrete design decisions. For example,which levels of κ justify the definition of user-defined mappings between referents and signs? When
ACM Transactions on Computer-Human Interaction, Vol. 1, No. 1, Article . Publication date: April 2018.

:46 Tsandilas T.
should designers opt for a customization-based approach? Unfortunately, these questions requirefurther research effort and a more systematic evaluation of the costs and benefits of user-definedgestures (e.g., see the study by Morris et al. [2010]) under various agreement levels. We thus leavethis direction as future work.
10 CONCLUSIONSWe reviewed statistical methods for agreement assessment in gesture elicitation studies. We investi-gated three major questions: (i) how to measure agreement; (ii) how to interpret agreement values;and (iii) how to support statistical inference. Our conclusions can be summarized as follows:
• The agreement rate AR [Vatavu and Wobbrock 2015] and its approximation A [Wobbrocket al. 2005] do not account for chance agreement and can lead to overoptimistic conclusionsabout the true level of consensus reached by participants. We recommend the use of AR incombination with Fleiss’ κF or Krippendorff’s α . These indices can be complemented withindices of agreement specific to signs [Spitzer and Fleiss 1974; Uebersax 1982]. A carefulanalysis of the observed bias distribution is also highly recommended.• The recommendations of Vatavu and Wobbrock [2015] for assessing the magnitude of agree-ment rates can lead authors to incorrectly interpret their agreement scores. Unfortunately,objective measures for assessing what levels of agreement are high, or sufficient to justify theselection of user-defined gesture vocabularies do not currently exist. This is a challengingfuture direction.• The Vrd and Vb significance tests [Vatavu and Wobbrock 2015, 2016] rely on problematicprobabilistic assumptions and yield extremely high Type I error rates. We recommend insteadthe use of confidence intervals for estimation and hypothesis testing. Confidence intervalscan be constructed with well-known jackknifing and bootstrapping methods.
In addition to the above questions, we discussed methodological issues concerning the gestureclassification process. Gesture elicitation studies are extremely useful but can be complex to setup and analyze. The proper methodology that can ensure reliability and scientific rigor largelyremains to be developed. To this end, the HCI community can gain a lot by considering lessonslearned in other disciplines where similar issues have been addressed, instead of attempting todevelop its own solutions in isolation.
ACKNOWLEDGMENTSCompleting this workwould not be possible without the help of Pierre Dragicevic, who has dedicatedsignificant time and effort into long discussions and has contributed both R code and textual content.The present article is partly based on our technical report [Tsandilas and Dragicevic 2016]. I wouldalso like to thank Gilles Bailly, Edwin Chan, Audrey Girouard, Thammathip Piumsomboon, MartinWeigel, and their supervisors or co-authors for sharing their data with us and allowing us toreanalyze their results. I am also grateful to Gilles Bailly for his feedback on an earlier version ofthis article, to Anastasia Bezerianos for many insightful comments, and to Wendy Mackay andMichel Beaudouin-Lafon for their advice.
REFERENCESRon Artstein and Massimo Poesio. 2008. Inter-Coder Agreement for Computational Linguistics. Computational Linguistics
34, 4 (2008), 555–596.Thomas Baguley. 2012. Serious Stats: A guide to advanced statistics for the behavioral sciences. Palgrave Macmillan.
https://books.google.fr/books?id=ObUcBQAAQBAJ
ACM Transactions on Computer-Human Interaction, Vol. 1, No. 1, Article . Publication date: April 2018.

Fallacies of Agreement: A Critical Review of Consensus Assessment Methods for GestureElicitation :47
Gilles Bailly, Thomas Pietrzak, Jonathan Deber, and Daniel J. Wigdor. 2013. Métamorphe: Augmenting Hotkey Usage withActuated Keys. In Proceedings of the SIGCHI Conference on Human Factors in Computing Systems (CHI ’13). ACM, NewYork, NY, USA, 563–572. DOI:http://dx.doi.org/10.1145/2470654.2470734
Adrien Bousseau, Theophanis Tsandilas, Lora Oehlberg, and Wendy E. Mackay. 2016. How Novices Sketch and PrototypeHand-Fabricated Objects. In Proceedings of the 2016 CHI Conference on Human Factors in Computing Systems (CHI ’16).ACM, New York, NY, USA, 397–408. DOI:http://dx.doi.org/10.1145/2858036.2858159
Robert L. Brennan and Dale J. Prediger. 1981. Coefficient kappa: Some uses, misuses, and alternatives. Educational andpsychological measurement 41, 3 (1981), 687–699.
James Carpenter and John Bithell. 2000. Bootstrap confidence intervals: when, which, what? A practical guide for medicalstatisticians. Statistics in Medicine 19, 9 (2000), 1141–1164. DOI:http://dx.doi.org/10.1002/(SICI)1097-0258(20000515)19:9<1141::AID-SIM479>3.0.CO;2-F
Edwin Chan, Teddy Seyed, Wolfgang Stuerzlinger, Xing-Dong Yang, and Frank Maurer. 2016. User Elicitation on Single-hand Microgestures. In Conference on Human Factors in Computing Systems (CHI). ACM, San Jose, United States. DOI:http://dx.doi.org/10.1145/2858036.2858589
Helena Chmura Kraemer, Vyjeyanthi S. Periyakoil, and Art Noda. 2002. Kappa coefficients in medical research. Statistics inMedicine 21, 14 (2002), 2109–2129. DOI:http://dx.doi.org/10.1002/sim.1180
Domenic V. Cicchetti and Alvan R. Feinstein. 1990. High agreement but low kappa: II. Resolving the paradoxes. Journal ofClinical Epidemiology 43, 6 (1990), 551 – 558. DOI:http://dx.doi.org/10.1016/0895-4356(90)90159-M
William. G. Cochran. 1950. The Comparison of Percentages in Matched Samples. Biometrika 37, 3-4 (1950), 256–266. DOI:http://dx.doi.org/10.1093/biomet/37.3-4.256
Andy Cockburn, Carl Gutwin, and Saul Greenberg. 2007. A Predictive Model of Menu Performance. In Proceedings ofthe SIGCHI Conference on Human Factors in Computing Systems (CHI ’07). ACM, New York, NY, USA, 627–636. DOI:http://dx.doi.org/10.1145/1240624.1240723
Jacob Cohen. 1960. A Coefficient of Agreement for Nominal Scales. Educational and Psychological Measurement 20, 1 (1960),37.
Jennifer Culbertson, Paul Smolensky, and Géraldine Legendre. 2012. Learning biases predict a word order universal.Cognition 122, 3 (2012), 306 – 329. DOI:http://dx.doi.org/10.1016/j.cognition.2011.10.017
Amy Deep-Soboslay, Mayada Akil, Catherine E. Martin, Llewelyn B. Bigelow, Mary M. Herman, Thomas M. Hyde, andJoel E. Kleinman. 2005. Reliability of psychiatric diagnosis in postmortem research. Biological Psychiatry 57, 1 (2005), 96– 101. DOI:http://dx.doi.org/10.1016/j.biopsych.2004.10.016
Pierre Dragicevic. 2016. Fair Statistical Communication in HCI. Springer International Publishing, Cham, 291–330. DOI:http://dx.doi.org/10.1007/978-3-319-26633-6_13
Bradley Efron. 1979. Bootstrap Methods: Another Look at the Jackknife. The Annals of Mathematical Statistics 7, 1 (01 1979),1–26. DOI:http://dx.doi.org/10.1214/aos/1176344552
David Ellerman. 2010. History of the Logical Entropy Formula. Online. (2010). http://www.ellerman.org/history-of-the-logical-entropy-formula/.
Alvan R. Feinstein and Domenic V. Cicchetti. 1990. High agreement but low Kappa: I. the problems of two paradoxes.Journal of Clinical Epidemiology 43, 6 (1990), 543 – 549. DOI:http://dx.doi.org/10.1016/0895-4356(90)90158-L
Leah Findlater, Ben Lee, and Jacob Wobbrock. 2012. Beyond QWERTY: Augmenting Touch Screen Keyboards with Multi-touch Gestures for Non-alphanumeric Input. In Proceedings of the SIGCHI Conference on Human Factors in ComputingSystems (CHI ’12). ACM, New York, NY, USA, 2679–2682. DOI:http://dx.doi.org/10.1145/2207676.2208660
Ronald Aylmer Fisher. 1954. Statistical methods for research workers; 20th ed. Oliver and Boyd, Edinburgh. https://cds.cern.ch/record/724001
Joseph L. Fleiss. 1971. Measuring nominal scale agreement among many raters. Psychological Bulletin 76, 5 (1971), 378–382.Andrew Garrett and Keith Johnson. 2012. Phonetic bias in sound change. In Origins of sound change: Approaches to
phonologization, Alan C. L. Yu (Ed.). Oxford University Press, Oxford, Chapter 3, 51–97.Brian Gleeson, Karon MacLean, Amir Haddadi, Elizabeth Croft, and Javier Alcazar. 2013. Gestures for Industry: Intuitive
Human-robot Communication from Human Observation. In Proceedings of the 8th ACM/IEEE International Conference onHuman-robot Interaction (HRI ’13). IEEE Press, Piscataway, NJ, USA, 349–356. http://dl.acm.org/citation.cfm?id=2447556.2447679
Michael D. Good, John A. Whiteside, Dennis R. Wixon, and Sandra J. Jones. 1984. Building a User-derived Interface. Commun.ACM 27, 10 (Oct. 1984), 1032–1043. DOI:http://dx.doi.org/10.1145/358274.358284
Daniela Grijincu, Miguel A Nacenta, and Per Ola Kristensson. 2014. User-defined interface gestures: dataset and analysis. InProceedings of the Ninth ACM International Conference on Interactive Tabletops and Surfaces. ACM, 25–34.
Kilem Li Gwet. 2008. Variance Estimation of Nominal-Scale Inter-Rater Reliability withÂăRandom Selection of Raters.Psychometrika 73, 3 (17 Jan 2008), 407. DOI:http://dx.doi.org/10.1007/s11336-007-9054-8
Kilem Li Gwet. 2014. Handbook of Inter-Rater Reliability, 4th Edition: The Definitive Guide to Measuring The Extent of
ACM Transactions on Computer-Human Interaction, Vol. 1, No. 1, Article . Publication date: April 2018.

:48 Tsandilas T.
Agreement Among Raters. Advanced Analytics, LLC. https://books.google.fr/books?id=fac9BQAAQBAJJoshua Hailpern, Karrie Karahalios, James Halle, Laura Dethorne, and Mary-Kelsey Coletto. 2009. A3: Hci coding guideline
for research using video annotation to assess behavior of nonverbal subjects with computer-based intervention. ACMTransactions on Accessible Computing (TACCESS) 2, 2 (2009), 8.
Andrew F Hayes and Klaus Krippendorff. 2007. Answering the call for a standard reliability measure for coding data.Communication methods and measures 1, 1 (2007), 77–89.
Tim Hesterberg, David Moore, Shaun Monaghan, Ashley Clipson, and Rachel Epstein. 2005. Bootstrap methods andpermutation tests. In Introduction to the Practice of Statistics. W. H. Freeman and Company, New York.
Kasper Hornbæk, Søren S. Sander, Javier Andrés Bargas-Avila, and Jakob Grue Simonsen. 2014. Is Once Enough?: On theExtent and Content of Replications in Human-computer Interaction. In Proceedings of the SIGCHI Conference on HumanFactors in Computing Systems (CHI ’14). ACM, New York, NY, USA, 3523–3532. DOI:http://dx.doi.org/10.1145/2556288.2557004
Torsten Hothorn, Kurt Hornik, Mark A. van de Wiel, and Achim Zeileis. 2008. Implementing a Class of Permutation Tests:The coin Package. Journal of Statistical Software 28, 8 (2008), 1–23. http://www.jstatsoft.org/v28/i08/
Dan Jurafsky, Elizabeth Shriberg, and Debra Biasca. 1997. Switchboard SWBD-DAMSL shallow-discourse-function annota-tion coders manual. Institute of Cognitive Science Technical Report (1997), 97–102.
Maurits Kaptein and Judy Robertson. 2012. Rethinking Statistical Analysis Methods for CHI. In Proceedings of the SIGCHIConference on Human Factors in Computing Systems (CHI ’12). ACM, New York, NY, USA, 1105–1114. DOI:http://dx.doi.org/10.1145/2207676.2208557
Matthew Kay, Steve Haroz, Shion Guha, and Pierre Dragicevic. 2016. Special Interest Group on Transparent Statistics inHCI. In Proceedings of the 2016 CHI Conference Extended Abstracts on Human Factors in Computing Systems (CHI EA ’16).ACM, New York, NY, USA, 1081–1084. DOI:http://dx.doi.org/10.1145/2851581.2886442
Vassilis Kostakos. 2015. The big hole in HCI research. Interactions 22, 2 (2015), 48–51. DOI:http://dx.doi.org/10.1145/2729103Klaus Krippendorff. 2004. Reliability in Content Analysis: Some Common Misconceptions and Recommendations. Human
Communication Research 30, 3 (2004), 411–433.Klaus Krippendorff. 2011. Agreement and Information in the Reliability of Coding. Communication Methods and Measures 5,
2 (2011), 93–112. DOI:http://dx.doi.org/10.1080/19312458.2011.568376Klaus Krippendorff. 2013. Content analysis: An introduction to its methodology. Thousand Oaks, CA: Sage.Byron Lahey, Audrey Girouard, Winslow Burleson, and Roel Vertegaal. 2011. PaperPhone: Understanding the Use of Bend
Gestures in Mobile Devices with Flexible Electronic Paper Displays. In Proceedings of the SIGCHI Conference on HumanFactors in Computing Systems (CHI ’11). ACM, New York, NY, USA, 1303–1312. DOI:http://dx.doi.org/10.1145/1978942.1979136
Sang-Su Lee, Sohyun Kim, Bopil Jin, Eunji Choi, Boa Kim, Xu Jia, Daeeop Kim, and Kun-pyo Lee. 2010. How Users ManipulateDeformable Displays As Input Devices. In Proceedings of the SIGCHI Conference on Human Factors in Computing Systems(CHI ’10). ACM, New York, NY, USA, 1647–1656. DOI:http://dx.doi.org/10.1145/1753326.1753572
Kathleen M MacQueen, Eleanor McLellan, Kelly Kay, and Bobby Milstein. 1998. Codebook development for team-basedqualitative analysis. Cultural anthropology methods 10, 2 (1998), 31–36.
Benoit Mandelbrot. 1967. Information Theory and Psycholinguistics: A Theory of Word Frequencies. MIT Press, MA, USA.Ellen M. Markman. 1991. The whole-object, taxonomic, and mutual exclusivity assumptions as initial constraints on word
meanings. Cambridge University Press, 72âĂŞ106. DOI:http://dx.doi.org/10.1017/CBO9780511983689.004Mark Micire, Munjal Desai, Amanda Courtemanche, Katherine M Tsui, and Holly A Yanco. 2009. Analysis of natural
gestures for controlling robot teams on multi-touch tabletop surfaces. In Proceedings of the ACM International Conferenceon Interactive Tabletops and Surfaces. ACM, 41–48.
Meredith Ringel Morris. 2012. Web on the Wall: Insights from a Multimodal Interaction Elicitation Study. In Proceedings ofthe 2012 ACM International Conference on Interactive Tabletops and Surfaces (ITS ’12). ACM, New York, NY, USA, 95–104.DOI:http://dx.doi.org/10.1145/2396636.2396651
Meredith Ringel Morris, Andreea Danielescu, Steven Drucker, Danyel Fisher, Bongshin Lee, m. c. schraefel, and Jacob O.Wobbrock. 2014. Reducing Legacy Bias in Gesture Elicitation Studies. interactions 21, 3 (May 2014), 40–45. DOI:http://dx.doi.org/10.1145/2591689
Meredith Ringel Morris, Jacob O. Wobbrock, and Andrew D. Wilson. 2010. Understanding Users’ Preferences for SurfaceGestures. In Proceedings of Graphics Interface 2010 (GI ’10). Canadian Information Processing Society, Toronto, Ont.,Canada, Canada, 261–268. http://dl.acm.org/citation.cfm?id=1839214.1839260
Mark E. J. Newman. 2005. Power laws, Pareto distributions and ZipfâĂŹs law. Contemporary Physics 46, 5 (Sept. 2005),323–351. DOI:http://dx.doi.org/10.1080/00107510500052444
Michael Nielsen, Moritz Störring, Thomas B. Moeslund, and Erik Granum. 2004. A Procedure for Developing Intuitive andErgonomic Gesture Interfaces for HCI. Springer Berlin Heidelberg, Berlin, Heidelberg, 409–420. DOI:http://dx.doi.org/10.1007/978-3-540-24598-8_38
ACM Transactions on Computer-Human Interaction, Vol. 1, No. 1, Article . Publication date: April 2018.

Fallacies of Agreement: A Critical Review of Consensus Assessment Methods for GestureElicitation :49
Dianne L. O’Connell and Annette J. Dobson. 1984. General Observer-Agreement Measures on Individual Subjects andGroups of Subjects. Biometrics 40, 4 (1984), pp. 973–983. http://www.jstor.org/stable/2531148
Uran Oh and Leah Findlater. 2013. The Challenges and Potential of End-user Gesture Customization. In Proceedings ofthe SIGCHI Conference on Human Factors in Computing Systems (CHI ’13). ACM, New York, NY, USA, 1129–1138. DOI:http://dx.doi.org/10.1145/2470654.2466145
Kimberly J. O’Malley, Karon F. Cook, Matt D. Price, Kimberly Raiford Wildes, John F. Hurdle, and Carol M. Ashton.2005. Measuring Diagnoses: ICD Code Accuracy. Health Services Research 40, 5p2 (2005), 1620–1639. DOI:http://dx.doi.org/10.1111/j.1475-6773.2005.00444.x
Steven T. Piantadosi. 2014. Zipf’s word frequency law in natural language: A critical review and future directions. PsychonomicBulletin & Review 21 (2014), 1112–1130. Issue 5. DOI:http://dx.doi.org/10.3758/s13423-014-0585-6
Thammathip Piumsomboon, Adrian Clark, Mark Billinghurst, and Andy Cockburn. 2013. User-Defined Gestures forAugmented Reality. In INTERACT 2013: 14th IFIP TC13 Conference on Human-Computer Interaction. Springer BerlinHeidelberg, Berlin, Heidelberg, 282–299. DOI:http://dx.doi.org/10.1007/978-3-642-40480-1_18
Karen L. Posner, Paul D. Sampson, Robert A. Caplan, Richard J. Ward, and Frederick W. Cheney. 1990. Measuring interraterreliability among multiple raters: an example of methods for nominal data. Stat Med. 11, 10 (1990), 1103–15.
Maurice H. Quenouille. 1949. Problems in Plane Sampling. The Annals of Mathematical Statistics 20, 3 (09 1949), 355–375.DOI:http://dx.doi.org/10.1214/aoms/1177729989
Julie Rico and Stephen Brewster. 2010. Usable Gestures for Mobile Interfaces: Evaluating Social Acceptability. In Proceedingsof the SIGCHI Conference on Human Factors in Computing Systems (CHI ’10). ACM, New York, NY, USA, 887–896. DOI:http://dx.doi.org/10.1145/1753326.1753458
Jaime Ruiz and Daniel Vogel. 2015. Soft-Constraints to Reduce Legacy and Performance Bias to Elicit Whole-body Gestureswith Low Arm Fatigue. In Proceedings of the 33rd Annual ACM Conference on Human Factors in Computing Systems (CHI’15). ACM, New York, NY, USA, 3347–3350. DOI:http://dx.doi.org/10.1145/2702123.2702583
William A Scott. 1955. Reliability of content analysis: The case of nominal scale coding. Public opinion quarterly (1955).Edward H. Simpson. 1949. Measurement of Diversity. Nature 163 (1949), 688. http://search.ebscohost.com.gate1.inist.fr/
login.aspx?direct=true&AuthType=ip,url,uid&db=psyh&AN=1950-02238-001&lang=fr&site=eds-liveRobert L. Spitzer and Joseph L. Fleiss. 1974. A Re-analysis of the Reliability of Psychiatric Diagnosis. The British Journal of
Psychiatry 125, 587 (1974), 341–347. DOI:http://dx.doi.org/10.1192/bjp.125.4.341GiovanniMaria Troiano, EsbenWarming Pedersen, and Kasper Hornbæk. 2014. User-defined Gestures for Elastic, Deformable
Displays. In Proceedings of the 2014 International Working Conference on Advanced Visual Interfaces (AVI ’14). ACM, NewYork, NY, USA, 1–8. DOI:http://dx.doi.org/10.1145/2598153.2598184
Theophanis Tsandilas and Pierre Dragicevic. 2016. Accounting for Chance Agreement in Gesture Elicitation Studies. ResearchReport 1584. LRI - CNRS, University Paris-Sud. 5 pages. https://hal.archives-ouvertes.fr/hal-01267288
John S. Uebersax. 1982. A design-independent method for measuring the reliability of psychiatric diagnosis. Journal ofPsychiatric Research 17, 4 (1982), 335–342. DOI:http://dx.doi.org/10.1016/0022-3956(82)90039-5
John S. Uebersax. 2015. Statistical Methods for Diagnostic Agreement. http://www.john-uebersax.com/stat/agree.htm.(2015). Accessed: 2017-08-11.
Sophie Vanbelle and Adelin Albert. 2009. Agreement between Two Independent Groups of Raters. Psychometrika 74, 3(2009), 477–491. DOI:http://dx.doi.org/10.1007/s11336-009-9116-1
Radu-Daniel Vatavu and Jacob O. Wobbrock. 2015. Formalizing Agreement Analysis for Elicitation Studies: New Measures,Significance Test, and Toolkit. In Proceedings of the 33rd Annual ACM Conference on Human Factors in Computing Systems(CHI ’15). ACM, New York, NY, USA, 1325–1334. DOI:http://dx.doi.org/10.1145/2702123.2702223
Radu-Daniel Vatavu and Jacob O. Wobbrock. 2016. Between-Subjects Elicitation Studies: Formalization and Tool Support. InProceedings of the 2016 CHI Conference on Human Factors in Computing Systems (CHI ’16). ACM, New York, NY, USA,3390–3402. DOI:http://dx.doi.org/10.1145/2858036.2858228
Julie Wagner, Stéphane Huot, and Wendy Mackay. 2012. BiTouch and BiPad: Designing Bimanual Interaction for Hand-heldTablets. In Proceedings of the SIGCHI Conference on Human Factors in Computing Systems (CHI ’12). ACM, New York, NY,USA, 2317–2326. DOI:http://dx.doi.org/10.1145/2207676.2208391
Martin Weigel, Vikram Mehta, and Jürgen Steimle. 2014. More Than Touch: Understanding How People Use Skin As anInput Surface for Mobile Computing. In Proceedings of the SIGCHI Conference on Human Factors in Computing Systems(CHI ’14). ACM, New York, NY, USA, 179–188. DOI:http://dx.doi.org/10.1145/2556288.2557239
Max Wilson, Wendy Mackay, Ed Chi, Michael Bernstein, and Jeffrey Nichols. 2012. RepliCHI SIG: From a Panel to a NewSubmission Venue for Replication. In CHI ’12 Extended Abstracts on Human Factors in Computing Systems (CHI EA ’12).ACM, New York, NY, USA, 1185–1188. DOI:http://dx.doi.org/10.1145/2212776.2212419
Jacob O. Wobbrock, Htet Htet Aung, Brandon Rothrock, and Brad A. Myers. 2005. Maximizing the Guessability of SymbolicInput. In CHI ’05 Extended Abstracts on Human Factors in Computing Systems (CHI EA ’05). ACM, New York, NY, USA,1869–1872. DOI:http://dx.doi.org/10.1145/1056808.1057043
ACM Transactions on Computer-Human Interaction, Vol. 1, No. 1, Article . Publication date: April 2018.

:50 Tsandilas T.
Jacob O. Wobbrock, Meredith Ringel Morris, and Andrew D. Wilson. 2009. User-defined Gestures for Surface Computing.In Proceedings of the SIGCHI Conference on Human Factors in Computing Systems (CHI ’09). ACM, New York, NY, USA,1083–1092. DOI:http://dx.doi.org/10.1145/1518701.1518866
Michael Wood. 2005. Bootstrapped confidence intervals as an approach to statistical inference. Organizational ResearchMethods 8, 4 (2005), 454–470.
George K. Zipf. 1949. Human Behaviour and the Principle of Least Effort. Addison-Wesley.
ACM Transactions on Computer-Human Interaction, Vol. 1, No. 1, Article . Publication date: April 2018.