FALL 2011 INTERNATIONAL STATISTICS
32
FALL 2011 INTERNATIONAL STATISTICS INTERNATIONAL STUDENT & SCHOLAR SERVICES
Transcript of FALL 2011 INTERNATIONAL STATISTICS

isss.illinois.edu
FALL 2011 INTERNATIONAL
STATISTICS
INTERNATIONAL STUDENT & SCHOLAR SERVICES
Staff Listing
Julie MisaDirector
Carol BussDirector, Faculty and Staff
Martin McFarlaneAssociate Director
Stephanie DvorachekAssistant Director
Afroza FaruqueAssistant Director
Cheryl HinkelAssistant Director
Kara JohnsonAssistant Director
Robb LarsonAssistant Director
Erin SchillerAssistant Director
Sondra SchreiberAssistant Director
Nicole VernonAssistant Director
Jodi BarnhillInternational Data Coordinator
Kathryn MajewskiInternational Data Management Specialist
Laverne AndersonOffice Manager
Helen AgansOffice Support Assistant
Datial JonesOffice Support Assistant
Carmella WilliamsOffice Support Assistant Learner
Patrice BenjaminAdvising Assistant
Shruti GhoshAdvising Assistant
Table of Contents
2
3
4
5
6
7
8
14
18
19
20
22
Letter from the Director
International Student Enrollment
Overview Summary
New Student Summary
Undergraduate Student Summary
Graduate Student Summary
Enrollment by Country
Enrollment by Department
Summary Charts
International Faculty & Scholars
Summary Data
International Faculty & Scholars by Country

International Student & Scholar Services (ISSS) is committed to providing culturally sensitive services of the highest quality to international students and scholars. We are proud that the University of Illinois at Urbana-Champaign ranks 1st amongst US public institutions hosting international students (2nd overall) and 16th for scholars.
The UIUC welcomed a record 2,549 new international students to campus this fall. The top three countries represented were China (1107), South Korea (377), and India (239), accounting for 68% of our new student population. For the fourth year in a row, new undergraduate degree students outnumbered new graduate degree students, with 1237 (48.5%) and 914 (35.8%), respectively. Incoming freshmen were the largest single group, numbering 945. We also welcomed 398 non-degree and professional students to campus this year.
The number of enrolled international students is also at an all-time high of 8,057, an increase of 10.8% from Fall 2010. Graduate degree-seeking students account for 48% (3867) of the international enrollment, and comprise 40.5% of the overall graduate student population. Undergraduate degree students make up 46.8% (3,867) of the international student enrollment, and 12.1% of the UI undergraduate student population. Overall, international students comprise 18.9% of the student body at the UI.
Our students represent 115 countries, with 83.8% coming from Asia. The top 5 countries of origin are: China (3,086), South Korea (1,536), India (876), Taiwan (438), and tied for 5th place are Canada (123) and Indonesia (123).
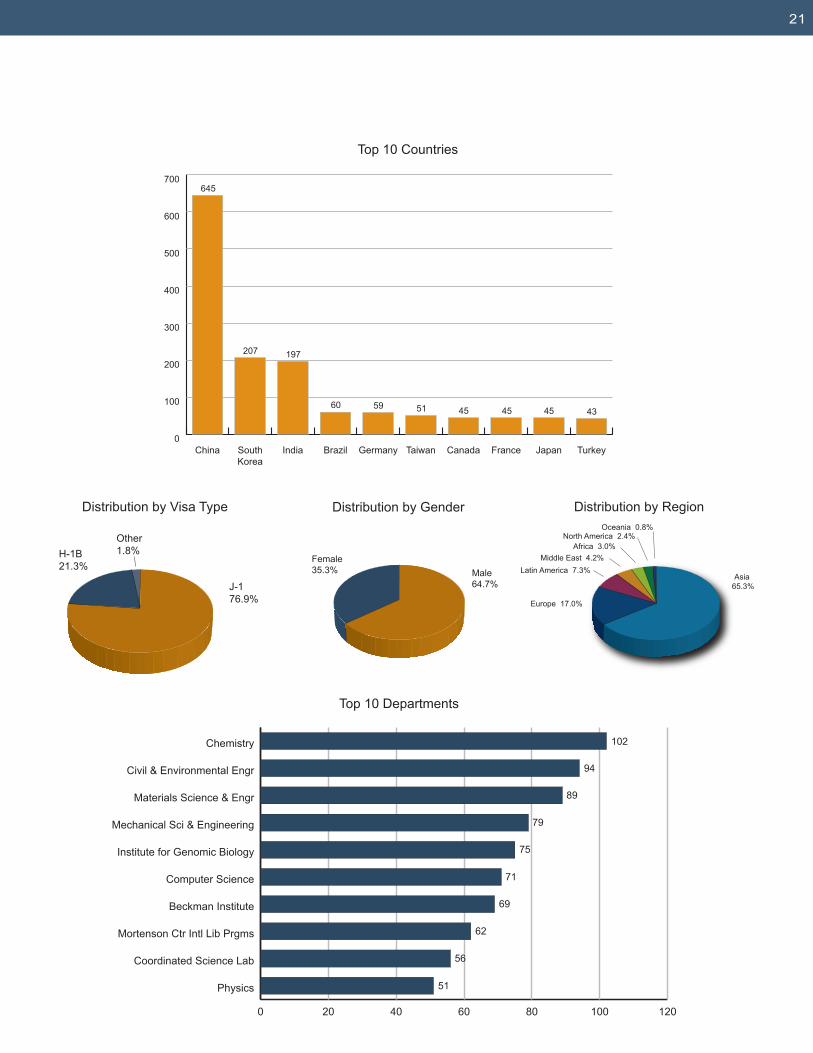
From July 2010 through June 2011, UIUC welcomed 1,912 international faculty and staff to its campus. Over 25% were working and researching in Engineering, followed by nearly 10.3% in the Physical Sciences, and 9.9% in Biological & Biomedical Sciences. The most represented country was China, with 645 faculty and staff, followed by South Korea with 207, India with 197, Brazil with 60, and Germany with 59.
We at ISSS celebrate the presence of so many talented international students, faculty, and staff at the University of Illinois at Urbana-Champaign, and we look forward to working with this special group of people in the upcoming year.
Julie MisaJulie Misa
Director, International Student & Scholar Services
L e t t e r f r o m t h e D i r e c t o r

INTERNATIONAL STUDENT ENROLLMENT

TOTAL STUDENT ENROLLMENT
Africa 1.2%Asia
82.7%Oceania 0.7%
Middle East 3.7%North America 1.8%
Europe 5.8%
Latin America 4.2%0
500
1000
1500
2000
2500
3000
3500
4000
4500
GraduatesUndergraduates
2011201020092008200720062005200420032002
Year
37943783357735983595
3453363936373599
3907
3477
2779
2217
169015511451
13241132
956
4150
0 500 1000 1500 2000 2500 3000
Provost & VC Acad AffairsGraduate College
Institute of AviationVeterinary Medicine
School of Social WorkGrad School of Library & Info Sci
Institute of Labor & Ind RelsApplied Health Sciences
LawMedia
EducationDivision of General Studies
Agr, Cons, & Env SciFine & Applied Arts
BusinessLiberal Arts & Sciences
Engineering 2988
13
2516
6386118133133
257393
4491038
2340
3
11
Non-Degree (398)Professional (24)
Doctorate(2290)
Masters (1577)
Bachelors(3768)
0
1000
2000
3000
4000
5000
6000
7000
8000
9000
2011201020092008200720062005200420032002
Year
5794528851464904496347694555
65627271
8057
Thailand (114)
Singapore (104)Iran (107)
Turkey (113)
Indonesia (123)Canada (123)
Taiwan (438)
India (876) South Korea(1536)
China(3086)
Other Countries (1437)
Total Enrollment2002 - 2011
Distribution by Degree Level2002 - 2011
Distribution by College
Distribution by Region
Top 10 Countries
Distribution by Degree Level
4
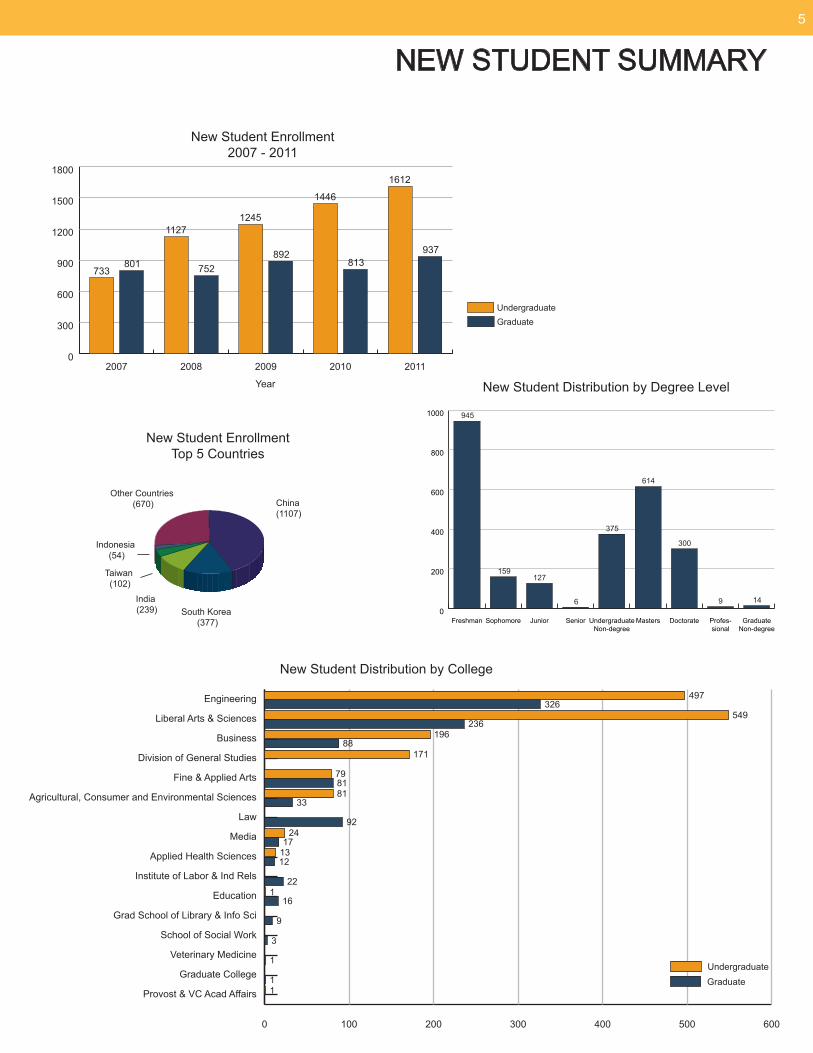
NEW STUDENT SUMMARY
0
200
400
600
800
1000
GraduateNon-degree
Profes-sional
DoctorateMastersUndergraduateNon-degree
SeniorJuniorSophomoreFreshman
159
149
300
614
375
6
127
945
Other Countries (670)
Taiwan (102)
India (239) South Korea
(377)
China(1107)
Indonesia (54)
0
300
600
900
1200
1500
1800
GraduateUndergraduate
20112010200920082007
Year
1446
12451127
1612
937
733801 752
892813
New Student Enrollment Top 5 Countries
New Student Distribution by Degree Level
New Student Enrollment2007 - 2011
0 100 200 300 400 500 600
Provost & VC Acad Affairs
Graduate College
Veterinary Medicine
School of Social Work
Grad School of Library & Info Sci
Education
Institute of Labor & Ind Rels
Applied Health Sciences
Media
Law
Agricultural, Consumer and Environmental Sciences
Fine & Applied Arts
Division of General Studies
Business
Liberal Arts & Sciences
Engineering
UndergraduateGraduate
497
8179
17188
196236
549326
2492
3381
122
12
17
16
9
3
1
11
13
New Student Distribution by College
5

UNDERGRADUATE STUDENT SUMMARY
0 300 600 900 1200 1500
Provost & VC Acad Affairs
Institute of Aviation
Education
Applied Health Sciences
Media
Fine & Applied Arts
Agr, Cons, & Env Sci
Division of General Studies
Business
Liberal Arts & Sciences
Engineering
BachelorsNon-Degree
1351
2
31
6
84
165
170
257
418
1284
143
97
90
24
23
3
1
1
0
500
1000
1500
2000
2500
3000
3500
4000
Non-DegreeBachelors
20112010200920082007
Year
3160
317314
2465
262
1955
237
1453
382
3768
Undergraduate Student Enrollment2007- 2011
Distribution by College
Non-Degree StudentTop 5 Countries
Bachelors StudentTop 5 Countries
0 100 200 300 400 500 600
Psychology
Industrial and Enterprise Systems Engr
Mechanical Science and Engineering
Civil and Environmental Engineering
Accountancy
Computer Science
Div General Studies Admin
Mathematics
Economics
Electrical and Computer Engineering
237
257
281
321
579
205
129
128
118
115
Bachelors StudentTop 10 Departments
0
500
1000
1500
2000
IndonesiaTaiwanIndiaSouth KoreaChina
1687
960
94124
404
0
10
20
30
40
50
60
ItalyGermanyAustraliaChinaUnited Kingdom
51
4036
26 26
6

GRADUATE STUDENT SUMMARY
0 300 600 900 1200 1500
Institute of Aviation
Graduate College
Veterinary Medicine
School of Social Work
Grad School of Library & Info Sci
Media
Applied Health Sciences
Institute of Labor & Ind Rels
Law
Education
Agricultural, Consumer and Environmental Sciences
Fine & Applied Arts
Business
Liberal Arts & Sciences
Engineering 1494
13
25
16
46
54
63
118
127
199
261
530
959
1
1
0
500
1000
1500
2000
2500
3000
Professional/Non-Degree
DoctorateMasters
20112010200920082007
Year
13951294
11511128
40
1577
22902432 2384 2435 2356
38 42 54 43
Distribution by College
Graduate StudentTop 5 Countries
Graduate Student Enrollment2007- 2011
0 50 100 150 200 250
Mathematics
Physics
Music
Finance
Accountancy
Mechanical Science and Engineering
Economics
Computer Science
Electrical and Computer Engineering
Civil and Environmental Engineering
DoctorateMasters
132
81
131
128
676
7042
21078
185137
141133
17623
120
29
18
Graduate StudentTop 10 Departments
0
300
600
900
1200
1500
IranTaiwanIndiaSouthKorea
China
1359
562
106
292
472
7
Undergraduate Graduate
Bachelors Non-degree Total Masters Doctorate Non-degree Professional Total Grand TotalFemale Male Female Male Female Male Female Male Female Male Female Male
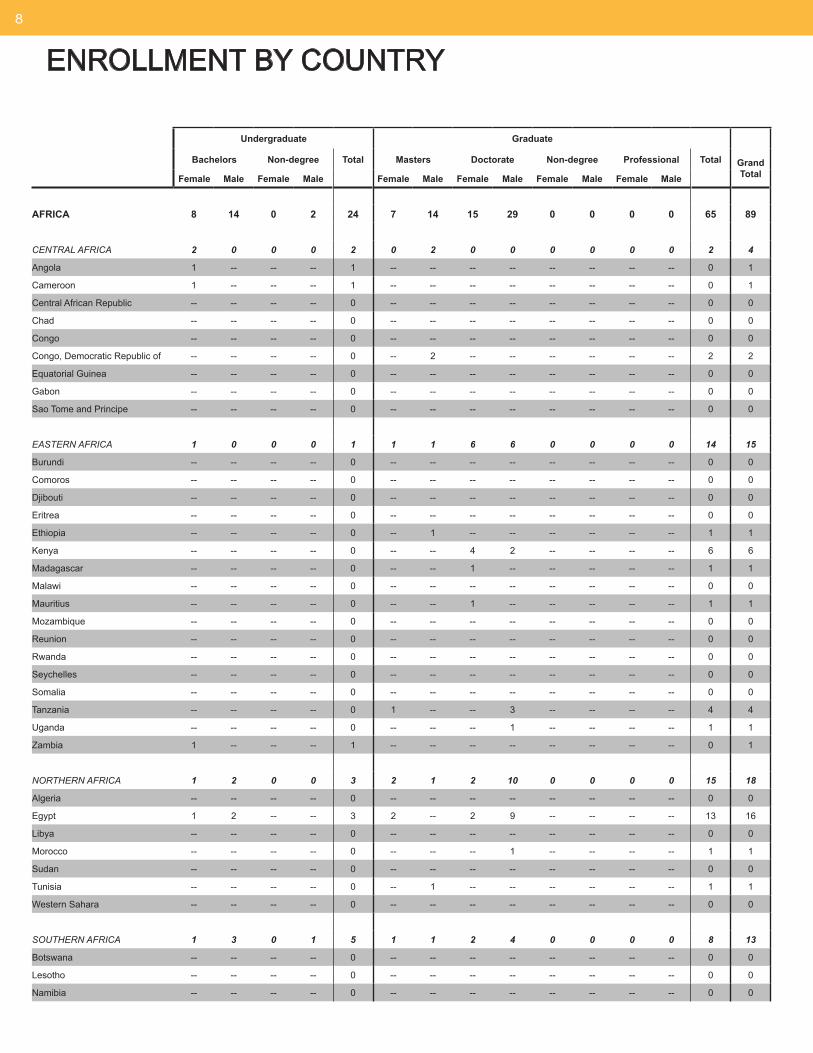
AFRICA 8 14 0 2 24 7 14 15 29 0 0 0 0 65 89
CENTRAL AFRICA 2 0 0 0 2 0 2 0 0 0 0 0 0 2 4
Angola 1 -- -- -- 1 -- -- -- -- -- -- -- -- 0 1
Cameroon 1 -- -- -- 1 -- -- -- -- -- -- -- -- 0 1
Central African Republic -- -- -- -- 0 -- -- -- -- -- -- -- -- 0 0
Chad -- -- -- -- 0 -- -- -- -- -- -- -- -- 0 0
Congo -- -- -- -- 0 -- -- -- -- -- -- -- -- 0 0
Congo, Democratic Republic of -- -- -- -- 0 -- 2 -- -- -- -- -- -- 2 2
Equatorial Guinea -- -- -- -- 0 -- -- -- -- -- -- -- -- 0 0
Gabon -- -- -- -- 0 -- -- -- -- -- -- -- -- 0 0
Sao Tome and Principe -- -- -- -- 0 -- -- -- -- -- -- -- -- 0 0
EASTERN AFRICA 1 0 0 0 1 1 1 6 6 0 0 0 0 14 15
Burundi -- -- -- -- 0 -- -- -- -- -- -- -- -- 0 0
Comoros -- -- -- -- 0 -- -- -- -- -- -- -- -- 0 0
Djibouti -- -- -- -- 0 -- -- -- -- -- -- -- -- 0 0
Eritrea -- -- -- -- 0 -- -- -- -- -- -- -- -- 0 0
Ethiopia -- -- -- -- 0 -- 1 -- -- -- -- -- -- 1 1
Kenya -- -- -- -- 0 -- -- 4 2 -- -- -- -- 6 6
Madagascar -- -- -- -- 0 -- -- 1 -- -- -- -- -- 1 1
Malawi -- -- -- -- 0 -- -- -- -- -- -- -- -- 0 0
Mauritius -- -- -- -- 0 -- -- 1 -- -- -- -- -- 1 1
Mozambique -- -- -- -- 0 -- -- -- -- -- -- -- -- 0 0
Reunion -- -- -- -- 0 -- -- -- -- -- -- -- -- 0 0
Rwanda -- -- -- -- 0 -- -- -- -- -- -- -- -- 0 0
Seychelles -- -- -- -- 0 -- -- -- -- -- -- -- -- 0 0
Somalia -- -- -- -- 0 -- -- -- -- -- -- -- -- 0 0
Tanzania -- -- -- -- 0 1 -- -- 3 -- -- -- -- 4 4
Uganda -- -- -- -- 0 -- -- -- 1 -- -- -- -- 1 1
Zambia 1 -- -- -- 1 -- -- -- -- -- -- -- -- 0 1
NORTHERN AFRICA 1 2 0 0 3 2 1 2 10 0 0 0 0 15 18
Algeria -- -- -- -- 0 -- -- -- -- -- -- -- -- 0 0
Egypt 1 2 -- -- 3 2 -- 2 9 -- -- -- -- 13 16
Libya -- -- -- -- 0 -- -- -- -- -- -- -- -- 0 0
Morocco -- -- -- -- 0 -- -- -- 1 -- -- -- -- 1 1
Sudan -- -- -- -- 0 -- -- -- -- -- -- -- -- 0 0
Tunisia -- -- -- -- 0 -- 1 -- -- -- -- -- -- 1 1
Western Sahara -- -- -- -- 0 -- -- -- -- -- -- -- -- 0 0
SOUTHERN AFRICA 1 3 0 1 5 1 1 2 4 0 0 0 0 8 13
Botswana -- -- -- -- 0 -- -- -- -- -- -- -- -- 0 0
Lesotho -- -- -- -- 0 -- -- -- -- -- -- -- -- 0 0
Namibia -- -- -- -- 0 -- -- -- -- -- -- -- -- 0 0
ENROLLMENT BY COUNTRY8

Undergraduate Graduate
Bachelors Non-degree Total Masters Doctorate Non-degree Professional Total Grand TotalFemale Male Female Male Female Male Female Male Female Male Female Male
South Africa 1 2 -- 1 4 -- 1 2 3 -- -- -- -- 6 10
Swaziland -- -- -- -- 0 -- -- -- -- -- -- -- -- 0 0
Zimbabwe -- 1 -- -- 1 1 -- -- 1 -- -- -- -- 2 3
WESTERN AFRICA 3 9 0 1 13 3 9 5 9 0 0 0 0 26 39
Benin -- -- -- -- 0 -- -- -- -- -- -- -- -- 0 0
Burkina Faso -- -- -- -- 0 -- -- 2 -- -- -- -- -- 2 2
Cape Verde -- -- -- -- 0 -- -- -- -- -- -- -- -- 0 0
Cote D Ivoire 1 -- -- -- 1 -- -- -- 2 -- -- -- -- 2 3
Gambia, The -- -- -- -- 0 -- -- -- -- -- -- -- -- 0 0
Ghana -- -- -- -- 0 2 2 -- 2 -- -- -- -- 6 6
Guinea -- -- -- -- 0 -- -- -- -- -- -- -- -- 0 0
Guinea-Bissau -- -- -- -- 0 -- -- -- -- -- -- -- -- 0 0
Liberia -- -- -- -- 0 -- -- -- -- -- -- -- -- 0 0
Mali -- 1 -- -- 1 -- -- -- -- -- -- -- -- 0 1
Mauritania -- -- -- -- 0 -- -- -- -- -- -- -- -- 0 0
Niger -- -- -- -- 0 -- -- -- -- -- -- -- -- 0 0
Nigeria 2 8 -- 1 11 -- 5 3 5 -- -- -- -- 13 24
Saint Helena -- -- -- -- 0 -- -- -- -- -- -- -- -- 0 0
Senegal -- -- -- -- 0 1 1 -- -- -- -- -- -- 2 2
Sierra Leone -- -- -- -- 0 -- 1 -- -- -- -- -- -- 1 1
Togo -- -- -- -- 0 -- -- -- -- -- -- -- -- 0 0
ASIA 1347 2228 42 59 3676 677 647 680 1051 6 1 11 4 3077 6753
EAST ASIA 1168 1664 34 48 2914 573 424 548 729 3 0 11 3 2291 5205
China 757 930 20 20 1727 420 252 285 396 -- -- 6 -- 1359 3086
Hong Kong 15 23 -- -- 38 2 2 3 18 -- -- -- -- 25 63
Japan 6 14 3 3 26 5 9 13 21 -- -- 1 -- 49 75
Macau -- 1 -- -- 1 1 -- 1 -- -- -- -- -- 2 3
Mongolia 1 1 -- -- 2 -- -- 2 -- -- -- -- -- 2 4
South Korea 335 625 9 5 974 69 106 172 205 3 -- 4 3 562 1536
Taiwan 54 70 2 20 146 76 55 72 89 -- -- -- -- 292 438
SOUTH AND CENTRAL ASIA 77 384 0 0 461 73 180 90 254 1 0 0 0 598 1059
Afghanistan -- -- -- -- 0 -- -- -- -- -- -- -- -- 0 0
Bangladesh 2 5 -- -- 7 3 8 8 29 -- -- -- -- 48 55
Bhutan -- -- -- -- 0 -- -- -- -- -- -- -- -- 0 0
India 65 339 -- -- 404 62 145 75 189 1 -- -- -- 472 876
Kazakhstan 7 23 -- -- 30 3 5 1 1 -- -- -- -- 10 40
Kyrgyzstan -- 1 -- -- 1 -- -- -- -- -- -- -- -- 0 1
Maldives -- -- -- -- 0 -- -- -- -- -- -- -- -- 0 0
Nepal 1 1 -- -- 2 1 2 2 10 -- -- -- -- 15 17
Pakistan 2 14 -- -- 16 4 20 4 23 -- -- -- -- 51 67
Sri Lanka -- 1 -- -- 1 -- -- -- 1 -- -- -- -- 1 2
9

ENROLLMENT BY COUNTRY
Undergraduate Graduate
Bachelors Non-degree Total Masters Doctorate Non-degree Professional Total Grand TotalFemale Male Female Male Female Male Female Male Female Male Female Male
Tajikistan -- -- -- -- 0 -- -- -- -- -- -- -- -- 0 0
Turkmenistan -- -- -- -- 0 -- -- -- -- -- -- -- -- 0 0
Uzbekistan -- -- -- -- 0 -- -- -- 1 -- -- -- -- 1 1
SOUTHEAST ASIA 102 180 8 11 301 31 43 42 68 2 1 0 1 188 489
Brunei -- -- -- -- 0 -- -- -- -- -- -- -- -- 0 0
Burma -- 3 -- -- 3 1 -- -- -- -- -- -- -- 1 4
Cambodia -- -- -- -- 0 -- -- -- -- -- -- -- -- 0 0
Indonesia 36 58 -- 1 95 9 9 4 6 -- -- -- -- 28 123
Laos -- -- -- -- 0 -- -- -- -- -- -- -- -- 0 0
Malaysia 24 34 2 1 61 1 4 6 8 -- -- -- -- 19 80
Myanmar -- -- -- -- 0 -- -- -- -- -- -- -- -- 0 0
Philippines 1 5 -- -- 6 1 -- 4 4 -- -- -- -- 9 15
Singapore 25 37 5 8 75 2 6 5 13 2 1 -- -- 29 104
Thailand 13 35 -- -- 48 16 16 17 17 -- -- -- -- 66 114
Timor-Leste -- -- -- -- 0 -- -- -- -- -- -- -- -- 0 0
Vietnam 3 8 1 1 13 1 8 6 20 -- -- -- 1 36 49
EUROPE 8 24 90 117 239 18 22 63 81 2 5 2 0 193 432
EASTERN EUROPE 1 7 5 2 15 11 3 37 32 0 0 2 0 85 100
Albania -- -- -- -- 0 -- -- -- -- -- -- -- -- 0 0
Armenia -- 1 -- -- 1 -- -- -- 2 -- -- -- -- 2 3
Azerbaijan -- 1 -- -- 1 -- -- -- -- -- -- -- -- 0 1
Belarus -- -- -- -- 0 -- -- -- -- -- -- -- -- 0 0
Bosnia and Herzegovina -- -- 1 -- 1 -- -- -- -- -- -- -- -- 0 1
Bulgaria -- -- -- -- 0 -- -- 2 3 -- -- 1 -- 6 6
Croatia -- -- -- -- 0 -- -- -- 1 -- -- -- -- 1 1
Czech Republic -- -- -- -- 0 -- -- -- -- -- -- -- -- 0 0
Estonia -- -- -- -- 0 -- -- -- -- -- -- -- -- 0 0
Georgia -- -- -- -- 0 -- -- -- -- -- -- -- -- 0 0
Hungary -- 1 -- -- 1 -- -- -- -- -- -- -- -- 0 1
Kosovo -- -- -- -- 0 -- -- -- -- -- -- -- -- 0 0
Latvia -- -- -- -- 0 -- -- -- 1 -- -- -- -- 1 1
Lithuania -- -- -- -- 0 -- -- -- -- -- -- 1 -- 1 1
Macedonia -- -- -- -- 0 -- -- -- -- -- -- -- -- 0 0
Moldova -- -- -- -- 0 -- -- -- 1 -- -- -- -- 1 1
Montenegro -- -- -- -- 0 -- -- -- -- -- -- -- -- 0 0
Poland -- 1 2 -- 3 -- -- 2 1 -- -- -- -- 3 6
Romania 1 -- 1 1 3 -- -- 12 7 -- -- -- -- 19 22
Russia -- 1 -- -- 1 6 1 10 8 -- -- -- -- 25 26
Serbia -- 1 -- -- 1 3 2 7 4 -- -- -- -- 16 17
Slovakia -- -- 1 1 2 -- -- 1 -- -- -- -- -- 1 3
Slovenia -- -- -- -- 0 -- -- -- -- -- -- -- -- 0 0
Ukraine -- 1 -- -- 1 2 -- 3 4 -- -- -- -- 9 10
10

Undergraduate Graduate
Bachelors Non-degree Total Masters Doctorate Non-degree Professional Total Grand TotalFemale Male Female Male Female Male Female Male Female Male Female Male
WESTERN EUROPE 7 17 85 115 224 7 19 26 49 2 5 0 0 108 332
Andorra -- -- -- -- 0 -- -- -- -- -- -- -- -- 0 0
Austria -- -- 11 11 22 -- -- 1 4 -- -- -- -- 5 27
Belgium -- 1 1 4 6 -- -- -- 1 -- -- -- -- 1 7
Denmark -- 1 2 4 7 1 -- -- -- -- -- -- -- 1 8
Finland -- -- -- -- 0 -- -- -- -- -- -- -- -- 0 0
France -- 1 12 12 25 1 6 3 3 1 2 -- -- 16 41
Germany 1 2 10 16 29 1 2 5 10 1 2 -- -- 21 50
Greece -- -- -- 1 1 1 4 3 7 -- -- -- -- 15 16
Iceland -- -- -- -- 0 -- 1 -- -- -- -- -- -- 1 1
Ireland -- -- -- -- 0 -- -- 1 1 -- -- -- -- 2 2
Italy -- 1 9 17 27 1 -- 4 8 -- -- -- -- 13 40
Liechtenstein -- -- -- -- 0 -- -- -- -- -- -- -- -- 0 0
Luxembourg -- -- -- -- 0 -- -- -- -- -- -- -- -- 0 0
Malta -- -- -- -- 0 -- -- -- -- -- -- -- -- 0 0
Monaco -- -- -- -- 0 -- -- -- -- -- -- -- -- 0 0
Netherlands 1 1 5 4 11 -- -- 1 1 -- -- -- -- 2 13
Norway -- -- 2 -- 2 -- -- -- 1 -- -- -- -- 1 3
Portugal -- -- -- -- 0 -- -- -- 1 -- -- -- -- 1 1
San Marino -- -- -- -- 0 -- -- -- -- -- -- -- -- 0 0
Spain 1 1 7 9 18 2 2 6 8 -- 1 -- -- 19 37
Sweden 1 -- 2 10 13 -- 1 -- -- -- -- -- -- 1 14
Switzerland -- -- -- -- 0 -- 1 -- 1 -- -- -- -- 2 2
United Kingdom 3 9 24 27 63 -- 2 2 3 -- -- -- -- 7 70
Vatican City -- -- -- -- 0 -- -- -- -- -- -- -- -- 0 0
LATIN AMERICA 8 25 11 20 64 31 55 53 111 0 0 0 3 253 317
CARIBBEAN 1 3 0 0 4 3 3 4 4 0 0 0 1 15 19
Anguilla -- -- -- -- 0 -- -- -- -- -- -- -- -- 0 0
Antigua and Barbuda -- -- -- -- 0 -- -- -- -- -- -- -- -- 0 0
Aruba (Netherlands) -- -- -- -- 0 -- -- -- -- -- -- -- -- 0 0
Bahamas, The -- 1 -- -- 1 -- -- -- -- -- -- -- -- 0 1
Barbados 1 -- -- -- 1 -- -- -- -- -- -- -- -- 0 1
Bermuda -- -- -- -- 0 -- 1 -- -- -- -- -- -- 1 1
British Virgin Islands -- -- -- -- 0 -- -- -- -- -- -- -- -- 0 0
Cayman Islands -- -- -- -- 0 -- -- -- -- -- -- -- -- 0 0
Cuba -- -- -- -- 0 -- -- -- -- -- -- -- -- 0 0
Dominica -- -- -- -- 0 -- -- 1 -- -- -- -- -- 1 1
Dominican Republic -- -- -- -- 0 2 2 -- 2 -- -- -- 1 7 7
Grenada -- -- -- -- 0 -- -- -- -- -- -- -- -- 0 0
Guadeloupe -- -- -- -- 0 -- -- -- -- -- -- -- -- 0 0
Haiti -- -- -- -- 0 1 -- -- 1 -- -- -- -- 2 2
Jamaica -- 1 -- -- 1 -- -- 2 -- -- -- -- -- 2 3
11

ENROLLMENT BY COUNTRY
Undergraduate Graduate
Bachelors Non-degree Total Masters Doctorate Non-degree Professional Total Grand TotalFemale Male Female Male Female Male Female Male Female Male Female Male
Martinique -- -- -- -- 0 -- -- -- -- -- -- -- -- 0 0
Montserrat -- -- -- -- 0 -- -- -- -- -- -- -- -- 0 0
Netherlands Antilles -- -- -- -- 0 -- -- -- -- -- -- -- -- 0 0
Puerto Rico -- -- -- -- 0 -- -- -- -- -- -- -- -- 0 0
Saint Kitts and Nevis -- -- -- -- 0 -- -- -- -- -- -- -- -- 0 0
St. Lucia -- -- -- -- 0 -- -- -- -- -- -- -- -- 0 0
St. Vincent -- -- -- -- 0 -- -- -- -- -- -- -- -- 0 0
Trinidad & Tobago -- 1 -- -- 1 -- -- 1 1 -- -- -- -- 2 3
Central America and Mexico 0 10 2 2 14 5 14 11 19 0 0 0 2 51 65
Belize -- -- -- -- 0 -- -- -- -- -- -- -- -- 0 0
Costa Rica -- 2 -- -- 2 -- 1 1 1 -- -- -- -- 3 5
El Salvador -- 1 -- -- 1 -- -- -- -- -- -- -- -- 0 1
Guatemala -- 1 -- -- 1 -- 2 -- 4 -- -- -- -- 6 7
Honduras -- 2 -- -- 2 3 2 1 3 -- -- -- -- 9 11
Mexico -- 4 2 2 8 1 7 9 10 -- -- -- 2 29 37
Nicaragua -- -- -- -- 0 -- -- -- -- -- -- -- -- 0 0
Panama -- -- -- -- 0 1 2 -- 1 -- -- -- -- 4 4
South America 7 12 9 18 46 23 38 38 88 0 0 0 0 187 233
Argentina 1 1 -- -- 2 3 4 5 4 -- -- -- -- 16 18
Bolivia -- 1 -- -- 1 1 1 2 -- -- -- -- -- 4 5
Brazil -- 6 6 15 27 5 5 12 35 -- -- -- -- 57 84
Chile 1 -- -- -- 1 2 2 3 16 -- -- -- -- 23 24
Colombia -- 1 1 -- 2 6 8 9 18 -- -- -- -- 41 43
Ecuador 2 -- 2 3 7 -- 6 3 7 -- -- -- -- 16 23
French Guiana -- -- -- -- 0 -- -- -- -- -- -- -- -- 0 0
Guyana -- -- -- -- 0 -- -- -- -- -- -- -- -- 0 0
Paraguay -- -- -- -- 0 -- 1 -- -- -- -- -- -- 1 1
Peru 1 -- -- -- 1 4 6 4 7 -- -- -- -- 21 22
Suriname -- -- -- -- 0 -- -- -- -- -- -- -- -- 0 0
Uruguay -- -- -- -- 0 -- -- -- -- -- -- -- -- 0 0
Venezuela 2 3 -- -- 5 2 5 -- 1 -- -- -- -- 8 13
MIDDLE EAST 4 27 3 2 36 21 59 60 100 0 0 0 0 240 276
Bahrain -- 1 -- -- 1 -- -- -- 1 -- -- -- -- 1 2
Cyprus -- 1 -- -- 1 -- 1 -- 2 -- -- -- -- 3 4
Iran -- 1 -- -- 1 7 6 32 61 -- -- -- -- 106 107
Iraq -- -- -- -- 0 -- -- -- -- -- -- -- -- 0 0
Israel -- 2 -- 1 3 -- 1 2 3 -- -- -- -- 6 9
Jordan 1 -- 1 1 3 1 2 1 4 -- -- -- -- 8 11
Kuwait -- 1 -- -- 1 1 -- -- -- -- -- -- -- 1 2
Lebanon -- -- 1 -- 1 -- 4 2 4 -- -- -- -- 10 11
12

Undergraduate Graduate
Bachelors Non-degree Total Masters Doctorate Non-degree Professional Total Grand TotalFemale Male Female Male Female Male Female Male Female Male Female Male
Oman -- -- -- -- 0 -- -- -- -- -- -- -- -- 0 0
Palestinian Authority - Gaza Strip -- -- -- -- 0 -- -- -- -- -- -- -- -- 0 0
Palestinian Authority - West Bank -- -- -- -- 0 1 1 1 -- -- -- -- -- 3 3
Qatar -- -- -- -- 0 -- -- -- -- -- -- -- -- 0 0
Saudi Arabia 1 -- -- -- 1 2 6 1 -- -- -- -- -- 9 10
Syria -- 2 -- -- 2 -- -- -- -- -- -- -- -- 0 2
Turkey 2 18 1 -- 21 9 37 21 25 -- -- -- -- 92 113
United Arab Emirates -- 1 -- -- 1 -- 1 -- -- -- -- -- -- 1 2
Yemen -- -- -- -- 0 -- -- -- -- -- -- -- -- 0 0
NORTH AMERICA 21 38 0 0 59 8 12 15 26 0 0 1 2 64 123
Canada 21 38 -- -- 59 8 12 15 26 -- -- 1 2 64 123
OCEANIA 1 15 16 20 52 0 6 1 5 2 0 0 1 15 67
Australia 1 11 16 20 48 -- 5 -- 2 1 -- -- 1 9 57
Fiji -- -- -- -- 0 -- -- -- -- -- -- -- -- 0 0
Marshall Islands -- 1 -- -- 1 -- -- -- -- -- -- -- -- 0 1
Micronesia, Federated States of -- 1 -- -- 1 -- -- -- -- -- -- -- -- 0 1
New Zealand -- 2 -- -- 2 -- 1 1 3 1 -- -- -- 6 8
TOTAL 1397 2371 162 220 4150 762 815 887 1403 10 6 14 10 3907 8057
13

Undergraduate Graduate Grand TotalBachelors Non-Degree Total Masters Doctorate Non-Degree Professional Total
College of Agricultural, Consumer and Environmental Sciences 170 24 194 81 118 0 0 199 393
ACES General -- -- 0 -- -- -- -- 0 0
Agr Cons and Env Sci Adm -- 24 24 -- -- -- -- 0 24
Agricultural & Biol Engineering 16 -- 16 3 -- -- -- 3 19
Agricultural Cons and Env Sci -- -- 0 2 -- -- -- 2 2
Agriculture and Consumer Economics 64 -- 64 16 28 -- -- 44 108
Animal Sciences 5 -- 5 14 24 -- -- 38 43
Crop Sciences 5 -- 5 18 24 -- -- 42 47
Food Science and Human Nutrition 57 -- 57 18 24 -- -- 42 99
Human and Community Development 3 -- 3 -- 2 -- -- 2 5
Natural Resources and Env Sci 20 -- 20 7 9 -- -- 16 36
Nutritional Sciences -- -- 0 3 7 -- -- 10 10
College of Applied Health Sciences 31 1 32 15 39 0 0 54 86
AHS General -- -- 0 -- -- -- -- 0 0
Applied Health Sciences Administration -- 1 1 -- -- -- -- 0 1
Applied Health Sciences Crses -- -- 0 -- -- -- -- 0 0
Community Health -- -- 0 -- -- -- -- 0 0
Kinesiology 9 -- 9 12 25 -- -- 37 46
Recreation, Sport, and Tourism 17 -- 17 3 11 -- -- 14 31
Speech and Hearing Science 5 -- 5 -- 3 -- -- 3 8
Institute of Aviation 2 0 2 1 0 0 0 1 3
Institute of Aviation 2 -- 2 1 -- -- -- 1 3
College of Business 418 90 508 469 61 0 0 530 1038
Accountancy 205 -- 205 176 6 -- -- 182 387
Business 1 -- 1 -- -- -- -- 0 1
Business Administration 25 -- 25 68 32 -- -- 100 125
Business General -- -- 0 -- -- -- -- 0 0
College of Business 100 90 190 -- -- -- -- 0 190
Executive MBA Program -- -- 0 1 -- -- -- 1 1
Finance 87 -- 87 128 23 -- -- 151 238
MBA Program Administration -- -- 0 96 -- -- -- 96 96
College of Media 84 3 87 21 25 0 0 46 133
Advertising 59 -- 59 19 -- -- -- 19 78
Broadcasting Development -- -- 0 -- -- -- -- 0 0
Broadcasting General Administration -- -- 0 -- -- -- -- 0 0
Institute of Communications Research 2 -- 2 -- 25 -- -- 25 27
Journalism 13 -- 13 2 -- -- -- 2 15
Media Administration -- 3 3 -- -- -- -- 0 3
Media General -- -- 0 -- -- -- -- 0 0
Media and Cinema Studies 10 -- 10 -- -- -- -- 0 10
ENROLLMENT BY DEPARTMENT14

Undergraduate Graduate Grand TotalBachelors Non-Degree Total Masters Doctorate Non-Degree Professional Total
Division of General Studies 257 0 257 0 0 0 0 0 257
Div General Studies Admin 257 -- 257 -- -- -- -- 0 257
College of Education 6 0 6 20 107 0 0 127 133
Curriculum and Instruction 2 -- 2 8 43 -- -- 51 53
Education Administration 3 -- 3 -- -- -- -- 0 3
Educational Organization and Leadership -- -- 0 -- -- -- -- 0 0
Educational Policy Studies -- -- 0 1 1 -- -- 2 2
Educational Psychology -- -- 0 1 30 -- -- 31 31
Human Resource Education -- -- 0 10 29 -- -- 39 39
Special Education 1 -- 1 -- 4 -- -- 4 5
College of Engineering 1351 143 1494 468 1023 2 0 1493 2987
Aerospace Engineering 31 -- 31 37 32 2 -- 71 102
Bioengineering 6 -- 6 3 18 -- -- 21 27
Civil and Environmental Engineering 129 -- 129 137 132 -- -- 269 398
Computational Science and Engineering -- -- 0 -- -- -- -- 0 0
Computer Science 237 1 238 42 210 -- -- 252 490
Electrical and Computer Engineering 579 -- 579 78 185 -- -- 263 842
Engineering Administration 8 142 150 22 23 -- -- 45 195
Engineering Courses -- -- 0 54 -- -- -- 54 54
Engineering General -- -- 0 -- -- -- -- 0 0
Industrial and Enterprise Systems Engr 118 -- 118 7 44 -- -- 51 169
Manufacturing Engineering -- -- 0 -- -- -- -- 0 0
Materials Science and Engineerng 80 -- 80 7 83 -- -- 90 170
Mechanical Science and Engineering 128 -- 128 76 133 -- -- 209 337
Nuclear Plasma and Radiological Engineering 18 -- 18 5 32 -- -- 37 55
Physics 17 -- 17 -- 131 -- -- 131 148
Theoretical and Applied Mechanics -- -- 0 -- -- -- -- 0 0
College of Fine and Applied Arts 165 23 188 96 165 0 0 261 449
Architecture 77 -- 77 38 11 -- -- 49 126
Art and Design 43 -- 43 13 12 -- -- 25 68
Dance -- -- 0 -- -- -- -- 0 0
FAA -- -- 0 -- -- -- -- 0 0
FAA General -- -- 0 -- -- -- -- 0 0
Fine and Applied Arts Administration -- 23 23 -- -- -- -- 0 23
Landscape Architecture 13 -- 13 14 5 -- -- 19 32
Music 12 -- 12 18 120 -- -- 138 150
Theatre 3 -- 3 5 4 -- -- 9 12
Urban and Regional Planning 17 -- 17 8 13 -- -- 21 38
Institute of Labor and Industrial Relations 0 0 0 54 9 0 0 63 63
Labor and Industrial Relations -- -- 0 54 9 -- -- 63 63
15

ENROLLMENT BY DEPARTMENT
Undergraduate Graduate Grand TotalBachelors Non-Degree Total Masters Doctorate Non-Degree Professional Total
College of Liberal Arts and Sciences 1284 97 1381 263 690 7 0 960 2341
African American Studies 1 -- 1 -- -- -- -- 0 1
American Indian Studies Prgrm -- -- 0 -- -- -- -- 0 0
Animal Biology -- -- 0 -- -- -- -- 0 0
Anthropology 2 -- 2 -- 13 -- -- 13 15
Asian American Studies -- -- 0 -- -- -- -- 0 0
Astronomy 3 -- 3 -- 14 -- -- 14 17
Atmospheric Sciences -- -- 0 1 15 -- -- 16 16
Basic Sciences -- -- 0 -- -- -- -- 0 0
Basic Sciences Administration -- -- 0 -- -- -- -- 0 0
Biochemistry 20 -- 20 2 31 -- -- 33 53
Biophysics and Computational Biology -- -- 0 -- -- -- -- 0 0
Cell and Developmental Biology -- -- 0 -- 25 -- -- 25 25
Center for African Studies -- -- 0 2 -- -- -- 2 2
Chemical and Biomolecular Engineering 77 -- 77 2 45 -- -- 47 124
Chemistry 71 -- 71 -- 72 -- -- 72 143
Classics -- -- 0 1 -- -- -- 1 1
Communication 51 -- 51 5 2 -- -- 7 58
Comparative and World Literature 1 -- 1 4 4 -- -- 8 9
East Asian Languages and Cultures 3 -- 3 2 22 -- -- 24 27
Economics 321 -- 321 141 70 -- -- 211 532
English 7 -- 7 -- 10 2 -- 12 19
English As an International Language -- -- 0 10 -- 1 -- 11 11
Entomology -- -- 0 -- 9 -- -- 9 9
Environmental Studies Courses -- -- 0 -- -- -- -- 0 0
French 2 -- 2 -- 4 1 -- 5 7
Gender and Womens Studies -- -- 0 -- -- -- -- 0 0
Geography 1 -- 1 3 13 -- -- 16 17
Geology 2 -- 2 -- 11 -- -- 11 13
Germanic Languages and Literature -- -- 0 -- 4 2 -- 6 6
Global Studies Courses -- -- 0 -- -- -- -- 0 0
History 8 -- 8 -- 12 -- -- 12 20
LAS General -- -- 0 -- -- -- -- 0 0
Latin American and Caribbean Studies -- -- 0 1 -- -- -- 1 1
Latina/Latino Studies Program -- -- 0 -- -- -- -- 0 0
Liberal Arts & Sciences -- -- 0 -- -- -- -- 0 0
Liberal Arts and Sciences Administration 90 97 187 -- -- -- -- 0 187
Life Sciences 32 -- 32 -- -- -- -- 0 32
Linguistics 2 -- 2 22 17 -- -- 39 41
Mathematics 281 -- 281 29 81 -- -- 110 391
Microbiology -- -- 0 -- 17 -- -- 17 17
Molecular and Integrative Physiology -- -- 0 -- 10 -- -- 10 10
Philosophy 6 -- 6 -- 2 -- -- 2 8
Plant Biology -- -- 0 -- 6 -- -- 6 6
Political Science 37 -- 37 -- 5 -- -- 5 42
Program in Medieval Studies -- -- 0 -- -- -- -- 0 0
16
Undergraduate Graduate Grand TotalBachelors Non-Degree Total Masters Doctorate Non-Degree Professional Total
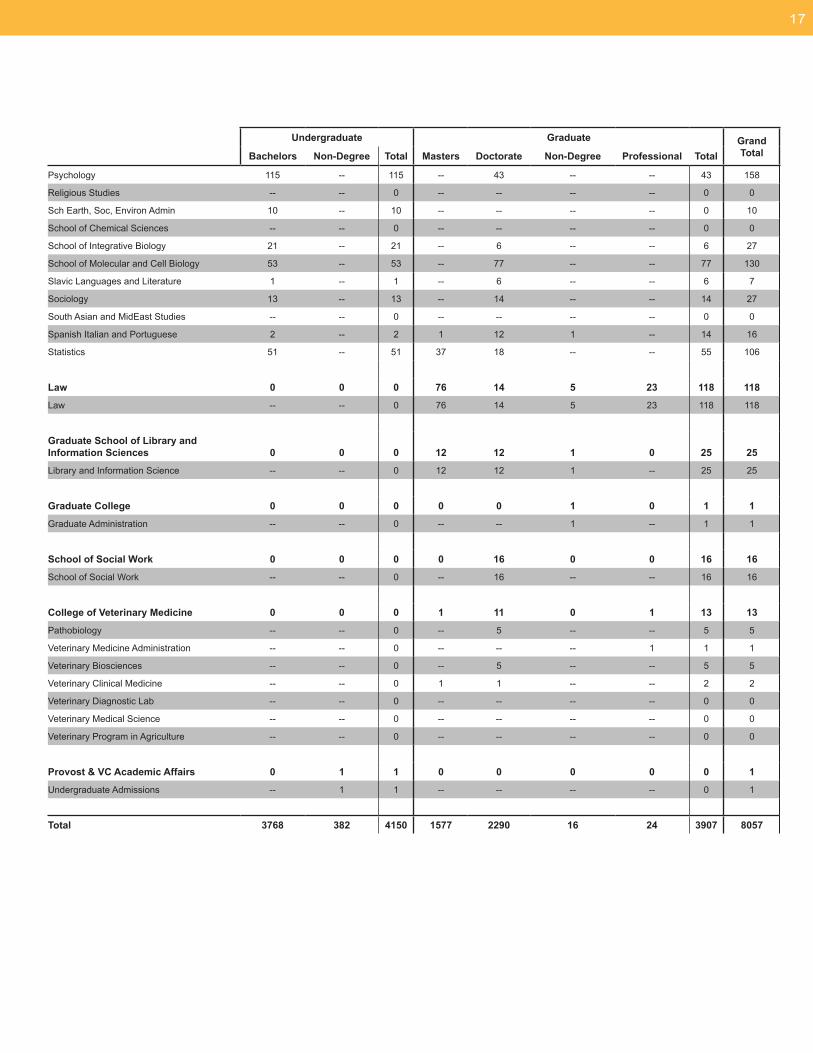
Psychology 115 -- 115 -- 43 -- -- 43 158
Religious Studies -- -- 0 -- -- -- -- 0 0
Sch Earth, Soc, Environ Admin 10 -- 10 -- -- -- -- 0 10
School of Chemical Sciences -- -- 0 -- -- -- -- 0 0
School of Integrative Biology 21 -- 21 -- 6 -- -- 6 27
School of Molecular and Cell Biology 53 -- 53 -- 77 -- -- 77 130
Slavic Languages and Literature 1 -- 1 -- 6 -- -- 6 7
Sociology 13 -- 13 -- 14 -- -- 14 27
South Asian and MidEast Studies -- -- 0 -- -- -- -- 0 0
Spanish Italian and Portuguese 2 -- 2 1 12 1 -- 14 16
Statistics 51 -- 51 37 18 -- -- 55 106
Law 0 0 0 76 14 5 23 118 118
Law -- -- 0 76 14 5 23 118 118
Graduate School of Library and Information Sciences 0 0 0 12 12 1 0 25 25
Library and Information Science -- -- 0 12 12 1 -- 25 25
Graduate College 0 0 0 0 0 1 0 1 1
Graduate Administration -- -- 0 -- -- 1 -- 1 1
School of Social Work 0 0 0 0 16 0 0 16 16
School of Social Work -- -- 0 -- 16 -- -- 16 16
College of Veterinary Medicine 0 0 0 1 11 0 1 13 13
Pathobiology -- -- 0 -- 5 -- -- 5 5
Veterinary Medicine Administration -- -- 0 -- -- -- 1 1 1
Veterinary Biosciences -- -- 0 -- 5 -- -- 5 5
Veterinary Clinical Medicine -- -- 0 1 1 -- -- 2 2
Veterinary Diagnostic Lab -- -- 0 -- -- -- -- 0 0
Veterinary Medical Science -- -- 0 -- -- -- -- 0 0
Veterinary Program in Agriculture -- -- 0 -- -- -- -- 0 0
Provost & VC Academic Affairs 0 1 1 0 0 0 0 0 1
Undergraduate Admissions -- 1 1 -- -- -- -- 0 1
Total 3768 382 4150 1577 2290 16 24 3907 8057
17

SUMMARY TABLES
Fall 2011 College SummaryUndergraduate Graduate Grand
TotalBachelors Non-Degree Total Masters Doctorate Non-Degree Professional Total
Agricultural, Consumer and Environmental Sciences 170 24 194 81 118 0 0 199 393
Applied Health Sciences 31 1 32 15 39 0 0 54 86
Institute of Aviation 2 0 2 1 0 0 0 1 3
Business 418 90 508 469 61 0 0 530 1038
Media 84 3 87 21 25 0 0 46 133
Division of General Studies 257 0 257 0 0 0 0 0 257
Education 6 0 6 20 107 0 0 127 133
Engineering 1351 143 1494 468 1023 2 0 1493 2987
Fine and Applied Arts 165 23 188 96 165 0 0 261 449
Institute of Labor and Industrial Relations 0 0 0 54 9 0 0 63 63
Liberal Arts and Sciences 1284 97 1381 263 690 7 0 960 2341
Law 0 0 0 76 14 5 23 118 118
Graduate School of Library and Information Sciences 0 0 0 12 12 1 0 25 25
Graduate College 0 0 0 0 0 1 0 1 1
School of Social Work 0 0 0 0 16 0 0 16 16
Veterinary Medicine 0 0 0 1 11 0 1 13 13
Provost & VC Academic Affairs 0 1 1 0 0 0 0 0 1
Total 3768 382 4150 1577 2290 16 24 3907 8057
Fall 2011 Regional SummaryUndergraduate Graduate
Bachelors Non-DegreeTotal
Masters Doctorate Non-Degree ProfessionalTotal Grand
TotalFemale Male Female Male Female Male Female Male Female Male Female Male
Africa 8 14 0 2 24 7 14 15 29 0 0 0 0 65 89
Asia 1347 2228 42 59 3676 677 647 680 1051 6 1 11 4 3077 6753
Europe 8 24 90 117 239 18 22 63 81 2 5 2 0 193 432
Latin America 8 25 11 20 64 31 55 53 111 0 0 0 3 253 317
Middle East 4 27 3 2 36 21 59 60 100 0 0 0 0 240 276
North America 21 38 0 0 59 8 12 15 26 0 0 1 2 64 123
Oceania 1 15 16 20 52 0 6 1 5 2 0 0 1 15 67
Total 1397 2371 162 220 4150 762 815 887 1403 10 6 14 10 3907 8057
18

INTERNATIONAL FACULTY & SCHOLARS

SUMMARY DATA
0 100 200 300 400 500
Philosophy and ReligionCommunications
Public Administration and Social Service Architecture and Environmental Design
OtherVisual and Performing Arts
Foreign Languages and LiteraturePsychology
Letters Law and Legal Studies
MathematicsFamily and Consumer Sciences
Social Sciences Area and Ethnic Studies
Health Sciences Education
Business and Management Agriculture
Library ScienceComputer and Information Sciences
Physical Sciences Biological and Biomedical Sciences
Engineering 484
212932
4760
8895
119121
138170
189196
11111217182121
48
0
500
1000
1500
2000
20112010200920082007
15411438
19121787
1630
Year
Data include the total number of International Faculty, Staff, and Scholars present at UIUC anytime from July 2010 through June 2011. Actual length of stay may range from a few weeks to several years.
International Faculty & Staff2007 - 2011
Field of Specialization
20
0 20 40 60 80 100 120
Physics
Coordinated Science Lab
Mortenson Ctr Intl Lib Prgms
Beckman Institute
Computer Science
Institute for Genomic Biology
Mechanical Sci & Engineering
Materials Science & Engr
Civil & Environmental Engr
Chemistry 102
56
62
69
71
75
79
89
94
51
Africa 3.0%
Asia 65.3%
Oceania 0.8%North America 2.4%
Europe 17.0%
Latin America 7.3%Middle East 4.2%
0
100
200
300
400
500
600
700
TurkeyJapanFranceCanadaTaiwanGermanyBrazilIndiaSouthKorea
China
645
207
45515960
197
45 4345
Distribution by RegionDistribution by GenderDistribution by Visa Type
Top 10 Countries
Top 10 Departments
Other1.8%H-1B
21.3%
J-176.9%
Female35.3% Male
64.7%
21
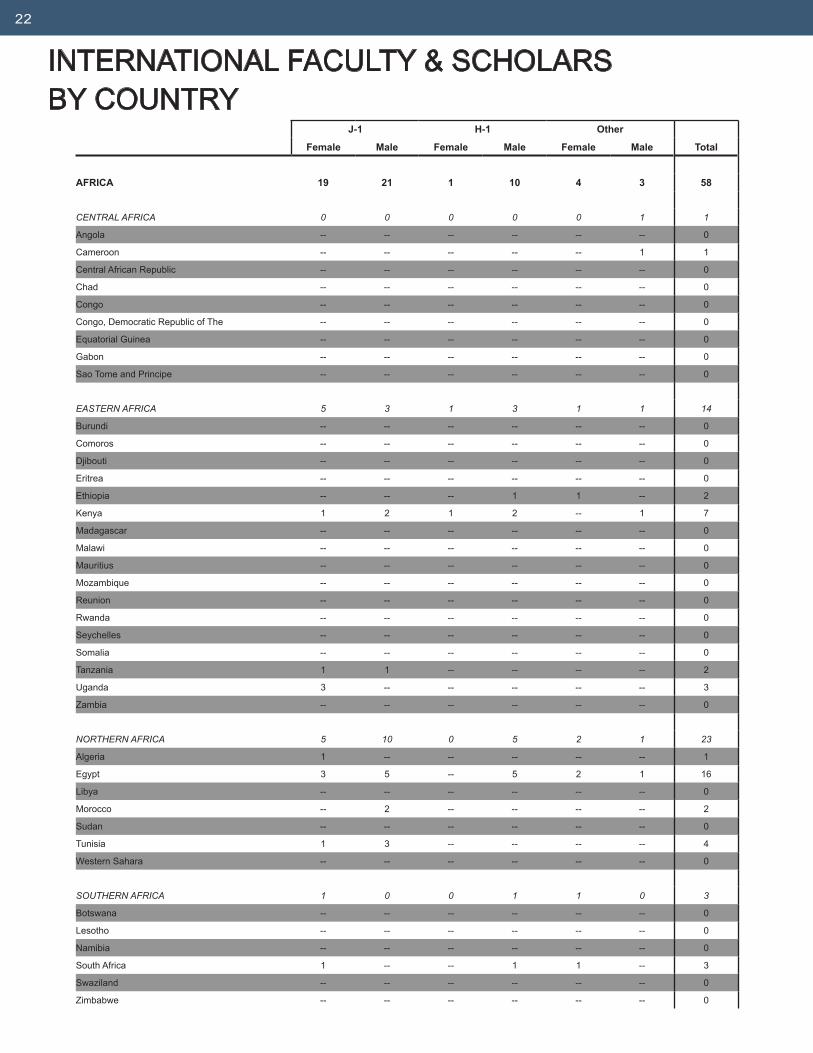
J-1 H-1 Other
Female Male Female Male Female Male Total
AFRICA 19 21 1 10 4 3 58
CENTRAL AFRICA 0 0 0 0 0 1 1
Angola -- -- -- -- -- -- 0
Cameroon -- -- -- -- -- 1 1
Central African Republic -- -- -- -- -- -- 0
Chad -- -- -- -- -- -- 0
Congo -- -- -- -- -- -- 0
Congo, Democratic Republic of The -- -- -- -- -- -- 0
Equatorial Guinea -- -- -- -- -- -- 0
Gabon -- -- -- -- -- -- 0
Sao Tome and Principe -- -- -- -- -- -- 0
EASTERN AFRICA 5 3 1 3 1 1 14
Burundi -- -- -- -- -- -- 0
Comoros -- -- -- -- -- -- 0
Djibouti -- -- -- -- -- -- 0
Eritrea -- -- -- -- -- -- 0
Ethiopia -- -- -- 1 1 -- 2
Kenya 1 2 1 2 -- 1 7
Madagascar -- -- -- -- -- -- 0
Malawi -- -- -- -- -- -- 0
Mauritius -- -- -- -- -- -- 0
Mozambique -- -- -- -- -- -- 0
Reunion -- -- -- -- -- -- 0
Rwanda -- -- -- -- -- -- 0
Seychelles -- -- -- -- -- -- 0
Somalia -- -- -- -- -- -- 0
Tanzania 1 1 -- -- -- -- 2
Uganda 3 -- -- -- -- -- 3
Zambia -- -- -- -- -- -- 0
NORTHERN AFRICA 5 10 0 5 2 1 23
Algeria 1 -- -- -- -- -- 1
Egypt 3 5 -- 5 2 1 16
Libya -- -- -- -- -- -- 0
Morocco -- 2 -- -- -- -- 2
Sudan -- -- -- -- -- -- 0
Tunisia 1 3 -- -- -- -- 4
Western Sahara -- -- -- -- -- -- 0
SOUTHERN AFRICA 1 0 0 1 1 0 3
Botswana -- -- -- -- -- -- 0
Lesotho -- -- -- -- -- -- 0
Namibia -- -- -- -- -- -- 0
South Africa 1 -- -- 1 1 -- 3
Swaziland -- -- -- -- -- -- 0
Zimbabwe -- -- -- -- -- -- 0
INTERNATIONAL FACULTY & SCHOLARS BY COUNTRY
22

J-1 H-1 Other
Female Male Female Male Female Male Total
WESTERN AFRICA 8 8 0 1 0 0 17
Benin -- -- -- -- -- -- 0
Burkina Faso -- -- -- -- -- -- 0
Cape Verde -- -- -- -- -- -- 0
Cote D Ivoire -- -- -- -- -- -- 0
Gambia, The -- -- -- -- -- -- 0
Ghana 2 2 -- 1 -- -- 5
Guinea -- -- -- -- -- -- 0
Guinea-Bissau -- -- -- -- -- -- 0
Liberia -- -- -- -- -- -- 0
Mali -- -- -- -- -- -- 0
Mauritania -- -- -- -- -- -- 0
Niger -- -- -- -- -- -- 0
Nigeria 6 6 -- -- -- -- 12
Saint Helena -- -- -- -- -- -- 0
Senegal -- -- -- -- -- -- 0
Sierra Leone -- -- -- -- -- -- 0
Togo -- -- -- -- -- -- 0
ASIA 300 596 73 183 37 60 1249
EAST ASIA 268 515 39 93 20 30 965
China 206 311 28 66 14 20 645
Hong Kong 9 4 -- 1 -- -- 14
Japan 7 32 3 2 1 -- 45
Macau 2 -- -- -- -- -- 2
Mongolia -- 1 -- -- -- -- 1
South Korea 28 136 7 22 5 9 207
Taiwan 16 31 1 2 -- 1 51
SOUTH AND CENTRAL ASIA 15 57 31 84 17 21 225
Afghanistan -- -- -- -- -- -- 0
Bangladesh -- 2 -- 2 1 1 6
Bhutan -- -- -- -- -- -- 0
India 14 47 28 72 16 20 197
Kazakhstan -- -- -- -- -- -- 0
Kyrgyzstan -- -- -- -- -- -- 0
Maldives -- -- -- -- -- -- 0
Nepal -- 1 -- 1 -- -- 2
Pakistan 1 6 1 8 -- -- 16
Sri Lanka -- -- 2 1 -- -- 3
Tajikistan -- -- -- -- -- -- 0
Turkmenistan -- -- -- -- -- -- 0
Uzbekistan -- 1 -- -- -- -- 1
23
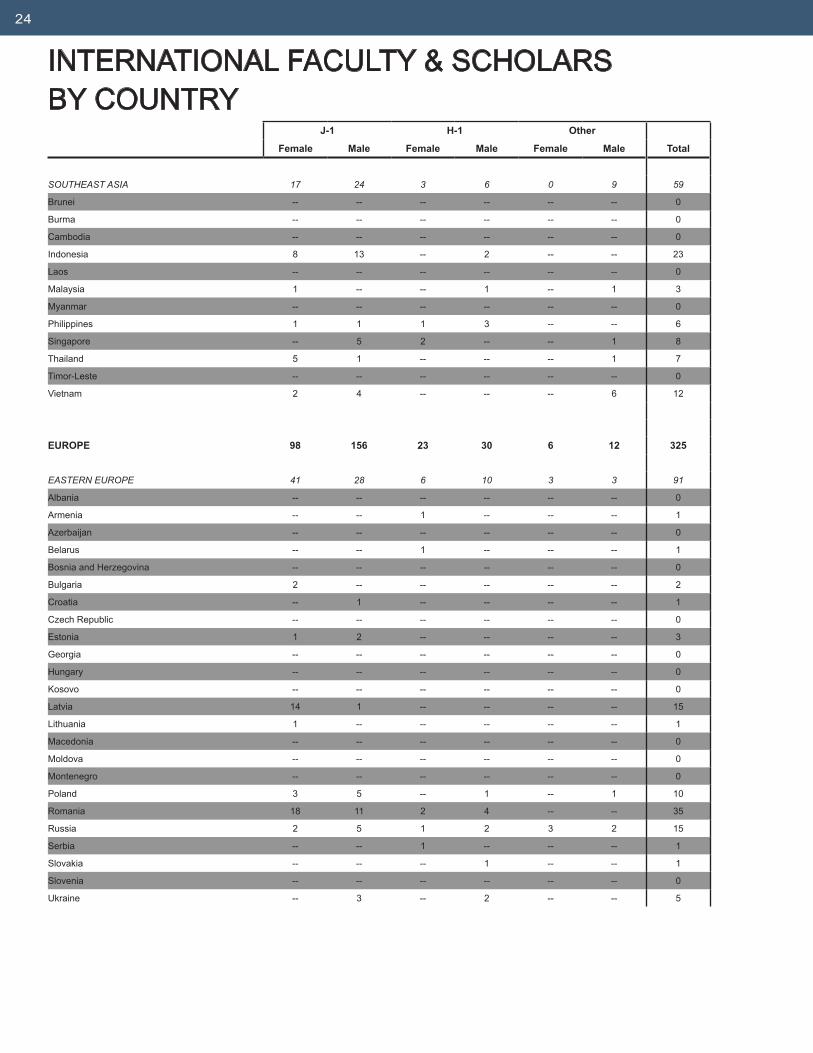
INTERNATIONAL FACULTY & SCHOLARS BY COUNTRY
J-1 H-1 Other
Female Male Female Male Female Male Total
SOUTHEAST ASIA 17 24 3 6 0 9 59
Brunei -- -- -- -- -- -- 0
Burma -- -- -- -- -- -- 0
Cambodia -- -- -- -- -- -- 0
Indonesia 8 13 -- 2 -- -- 23
Laos -- -- -- -- -- -- 0
Malaysia 1 -- -- 1 -- 1 3
Myanmar -- -- -- -- -- -- 0
Philippines 1 1 1 3 -- -- 6
Singapore -- 5 2 -- -- 1 8
Thailand 5 1 -- -- -- 1 7
Timor-Leste -- -- -- -- -- -- 0
Vietnam 2 4 -- -- -- 6 12
EUROPE 98 156 23 30 6 12 325
EASTERN EUROPE 41 28 6 10 3 3 91
Albania -- -- -- -- -- -- 0
Armenia -- -- 1 -- -- -- 1
Azerbaijan -- -- -- -- -- -- 0
Belarus -- -- 1 -- -- -- 1
Bosnia and Herzegovina -- -- -- -- -- -- 0
Bulgaria 2 -- -- -- -- -- 2
Croatia -- 1 -- -- -- -- 1
Czech Republic -- -- -- -- -- -- 0
Estonia 1 2 -- -- -- -- 3
Georgia -- -- -- -- -- -- 0
Hungary -- -- -- -- -- -- 0
Kosovo -- -- -- -- -- -- 0
Latvia 14 1 -- -- -- -- 15
Lithuania 1 -- -- -- -- -- 1
Macedonia -- -- -- -- -- -- 0
Moldova -- -- -- -- -- -- 0
Montenegro -- -- -- -- -- -- 0
Poland 3 5 -- 1 -- 1 10
Romania 18 11 2 4 -- -- 35
Russia 2 5 1 2 3 2 15
Serbia -- -- 1 -- -- -- 1
Slovakia -- -- -- 1 -- -- 1
Slovenia -- -- -- -- -- -- 0
Ukraine -- 3 -- 2 -- -- 5
24

J-1 H-1 Other
Female Male Female Male Female Male Total
WESTERN EUROPE 57 128 17 20 3 9 234
Andorra -- -- -- -- -- -- 0
Austria 1 3 1 1 -- -- 6
Belgium -- 4 -- -- -- -- 4
Denmark 1 2 -- -- -- -- 3
Finland -- 1 1 -- -- 1 3
France 11 30 2 2 -- -- 45
Germany 9 41 2 4 -- 3 59
Greece 3 5 -- 1 -- -- 9
Iceland -- -- -- -- -- -- 0
Ireland 1 1 -- -- 1 -- 3
Italy 13 15 4 4 2 -- 38
Liechtenstein -- -- -- -- -- -- 0
Luxembourg -- -- -- -- -- -- 0
Malta -- -- -- -- -- -- 0
Monaco -- -- -- -- -- -- 0
Netherlands 2 2 -- -- -- -- 4
Norway -- -- -- -- -- -- 0
Portugal 2 4 -- 1 -- 1 8
San Marino -- -- -- -- -- -- 0
Spain 9 11 3 3 -- 3 29
Sweden 2 1 -- -- -- 1 4
Switzerland 1 2 -- 1 -- -- 4
United Kingdom 2 6 4 3 -- -- 15
Vatican City -- -- -- -- -- -- 0
LATIN AMERICA 42 51 15 11 12 9 140
CARIBBEAN 1 0 1 0 2 0 4
Anguilla -- -- -- -- -- -- 0
Antigua and Barbuda -- -- -- -- -- -- 0
Aruba (Netherlands) -- -- -- -- -- -- 0
Bahamas, The -- -- -- -- -- -- 0
Barbados -- -- 1 -- -- -- 1
Bermuda -- -- -- -- -- -- 0
British Virgin Islands -- -- -- -- -- -- 0
Cayman Islands -- -- -- -- -- -- 0
Cuba -- -- -- -- -- -- 0
Dominica -- -- -- -- -- -- 0
Dominican Republic 1 -- -- -- 1 -- 2
Grenada -- -- -- -- -- -- 0
Guadeloupe -- -- -- -- -- -- 0
Haiti -- -- -- -- -- -- 0
Jamaica -- -- -- -- -- -- 0
Martinique -- -- -- -- -- -- 0
Montserrat -- -- -- -- -- -- 0
25

INTERNATIONAL FACULTY & SCHOLARS BY COUNTRY
J-1 H-1 Other
Female Male Female Male Female Male Total
Netherlands Antilles -- -- -- -- -- -- 0
Puerto Rico -- -- -- -- -- -- 0
Saint Kitts and Nevis -- -- -- -- -- -- 0
St. Lucia -- -- -- -- -- -- 0
St. Vincent -- -- -- -- -- -- 0
Trinidad & Tobago -- -- -- -- 1 -- 1
CENTRAL AMERICA AND MEXICO 13 14 2 0 2 4 35
Belize -- -- -- -- -- -- 0
Costa Rica -- -- -- -- -- -- 0
El Salvador 1 -- -- -- -- -- 1
Guatemala -- -- -- -- -- 1 1
Honduras 3 3 -- -- -- -- 6
Mexico 9 11 2 -- 1 2 25
Nicaragua -- -- -- -- -- 1 1
Panama -- -- -- -- 1 -- 1
SOUTH AMERICA 28 37 12 11 8 5 101
Argentina 3 2 1 3 2 -- 11
Bolivia -- 1 1 -- -- -- 2
Brazil 18 24 7 6 3 2 60
Chile 1 2 2 -- -- -- 5
Colombia 4 7 -- -- 3 -- 14
Ecuador -- 1 -- -- -- 1 2
French Guiana -- -- -- -- -- -- 0
Guyana -- -- -- -- -- 1 1
Paraguay -- -- -- -- -- -- 0
Peru 1 -- -- -- -- 1 2
Suriname -- -- -- -- -- -- 0
Uruguay -- -- -- -- -- -- 0
Venezuela 1 -- 1 2 -- -- 4
MIDDLE EAST 19 32 2 11 5 11 80
Bahrain -- -- -- -- -- -- 0
Cyprus -- -- -- -- 1 -- 1
Iran 1 7 1 2 -- 4 15
Iraq -- -- -- -- -- -- 0
Israel 3 5 -- 4 1 3 16
Jordan -- 2 -- -- -- 1 3
Kuwait -- -- -- -- -- -- 0
Lebanon -- -- -- -- -- -- 0
Oman -- 1 -- -- -- -- 1
Palestinian Authority - Gaza Strip -- -- -- -- -- -- 0
Palestinian Authority - West Bank -- -- -- -- -- -- 0
Qatar -- -- -- -- -- -- 0
Saudi Arabia -- -- -- -- -- -- 0
Syria -- -- -- -- -- -- 0
26

J-1 H-1 Other
Female Male Female Male Female Male Total
Turkey 15 17 1 5 3 2 43
United Arab Emirates -- -- -- -- -- -- 0
Yemen -- -- -- -- -- 1 1
NORTH AMERICA 6 9 7 7 4 12 45
Canada 6 9 7 7 4 12 45
OCEANIA 1 6 0 3 1 4 15
Australia 1 5 -- 1 1 4 12
Fiji -- -- -- -- -- -- 0
Marshall Islands -- -- -- -- -- -- 0
New Zealand -- 1 -- 2 -- -- 3
TOTAL 485 871 121 255 69 111 1912
27


International Student & Scholar ServicesUniversity of Illinois at Urbana-Champaign400 Turner Student Services Building610 E. John St.Champaign, IL 61820
isss.illinois.edu