Fall 2009 Workshop Level 1 Energy Audits - Energy Use Analysis - - Walk Through Analysis - Mr. Matt...
40
Fall 2009 Workshop Level 1 Energy Audits - Energy Use Analysis - - Walk Through Analysis - Mr. Matt O’Brien, AIA, LEED AP November 17, 2009
-
Upload
ryley-mattingly -
Category
Documents
-
view
216 -
download
4
Transcript of Fall 2009 Workshop Level 1 Energy Audits - Energy Use Analysis - - Walk Through Analysis - Mr. Matt...

Fall 2009 Workshop
Level 1 Energy Audits - Energy Use Analysis -
- Walk Through Analysis -
Mr. Matt O’Brien, AIA, LEED AP
November 17, 2009

Program Development
Establish Utility Baseline
Facility Audits (Existing Conditions)
Behavior Management Low Cost/No Cost System Design
Evaluate Results
Reinvest Savings
Develop Energy Conservation Measures (ECM)
Implementation(Individualized School Plan)
System Intervention
Evaluate Results
Implementation(Individualized School Plan)
Reinvest Savings
Evaluate Results
Implementation(Individualized School Plan)
Today’s Focus (Matt O’Brien)
Agendas and Focus

PEA = Preliminary Energy Audit(use “New” ECM form)
DES = Detailed Energy Survey(implies modeling)
SEP = Strategic Energy Plan (and Water Plan)SEP
Definitions:PEA’s, DES’s, SEP’s & M&V’s
m & V = measurement & Verification
M & v = Measurement & verification

The Preliminary Energy Audit involves
collecting data about
the building from
construction and
maintenance records
and from a walk-thru
of the building.
Step 1 of the Strategic Energy Plan:PEA’s (Data Collection)

Why are Energy Audits Important ?

The results from an energy audit show you:
1. How efficiently your building is operating

The results from an energy audit show you:
1. How efficiently your building is operating
2. How you can increase efficiency using low cost or no cost changes in operation

The results from an energy audit show you:
1. How efficiently your building is operating
2. How you can increase efficiency using low cost or no cost changes in operation
3. How, with a capital investment, you can increase efficiency and reliability, and decrease maintenance costs

The Energy Utilization Index (EUI)
+If your building has utility meters, you can identify the least efficient buildings by calculating the EUI for each metered building.
+ Buildings with a high EUI are probably wasting energy and money, and they are the best candidates for an energy “tune-up”.

Energy Performance Indicators:
YEARkBTU/S.F./AREABUILDINGTOTAL
YEARPERUSAGEENERGYTOTALEUI
R$/S.F./YEAAREABUILDINGTOTAL
YEARPERCOSTENERGYTOTALECI

How do I calculate the EUI for my building?
Since:
1 kW-hr = 3,412 BTUs (Electric Bill)
and
1 Therm = 100,000 BTUs (Gas Bill)
and
The building = 63,609 square feet
then

How do I calculate the EUI for my building?
Electrical Energy consumption: 1/1/08 to 12/31/08: 718,613 kW-hr. Natural Gas consumption: 1/1/08 t0 12/31/08: 10,819 therms.
Based on the two values, the energy utilization index (EUI) and the energy cost index (ECI) are:
55.56 kBTU/SF/YR and 1.09 $/kBTU/SF/YR
ENERGY TYPE TOTAL ANNUAL USE
UNITS CONVERSION MULTIPLIER TO THOUSANDS BTU
THOUSAND BTU (kBTU)
TOTAL ANNUAL COST ($)
ELECTRICITY 718,613 kW-H 3,412/1000 = 3.412 2,451,907 54,174
NATURAL GAS 10,819 Therms 100,000/1000 = 100 1,081,900 15,116
Total 3,533,807 63,609 =
EUI=55.56
69,290 63,609 =
ECI=1.09

Compare EUI to a data base of similar building types:
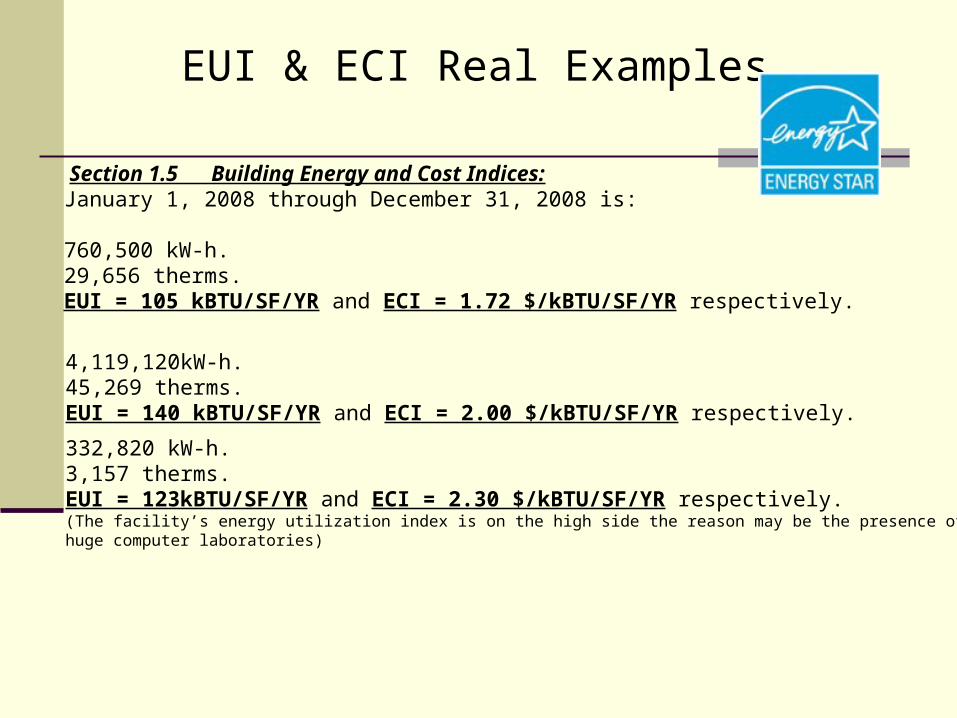
EUI & ECI Real Examples
Section 1.5 Building Energy and Cost Indices:January 1, 2008 through December 31, 2008 is: 760,500 kW-h. 29,656 therms. EUI = 105 kBTU/SF/YR and ECI = 1.72 $/kBTU/SF/YR respectively.
4,119,120kW-h. 45,269 therms. EUI = 140 kBTU/SF/YR and ECI = 2.00 $/kBTU/SF/YR respectively.
332,820 kW-h. 3,157 therms. EUI = 123kBTU/SF/YR and ECI = 2.30 $/kBTU/SF/YR respectively. (The facility’s energy utilization index is on the high side the reason may be the presence of two huge computer laboratories)

What if buildings are not individually metered ?
+ Not having individual meters makes the task of prioritizing your energy “tune-up” program difficult.
+ However, larger, older buildings with central air conditioning and central heating are probably the least energy efficient and should be placed at the top of
the priority list.
+ Sub-Metering devices

The “HOBO” Option
Guilford County & GTCC In-House Electricians Aiding Installation of
CT DataLoggers for M & V Study

Preliminary Energy Audit Findings
Top Ten Low-Cost and No Cost Items 1. High or Low thermostat settings 2. Lights left “on” in unoccupied rooms 3. Dripping hot water faucets 4. Windows open when HVAC system is “on” 5. No weather stripping around doors 6. No caulking around windows 7. Heating boilers left idling during warm weather 8. Dirty coils in HVAC equipment 9. Clogged filters in HVAC equipment 10. Incandescent light bulbs

CERT’s ECM Tally Sheet-Top Ten (Summer 2008)
Note: All 40 buildings were candidates for Performance Contracting. (We were unable to obtain energy bills in most cases)
HITS ENERGY CONSERVATION MEASURE35 Occupancy sensors should be installed.21 Replace existing T-12’s with T-8’s and magnetic ballasts.18 Remove lighting from vending machines or install vending misers.17 Install 1.6 gpf water closets and .5 gpf urinals and low flow faucets in rest rooms.13 Economizer needed in the building.8 Provide optimum stop-start system for the HVAC system.8 24/7 exhaust fans, ventilation & water heaters to be put on timer & be OFF overnight.7 Exit lights should be replaced with LED.7 Chiller approach should be set to 10°F – It is currently about 4.8°F.6 Install programmable T-stats in all zones with set-back capabilities.

Once no cost and low cost opportunities have been identified, then what? 1. Leadership team awareness and support 2. Monitor progress by installing meters
and/or sub-meters. 3. Education program for occupants and maintenance staff. 4. Make repairs and publicize energy-use
reductions on a quarterly basis.
Step 2 of the Strategic Energy Plan:Evaluate Results & Develop Plan

Step 3 of the Strategic Energy Plan:DES’s (Quantify Energy Savings)
The Detailed Energy Survey identifies and quantifies capital investment opportunities that will increase HVAC system and lighting system efficiency and reliability, and will decrease maintenance costs.
The Detailed Energy Audit is conducted by a professional engineer who calculates utility savings, engineering design costs, construction costs, and payback.

Energy Simulations: Consumption
Fig.3: 2008 Electric Energy Consumption
0
20000
40000
60000
80000
100000
120000
Month
Cons
umpti
on(k
Wh)
Billing Data(kWh)Simulation Data(kWh)

Energy Simulations: Demand
Fig. 4: 2008 Electric Power Demand
0
50
100
150
200
250
300
350
400
450
Jan'08
Feb'08
Mar'08
Apr'08
May'08
Jun'08Jul'0
8
Aug'08
Sept'0
8
Oct'08
Nov'08
Dec'08
Month
Dem
and(
kW)
Billing data(kW) Simulation Data(kW)

Energy Simulations: Savings
Energy Conservation Measure (ECM)
Cost($) Savings (kWh)/yr.
Dollar Savings/yr.
Percentage Savings/yr.
Option 1A 1531 11295 678 1.3%
Option 1B1 320 8285 500 1%
Option 2A 35,000 43,166 2,590 4.7%
Option 2B 3,000 16,583 995 1.8%
Option 2C 3,000 50,000 850 1.5%
Option 2D 10,000 166,666 2,359 4.3%

Detailed Energy Audit
Top SIX Energy Investment Opportunities1. Lighting replacement, occupancy sensors, and day-lighting controls.2. Installing state-of-the-art HVAC controls3. Installing variable speed drives on pumps and fans.4. Updating outside air economizer controls.5. Installing energy recovery units.6. Replacing old, inefficient HVAC boilers and
chillers,

Step 5 of the Strategic Energy Plan:Capital Project Implementation (Steps 4 and 6 are M&V’s)
Selecting capital projects by choosing only projects
with short paybacks, like relamping.
Example: Replacing T12, 34 watt fluorescent lamps with T8, 25 watt lamps and electronic ballast:
Estimated Savings $ 13,981 / year Estimated Cost: $ 39,597 Simple payback period: 2.8 years

Step 5 of the Energy Management Program: Capital Project Implementation
Accepting a longer payback and funding more
Projects, like motor replacement.
Example: Replace the 75 hp Motor with Premium Energy Efficient Motor
Estimated Savings: $ 905 / year Estimated Cost: $ 4,436 Simple payback period: 4.9 years It is assumed that the motor is operated 6000 hour/year.

Means of Capital Project Funding
Raise construction funds (bonds, gifts) Hire an architect and engineer to prepare
plans Bid the project Monitor Construction Commission the project
Performance Contracting Select a performance contractor Sign the contract

Steps 4 & 6 of the Strategic Energy Plan: M & V (Measurement & Verification)
Based on a year of actual operation, did the retrofit project reduce energy costs as predicted?
Attend Dr. Rojeski’s presentation tomorrow.

Review and Questions
1. Data Collection – PEA
2. Evaluate Results/Develop Plan
3. Quantify Energy Savings – DES
4. Establish Baseline - M & v
5. Implement Plan
6. Verify/Validate - m & V
Data Collection
Develop Plan
Implement Plan
Measure Results
Evaluate Results

Page 1 of the “NEW” SEO ECM

Page 2

Page 3

Page 4

Page 5

Page 6

Page 7

Page 8

Page 9

Page 10

Page 11