Fall 1991 PROFITABILITY OF CHEDDAR CHEESE …Barbano...Financial assistance for the overall cheese...
36
ANDREW M. NovA KOV1C Fall 1991 PROFITABILITY OF CHEDDAR CHEESE AND WHEY PRODUCT MANUFACTURE, NEW YORK AND WISCONSIN, 1989-1991 Richard D. Aplin David M. Barbano Susan]. Hurst Part 6 of a Research Effort on Cheddar Cheese Manufacturing A Publication of the Cornell Program on Dairy Markets and Policy Department of Agricultural Economics Cornell University Agricultural Experiment Station New York State College of Agriculture and Life Sciences A Statutory College of the State University Cornell University, Ithaca, New York 14853
Transcript of Fall 1991 PROFITABILITY OF CHEDDAR CHEESE …Barbano...Financial assistance for the overall cheese...
ANDREW M. NovAKOV1C
Fall 1991
PROFITABILITY OF CHEDDAR CHEESE AND WHEY PRODUCT MANUFACTURE, NEW YORK AND WISCONSIN, 1989-1991
Richard D. Aplin David M. Barbano
Susan]. Hurst
Part 6 of a Research Effort on Cheddar Cheese Manufacturing
A Publication of the Cornell Program on Dairy Markets and Policy
Department of Agricultural Economics Cornell University Agricultural Experiment Station
New York State College of Agriculture and Life Sciences A Statutory College of the State University Cornell University, Ithaca, New York 14853
PREFACE
Richard D. Aplin, David M. Barbano, and Susan J. Hurst are Professor of Agricultural Economics, Associate Professor of Food Science, and former Research Associate, Department of Agricultural Economics; New York State College of Agriculture and Life Sciences, Cornell University, respectively.
This publication is the sixth in a series of publications on Cheddar Cheese manufacturing. The series of publications reports the results of a major research effort aimed at helping to answer questions such as the following:
1. How do aged Cheddar cheese plants in the Northeast differ from plants in Wisconsin, Minnesota and other important cheese-producing states with respect to efficiency and other key factors affecting their economic perfonnance?
2. How much do operational factors, such as number of operating days per week. number of shifts per day, yield potential of milk supplies and recovery of solids at the plant affect the costs of production?
3. What are the differences in costs among plants using the most modem commercial technologies (e.g., continuous systems) and those using more traditional batch systems for manufacturing Cheddar cheese?
4. How large a cost advantage do large Cheddar cheese plants have over smaller-scale plants?
5. What is the feasibility and what would be the impact on plant costs of using some of the production capacity in Cheddar cheese plants to produce other cheeses includin& perhaps, some specialty, European-style cheeses?
6. What are the costs and relative profitability of producing whey powder and whey protein concentrate? What are key factors affecting the costs of producing these whey products?
7. What would be the impact on manufacturL"lg costs and profits of using milk fractionation and concentration processes (i.e., ultrafiltration, reverse osmosis and evaporation) in Cheddar cheese plants?
These questions are addressed in earlier publications which reported on the study of 11 plants operating in the Northeast and North Central regions and on the cost of manufacturing under various conditions as estimated by the economic-engineering method.
This publication reports the results of using the cost estimating procedures developed in earlier studies, together with information on raw milk costs and product selling prices, to estimate the profitability of Cheddar cheese/whey product manufacturing operations in New York and Wisconsin during the 28-month period ending April 1991.
Financial assistance for the overall cheese manufacturing cost and profitability project has been provided from four sources: 1) Agricu.Itural Cooperative Service of the United States Department of Agriculture, 2) New York State Department of Agriculture and Markets, 3) New York State's dairy fanners through the New York State Milk Promotion Order, and 4) the Wisconsin Milk Marketing Board. In addition, funds to publish much of the research were partially provided by the Cornell Program on Dairy Markets and Policy, through a grant from the New York State Department of Agriculture and Markets . .
Many have contnbuted importantly to the development and success of this project. Cornell University contracted with Mead & Hunt, Inc., an engineering consulting firm based in Madison, Wisconsin, with broad experience in various industries including cheese, to provide much of the infonnation needed to budget costs.
Scott McPherson helped write the computer programs needed for data analysis. Mary Jo DuBrava did an excellent job in typing and processing the manuscript. We thank them both.
Constructive criticisms of the manuscript were made by Andrew Novakovic and James Pratt of Cornell's Department of Agricultural Economics, by members of the Division of Dairy Industry Services in the N.Y.s. Department of Agriculture and Markets, and by a number of people in industry.
For copies of this publication or others in the series, contact:
R.D. Aplin Department of Agricu.ltural Economics
Cornell University 357 Warren Hall
Ithaca, New York 14853
ii
DIGEST AND HIGHLIGHTS
Objectives and Methodology
The objective of this phase of the research was to estimate the profitability of manufacturing Cheddar cheese and whey powder or WPC under New York and Wisconsin a:m.ditions during the 28-month period ending April 1991.
Monthly infOimation on milk composition, product yields, raw milk costs, and on selling prices of Cheddar cheese, whey powder and WPC (f.o.b. the manufacturing plant) were obtained. These data were used in conjunction with manufacturing cost estimation procedures developed and reported earlier to estimate monthly profits and losses for the two states.
The profit and lost estimates reflect only the manufacture of high-quality, fresh Cheddar cheese ready for aging, as well as the manufacture of the associated whey into either whey powder or wpe. The profitability estimates do not reflect the costs, added revenues or profits from cheese aging, cheese or whey marketing or overall corporate a dministra lion.
Results
The profitability estimates indicate that it was very difficult to realize profits in manufacturing Cheddar cheese and whey powder during the period from January 1, 1989 through April 30, 1991. The situation deteriorated from 1989 to 1990.
A hypothetical, but realistic Cheddar cheese/whey powder plant in New York with a capacity of 960,000 lbs of milk. per day would have been profitable in only 12 of the 28 months ending April 1991. This 960,000 lbs per day plant, which is about the size of some of the largest Cheddar plants in New York State, would have realized small profits in 1989 but substantial losses in 1990 and in the first four months of 1991 as well as for the overall 28-month period. Because of substantial economies of scale in Cheddar/whey powder manufacturing, the two larger plants studied for New York (i .e. capacities of 1,440,000 and 1,800,000 lbs of milk. per day) would have realized profits in most (but not all) months as well as overall for the 28-month period .
Although the profitability situation for Cheddar /whey powder operations appears to have not been very favorable in New York, it appears to have been even worse in Wisconsin during the 28-month period. The higher cheese yields due to the higher fat and protein content of Wisconsin rnilk. would not have offset the higher premiums realized on high quality, New York fresh Cheddar suitable for aging and the lower cost of raw milk. in New York. Even the largest hypothetical plant analyzed for Wisconsin conditions (Le. capacity of 2,400,000 Ibs of milk per day) showed profits for only 5 months in the 28-month period ending April 1991, if producing whey powder. Moreover this 2,400,000 lbs of milk per day plant would have had losses overall for the 28-month period. The 1,440,000 and 1,800,000 lbs per day plants were only profitable in one of the 28 months.
iii

Assuming the plant broke even on handling WPC permeate, manufacturing WPC instead of whey powder improved profitability results very substantially in both New York and Wisconsin. However, the profit advantage that the plants prod ueing WPC had over those converting their whey into powder decreased during the 28-month period as the price of WPC relative to whey powder declined.
IV
TABLE OF CONTENTS
PREFACE
DIGEST AND l-iIGHLIGH1'S ............................. . ............... iii
INTRODUCTION AND BACKGROUND .................................... 1
S'rUDY OBJECTIVE ............................ . ....................... 1
APPROACH USED IN ESTIMATING PROFITABILITY ........... . ............. 1
Raw Milk Costs .................. .... . .................... . ....... 1
New York. . . . . .. .. .. ... . . . . . . . . . . . . ... .. . . . . . . . . . . . . . . . . .. 1
Wisconsin ........ . ......... . .......... . . . . . . . . . . . . . . . . . . .. 2
Milk Composition and Yields. . . . . . . . . . . . . . . . . . . . . . . . . . . . . . . . . . . . . . .. 2
Cheese and Whey Product Manufacturing Costs ...... . .................. 2
Product Prices ..................... . .......... . ................ . . 6
Cheddar Cheese ................... . .......... . .......... . .. 6
Comparison of Milk Costs and Product Prices. . . . . . . . . . . . . . . . . . . . . . . . . .. 6
New York. . . .. . . . . . . . . . . . . . . . . . . . . .. .. . . . . .. . . . . . . . . . . . . .. 6
Wisconsin ........... . .................................... , 9
Technique for Estimating Profitability .......... . ......... . ............ 9
PROFITABILITY ESTIMATES FOR NEW YORK . . .... . ................. . ..... , 9
PROFITABILITY ESTIMA TES FOR WISCONSIN ............................. 15
COMP ARISON OF NEW YORK AND WISCONSIN PROFIT ABILITIES .......... " 25
FACTORS AFFECTING COSTS AND PROFITABILITY ................... . .. . . 27
REFERENCES . . . . . . . . . . . . . . . . . . . . . . . . . . . . . . . . . . . . . . . . . . . . . . . . . . . . . . .. . 28
v
UST OF TABLES
Table 1 New York Milk Composition and Assumed Product Yields ............ " 3
Table 2 WISCOnsin Milk Composition and Assumed Product Yields ............ " 4
Table 3 Estimated Manufacturing Costs for Cheddar, Whey Powder, and WPC for Cheese Plant With Capacity of 960,000 Pounds of Milk Per Day ...... .-... 7
Table 4 Example of Profitability Calculations for Cheddar and Whey Powder Production in a 960,000 Lb Capacity Cheddar Plant in New York Using 1990 Average Yields and Product Prices. . . . . . . . . . . . . . . . . . . . . . . . . . . . 13
Table 5 Number of Months Cheddar and Whey Powder Manufacture Profitable, New York, Different Size Plants, 1989, 1990, and January - April 1991. . . . . . . . . . . . . . . . . . . . . . . . . . . . . . . . . . . . . . . . . . . . . . . . . . . . . . .. 16
Table 6 Estimated Average Profitability of Cheddar and Whey Powder Manufacture, New York, Different Size Plants, 1989, 1990, and January -April 1991 .................................................. 17
Table 7 Number of Months Cheddar and WPC Manufacture Profitable, New .YQrk, Different Size Plants, 1989, 1990, and January - April 1991 ......... 18
Table 8 Estimated Average Profitability of Cheddar and WPC Manufacture, New York, Different Size Plants, 1989, 1990, and January - April 1991 ......... 19
Table 9 Number of Months Cheddar and Whey Powder Manufacture Profitable, Wisconsin, Different Size Plants, 1989, 1990, and January - April 1991 21
Table 10 Estimated Average Profitability of Cheddar and Whey Powder Manufacture, Wisconsin, Different Size Plants, 1989, 1990, and January -April 1991. .................................................. 22
Table 11 Number of Months Cheddar and WPC Manufacture Profitable, Wisconsin, Different Size Plants, 1989, 1990, and January - April 1991 23
Table 12 Estimated Average Profitability of Cheddar and WPC Manufacture, Wisconsin, Different Size Plants, 1989, 1990, and January - April 1991. 24
Table 13 Estimated Differences Between Cheddar Cheese/Whey Powder Manufacturing Operations in New York and Wisconsin, 1989, 1990 and January -April 1991 26
vi
UST OF FIGURES
Figure 1. Estimated Raw Milk Cost For New York Compared To The National Cheese Exchange 40 Lb Block. + $.17 Premium ..... . ........... . .... " 8
Figure 2. Estimated New York Prices For Cheese, Whey Powder and WPC ....... . 10
Figure 3. Estimated Raw Milk Costs For Wisconsin Compared To The National Cheese Exchange 40 Lb Block + $.05 Premium . . . . . . . . . . . . . . . . . . . . . . . 11
Figure 4. Estimated Wisconsin Prices For Cheese, Whey Powder and WPC . .. .. . .. 12
Figure 5. Estimated Profitability Of Cheddar & Whey Powder. 960,000 Lb Capacity Plant, New York Price And Yield Conditions. . . . . . . . . . . . . . . . . . . . . . .. 14
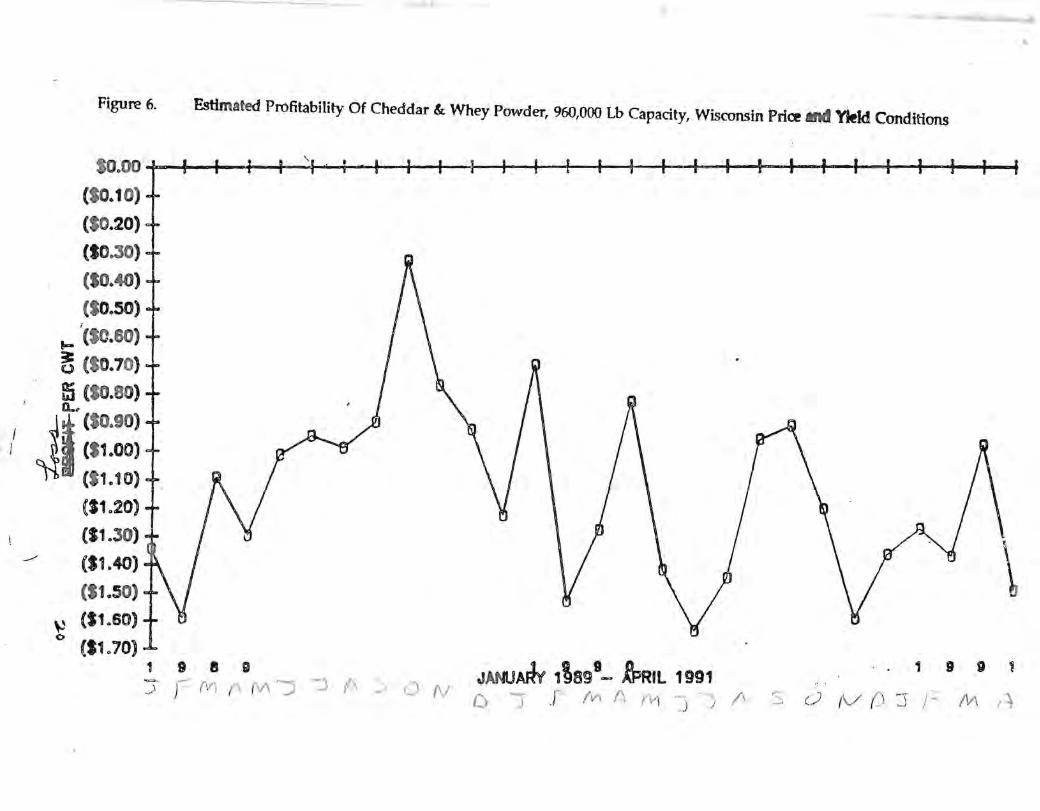
Figure 6. Estimated Profitability Of Cheddar & Whey Powder, 960,000 Lb Capacity,
I Wisconsin Price and Yield Conditions ........ . .................... 20
... . j
vii
PROFITABILITY OF CHEDDAR a-IEESE AND WHEY PRODUCT MANUFACTURE, NEW YORK AND WISCONSIN
1989-1991
INTRODUCTION AND BACKGROUND
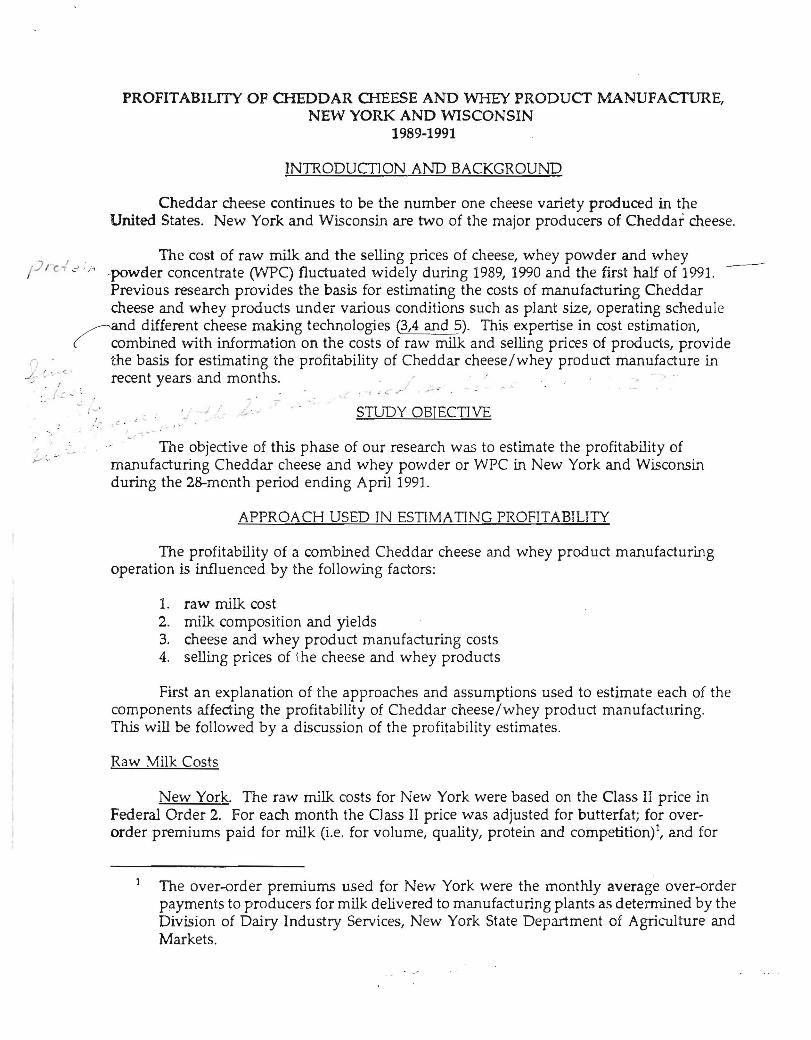
Cheddar cheese continues to be the number one cheese variety produced in the United States. New York and Wisconsin are two of the major producers of Cheddar cheese.
The cost of raw milk. and the selling prices of cheese, whey powder and whey j-Jrc -! .:' h -powder concentrate (WPC) fluctuated widely during 1989, 1990 and the first half of 1991. -
Previous research provides the basis for estimating the costs of manufacturing Cheddar cheese and whey products under various conditions such as plant size, operating schedule
~and different cheese making technologies (3,4 and 5). This expertise in cost estimation, ( combined Vvith information on the costs of raw milk and selling prices of products, provide
the basis for estimating the profitability of Cheddar cheese/whey product manufacture in recent years and months.
I ..... '
, . - ~- . " . .f .... ". - STUDY OBJECTIVE
( . t _ ....
The objective of this phase of our research was to estimate the profitability of manufacturing Cheddar cheese and whey powder or WPC in New York and Wisconsin during the 28-month period ending April 1991.
APPROACH USED IN ESTIMA TING PROFITABILITY
The profitability of a combined Cheddar cheese and whey prod uct manufacturing operation is influenced by the following factors:
1. raw milk. cost 2. milk. composition and yields 3. cheese and whey product manufacturing costs 4. selling prices of the cheese and whey products
First an explanation of the approaches and assumptions used to estimate each of the components affecting the profitability of Cheddar cheese/whey product manufacturing. This will be followed by a discussion of the profitability estimates.
Raw Milk Costs
New York. The raw milk. costs for New York were based on the Class II price in Federal Order 2. For each month the Class II price was adjusted for butterfat; for overorder premiums paid for milk (Le. for volume, quality, protein and competition)l, and for
The over-order premiums used for New York were the monthly average over-order payments to producers for milk delivered to manufacturing plants as determined by the Division of Dairy Industry Services, New York State Department of Agriculture and Markets.
other costs associated With procuring a milk supply (eg. field work. quality control, producer payrolling, hauling subsidies and market order assessments).
Wisconsin. Raw milk costs for Wisconsin assume 80% of the milk. used in cheese manufacture is Grade A and 20%, Grade B. Raw milk costs were based on the MinnesotaWisconsin manufacturing price for Wisconsin, adjusted for butterfat and any payments from the marketing order. The prices in the M-W series were increased to allow for quality, prote~ volume, and competitive premiums, hauling subsides, marketing order assessments, and other raw milkprocurement costs incurred by plants.
Milk Composition and Yields
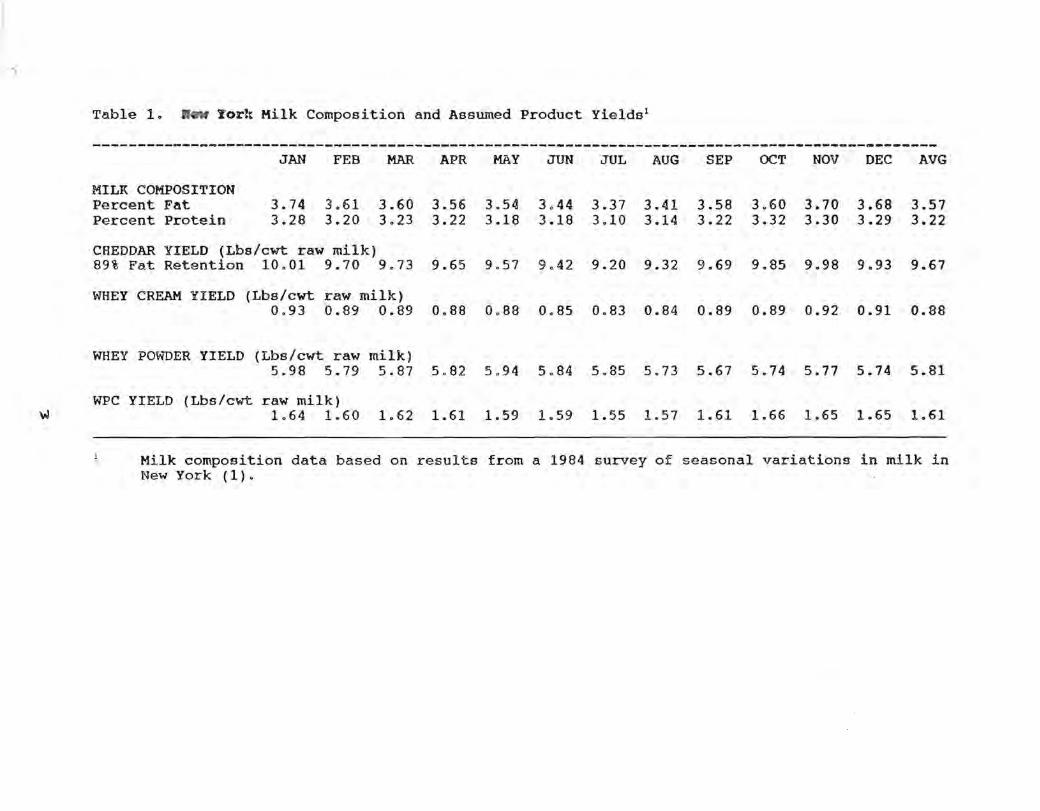
Milk composition infonnation (fat, protein and total solids) for each region were from a 1984 survey. Details of the survey and its methodology can be found in the Journal of Dairy Science.(l) The yields of Cheddar cheese, whey cream, whey powder and WPC for both New York and Wisconsin were determined by using the milk composition data for each state and assuming 89% fat recovery in the cheese (Tables 1 and 2).
A computer program was used to determine theoretical yield infonnation for cheese, whey cream, whey, and fresh cream. This was done using the milk composition data and assumed characteristics for the cheese, (moisture, protein, and fat level). Whey powder yields were detennined by calculating the a..mount of whey produced (subtracting cheese yield from amount of milk used) and the total solids content of the whey (using the milk I
composition data) and assuming ,a 97% solids content for the whey powder. · : / , (. _ r I -I ! L- ' i J C _/ '- r ~ , . ( _' .
Fat recovery or retention has a dramatic effect on cheese yields and, consequently, revenues and profitability. The assumption that 89% of the fat present in the milk is retained in the cheese reflects typical performance. Some conunercial operations achieve higher fat recovery (eg. 91 to 93%); some lower. Research indicates that by increasing fat retention from 89% to 93%, Cheddar cheese yields increase nearly 3%. An increase in cheese yields of about 3% would increase profitability by approximately $.20 per cwt of milk (2). (Note to Dave - we hadn't figured a change from 89% to 90%, so I extrapolated from your Syracuse speech.) On the other hand, a lower fat recovery would decrease yields and profitability proportionately.
Cheese and Whey Product Manufacturing Costs The cheese and whey product manufacturing costs used in estimating profitability
were based on research done and reported by the authors during the past six years (3, 4, and 5). The economic-engineering or synthetic costing approach was used to estimate production costs for various size plants and production situations in these studies. The costs calculated in this manner indicate what could be expected with a new plant, engineered according to the specifications of the design, and operated according to the assumed, achievable standards. For any given plant design or operating schedule, costs
2
-,
Table 1. ftew Yor~ Milk Composition and Assumed Product Yields l
----------------~------------------------------------------------------------------------------JAN FEB MAR APR MAY JUN JUL AUG SEP OCT NOV DEC AVG
MILK COMPOSITION Percent Fat 3.74 3.61 3.60 3.56 3.54 3.44 3.37 3.41 3.58 3.60 3.70 3.68 3.57 Percent Protein 3.28 3.20 3.23 3.22 3.18 3.18 3.10 3.14 3.22 3.32 3.30 3.29 3.22
CHEDDAR YIELD (Lbs/cwt raw milk) 89% Fat Retention 10.01 9.70 9.73 9.65 9.57 9.42 9.20 9.32 9.69 9.85 9.98 9.93 9.67
WHEY CREAM YIELD (Lbs/cwt raw milk) 0.93 0.89 0.89 0.88 0.88 0.85 0.83 0.84 · 0.89 0.89 0.92 0.91 0.88
WHEY POWDER YIELD (Lbs/cwt raw milk) 5.98 5.79 5.87 5.82 5.94 5.84 5.85 5.73 5.67 5.74 5.77 5.74 5.81
WPC YIELD (Lbs/cwt raw milk) \01 1.64 1.60 1.62 1.61 1.59 1.59 1.55 1.57 1.61 1.66 1.65 1.65 1.61
Milk composition data based on results from a 1984 survey of seasonal variations in milk in New York (1).
-c.
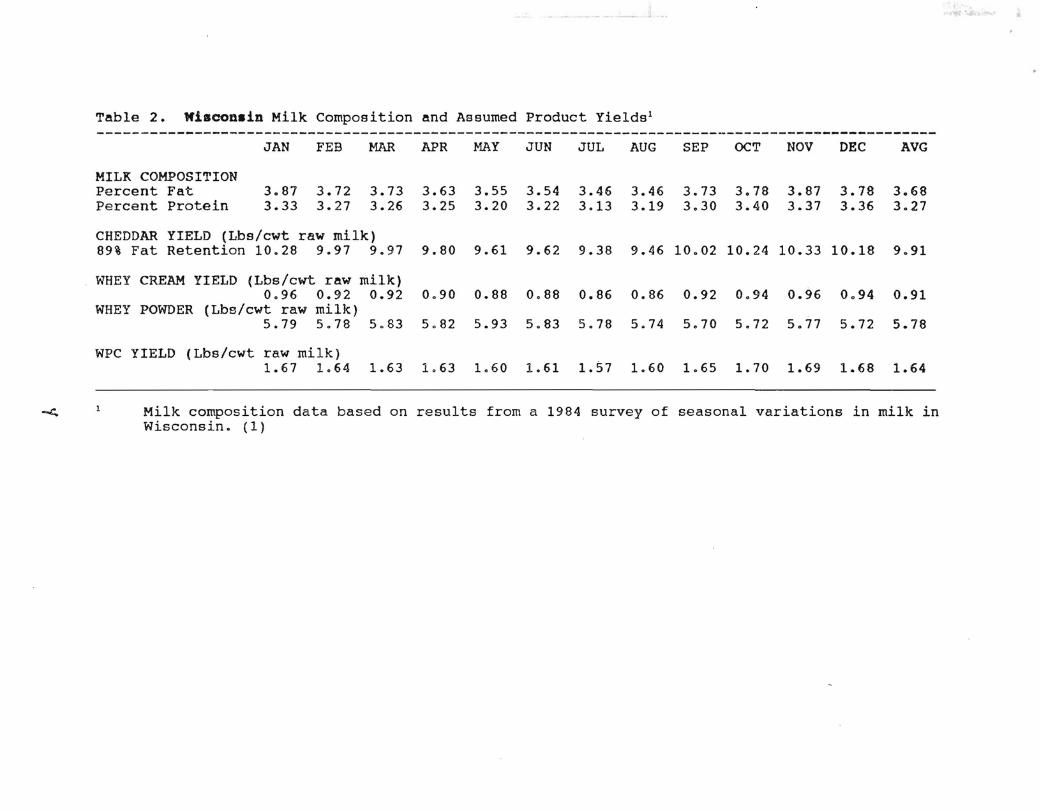
Table 2. Wiacon.in Milk Composition and Assumed Product Yields 1
JAN FEB MAR APR MAY JUN JUL AUG SEP OCT NOV DEC AVG
MILK COMPOSITION Percent Fat Percent Protein
3~87 3.72 3.73 3.63 3.55 3.54 3.46 3.46 3.73 3.78 3.87 3.78 3.68 3.33 3.27 3.26 3.25 3.20 3.22 3.13 3.19 3.30 3.40 3.37 3.36 3.27
CHEDDAR YIELD (Lbs/cwt raw milk) 89% Fat Retention 10.28 9.97 9.97 9.80 9.61 9.62 9.38 9.46 10.02 10.24 10.33 10.18 9.91
WHEY CREAM YIELD (Lbs/cwt raw milk) 0.96 0.92 0.92 0.90 0.88 0.88 0.86 0.86 0.92 0.94 0.96 0.94 0.91
WHEY POWDER (Lbs/cwt raw milk) 5.79 5.78 5.83 5.82 5.93 5.83 5.78 5.74 5.70 5.72 5.77 5.72 5.78
WPC YIELD (Lbs/cwt raw milk) 1.67 1.64 1.63 1.63 1.60 1.61 1.57 1.60 1.65 1.70 1.69 1.68 1.64
Milk composition data based on results from a 1984 survey of seasonal variations in milk in Wisconsin. (1)
•
that would be achieved in an actual plant would vary with the quality of management and labor, actual prices paid for fixed or variable inputs, milk composition and quality factors (which affect yields), and cheese composition control. The effect on costs of any of these real-life factors could be very significant. Nevertheless, these studies demonstrate the importance of scale economies and various other cost-influencing factors when the vicissitudes of management, milk quality, and so on are neutralized.
The manufacturing cost estimates include the costs associated with the cheese and whey product production from receipt of raw milk through, and including, the cheese chilling room. Cheddar cheese is assumed to be sold fresh for aging. The manufacturing costs do not include the cost of cheese aging, cheese or whey product marketing, or administration and management other than direct plant management Costs are only included to the end of the day of product manufacture, plus 10 days of refrigerated or dry warehouse storage. Any further warehouse costs associated with aging cheese beyond 10 days are considered to be part of the marketing costs and are not included in the cheese manufacturing costs. The cost estimates reflect the manufacture of 4O-pound blocks of good quality cheddar, suitable for aging. This fresh cheese would probably then be sold to another firm for aging, cutting and wrapping in consumer size packages. In many cases, the firm which makes the Cheddar cheese doesn't age, cut and market the cheese.
Costs were estimated for plants with five different capacities (lbs milk/ day): 480,000, %0,000, 1,440,000, 1,800,000 and 2,400,000. The whey plants were sized to process only whey from the accompanying cheese plant. Except for the fat recovery in cheese (and thus cheese yield) which is assumed to be average, plants are assumed to operate at a higl\ but achievable level of efficiency. The model plants are constructed to be econOmically functional for the long term, yet not plush. Functional plant production office space is provided, but not space for an organization's headquarters. 1'hekutomatic cheddaring and block former technologies are assumed to be used in the model plants.
In estimating the monthly manufacturing costs, the plants were assumed to operate 24 hours per day, either 4, 5 or 6 days per week. The most common operating schedule assumed in both New York and Wisconsin was 5 days per week, 24 hours per day which reflects 71 % of capacity, the average capacity utilization found in 11 Cheddar cheese plants studied in 1984-85 (3). In order to reflect the seasonality of total Cheddar cheese production reported for the two states, the assumed operating schedule was increased to 6 days, 24 hours in some months (ie. March, April and May) and reduced to 4 days per week in estimating costs for certain other months (ie. typically fall months).
Moreover, in estimating WPC production costs and profitability, it is assumed that the ultrafiltration (UF) permeate is a breakeven situation. Thus, no costs (labor, capital, etc.) we included for penneate and no revenues or losses.
The equipment, structural and packaging material costs all reflect 1989 and 1990 prices. Assumed plant wage rates are $10.18 per hour in 1989 and $10.73 in 1990 and 1991 plus an allowance of 32% for the cost of fringe benefits. The electricity rates are assumed to be $.062 per KWH in 1989 and $.063 in 1990 and 1991 . Natural gas costs are assumed to be
5
$.39 per thenn in 1989 and $.40 in 1990 and 1991.
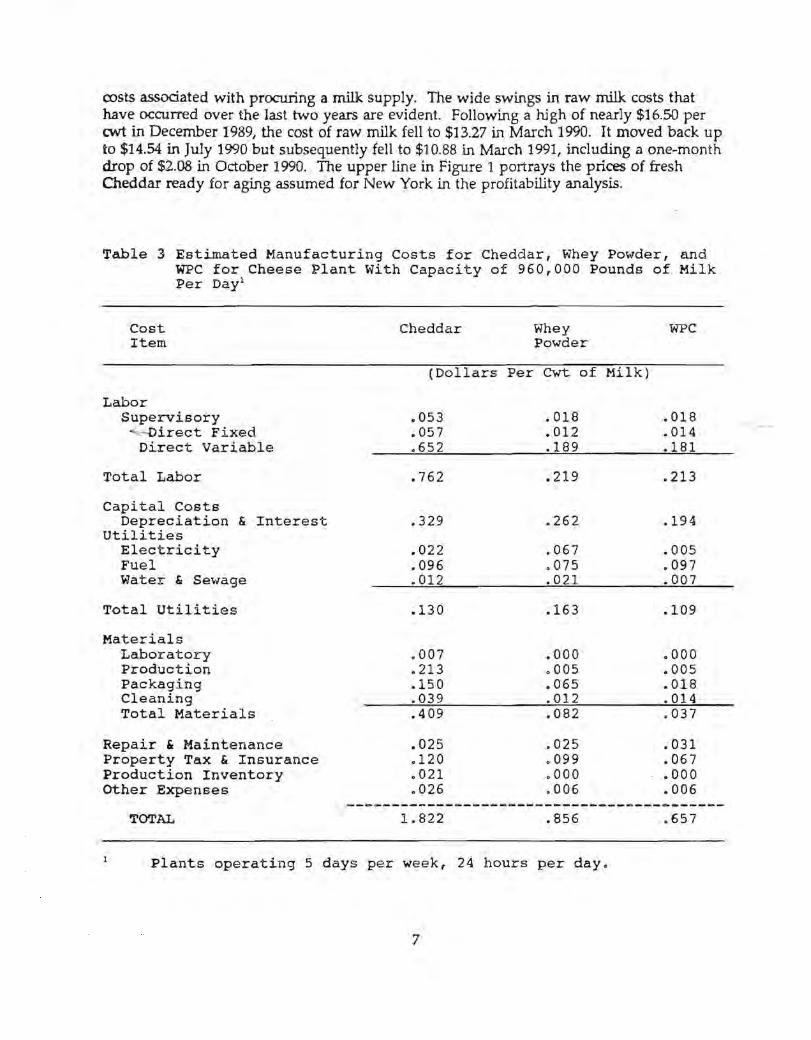
The costs that are directly associated with the manufacture of Cheddar cheese, human food grade whey powder and WPC are included in the categories in Table 3. The data in Table 3 provide an example of a typical economic engineering manufacturing cost assessment for a Cheddar p1ant with a capacity of 960,000 lbs of milk per day and the .usociated whey powder or WPC plant. The costs in this example assume the plant -operates at 71 % of capacity (eg. 5 days per week, 24 hours per day).
Previous research indicated that inherent differences in manufacturing costs between New York and Wisconsin were negligible (3). Thus, for a given size plant with a particular operating schedule, the same manufacturing cost estimates were used for both states.
Product Prices
Cheddar Cheese. Cheddar cheese prices for both New York and Wisconsin were based· on the Green Bay, Wisconsin National Cheese Exchange 40 lb. block prices. Cheese industry sources agreed that New York premium Cheddar, (10 days old, suitable for aging), would command approximately a $.1675-to .1700·per lb. premium over the NCE block price. For Wisconsin, it was determined that this same type a.Y1d quality of cheese produced in Wisconsin would receive a $0.05 premium over the block price. No transportation or aging costs are assumed in these prices.
Whey powder and WPC prices for each month were averaged from "Dairy Market News" weekly reports.2 The Wisconsin powder prices were taken from the "Dry Whey -Central, Mostly" ranges (the average of each range was used for each week, the weekly averages were averaged for each month), and the New York powder prices were from the "Dry Whey - FOB Eastern Area, Extra Grade," (also averaged for each week and month). Both price series were for spray-dried nonhygroscopic extra grade whey, for use in human food. Central States WPC prices were used for both Wisconsin and New York as no specific NY prices are reported.
Whey cream prices ($/lb of cream) were calculated for both regions based on the fresh cream price. Fresh cream prices were calculated by multiplying the butterfat differential by 4 (fresh cream and whey cream were both assumed to be 40% fat). A ratio .2r: :-. ... ~-: of 1:0.857 was a:,umed for the fresh and .whey .cream prices, so e~ch wh~y cream price was
.' . 7::i~ calculated as 85.1% of the fresh cream pnce, tlsmgth~e-butteFfat-dif£erent.la-l-f-er-each-'St-a{e;.
/..-
Comparison of Milk Costs and Product Prices
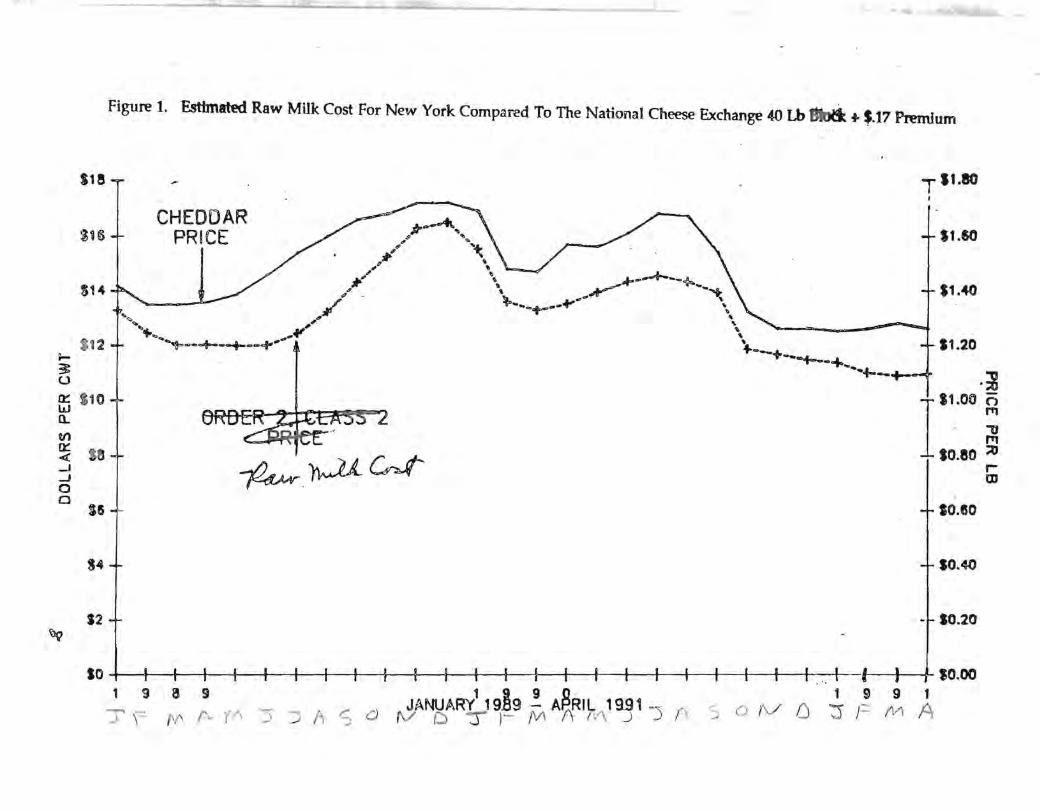
New York. Estimates of the raw milk cost at a typical New York cheese plant are shown in the lower line of Figure 1 for the 28 months ending April 1991. It reflects the Federal Order 2 Class II price adjusted for butterfat, for over-order premiums, and for other
2 Dairy Market News (various issues), U.S. Department of Agriculture - Agricultural Marketing Service.
6
costs associated with procuring a milk supply. The wide swings in raw milk costs that have occurred over the last two years are evident. Following a high of nearly $16.50 per cwt in December 1989, the cost of raw milk fell to $13.27 in March 1990. It moved back up to $14.54 in July 1990 but subsequently fell to $10.88 in March 1991, inel uding a one-month drop of $2.08 in October 1990. The upper line in Figure 1 portrays the prices of fresh Cheddar ready for aging assumed for New York in the profitability analysis.
Table 3 Estimated Manufacturing Costs for Cheddar, Whey Powder, and WPC for Cheese Plant With Capacity of 960,000 Pounds of Milk Per Dayl
Cost Item
Labor Supervisory
'--Direct Fixed Direct Variable
Total Labor
Capital Costs Depreciation & Interest
Utilities Electricity Fuel Water & Sewage
Total Utilities
Materials Laboratory Production Packaging Cleaning Total Materials
Repair & Maintenance Property Tax & Insurance Production Inventory other Expenses
TOTAL
Cheddar Whey Powder
(Dollars Per CWt of Milk)
.053
.057
.652
.762
.329
.022
.096
.012
.130
.007
.213
.150
.039
.409
.025 0120 .021 0026
1. 822
.018
.012
.189
.219
.262
.067
.075
.021
.163
.000 0005 .065 .012 .082
.025
.099
.000
.006
.856
Plants operating 5 days per week, 24 hours per day.
7
WPC
.018
.014
.181
.213
.194
.005
.097
.007
.109
.000
.005
.018
.014
.037
~031 .067 .000 .006
.657
~
~ u
Ste
$16
514
12
~ $ 10 w n. Ul
~ sa -' ..J o a SIS
14
12 ~
Figure 1. Estbnated Raw Milk Cost For New York Compared To The National Cheese Exchange 40 Lb BIotl .. $.17 Premium
CHEDDAR PRICE *.-'fI. ..
$ .....
6" '.&. Jt! .\
,," ',. ~-.......... -~ " '\ ~or- ......... ~ '- '\ /" !t--__ +-_~+_ "\
T 11.80
11.SO
11.40
'/ '\ '- ~-+ ..... o# ... ~ --1--.. ----". .. -- ---- --"- _L" 1 ,........ ..L_ ~---.r--~---.- JII. ... ...-_~ 11.20
.~
~.~~ I
S1.00 ~
. "'U F"1
10.80 ~ r-m
;
10.SO
IO.oW
~ ... 10.20
so I I I I I i I I I I I I I I .'. I' I $0.00 1 990 199 1
'5 ~ A S C) ,Jf~AR~J ~~9 M A~17V\ 1 g~ 1 -5 f\ S 0 tV D '3 J== ( 1/) A 1 9 IS 9
-. \" t-A f\. (.
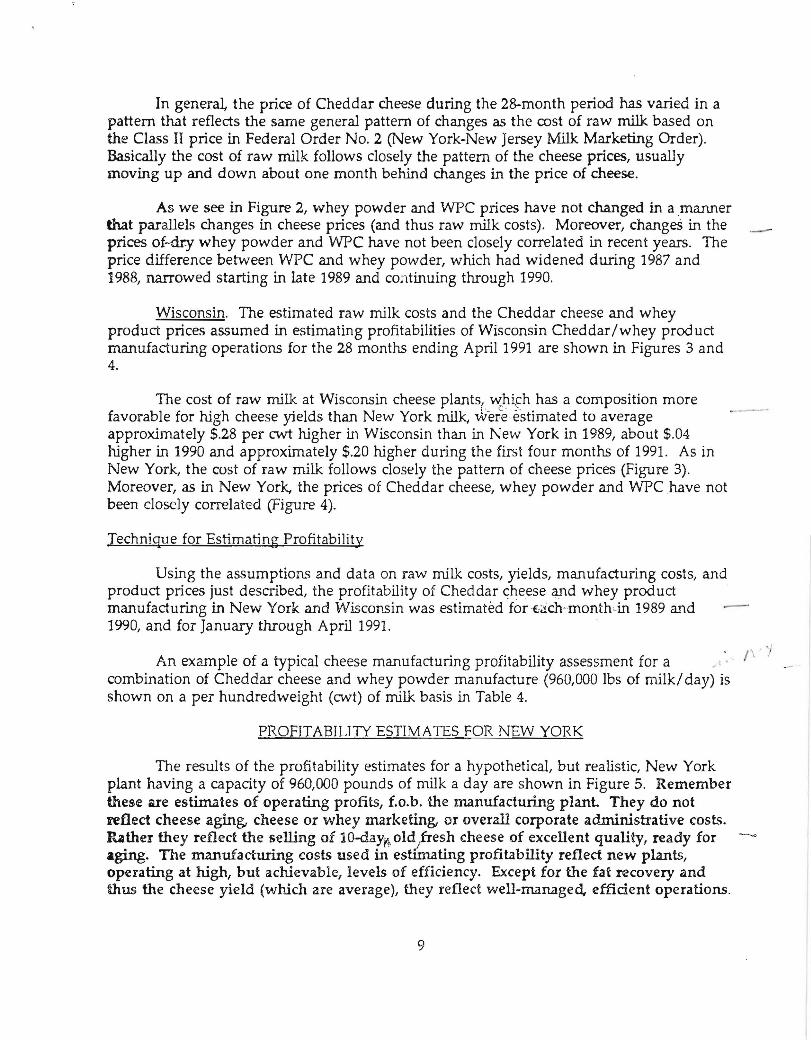
In generaL the price of Cheddar cheese during the 28-month period has varied in a pattern that reflects the same general pattern of changes as the cost of raw milk based on the Class II price in Federal Order No.2 (New York-New Jersey Milk Marketing Order). Basically the cost of raw milk follows closely the pattern of the cheese prices, usua1Jy moving up and down about one month behind changes in the price of cheese.
As we see in Figure 2, whey powder and WPC prices have not changed in a ,manner that parallels changes in cheese prices (and thus raw milk costs). Moreover, changeS in the prices of--dry whey powder and WPC have not been closely correlated in recent years. The price difference between WPC and whey powder, which had widened during 1987 and 1988, narrowed starting in late 1989 and continuing through 1990.
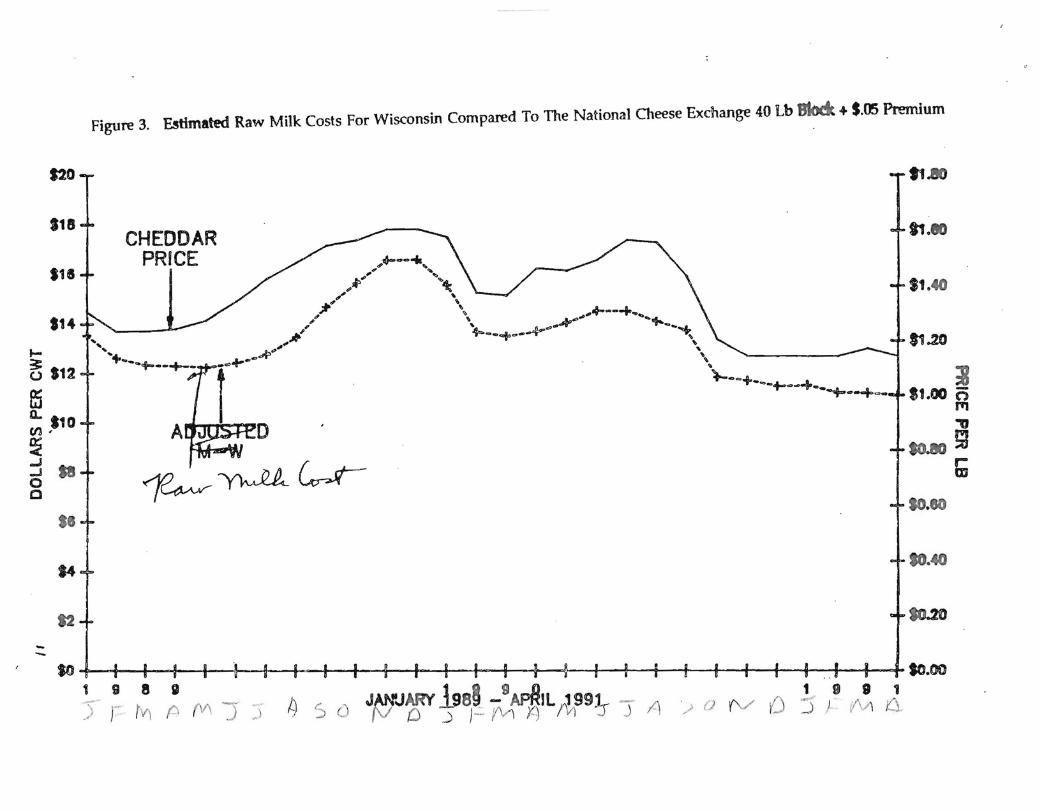
Wisconsin. The estimated raw milk costs and the Cheddar cheese and whey product prices assumed in estimating profit abilities of Wisconsin Cheddar/whey product manufacturing operations for the 28 months ending April 1991 are shown in Figures 3 and 4.
-
The cost of raw milk at Wisconsin cheese plants( ~hifh has a composition more favorable for high cheese yields than New York milk, were estimated to average approximately $.28 per cwt higher in Wisconsin than in New York in 1989, about $.04 higher in 1990 and approximately $.20 higher during the first four months of 1991. As in New York, the cost of raw milk follows closely the pattern of cheese prices (Figure 3). Moreover, as in New York. the prices of Cheddar cheese, whey powder and wpe have not been closely correlated (Figure 4).
.--
Technique for Estimating Profitability
Using the assumptions and data on raw milk costs, yields, manufacturing costs, and product prices just described, the profitability of Cheddar ~heese and whey product manufacturing in New York and Wisconsin was estimated for '€;ich-rnonthc,in 1989 and 1990, and for January through April 1991.
An example of a typical cheese manufacturing profitability assessment for a combination of Cheddar cheese and whey powder manufacture (960,000 lbs of milk/ day) is shown on a per hundredweight (cwt) of milk basis in Table 4.
PROFITABILITY ESTIMATES FOR NEW YORK
The results of the profitability estimates for a hypothetical, but realistic, New York plant having a capacity of 960,000 pounds of milk a day are shown in Figure 5. Remember these are estimates of operating profits, f.o.b. Ute manufacturing plant. They do not reflect cheese aging, cheese or whey marketing, or overall corporate administrative costs. Rather they reflect the selling of lO-daYtt, olcyresh cheese of excellent quality, ready for aging. The manufacturing costs used in estimating profitability reflect new plants, operating at high, but c1chievable, levels of efficiency. Except for the fat recovery and tlms the cheese yield (which are average), they reflect well-managed. efficient operations.
9
',I 1\
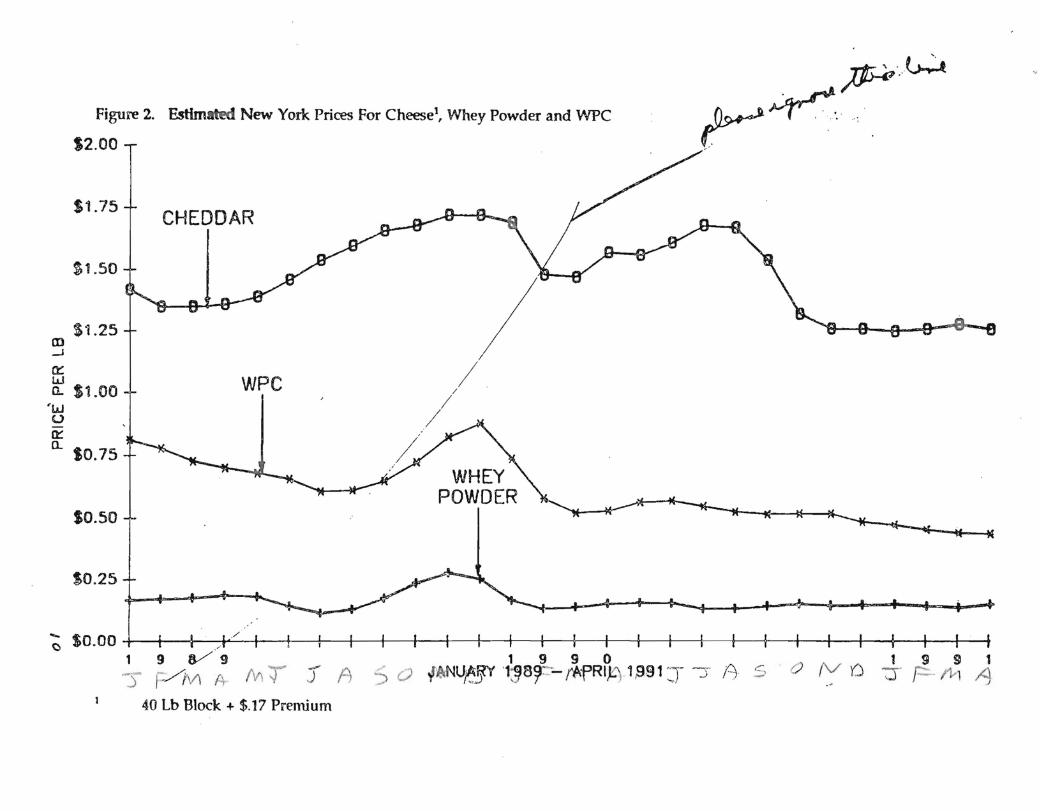
. JIH' .... ~ Figure 2. Estimated New York Prices For Cheese!, Whey Powder and WPC ~~ .. ..
m -' Cl: w
S2.00
$1.75
$1.50
$1.25
a. $1.00 'w u D:::
a. SO.75
SO.50
$0.25
CHEDDAR
WPC
WHEY POWDER
~ $0.00 I I 1 · ) / I I I I I I I I I . 1 9 V9 1 9 9 0 1 9 g 1 -s r /JV\ A- M T .r A S 0 f lcNUJ!'j)' ' 1~8~::-- rAfRI,l0 1,9.-91 ::r ~ A s 0 (V () -:r r- 111 /j
40 Lb Block + $.17 Premium
.... ~ S12
ffi a.. .10 en, ~ ..J ..J o C
-
S8
S4
12
Figure 3. ~ated Raw Milk Costs For Wisconsin Compared To The National Cheese Exchange 40 Lb Btodt + $.05 Premium
...... ....
CHEDDAR PRICE
... ... .,A>" c-+---.... --+--
A o
.A-._", ,v- "
, .. ' """",
"'. "'-4_ .. ~ / \ ~ ~-~ , .. ~ .. ;f' ...{-_ • ' +.--~-- \ ' -r • ' . Jt! "-'-+--'+--+---+-'4-
~~GrA-
tl .ao
81.10
$1.40
11.20
J tU.OO 0
PI
."
so.eo SJ Iii
-SO, I I I .... ~ I I f ~ I I I I I ~ I I I I .. ~ , SO.oo
1 9 8 g 1_ e 9 11 1 9 9 1 ') ' ~ 1\ ,.. t'"\ (\1\ ".- ~) ~ 0 JAtfJAfff ..llJ89_ - APRI L ,,1991r -.\ A ' ;, () '('../ ,/\ -')) 1/\/\ ,/\ , ) I I' \ r' ..J ~) , ..;; IV {) ..) )- (V\ )() I v) ..J .... ' r.-J - < '-J,..
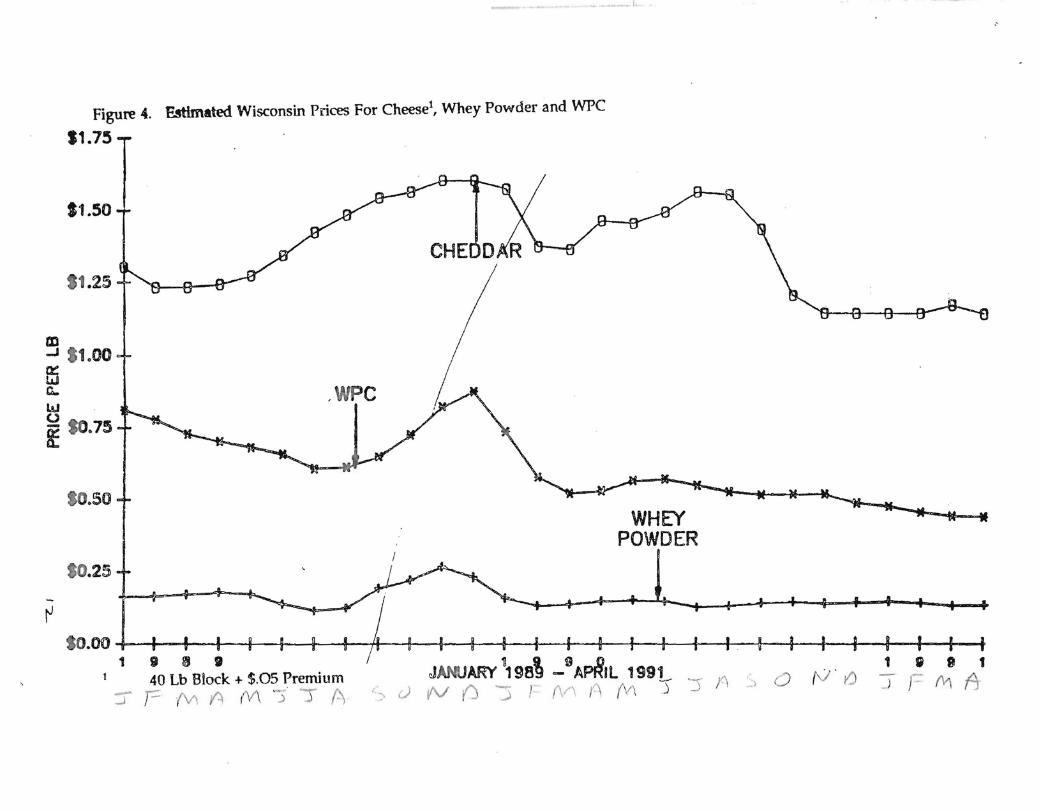
Figure 4. EstImated Wisconsin Prices For Cheese!, Whey Powder and WPC
11.75
11.50
1.25
r:D ..J S1.00 ffi a... w o f 10.75
0.50
0.25
-~
,WPC
__ .1
WHEY POWDER
so.oo I I , I ~ I f 1 181 .
JANUARY '198~ _9 APR,L 199L f1 ' a 40 Lb Block + $,05 Premium
:r F /'vi ~ (\!\ 'j "J'" A :- c) VV(J "J I (V'"\ (\ (V\ J 3 . -' ' f.)
1 I; 8 1
-:JFf\1f!
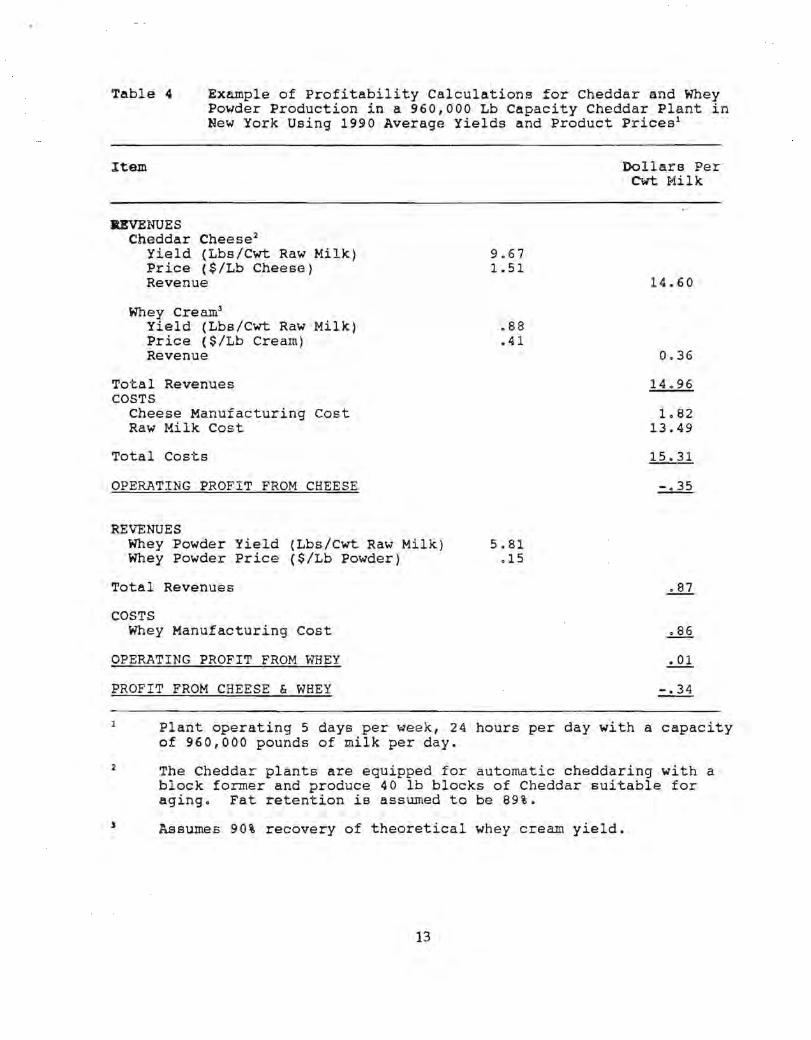
Table 4 Example of Profitability Calculations for Cheddar and Whey Powder Production in a 960,000 Lb Capacity Cheddar Plant in New York Using 1990 Average Yields and product Prices l
Item
IlEVENUES Cheddar Cheese 2
Yield (Lbs/Cwt Raw Milk) Price ($/Lb Cheese) Revenue
Whey Cream3
yield (Lbs/Cwt Raw Milk) Price ($/Lb Cream) Revenue
Total Revenues COSTS
Cheese Manufacturing Cost Raw Milk Cost
Total Costs
OPERATING PROFIT FROM CHEESE
RE'v"ENUES Whey Powder Yield (Lbs/Cwt Raw Milk) Whey Powder Price ($/Lb Powder)
Total Revenues
COSTS Whey Manufacturing Cost
OPERATING PROFIT FROM WHEY
PROFIT FROM CHEESE & WHEY
9.67 1.51
.88
.41
5.81 .15
Dollars Per Cut Milk
14.60
0.36
14.96
1. 82 13.49
15.31
Plant operating 5 days per week, 24 hours per day with a capacity of 960,000 pounds of milk per day.
,
The Cheddar plants are equipped for automatic cheddaring with a block former and produce 40 lb blocks of Cheddar suitable for aging. Fat retention is assumed to be 89%.
Assumes 90% recovery of theoretical whey cream yield.
13
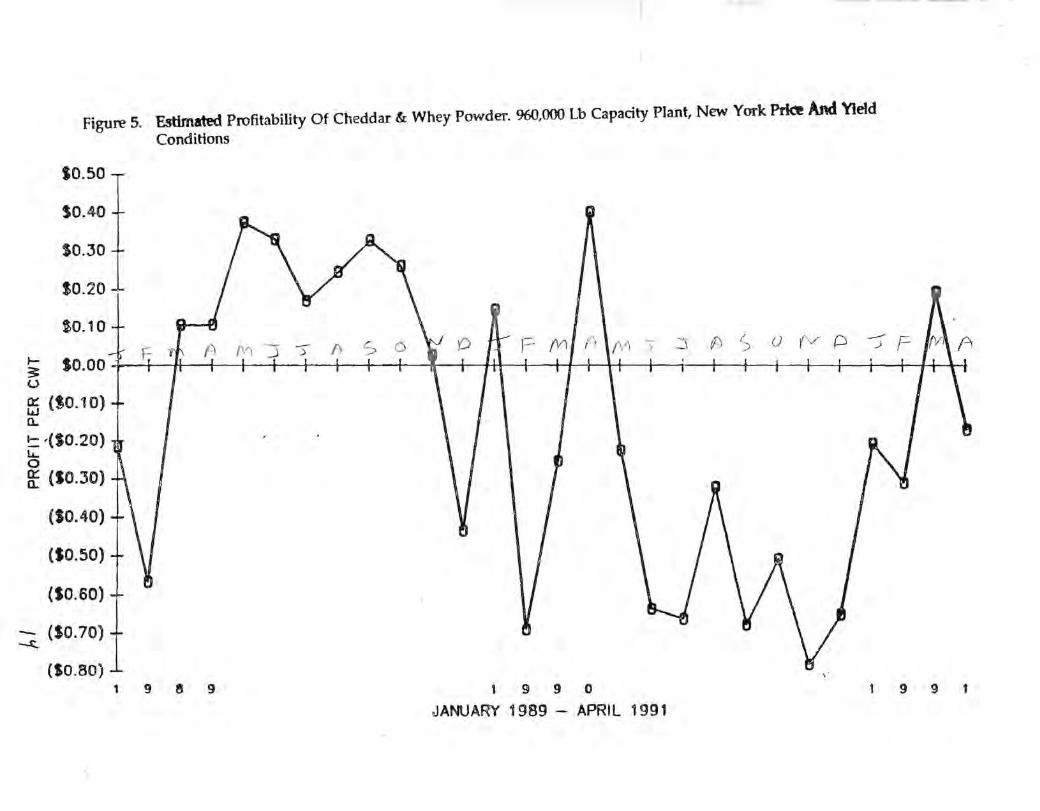
Figure 5. Estimated Profitability Of Cheddar & Whey Powder. 960,000 Lb Capacity Plant, New York Prke And Yield Conditions
SO.50
$0.40
SO.30
. $0.20
~0.10
t- SO.OO ~ u
f5 ('0.10) a. ~ '(10.20) ,. 0 a: (SO.30)
(SO.40)
(SO. 50)
(SO.60)
- (10.70) ~
(SO.80) 1 9 e 9 1 9 9 0
JANUARY 1989 - APRIL 1991
991
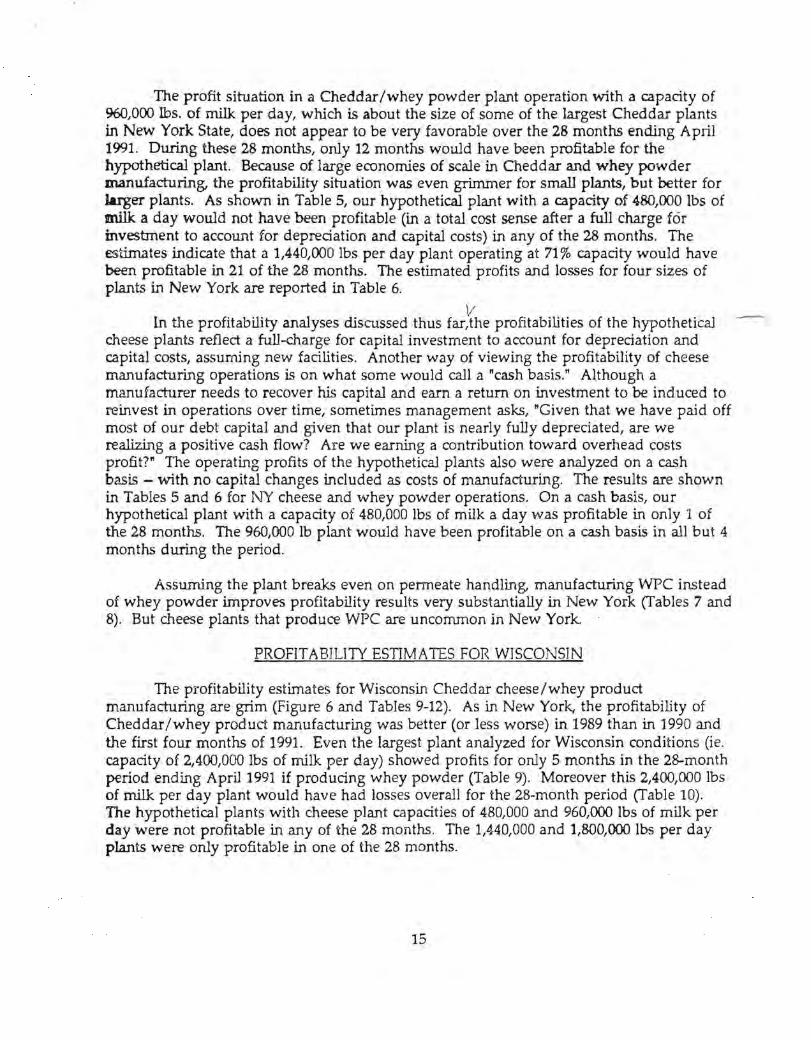
The profit situation in a Cheddar/whey powder plant operation with a capacity of %0,000 Ibs. of milk per day, which is about the size of some of the largest Cheddar plants in New York State, does not appear to be very favorable over the 28 months ending April 1991. During these 28 months, only 12 months would have been profitable for the hypothetical plant. Because of large economies of scale in Cheddar and whey powder manufacturing, the profitability situation was even grimmer for small plants, but better for larger plants. As shown in Table 5, our hypothetical plant with a capacity of 480,000 lbs of milk a day would not have been profitable (in a total cost sense after a full charge for investment to account for depredation and capital costs) in any of the 28 months. The estimates indicate that a 1,440,000 lbs per day plant operating at 71 % capadty would have been profitable in 21 of the 28 months. The estimated profits and losses for four sizes of plants in New York are reported in Table 6.
V In the profitability analyses discussed thus far,the profitabilities of the hypothetical
cheese plants reflect a full-charge for capital investment to account for depredation and capital costs, assuming new fadlities. Another way of viewing the profitability of cheese manufacturing operations is on what some would call a "cash basis." Although a manufacturer needs to recover his capital and earn a return on investment to be ind uced to reinvest in operations over time, sometimes management asks, "Given that we have paid off most of our debt capital and given that our plant is nearly fully depredated, are we realizing a positive cash flow? Are we earning a contribution toward overhead costs profit?" The operating profits of the hypothetical plants also were analyzed on a cash basis - with no capital changes included as costs of manufacturing. The results are shown in Tables 5 and 6 for NY cheese and whey powder operations. On a cash basis, our hypothetical plant with a capadty of 480,000 lbs of milk a day was profitable in only 1 of the 28 months. The 960,000 lb plant would have been profitable on a cash basis in all but 4 months during the period.
Assuming the plant breaks even on permeate handling, manufacturing WPC instead of whey powder improves profitability results very substantially in New York (Tables 7 and 8). But cheese plants that produce WPC are uncorrunon in New York.
PROFITABILITY ESTIMATES FOR WISCONSIN
The profitability estimates for Wisconsin Cheddar cheese/whey product manufacturing are grim (Figure 6 and Tables 9-12). As in New York., the profitability of Cheddar/whey product manufacturing was better (or less worse) in 1989 than in 1990 and th.e first four months of 1991. Even the largest plant analyzed for Wisconsin conditions (ie. capadty of 2,400,000 lbs of milk per day) showed profits for only 5 months in the 28-month period ending April 1991 if produdng whey powder (Table 9). Moreover this 2,400,000 lbs of milk per day plant would have had losses overall for the 28-month period (Table 10). The hypothetical plants with cheese plant capadties of 480,000 and 960J)OO lbs of milk per day were not profitable in any of the 28 months . The 1,440,000 and 1,800,000 Ibs per day plants were only profitable in one of the 28 months.
15
Table 5 Number of Months Cheddar and Whey Powder Manufacture Profitable, New York, Different Size Plants, 1989, 1990, and January - April 1991.
Plant Capacity Jan.-Apr. (lobs Milk/Day) 1989 1990 1991
Number of Months Profitable
480,000 with capital charge l
° 0 0 On a cash basis2 1 ° °
960,000 With capital charge 9 2 1 On a cash basis 12 8 4
1,440,000 With capital charge 11 6 4 On a cash basis 12 12 4
1,800,000 With capital charge 12 10 4 On a cash basis 12 12 4
Profitable even after a full charge for capital investment is made to account for depreciation and capital costs, assuming new facilities and using 1989-90 costs for building and equipment.
Profitable if no charges for depreciation and capital costs are made. In other words, cheese and whey powder manufacturing is making a contribution to committed costs but not necessarily a profit in a total sense.
16
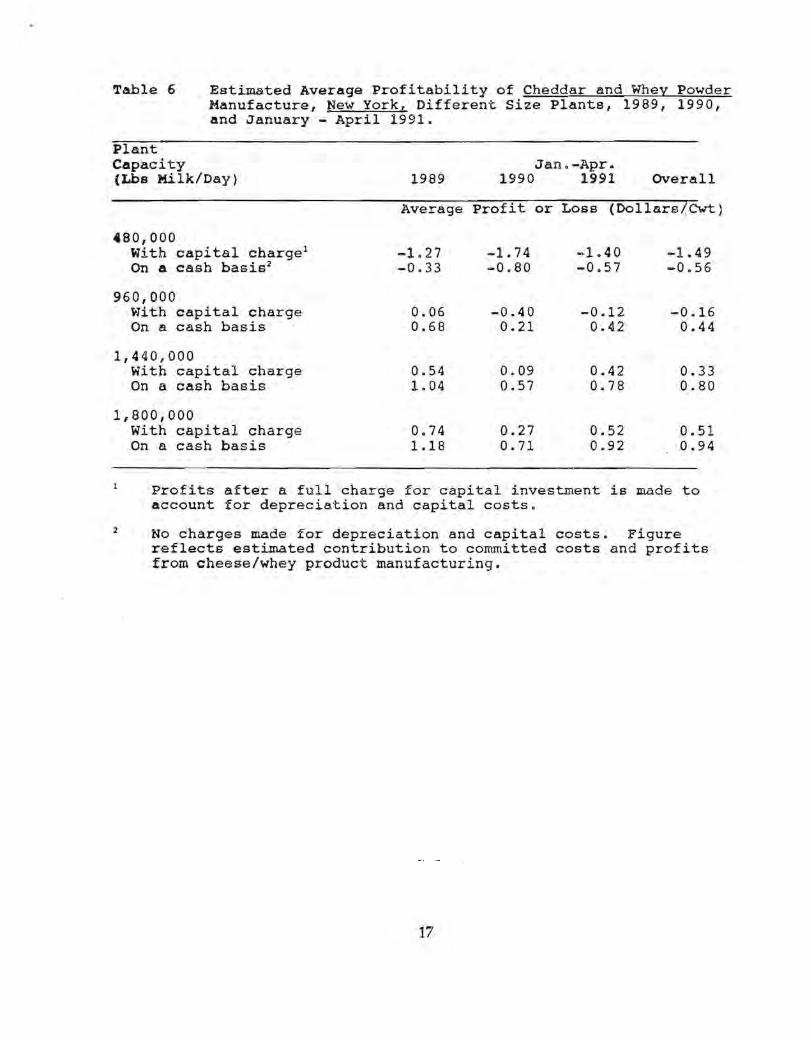
Table 6 Estimated Average Profitability of Cheddar and Whey Powder Manufacture, New York, Different Size Plants, 1989, 1990, and January - April 1991.
Plant Capacity (Lba Milk/Day)
480,000 With capital charge l
On a cash basis2
960,000 With capital charge On a cash basis
1,440,000 With capital charge On a cash basis
1,800,000 With capital charge On a cash basis
Jan.-Apr. 1989 1990 1991 Overall
Average Profit or Loss (Dollara/Cwt)
-1. 27 -1. 74 -0.33 -0.80
0.06 -0.40 0.68 0.21
0.54 0.09 1. 04 0.57
0.74 0.27 1.18 0.71
-1.40 -0.57
-0.12 0.42
0.42 0.78
0.52 0.92
-1.49 -0.56
-0.16 0.44
0.33 0 . 80
0.51 0.94
Profits after a full charge for capital investment is made to account for depreciation and capital costs.
2 No charges made for depreciation and capital costs. Figure reflects estimated contribution to committed costs and profits from cheese/whey product manufacturing.
17
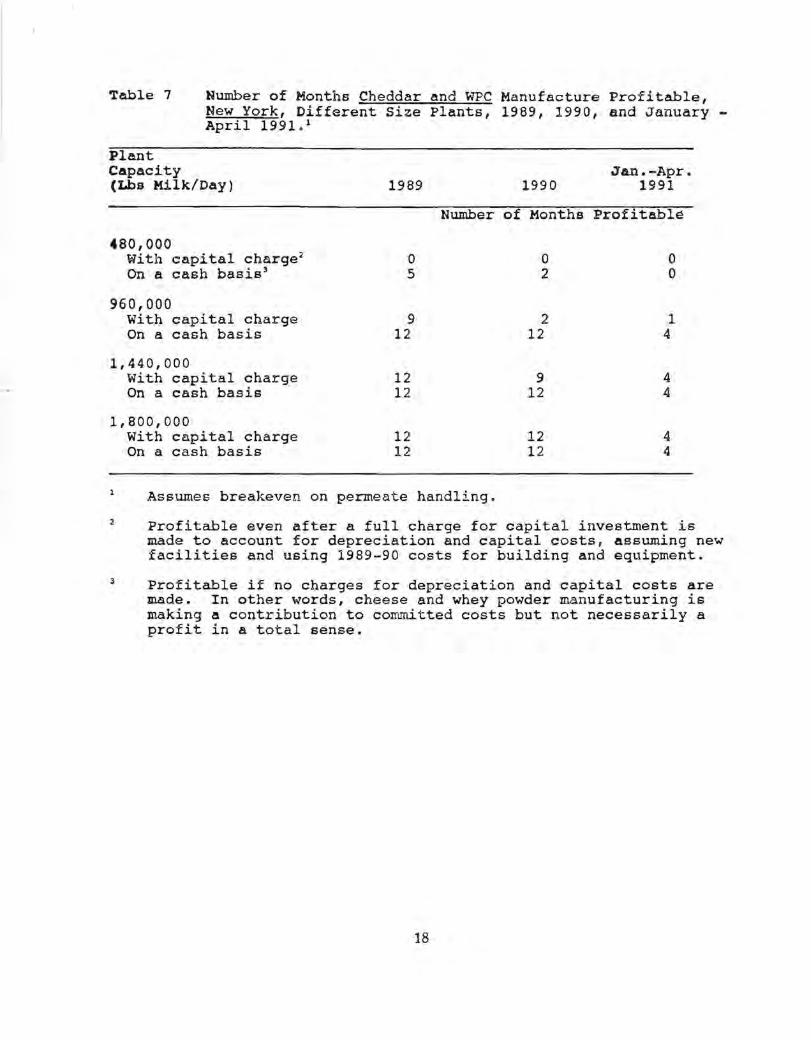
Table 7 Number of Months Cheddar and WPC Manufacture Profitable, New York, Different Size Plants, 1989, 1990, and January -April 1991. 1
Plant Capacity Jan.-Apr. (Lbs Milk/Day) 1989 1990 1991
Number of Months Profitable
4S0,000 With capital charge2
° 0 0 On a cash basis] 5 2 0
960,000 With capital charge 9 2 1 On a cash basis 12 12 4
1,440,000 With capital charge 12 9 4 On a cash basis 12 12 4
1,SOO,000 With capital charge 12 12 4 On a cash basis 12 12 4
Assumes breakeven on permeate handling.
Profitable even after a full charge for capital investment is made to account for depreciation and capital costs, assuming new facilities and using 1989-90 costs for building and equipment.
3 Profitable if no charges for depreciation and capital costs are made. In other words, cheese and whey powder manufacturing is making a contribution to cOITmitted costs but not necessarily a profit in a total sense.
18
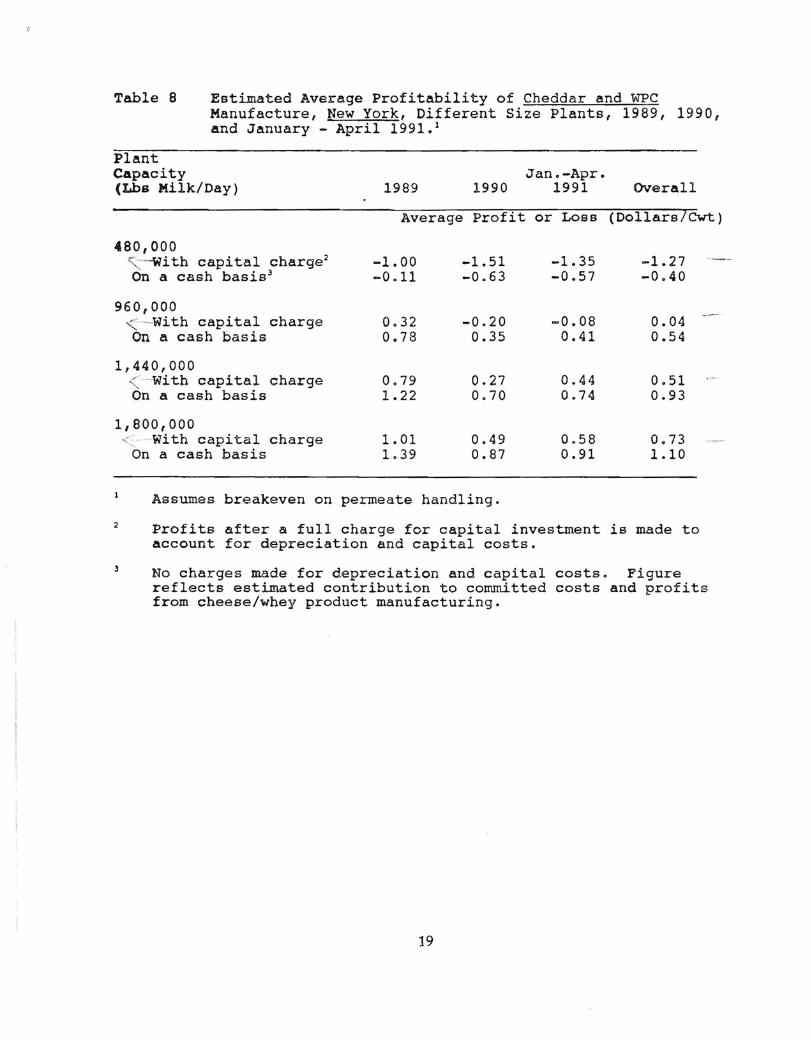
Table 8 Estimated Average Profitability of Cheddar and WPC Manufacture, New York, Different Size Plants, 1989, 1990, and January - April 1991.1
Plant Capacity (Lbs Milk/Day)
480,000 ~ - -Wi th capital charge2
On a cash basis3
960,000 " - With capital charge On a cash basis
1,440,000 ~ - With capital charge On a cash basis
1,800,000 ..; with capital charge
On a cash basis
Jan.-Apr. 1989 1990 1991 OVerall
Average Profit or Loss (DollarslCwt)
-1.00 -1.51 -1.35 -1.27 -0.11 -0.63 -0.57 -0.40
0.32 -0.20 -0.08 0.04 0.78 0.35 0.41 0.54
0.79 0.27 0.44 0.51 1.22 0.70 0.74 0.93
1. 01 0.49 0.58 0.73 1.39 0.87 0.91 1.10
Assumes breakeven on permeate handling.
2 Profits after a full charge for capital investment is made to account for depreciation and capital costs.
No charges made for depreciation and capital costs. Figure reflects estimated contribution to committed costs and profits from cheese/whey product manufacturing.
19
------
Figure 6. Estimated Profitability Of Cheddar & Whey Powder, 960,000 Lb Capacity, Wisconsin Price IIMf ~ Conditions
0.00 r ' I I I "I' , . (SO.10) ! I I I I , I I I I I I I I I
(10.20)
(SO.30)
(10.40)
(SO.50) f
~ (SO.60)
~ (SO.70)
ffi (SO.80) 11.,
I J~ (SO.90) I (11.00)
(11.10)
(11.20)
(S1.30) ../ (11.40)
(11.50)
~ (11.60) ()
(11.70) 1 989 :; )-: {V) r~ '(V\ ""J -:J ~ S () f\/ JANUAFfy "89
9- iPRIL 1991
0'1 r /V'll)n1 ])/\
1
~ C) rv :) I
\ 9 9 f
/VI /~
..
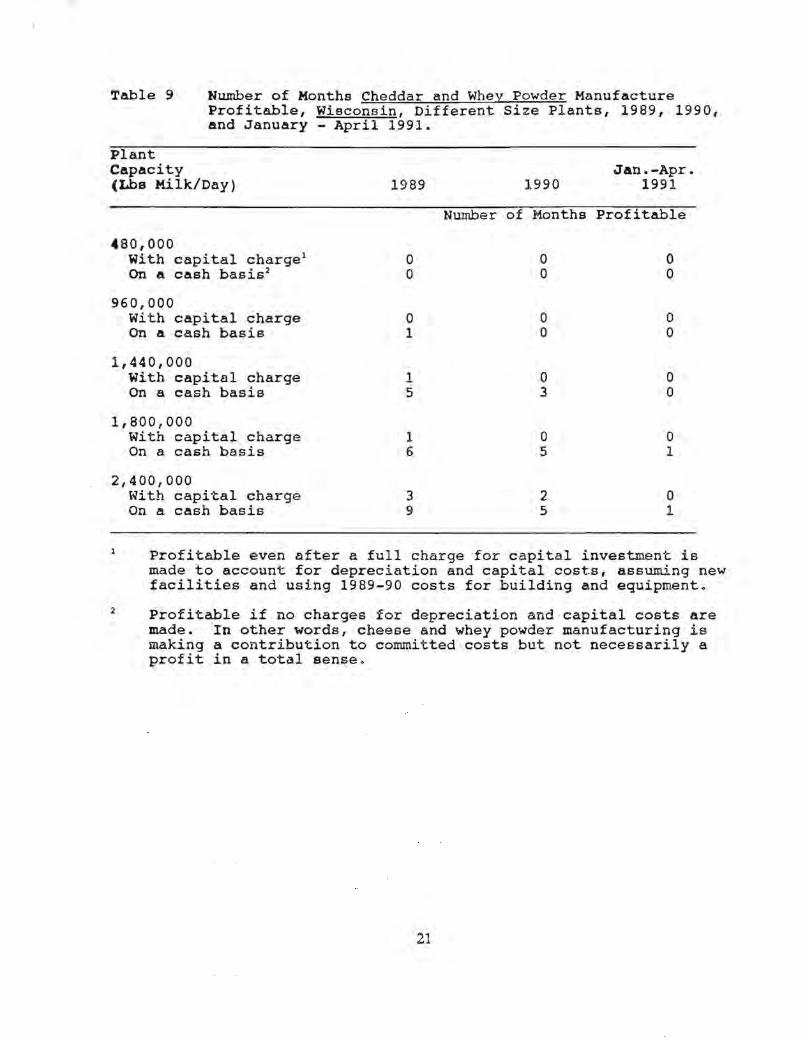
Table 9 Number of Months Cheddar and Whey Powder Manufacture Profitable, Wisconsin, Different Size Plants, 1989, 1990, And January - April 1991.
Plant Capacity Jan.-Apr. (Lbs Milk/Day) 1989 1990 1991
Number of Months Profitable
480,000 With capital charge 1 0 0 0 On a cash basis2 0 0 0
960,000 With capital charge 0 0 0 On a cash basis 1 0 0
1,440,000 With capital charge 1 0 0 On a cash basis 5 3 0
1,800,000 with capital charge 1 0 0 On a cash basis 6 5 1
2,400,000 With capital charge 3 2 0 On a cash basis 9 5 1
Profitable even after a full charge for capital investment is made to account for depreciation and capital cost.s, assuming new facilities and using 1989-90 costs for building and equipment.
2 Profitable if no charges for depreciation and capital costs are made. In other words, cheese and whey powder manufacturing is making a contribution to committed costs but not necessarily a profit in a total sense.
21
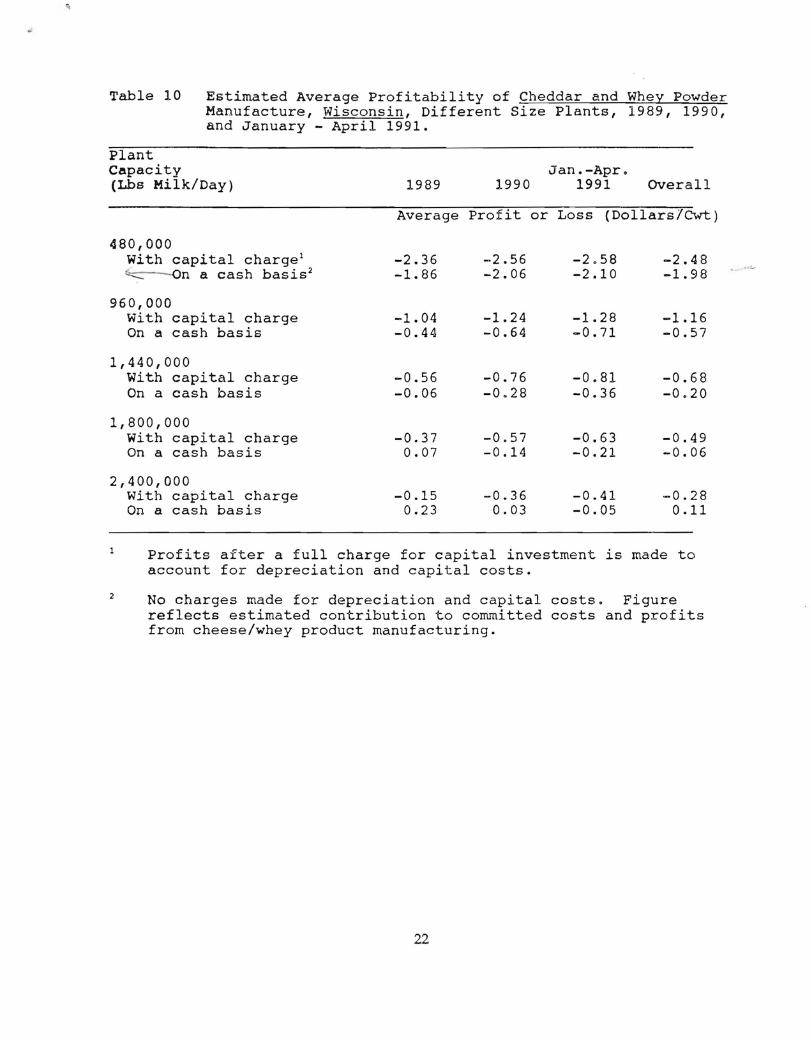
Table 10 Estimated Average Profitability of Cheddar and Whey Powder Manufacture, Wisconsin, Different Size Plants, 1989, 1990, and January - April 1991.
Plant Capacity (Lba Milk/Day)
480,000 with capital charge 1
~ On a cash basis 2
960,000 With capital charge On a cash basis
1,440,000 With capital charge On a cash basis
1,800,000 with capital charge On a cash basis
2,400,000 With capital charge On a cash basis
1989 1990
Average Profit
-2.36 -2.56 -1. 86 -2.06
-1. 04 -1.24 -0.44 -0.64
-0.56 -0.76 -0.06 -0.28
-0.37 -0.57 0.07 -0.14
-0.15 -0.36 0.23 0.03
Jan.-Apr. 1991 OVerall
or Loss (Dollars/Cwt)
-2.58 -2.48 -2.10 -1.98
-1.28 -1.16 -0.71 -0.57
-0.81 -0.68 -0.36 -0.20
-0.63 -0.49 -0.21 -0.06
-0.41 -0.28 -0.05 0.11
Profits after a full charge for capital investment is made to account for depreciation and capital costs.
2 No charges made for depreciation and capital costs. Figure reflects estimated contribution to committed costs and profits from cheese/whey product manufacturing.
22
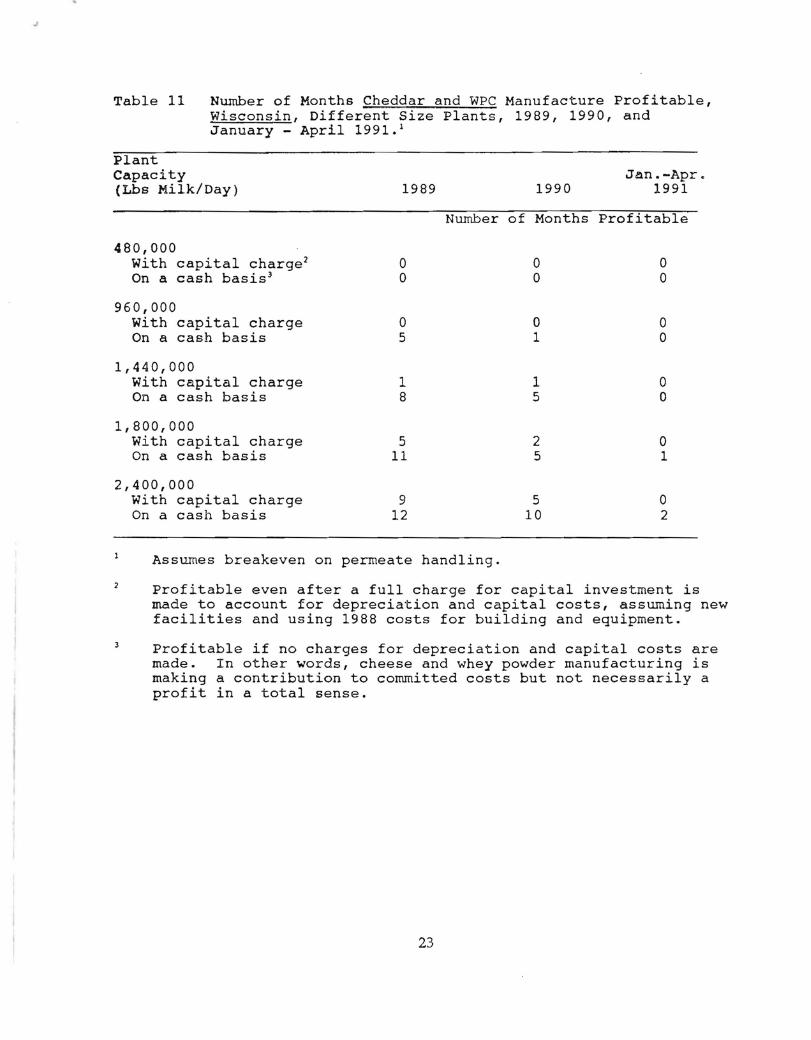
Table 11 Number of Months Cheddar and WPC Manufacture Profitable, Wisconsin, Different Size Plants, 1989, 1990, and January - April 1991. l
Plant Capacity Jan.-Apr. (Lbs Milk/Day) 1989 1990 1991
Number of Months Profitable
480,000 With capital charge 2 0 0 0 On a cash basis 3 0 0 0
960,000 With capital charge 0 ° 0 On a cash basis 5 1 0
1,440,000 with capital charge 1 1 0 On a cash basis 8 5 °
1,800,000 with capital charge 5 2 0 On a cash basis 11 5 1
2,400,000 with capital charge 9 5 0 On a cash basis 12 10 2
Assumes breakeven on permeate handling.
Profitable even after a full charge for capital investment is made to account for depreciation and capital costs, assuming new facilities and using 1988 costs for building and equipment.
3 Profitable if no charges for depreciation and capital costs are made. In other words, cheese and whey powder manufacturing is making a contribution to committed costs but not necessarily a profit in a total sense.
23
,
Table 12 Estimated Average Profitability of Cheddar and WPC Manufacture, Wisconsin, Different Size Plants, 1989, 1990, and January - April 1991. 1
Plant Capacity (Lbs Milk/Day)
480,000 with capital charge2
On a cash basis 3
960,000 With capital charge On a cash basis
1,440,000 With capital charge On a cash basis
1,800,000 With capital charge On a cash basis
2,400,000 with capital charge On a cash basis
1989 1990
Average Profit
-2.01 -2.30 -1.16 -1.44
-0.71 -0.98 -0.18 -0.45
-0.25 -0.53 0.17 -0.11
-0.03 -0.31 0.34 0.06
0.18 -0.10 0.50 0.22
Jan.-Apr. 1991 Overall
or Loss (Dollars/Cwt)
-2.46 -2.20 -1.65 -1. 35
-1.17 -0.89 -0.66 -0.36
-0.72 -0.44 -0.33 -0.02
-0.51 -0.22 -0.16 0.15
-0.30 -0.01 0.00 0.31
Assume plant breaks even on handling permeate.
Profits after a full charge for capital investment is made to account for depreciation and capital costs.
No charges made for depreciation and capital costs. Figure reflects estimated contribution to committed costs and profits from cheese/whey product manufacturing.
24
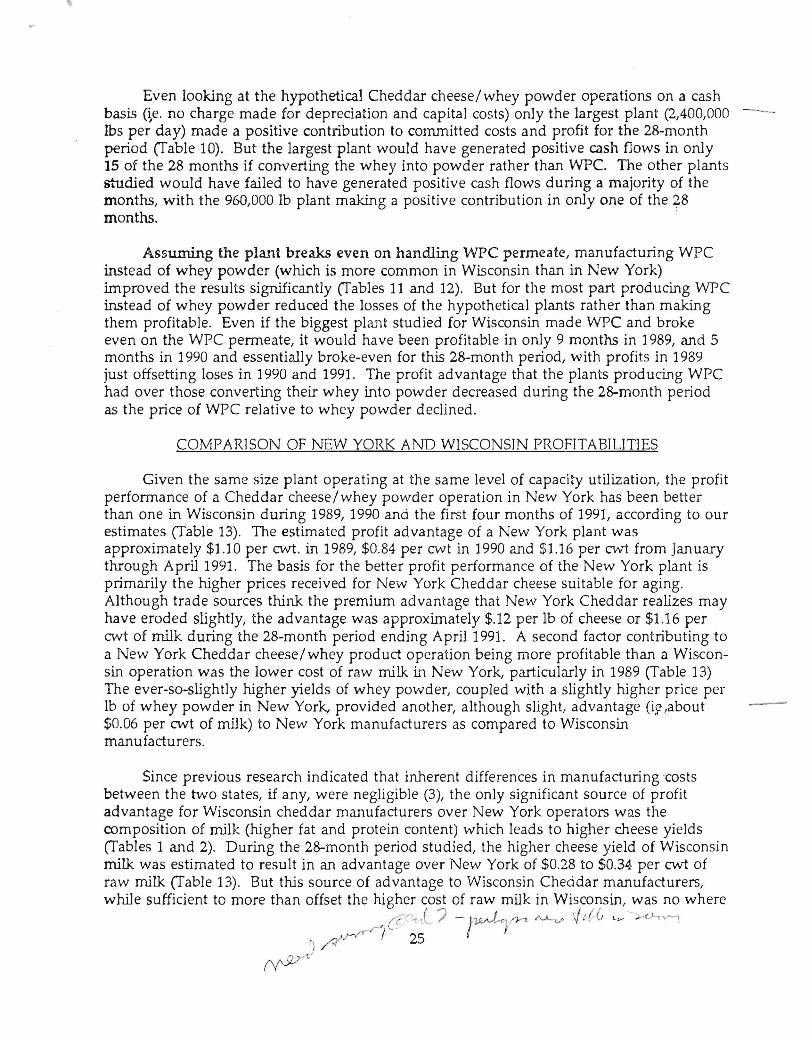
Even looking at the hypothetical Cheddar cheese/whey powder operations on a cash basis (;e. no charge made for depreciation and capital costs) only the largest plant (2AOO,OOO lbs per day) made a positive contribution to committed costs and profit for the 28-month period (fable 10). But the largest plant would have generated positive cash flows in only 15 of the 28 months if converting the whey into powder rather than wpc. The other plants studied would have failed to have generated positive cash flows during a majority of the months, with the 960,000 lb plant making a positive contribution in only one of the 28 months. '
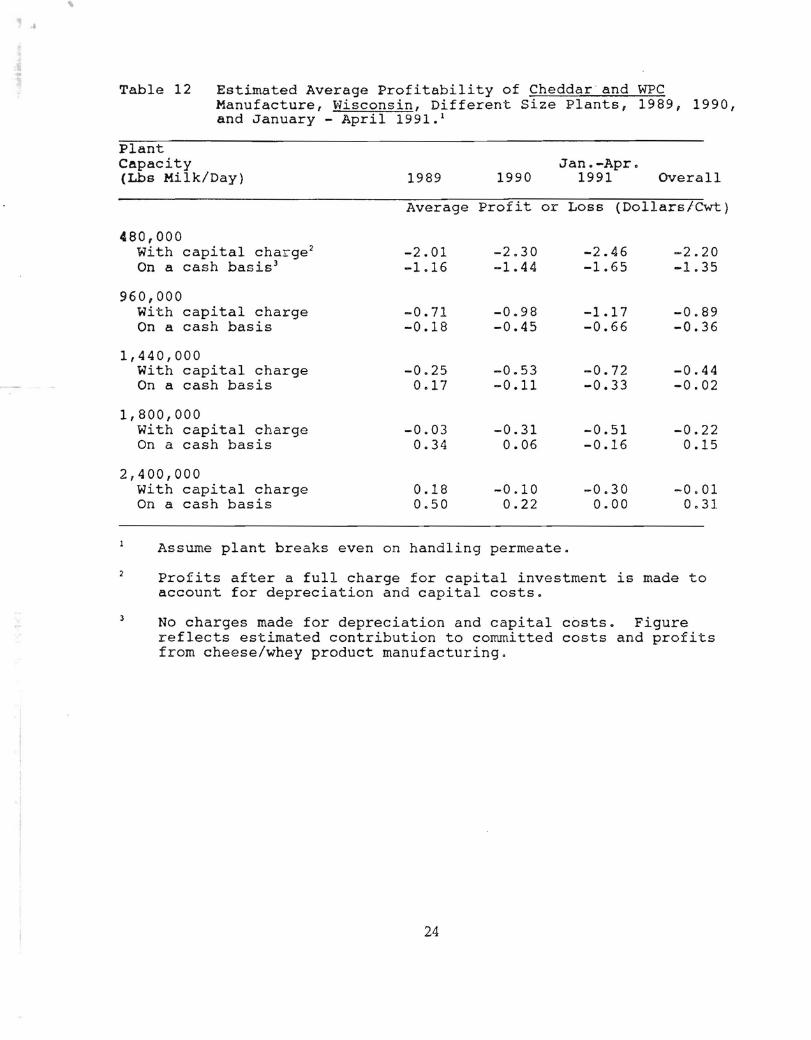
Assuming the plant breaks even on handling WPC permeate, manufacturing WPC instead of whey powder (which is more common in Wisconsin than in New York) improved the results significantly (fables 11 and 12). But for the most part producing WPC instead of whey powder reduced the losses of the hypothetical plants rather than making them profitable. Even if the biggest plal'1t studied for Wisconsin made WPC and broke even on the WPC permeate, it would have been profitable in only 9 months in 1989, and 5 months in 1990 and essentially broke-even for this 28-month period, with profits in 1989 just offsetting loses in 1990 and 1991. The profit ad vantage that the plants prod uciJl.g WPC had over those converting their whey into powder decreased during the 28-month period as the price of WPC relative to whey powder declined.
COMPARISON OF NEW YORK AND WISCONSIN PROFlTABlLITIES
Given the same size plant operating at the same level of capacity utilization, the profit performance of a Cheddar cheese/whey powder operation in New York has been better than one in Wisconsin during 1989, 1990 and the first four months of 1991, according to our estimates (Table 13). The estimated profit advantage of a New York plant was approximately $1.10 per cwt. in 1989, $0.84 per cwt in 1990 and $1.16 per cwt from January through April 1991. The basis for the better profit performance of the New York plant is primarily the higher prices received for New York Cheddar cheese suitable for aging. Although trade sources think the premium advantage that New York Cheddar realizes may have eroded slightly, the advantage was approximately $.12 per lb of cheese or $1.16 per cwt of milk during the 28-month period ending April 1991. A second factor contributing to a New York Cheddar cheese/whey product operation being more profitable than a Wisconsin operation was the lower cost of raw milk in New York, particularly in 1989 (Table 13) The ever-so-slightly higher yields of whey powder, coupled with a slightly higher price per lb of whey powder in New York, provided another, although slight, advantage (i~ ,about $0.06 per cwt of milk) to New York manufacturers as compared to Wisconsin manufacturers.
Since previous research indicated that inherent differences in manufacturing costs between the two states, if any, were negligible (3), the only significant source of profit advantage for Wisconsin cheddar manufacturers over New York operators was the composition of milk (higher fat and protein content) which leads to higher cheese yields (fables 1 and 2). During the 28-month period studied, the higher cheese yield of Wisconsin milk was estimated to result in an advantage over New York of $0.28 to $0.34 per cwt of raw milk (fable 13). But this source of advantage to Wisconsin Cheddar manufacturers, while sufficient to more than offset the higher cost of raw milk in Wisconsin, was no where
f CC"') ? - (wJ...~r ~1 d(J Lv - ~ (..'-> ..
~1
') ftrv~/ ~ 25
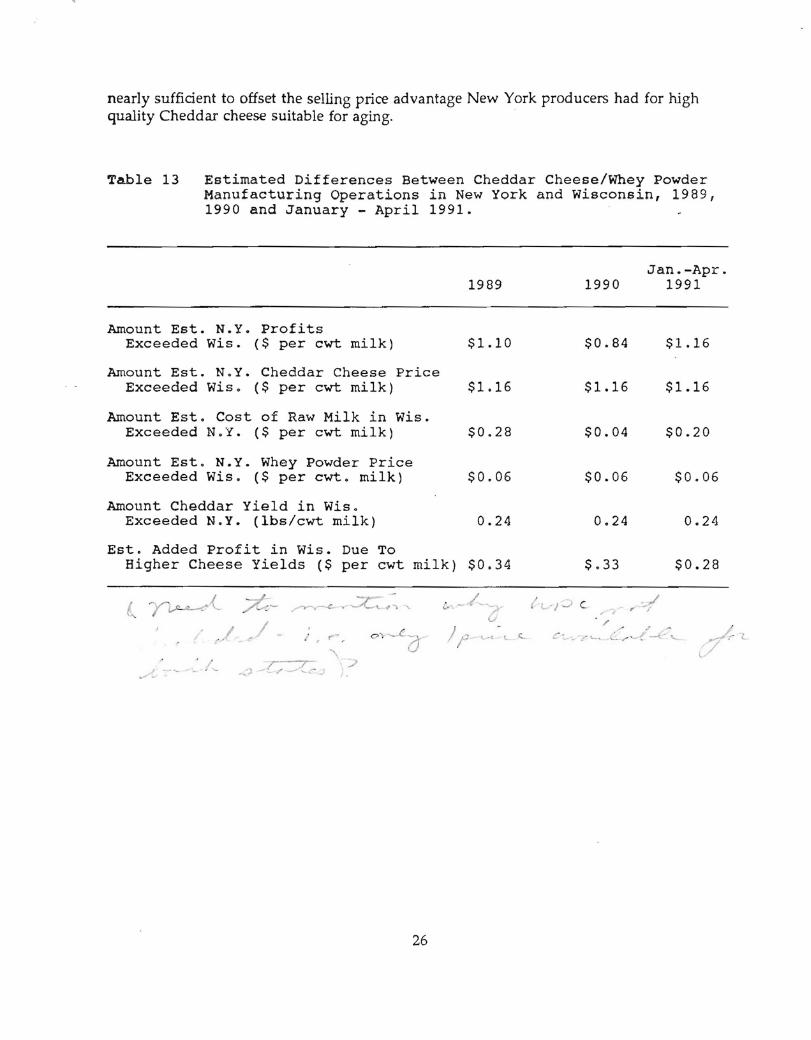
nearly sufficient to offset the selling price advantage New York producers had for high quality Cheddar cheese suitable for aging. .
Table 13 Estimated Differences Between Cheddar Cheese/Whey Powder Manufacturing Operations in New York and Wisconsin, 1989, 1990 and January - April 1991.
Amount Est. N.Y. Profits Exceeded Wis. ($ per cwt milk)
Amount Est. N.Y. Cheddar Cheese Price Exceeded Wis. ($ per cwt milk)
Amount Est. Cost of Raw Milk in wis. Exceeded N.Y. ($ per cwt milk)
Amount Est. N.Y. Whey Powder Price Exceeded Wis. ($ per cwt. milk)
Amount Cheddar Yield in Wis. Exceeded N.Y. (lbs/cwt milk)
Est. Added Profit in Wis. Due To
1989
$1.10
$1.16
$0.28
$0.06
0.24
Higher Cheese Yields ($ per cwt milk) $0.34
L ~{ :;:;t~
;' ~,t ,/ - . " , ("--.,
I
26
1990
$0.84
$1.16
$0.04
$0.06
0.24
$.33
Jan.-Apr. 1991
$1.16
$1.16
$0.20
$0.06
0.24
$0.28
1--> c , J. ~ , ,
" c:...."" .-.' L... L,... -.-i~~'-l... .
FACTORS AFFECTING COSTS AND PROFITABILITY
As already discussed, the estinutes made in this research effort indicate that economic conditions have made it difficult, if not impossible, for the profitable manufacture of Cheddar cheese and whey powder during the period January 1989 through April 1991, with the number of profitable months per year appearing to have decreased and the profits, if existing in 1989, tending to disappear (or the losses increasing) in 1990.
In interpreting the results and in trying to reconcile the poor operating results reported in this study with the large number of plants stili producing Cheddar cheese, several thlngs should be kept in mind.
1) The profit and loss estimates reflect only the manufacture of high-quality, fresh Cheddar cheese ready for aging, as well as the manufacture of the associated whey into either whey powder or wpc. The profitability estimates do not reflect the costs, added revenues or profits from cheese aging, cheese or whey marketing or overall corporate administration.
2) The profitability estimates do not reflect 'some "extras" that some cheese manufacturers have achieved to meet the challenge of making Cheddar cheese manufacturing profitable. One example of such "extras" would be having a larger capacity whey plant and taking in extra whey from nearby smaller cheese plants to capitalize on the strength of the whey products markets ii'l recent years. Another example would be establishing a market niche that yields higher selling prices than those assumed in making these estimates.
3) These profit and loss estimates reflect hypothetical operations. The costs and profitability of actual operations vary as a result of a number of factors. These factors (such as cheese composition, fat recovery in the cheese, operating schedule, labor rates and utility rates) can significantly affect costs, or revenues, and, in tum, the profitability of actual operations~ The effects of these and other factors affecting costs and profitability of Cheddar/whey product manufacture have been measured and reported in another publication (2). Except for the assumed fat recovery in the cheese n~. 89%) and assumed plant utilization factor (i~., annual average 71 %), both of which are thought to be typical, the hypothetical plants assume top-notch management and a high, but achievable, level of efficiency.
27
-
REFERENCES
1. Barbano, D.M., and DelaValle, M.E. Seasonal Variations in Milk Solids Components in Various Regions of the u.s. (abstract). Iournal of Dairy Science, Volume 68, Supplement 1, Pages 71-72, 1985.
2. Barbano, D., S. Hurst, R.D. Aplin. Factors Influencing Cost and Profitability of Cheese and Whey Product Manufacture. Pages 53-66 of Proceeding of Cheese Research and Technology Conference Center For Dairy Research, University of Wisconsin, Madison. 1991.
3. Messa-Dishington, 1.K, D.M. Barbano, and R.D. Aplin. Economic Performance of Cheddar Cheese Manufacturing Plants: 11 Plants in Northeast and North Central Regions. Department of Agricultural Economics Research Bulletin - A.E. Res. No. 87-2, Pages 1-43, 1987.
4. Mesa-Dishington, J.K., D.M. Barbano, and R.D. Aplin. Cheddar Cheese Manufacturing Costs: Economies of Size and Effects of Different Current Technologies. Department of Agricultural Economics Research Bulletin - A.E. Res. No. 87-3, Pages 1-86, 1987.
5. Hurst, S., R.D. Aplin, and D.M. Barbano. Whey Powder and Whey Protein Concentrate Production Technology, Costs and Profitability. Department of Agricultural Economics Research Bulletin - A .E. Res. No. 90-4, Pages 1-51. 1990
28