
Fairview Health Services Years Ended December 31, 2019 and ...
48
Ernst & Young LLP C ONSOLIDATED F INANCIAL S TATEMENTS Fairview Health Services Years Ended December 31, 2019 and 2018 With Report of Independent Auditors
Transcript of Fairview Health Services Years Ended December 31, 2019 and ...

Ernst & Young LLP
C O N S O L I D A T E D F I N A N C I A L S T A T E M E N T S
Fairview Health Services Years Ended December 31, 2019 and 2018 With Report of Independent Auditors

1911-3320751
Fairview Health Services
Consolidated Financial Statements
Years Ended December 31, 2019 and 2018
Contents
Report of Independent Auditors.......................................................................................................1
Consolidated Financial Statements
Consolidated Balance Sheets ...........................................................................................................3 Consolidated Statements of Operations and Changes in Net Assets ...............................................5 Consolidated Statements of Cash Flows ..........................................................................................7 Notes to Consolidated Financial Statements ....................................................................................8

A member firm of Ernst & Young Global Limited
Ernst & Young LLP Suite 1400 220 South Sixth Street Minneapolis, MN 55402-4509
Tel: +1 612 343 1000 ey.com
1911-3320751 1
Report of Independent Auditors
The Board of Directors Fairview Health Services
We have audited the accompanying consolidated financial statements of Fairview Health Services, which comprise the consolidated balance sheets as of December 31, 2019 and 2018, and the related consolidated statements of operations and changes in net assets, and consolidated statements of cash flows for the years then ended, and the related notes to the consolidated financial statements.
Management’s Responsibility for the Financial Statements
Management is responsible for the preparation and fair presentation of these financial statements in conformity with U.S. generally accepted accounting principles; this includes the design, implementation and maintenance of internal control relevant to the preparation and fair presentation of financial statements that are free of material misstatement, whether due to fraud or error.
Auditor’s Responsibility
Our responsibility is to express an opinion on these financial statements based on our audits. We conducted our audits in accordance with auditing standards generally accepted in the United States. Those standards require that we plan and perform the audit to obtain reasonable assurance about whether the financial statements are free of material misstatement.
An audit involves performing procedures to obtain audit evidence about the amounts and disclosures in the financial statements. The procedures selected depend on the auditor’s judgment, including the assessment of the risks of material misstatement of the financial statements, whether due to fraud or error. In making those risk assessments, the auditor considers internal control relevant to the entity’s preparation and fair presentation of the financial statements in order to design audit procedures that are appropriate in the circumstances, but not for the purpose of expressing an opinion on the effectiveness of the entity’s internal control. Accordingly, we express no such opinion. An audit also includes evaluating the appropriateness of accounting policies used and the reasonableness of significant accounting estimates made by management, as well as evaluating the overall presentation of the financial statements.
We believe that the audit evidence we have obtained is sufficient and appropriate to provide a basis for our audit opinion.

A member firm of Ernst & Young Global Limited
1911-3320751 2
Opinion
In our opinion, the financial statements referred to above present fairly, in all material respects, the consolidated financial position of Fairview Health Services at December 31, 2019 and 2018, and the consolidated results of its operations and its cash flows for the years then ended in conformity with U.S. generally accepted accounting principles.
Changes in Accounting Principles
As discussed in Note 2 to the consolidated financial statements, in 2019, Fairview Health Services changed their method of recognizing leases as a result of the adoption of Accounting Standards Update No. (ASU) 2016-02, Leases (Topic 842). Our opinion is not modified with respect to these matters.
ey April 14, 2020

3 1911-3320751
Fairview Health Services
Consolidated Balance Sheets (Dollars in Thousands)
December 31 2019 2018 Assets Current assets:
Cash and cash equivalents (Note 4) $ 70,725 $ 74,533 Short-term investments 396,510 560,588 Accounts receivable for medical services 709,769 623,419 Receivable under third-party payor contracts 3,993 1,229 Current portion of contributions receivable 8,147 10,081 Inventories 130,637 122,376 Other current assets 145,762 167,479
Total current assets 1,465,543 1,559,705 Investments 1,989,556 1,708,637 Assets limited as to use:
Held by insurance subsidiaries 63,696 73,732 Restricted fund investments 45,941 38,727 Other assets limited as to use 48,823 96,845
Total assets limited as to use 158,460 209,304 Other long-term assets:
Contributions receivable 10,870 10,254 Investments in related parties 60,376 43,641 Right-of-use operating lease assets 159,822 – Goodwill and intangible assets 90,911 92,929 Other long-term assets 40,066 44,545
Total other long-term assets 362,045 191,369 Land, buildings, and equipment, net 1,241,310 1,355,435 Total assets $ 5,216,914 $ 5,024,450

1911-3320751 4
December 31 2019 2018 Liabilities and net assets Current liabilities:
Accounts payable $ 332,153 $ 295,528 Accrued compensation and benefits 340,999 347,976 Payable under third-party payor contracts 12,677 14,906 Right-of-use operating lease obligations 27,645 – Current maturities of long-term debt 30,064 29,738 Other current liabilities 129,043 119,690
Total current liabilities 872,581 807,838 Other liabilities:
Insurance subsidiaries claims reserves 32,339 46,613 Workers’ compensation claims reserves 45,195 48,252 Right-of-use operating lease obligations 149,971 – Derivative financial instruments 82,672 57,645 Other long-term liabilities 63,345 72,026
Total other liabilities 373,522 224,536 Long-term debt 1,438,618 1,468,447 Total liabilities 2,684,721 2,500,821 Net assets:
Without donor restrictions: Fairview Health Services 2,425,099 2,418,535 Non-controlling interests 53,399 50,594
Total net assets without donor restrictions 2,478,498 2,469,129 Net assets with donor restrictions 53,695 54,500
Total net assets 2,532,193 2,523,629 Total liabilities and net assets $ 5,216,914 $ 5,024,450
See accompanying notes.
5 1911-3320751
Fairview Health Services
Consolidated Statements of Operations and Changes in Net Assets
(Dollars in Thousands)
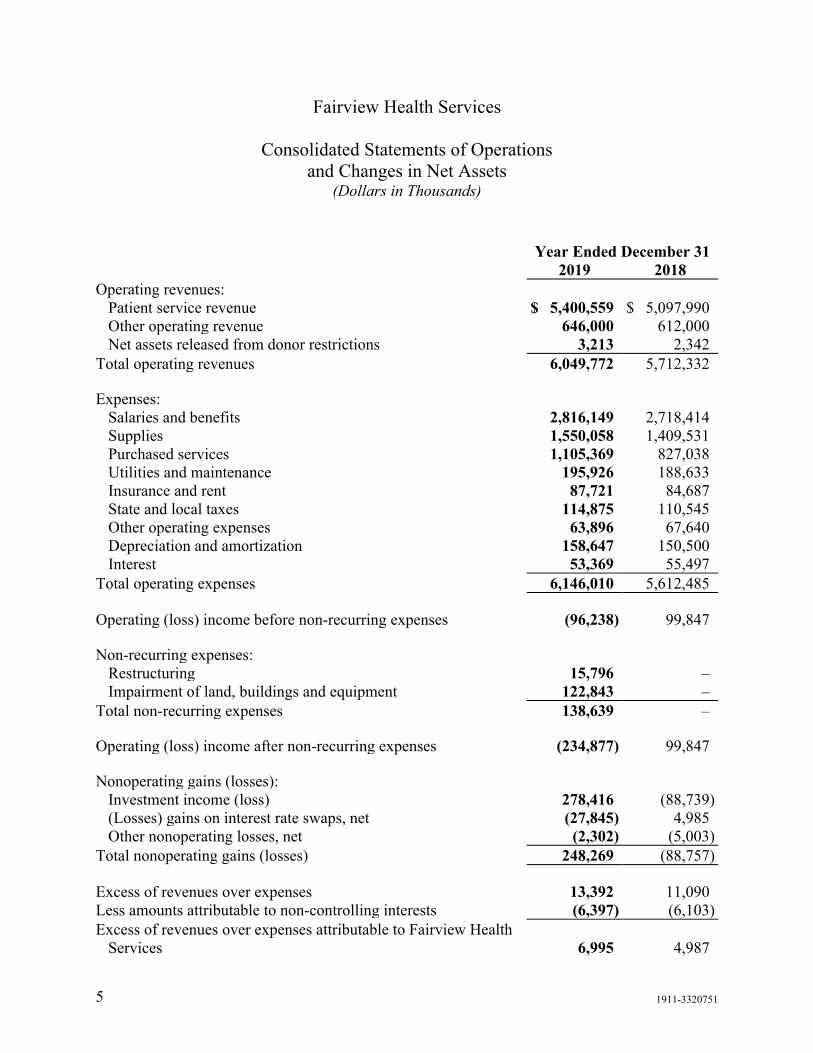
Year Ended December 31 2019 2018 Operating revenues:
Patient service revenue $ 5,400,559 $ 5,097,990 Other operating revenue 646,000 612,000 Net assets released from donor restrictions 3,213 2,342
Total operating revenues 6,049,772 5,712,332 Expenses:
Salaries and benefits 2,816,149 2,718,414 Supplies 1,550,058 1,409,531 Purchased services 1,105,369 827,038 Utilities and maintenance 195,926 188,633 Insurance and rent 87,721 84,687 State and local taxes 114,875 110,545 Other operating expenses 63,896 67,640 Depreciation and amortization 158,647 150,500 Interest 53,369 55,497
Total operating expenses 6,146,010 5,612,485 Operating (loss) income before non-recurring expenses (96,238) 99,847 Non-recurring expenses:
Restructuring 15,796 – Impairment of land, buildings and equipment 122,843 –
Total non-recurring expenses 138,639 – Operating (loss) income after non-recurring expenses (234,877) 99,847 Nonoperating gains (losses):
Investment income (loss) 278,416 (88,739) (Losses) gains on interest rate swaps, net (27,845) 4,985 Other nonoperating losses, net (2,302) (5,003)
Total nonoperating gains (losses) 248,269 (88,757) Excess of revenues over expenses 13,392 11,090 Less amounts attributable to non-controlling interests (6,397) (6,103) Excess of revenues over expenses attributable to Fairview Health
Services 6,995 4,987

1911-3320751 6
Year Ended December 31 2019 2018 Net assets without donor restrictions, Fairview Health Services:
Excess of revenues over expenses $ 6,995 $ 4,987 Pension and other postretirement liability adjustments (4,119) 3,581 Other changes, net 3,688 (2,588)
Increase in net assets without donor restrictions, Fairview Health Services 6,564 5,980
Net assets without donor restrictions, non-controlling interests:
Excess of revenues over expenses 6,397 6,103 Contributions from non-controlling interests 2,420 974 Distributions to non-controlling interests and other changes (6,012) (7,326)
Increase (decrease) in net assets without donor restrictions, non-controlling interests 2,805 (249)
Donor-restricted net assets: Contributions and other changes, net 7,657 7,902 Net assets released from restrictions (8,463) (7,920)
Decrease in donor-restricted net assets (805) (18) Total increase in net assets 8,564 5,713 Net assets at beginning of year 2,523,629 2,517,916 Net assets at end of year $ 2,532,193 $ 2,523,629
See accompanying notes.

1911-3320751 7
Fairview Health Services
Consolidated Statements of Cash Flows (Dollars in Thousands)
Year Ended December 31 2019 2018 Operating activities Increase in net assets $ 8,564 $ 5,713 Adjustments to reconcile increase in net assets to net cash provided by
(used in) operating activities: Depreciation and amortization 158,647 150,500 Impairment of land, building, and equipment 122,843 – Pension and other postretirement liability adjustments 4,119 (3,581) Net realized and unrealized (gains) losses on trading investments (234,724) 124,388 Change in fair value of interest and basis rate swaps 24,975 (9,391) Contribution from business combinations – (7,220) Loss on extinguishment of debt – 8,849 Other, net (1,517) (2,523) Changes in assets and liabilities:
Accounts receivable for medical services (86,350) (40,180) Other current assets 10,693 (34,831) Current liabilities 62,324 (9,985) Other assets and liabilities, net 9,591 (2,030)
Net cash provided by operating activities before change in trading and alternative investments 79,165 179,709
Change in trading and alternative investments 127,981 (195,649) Net cash provided by (used in) operating activities 207,146 (15,940) Investing activities Purchases of land, buildings, and equipment, net (186,151) (120,070) Other investing activities (34,531) (8,950) Net cash used in investing activities (220,682) (129,020) Financing activities Proceeds from issuance of long-term debt 4,421 514,365 Principal payments on long-term debt (23,405) (26,202) Payments for defeasance of long-term debt (13,907) (411,425) Other financing activities, net 1,873 454 Net cash (used in) provided by financing activities (31,018) 77,192 Decrease in cash and cash equivalents (44,554) (67,768) Cash and cash equivalents at beginning of year 393,961 461,729 Cash and cash equivalents at end of year (Note 4) $ 349,407 $ 393,961 Supplemental disclosure of noncash investing and financing activities Accruals for purchases of buildings and equipment $ 3,339 $ 7,425
See accompanying notes.
1911-3320751 8
Fairview Health Services
Notes to Consolidated Financial Statements (Dollars in Thousands)
December 31, 2019
1. Organization and Basis of Presentation
Fairview Health Services, an integrated health system, along with its affiliates and subsidiaries (collectively referred to as Fairview) is a nonprofit corporation headquartered in Minnesota and is exempt from federal income taxation under Section 501(c)(3) of the Internal Revenue Code (the IRC).
Fairview serves the entire 12-county Greater Minneapolis-St. Paul metro area (the Metro Area), as well as communities throughout greater Minnesota and portions of Northern Iowa and Western Wisconsin. Fairview offers a broad continuum of health care services and owns and operates 11 hospitals, including the University of Minnesota Medical Center, Fairview, with the University of Minnesota Masonic Children’s Hospital (collectively, UMMC), which is the adult and pediatric teaching hospital of the University of Minnesota (the University). UMMC and eight of Fairview’s community hospitals are located in the metro area. Fairview’s other two community hospitals are located in northern Minnesota. Together, Fairview also operates more than 100 primary and specialty care clinics, eight ambulatory care centers, over 40 retail and specialty pharmacies, pharmacy benefit management services, rehabilitation centers, counseling and home health care programs, a physician network, senior care housing and long-term care facilities, hospice and home care, medical transportation services, and a health plan.
Fairview, through its integrated care model, serves the Metro Area and greater Minnesota, aiming to deliver the benefits of academic medicine to more patients and families across the state by expanding care, research and education through access to a greater pool of physicians and patients, while seeking to reduce the total cost of care for patients.
The consolidated financial statements include the accounts of Fairview, comprising both tax-exempt and taxable entities. All significant intercompany balances and transactions have been eliminated in consolidation.
2. Summary of Significant Accounting Policies
Use of Estimates
The preparation of consolidated financial statements in conformity with accounting principles generally accepted in the United States requires management to make estimates and assumptions that affect certain assets, liabilities, revenues, and expenses reported in the consolidated financial statements and accompanying notes. Although estimates are considered to be fairly stated at the time the estimates are made, actual results could differ from those estimates.

Fairview Health Services
Notes to Consolidated Financial Statements (continued) (Dollars in Thousands)
1911-3320751 9
2. Summary of Significant Accounting Policies (continued)
Cash and Cash Equivalents
Cash and cash equivalents include currency on hand, demand deposits with banks or other financial institutions, and short-term investments with maturities of 90 days or less from the date of purchase that have not otherwise been classified as long-term assets due to a designation for long-term purposes. Fairview’s cash investments are placed with high-quality financial institutions and may exceed federal depository insurance limits. Restricted cash and cash equivalents include amounts described above that are included within assets limited as to use.
Inventories
Inventories, consisting primarily of drugs and medical supplies, are recorded at the lower of cost or net realizable value on a first-in, first-out basis.
Investments
Fairview’s investments include money market, fixed income, and equity securities, which are carried at fair value, based on quoted market prices, and are classified as trading securities. Investments in commingled funds are recorded at net asset value as a practical expedient to fair value. Investments in companies that hold interests in diversified funds of hedge funds, hedge funds, private capital funds and real estate funds (collectively, alternative investments) are recorded using the equity method of accounting, with the change in value of these investments recorded as investment return in the consolidated statements of operations and changes in net assets. Values of some of the underlying investments may be based on estimates that require varying degrees of judgment, and consequently, these estimates may differ from the values at which investments may be sold. Values for fund of hedge funds are primarily based on financial data supplied by the underlying investee funds. Values for real estate funds are based on the fair value of the underlying real estate.
Realized investment income on investments held by insurance subsidiaries is recorded in other operating revenue in the consolidated statements of operations and changes in net assets. Investment return (including realized and unrealized gains and losses, interest, and dividends) from all other investments and unrealized investment income on funds held by insurance subsidiaries are recorded as nonoperating gains or losses, unless restricted by donor or law.

Fairview Health Services
Notes to Consolidated Financial Statements (continued) (Dollars in Thousands)
1911-3320751 10
2. Summary of Significant Accounting Policies (continued)
Derivative Financial Instruments
Derivative financial instruments are recognized as either assets or liabilities based on the net fair value in accordance with the netting provisions in the counterparty agreement. Fairview uses pricing models for various types of derivative instruments that take into account the present value of estimated future cash flows and credit valuation adjustments.
Gains or losses resulting from changes in the fair values of derivative financial instruments are reflected within the consolidated statements of operations and changes in net assets as nonoperating gains or losses, as none of the derivative financial instruments are designated as an accounting hedge. Any differences between interest received and paid under swap agreements are reported as nonoperating gains or losses.
Investments in Related Parties
Investments in entities in which Fairview has the ability to exercise significant influence over operating and financial policies, but does not have operational control, are recorded under the equity method of accounting. Equity method investments are recorded as investments in related parties in the consolidated balance sheets.
Goodwill and Intangible Assets
Goodwill and intangible assets related to acquisitions are recorded in the consolidated balance sheets. During 2019 and 2018, Fairview acquired $921 and $13,982, respectively, of goodwill and intangible assets.
Land, Buildings, and Equipment
Land, buildings, and equipment are recorded at cost and depreciated over estimated useful lives using the straight-line method. The following estimated useful lives are used in calculating depreciation:
Land improvements 5–20 yearsBuildings 30–40 yearsBuilding additions and improvements 17–25 yearsEquipment 2–20 years
Fairview Health Services
Notes to Consolidated Financial Statements (continued) (Dollars in Thousands)
1911-3320751 11
2. Summary of Significant Accounting Policies (continued)
Interest cost, net of related interest income, incurred on funds used during the period for construction of capital assets is capitalized as part of the cost of acquiring those assets.
Asset Impairment
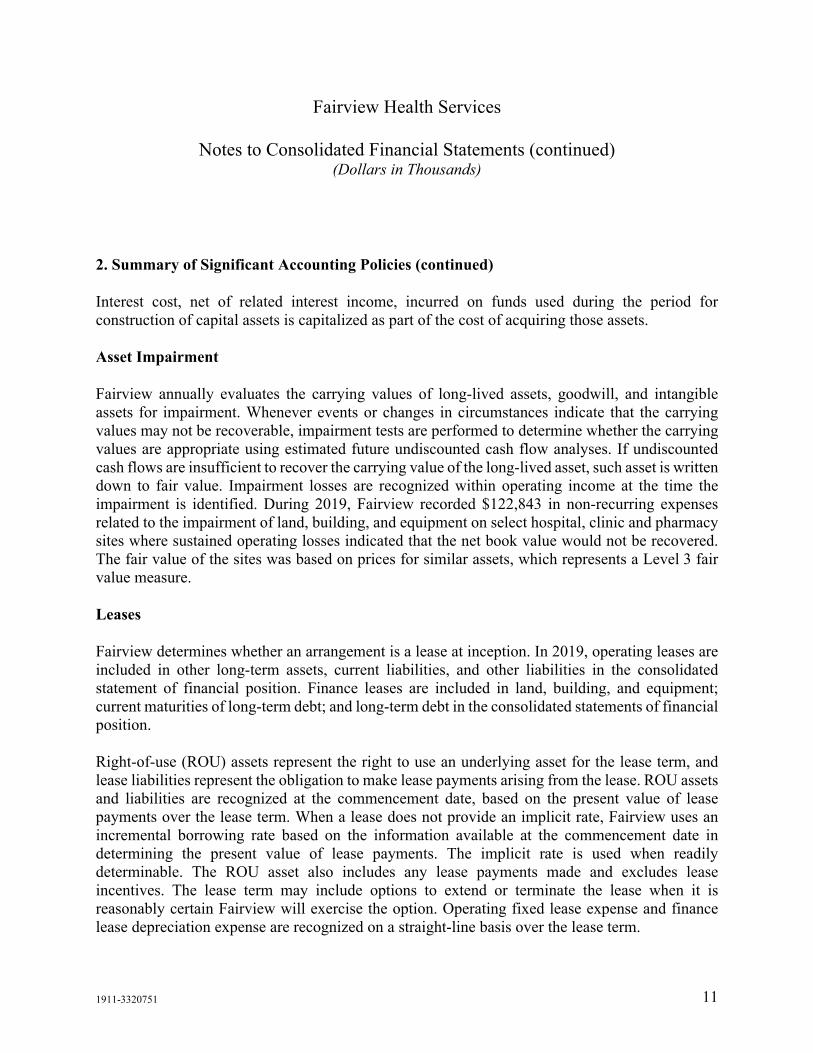
Fairview annually evaluates the carrying values of long-lived assets, goodwill, and intangible assets for impairment. Whenever events or changes in circumstances indicate that the carrying values may not be recoverable, impairment tests are performed to determine whether the carrying values are appropriate using estimated future undiscounted cash flow analyses. If undiscounted cash flows are insufficient to recover the carrying value of the long-lived asset, such asset is written down to fair value. Impairment losses are recognized within operating income at the time the impairment is identified. During 2019, Fairview recorded $122,843 in non-recurring expenses related to the impairment of land, building, and equipment on select hospital, clinic and pharmacy sites where sustained operating losses indicated that the net book value would not be recovered. The fair value of the sites was based on prices for similar assets, which represents a Level 3 fair value measure.
Leases
Fairview determines whether an arrangement is a lease at inception. In 2019, operating leases are included in other long-term assets, current liabilities, and other liabilities in the consolidated statement of financial position. Finance leases are included in land, building, and equipment; current maturities of long-term debt; and long-term debt in the consolidated statements of financial position.
Right-of-use (ROU) assets represent the right to use an underlying asset for the lease term, and lease liabilities represent the obligation to make lease payments arising from the lease. ROU assets and liabilities are recognized at the commencement date, based on the present value of lease payments over the lease term. When a lease does not provide an implicit rate, Fairview uses an incremental borrowing rate based on the information available at the commencement date in determining the present value of lease payments. The implicit rate is used when readily determinable. The ROU asset also includes any lease payments made and excludes lease incentives. The lease term may include options to extend or terminate the lease when it is reasonably certain Fairview will exercise the option. Operating fixed lease expense and finance lease depreciation expense are recognized on a straight-line basis over the lease term.

Fairview Health Services
Notes to Consolidated Financial Statements (continued) (Dollars in Thousands)
1911-3320751 12
2. Summary of Significant Accounting Policies (continued)
Fairview defines a short-term lease as any lease arrangement with a lease term of 12 months or less that does not include an option to purchase the underlying asset. Short-term lease payments are recognized as expense on a straight-line basis over the lease term and variable lease payments in the period in which the obligation is incurred.
Fairview has lease arrangements with lease and non-lease components, which are generally accounted for separately, except Fairview has elected the practical expedient to not separate non-lease components for real estate leases. Additionally, for certain equipment leases, Fairview applies a portfolio approach to effectively account for the ROU assets and liabilities.
Leases at December 31, 2019, are presented in accordance with Financial Accounting Standard Board (FASB) Accounting Standards Update (ASU) No. 2016-02, Leases (Topic 842). The 2018 presentation follows the Financial Accounting Standard Board (FASB) Accounting Standards Codification (ASC), Leases (Topic 840), in effect at December 31, 2018.
Net Assets
Net assets without donor restrictions are used to account for all transactions related to medical services and other operating and nonoperating activities for which there are no donor-imposed restrictions and may be used at the discretion of management and the board of directors of Fairview. Net assets with donor restrictions are those assets subject to stipulations imposed by donors and grantors. Some donor restrictions are temporary in nature; those restrictions are met by passage of time or actions of Fairview. Other donor restrictions are perpetual in nature, whereby the donor has stipulated the funds be maintained in perpetuity.
Non-Controlling Interests
The consolidated financial statements include entities in which Fairview has less than 100% ownership but otherwise controls in accordance with applicable accounting guidance. Non-controlling interests represent the portion of excess of revenues over expenses and net assets without donor restrictions not attributable to Fairview.
Patient Service Revenue and Accounts Receivable for Medical Services
Patient service revenue is reported at the amount that reflects the consideration to which Fairview expects to be entitled in exchange for providing patient care.
Fairview Health Services
Notes to Consolidated Financial Statements (continued) (Dollars in Thousands)
1911-3320751 13
2. Summary of Significant Accounting Policies (continued)
Charity and Uncompensated Care
Under Fairview’s charity care policy, patients who have no insurance or are underinsured and are ineligible for any government assistance program have their bill reduced to no more than the amount generally billed to individuals who have insurance for emergency or medically necessary care using a look-back method for reimbursement received from all commercial and Medicare accounts for the previous fiscal year.
The estimated cost of providing charity care was $36,637 and $31,146 during 2019 and 2018, respectively. This total cost is estimated by applying an overall cost-to-charge ratio to the charges incurred. Total cost includes wages and salaries, supplies, building maintenance, equipment, and administrative expenses.
Other Operating Revenue
Other operating revenue primarily consists of health insurance services revenue, pharmacy benefit management (PBM) revenue, income from investments in related parties recorded on the equity basis, contributions without donor restrictions, and other miscellaneous revenue.
Health insurance services revenue consists of health premium revenue, administrative service revenue, and management fees. Health premium revenue is recognized in the period for which services are covered. Membership contracts are generally established on a yearly basis and are subject to cancellation by the employer group upon 30 to 90 days’ written notice.
Administrative service revenue consists of third-party administrative fees from self-insured employer groups and network access fees from other insurance companies and third-party administrators. Third-party administrative fees are recognized as revenue during the period in which there is an obligation to provide services to the self-insured employer groups. Network access fees are recognized as revenue during the period in which there is an obligation to reprice provider claims to discounted rates for the insurance companies and third-party administrators. Both types of administrative service revenue are primarily calculated on a per-employee, per-month basis and are due monthly.
Administrative service revenue is recorded net of certain related fees, which primarily consist of national network access fees, employee assistance program and wellness fees, and pharmacy benefit administrative fees, which are added to the monthly administrative fee billed.

Fairview Health Services
Notes to Consolidated Financial Statements (continued) (Dollars in Thousands)
1911-3320751 14
2. Summary of Significant Accounting Policies (continued)
Services provided to PBM clients include plan setup, claims adjudication with network pharmacies, formulary management, and reimbursement services. The PBM contractually assumes credit risk when administering pharmacy reimbursement contracts; therefore, revenue is recognized at the cost of the claim in addition to the administrative fees earned for providing the PBM services, except for claims fulfilled at Fairview pharmacies. For claims fulfilled at Fairview pharmacies, claims revenue is not recognized within the PBM as that revenue has been recognized within Fairview pharmacy.
Rebates received under arrangements with manufacturers or third-party intermediaries are recorded as liabilities to be paid to the PBM clients, less applicable administrative fees.
Under the PBM’s pharmacy network contracts, the pharmacy is solely obligated to collect the co-payments from the members. Under client contracts, the PBM does not assume liability for member co-payments in pharmacy transactions. As such, the PBM does not include member co-payments to retail pharmacies in revenue.
For administrative services revenue and PBM revenue, performance obligations are satisfied over time. Revenue is therefore recognized pro rata over the time-bound performance obligation as Fairview transfers service over the period in which the member is entitled to the services. Performance obligations for contracts that are greater than one year were not material. Incremental costs of obtaining a contract are treated as an expense when incurred as the time period of most contracts with customers is one year.
Contributions
Contributions are reported as donor-restricted support if they are received with donor stipulations that limit the use of the donated assets. When donor restrictions are satisfied, net assets with donor restrictions are reclassified to net assets without donor restrictions and reported within the consolidated statements of operations and changes in net assets either as net assets released from restriction if the purpose relates to operations or as contributions of long-lived assets if the purpose relates to capital. Donor-restricted contributions whose restrictions or conditions are met within the same fiscal year as the revenue is recognized are received are reported as support within net assets without donor restriction in the accompanying consolidated financial statements.

Fairview Health Services
Notes to Consolidated Financial Statements (continued) (Dollars in Thousands)
1911-3320751 15
2. Summary of Significant Accounting Policies (continued)
Unconditional promises to give cash and other assets are reported at fair value at the date the promise is received. Conditional promises to give are reported at fair value when the gift is received and all conditions have been satisfied. All unrestricted contributions are reported within other operating revenue in the consolidated statements of operations and changes in net assets.
Contributions receivable are recorded in the period that the contributions are made and represent unconditional promises to give for various operating and capital purposes. Contributions that are expected to be collected in future years are recorded at the present value of their estimated future cash flows. An allowance for uncollectible pledges receivable is determined based on a review of estimated collectability.
Amounts receivable directly from donors are generally expected to be collected within one year. Fairview also records assets related to contributions raised through the University of Minnesota Foundation on Fairview’s behalf, which are expected to be received within one to five years. The University of Minnesota Foundation releases funds to Fairview as the donor restrictions, if any, are satisfied.
Performance Indicator
The performance indicator is excess of revenues over expenses. Changes in net assets without donor restrictions that are excluded from excess of revenues over expenses include pension and other postretirement liability adjustments, contributions of long-lived assets, contributions from non-controlling interests, and distributions to non-controlling interests.
Recently Adopted Accounting Guidance
In February 2016, the FASB issued ASU 2016-02, Leases (Topic 842). Fairview adopted the standard on January 1, 2019, using the modified retrospective method of transition, applying the new standard to all leases existing at the date of initial application. The ASU requires that leasing arrangements longer than 12 months result in an entity recognizing an asset and liability. For leases that commenced before the effective date of ASU 2016-02, Fairview elected the permitted practical expedients to not reassess the following: (i) whether any expired or existing contracts contain leases; (ii) the lease classification for expired or existing leases; and (iii) initial direct costs for existing leases. As a result of adoption, Fairview established $136,425 of ROU assets classified as right-of-use operating lease assets and a $141,936 lease liability split between short-term and

Fairview Health Services
Notes to Consolidated Financial Statements (continued) (Dollars in Thousands)
1911-3320751 16
2. Summary of Significant Accounting Policies (continued)
long-term right-of-use operating lease obligations at January 1, 2019, which were not recorded on the consolidated balance sheet as of December 31, 2018. There was not a material impact to the consolidated statement of operations and changes in net assets because of the adoption of the standard. Further disclosure regarding the impact of the adoption of the ASU can be found in Note 10.
In June 2018, the FASB issued ASU 2018-08, Not-for-Profit Entities (Topic 958): Clarifying the Scope and the Accounting Guidance for Contributions Received and Contributions Made, which provides a more robust framework to determine when a transaction should be accounted for as a contribution or as an exchange transaction and provides additional guidance about how to determine whether a contribution is conditional. Fairview adopted the standard on January 1, 2019, on a modified prospective basis. The adoption of this ASU did not have a significant effect on Fairview’s consolidated financial statements.
New Accounting Standard Not Yet Adopted
In August 2018, the FASB issued ASU 2018-13, Fair Value Measurement (Topic 820): Disclosure Framework – Changes to the Disclosure For Fair Value Measurement. This ASU improves the effectiveness of the notes to financial statements through changes in the disclosure requirements for fair value measurement. The ASU is effective January 1, 2020, and will be applied using a retrospective approach. Fairview is currently assessing the impact that ASU 2018-13 will have on its consolidated financial statements and will adopt the provisions upon the effective date.
In August 2018, the FASB issued ASU 2018-15, Intangibles – Goodwill and Other Internal-Use Software (Subtopic 350-40): Customer’s Accounting for Implementation Costs Incurred in a Cloud Computing Arrangement That Is a Service Contract. This ASU aligns the requirements for capitalizing implementation costs incurred in a hosting arrangement that is a service contract with the requirements for capitalizing implementation costs incurred to develop or obtain internal-use software. The ASU is effective January 1, 2021, and will be applied using a prospective approach. Fairview is currently assessing the impact that ASU 2018-15 will have on its consolidated financial statements and will adopt the provisions upon the effective date.
Reclassifications
Certain prior year amounts in the consolidated financial statements have been reclassified to conform to the 2018 presentation. These reclassifications had no effect on the change in net assets or net assets as previously reported.

Fairview Health Services
Notes to Consolidated Financial Statements (continued) (Dollars in Thousands)
1911-3320751 17
3. Affiliations
Fairview, the University, and the University of Minnesota Physicians (UMP), a multi-specialty group practice of over 1,200 physicians including more than 900 University faculty members, affirmed their affiliation and approved a new affiliation agreement (MHealth Fairview Agreement) effective December 2018. While the parties maintain separate governance, the MHealth Fairview Agreement further integrates operations across the clinical delivery system and enhances research and education by creating a joint clinical enterprise among the parties. The MHealth Fairview Agreement re-shaped the previous affiliation to bring together not only UMMC and its related service lines, but also Fairview’s other hospitals, clinics, and services. All are part of a shared care delivery system that is led by a single structure that includes academic physician leadership. The MHealth Fairview Agreement furthers the opportunity to create a nationally renowned academic health system. The delivery system will be united under a single brand, MHealth Fairview, which launched into the marketplace in October 2019 and will roll out through 2020. The MHealth Fairview Agreement expires in 2026, with an option for a 10-year extension in 2023. Fairview and UMP also entered into a Master Professional Services Agreement to facilitate payment from Fairview to UMP for all professional, clinical, and management services.
Fairview’s bylaws authorize a board of directors of up to 21 members. Four of the 21 members of Fairview’s Board of Directors were appointed by and/or held positions at the University. Through the MHealth Fairview Agreement and Board representation, the University participates in capital funding decisions for the delivery system.
The MHealth Fairview Agreement provides for fixed and variable financial support based on the financial performance of Fairview to the University and UMP. The minimum variable academic support commitment to the University is 0.15% of Patient Service revenue through 2026. The minimum fixed annual academic support commitment to the University was $40,000 in 2019 and is $45,000 in 2020, $50,000 in 2021 and 2022, increasing thereafter through 2026 in accordance with the consumer price index (CPI). The minimum fixed annual academic support commitment to UMP was $29,800 in 2019 increasing annually thereafter in accordance with the CPI.

Fairview Health Services
Notes to Consolidated Financial Statements (continued) (Dollars in Thousands)
1911-3320751 18
3. Affiliations (continued)
Revenue and expenses on a gross basis under all of Fairview’s agreements, including academic support, with the University were, respectively, $14,687 and $105,605 for 2019; and $11,069 and $70,925 for 2018. These amounts were recorded within other operating revenue and the related expense categories in the consolidated statements of operations and changes in net assets. Amounts receivable from and payable to the University were, respectively, $9,283 and $31,636 at December 31, 2019; and $8,180 and $21,359 at December 31, 2018. These amounts were recorded within other current assets and accounts payable in the consolidated balance sheets.
Revenue and expenses on a gross basis under all of Fairview’s agreements with UMP, including academic support were, respectively, $5,329 and $509,223 for 2019; and $5,932 and $252,473 for 2018. These amounts were recorded primarily within other operating revenue and purchased services in the consolidated statements of operations and changes in net assets. Amounts receivable from and payable to UMP were, respectively, $1,490 and $46,590 at December 31, 2019; and $3,712 and $54,387 at December 31, 2018. These amounts were recorded within other current assets and accounts payable in the consolidated balance sheets.
4. Cash, Cash Equivalents, and Restricted Cash
The following table provides a reconciliation of cash, cash equivalents, and restricted cash reported within the consolidated balance sheets that sum to the total of the same such amounts shown in the consolidated statements of cash flows:
2019 2018 Cash and cash equivalents $ 70,725 $ 74,533 Cash and cash equivalents included in investments 263,441 299,327 Restricted cash included in assets limited as to
use within: Held by insurance subsidiaries 191 736 Restricted fund investments 12,196 5,488 Other assets limited as to use 2,854 13,877
Total cash, cash equivalents, and restricted cash shown in the consolidated statements of cash flows $ 349,407 $ 393,961

Fairview Health Services
Notes to Consolidated Financial Statements (continued) (Dollars in Thousands)
1911-3320751 19
5. Liquidity and Availability of Resources
Fairview’s working capital can fluctuate moderately during the year due to timing of payment received on accounts receivable for medical services from certain payors, timing of cash inflows and outflows related to the affiliation agreements, and timing of cash outflows, including payments on long-term debt, capital expenditures for land building and equipment, and timing of employee payments.
Fairview’s financial assets available within one year of the consolidated balance sheet as of December 31, for general expenditure are as follows:
2019 2018 Financial assets:
Cash and cash equivalents $ 70,725 $ 74,533 Short-term investments 396,510 560,588 Accounts receivable for medical services 709,769 623,419 Investments 1,989,556 1,708,637
Total financial assets 3,166,560 2,967,177 Liquidity resource:
Line of credit 50,000 50,000 Less amounts not designated for general expenditure or not
available within one year: Private capital funds (17,231) (11,314) Investments that could be contractually held back
at liquidation (10,874) (12,320) Committed for capital expenditure (137,000) (230,000)
Financial assets not available for use within one year (165,105) (253,634) Less amount of restricted cash included in assets
limited to use within: Held by insurance subsidiaries (191) (736) Restricted fund investments (12,196) (5,488) Other assets limited as to use (2,854) (13,877)
Financial assets restricted cash (15,241) (20,101) Total financial assets and liquidity resources available within
one year for general expenditure $ 3,036,214 $ 2,743,442

Fairview Health Services
Notes to Consolidated Financial Statements (continued) (Dollars in Thousands)
1911-3320751 20
5. Liquidity and Availability of Resources (continued)
As part of Fairview’s liquidity management, management structures its financial assets to be available as its general expenditures, liabilities, and other obligations come due. In addition, Fairview invests cash in excess of daily requirements in short-term investments. To help management with unexpected liquidity needs, Fairview has a $50,000 line of credit with a bank that can be drawn upon.
6. Patient Service Revenue and Accounts Receivable for Medical Services
Patient service revenue is reported at the amount that reflects the consideration to which Fairview expects to be entitled in exchange for providing patient care. Patient services revenue includes amounts due from patients, third-party payors (including health insurers and government programs), and others and includes variable consideration for retroactive revenue adjustments due to settlement of ongoing and future audits and reviews. Generally, Fairview bills patients and third-party payors within days after the services are performed or discharged.
Patient service revenue is recognized as performance obligations are satisfied. Performance obligations are determined based on the nature of the services provided by Fairview. Patient service revenue for performance obligations satisfied over time is recognized based on estimated expected payment at that point in time. Fairview believes that this method provides a reasonable depiction of the transfer of services over the term of the performance obligation based on the services needed to satisfy the obligation. Generally, performance obligations satisfied over time relate to patients receiving inpatient acute care services including transplant services. Fairview measures the performance obligation from admission into the hospital to the point when it is no longer required to provide services to that patient, which is generally at the time of the discharge. Outpatient services are performance obligations satisfied at a point in time, and revenue is recognized when goods or services are provided and Fairview does not believe it is required to provide additional goods or services.
As substantially all of its performance obligations relate to contract with a duration of less than one year, Fairview has elected to apply the optional exemption provided in ASU 2014-09 and, therefore, is not required to disclose the aggregate amount of the transaction price allocated to performance obligations that are unsatisfied or partially unsatisfied at the end of the reporting period. The unsatisfied or partially unsatisfied performance obligations referred to above are primarily related to inpatient acute care services at the end of the reporting period for patients who
Fairview Health Services
Notes to Consolidated Financial Statements (continued) (Dollars in Thousands)
1911-3320751 21
6. Patient Service Revenue and Accounts Receivable for Medical Services (continued)
remain admitted at that time (in-house patients) or transplant patients who receive follow-up care. The performance obligations for these contracts are generally completed when the patients are discharged, which for the majority of Fairview’s in-house patients occurs within days or weeks of the reporting period.
Fairview uses a portfolio approach to account for categories of patient contracts as a collective group rather than recognizing revenue on an individual contract basis. The portfolios primarily consist of major payor classes for inpatient, outpatient, and other patient revenue. Based on
historical collection trends and other analysis, Fairview believes that revenue recognized by utilizing the portfolio approach approximates the revenue that would have been recognized if an individual contract approach were used.
Fairview’s initial estimate of the transaction price is determined by reducing the total standard charges related to the patient services provided by various elements of variable consideration, including contractual adjustments, discounts, implicit price concessions, and other reductions to Fairview’s standard charges. Fairview determines the transaction price associated with services provided to patients who have third-party payor coverage based on reimbursement terms per contractual agreements, Fairview’s discount policies, and historical experience. Generally, patients who are covered by third-party payors are responsible for related deductibles and coinsurance, which vary in amount. For patients with deductibles and coinsurance, or uninsured and underinsured patients who do not apply or do not meet the qualifications for charity care, Fairview determines the transaction price associated with services on the basis of charges reduced by implicit price concessions. Implicit price concessions included in the estimate of the transaction price are based on Fairview’s historical collection experience for applicable patient portfolios.
Subsequent changes to the estimate of the transaction price (determined on a portfolio basis when applicable) are generally recorded as adjustments to patient service revenue in the period of the change. For the years ended December 31, 2019 and 2018, changes in Fairview’s estimates of implicit price concessions, discounts, contractual adjustment, or other reductions to expected payments for performance obligations satisfied in prior periods were not significant. Portfolio collection estimates are updated monthly based on collection trends. Subsequent changes that are determined to be the result of an adverse change in the patient’s ability to pay (determined on a portfolio basis when applicable) are recorded as bad debt expense. Bad debt expense for the years ended December 31, 2019 and 2018, was not significant.
Fairview Health Services
Notes to Consolidated Financial Statements (continued) (Dollars in Thousands)
1911-3320751 22
6. Patient Service Revenue and Accounts Receivable for Medical Services (continued)
Settlements with third-party payors for total cost of care payor contracts, cost report filings, and retroactive adjustments due to ongoing and future contract provisions, audits, or reviews are considered variable consideration and are included in the determination of the estimated transaction price for providing patient care. These settlements are estimated based on the terms of the payment agreement with the payor, correspondence from the payor, and Fairview’s historical settlement activity, including an assessment to ensure that it is probable that a significant reversal in the amount of cumulative revenue recognized will not occur when the uncertainty associated with the retroactive adjustment is subsequently resolved. Such estimates are determined through either a probability-weighted estimate or an estimate of the most likely amount, depending on the circumstances related to a given estimated settlement item. Estimated settlements are adjusted in future periods as adjustments become known, or as years are settled or are no longer subject to audit or review. Adjustments arising from a change in the transaction price related to these contracts were increases of $4,491 and $2,756 in 2019 and 2018, respectively, which represented 0.1% and 0.1%, respectively, of patient service revenue.
There are various proposals at the federal and state levels that could, among other things, significantly reduce payment rates or modify payment methods. The ultimate outcome of these proposals and other market changes, including the potential effects of or revisions to health care reform that has been enacted by the federal government cannot be determined presently. Future changes in the Medicare and Medicaid programs and any reduction of funding could have an adverse impact on Fairview.
Fairview has established estimates, based on information presently available, of amounts due to or from Medicare and other payors for adjustments to current and prior year’s payment rates, based on industry-wide and Fairview-specific data. The current Medicaid, Medicare, and other third-party payor programs are based upon extremely complex laws and regulations that are subject to interpretation. As a result, there is at least a reasonable possibility that recorded estimates will change by a material amount. Additionally, noncompliance with such laws and regulations could result in fines, penalties, and exclusion from such programs. Fairview is not aware of any allegations of noncompliance that could have a material adverse effect on the accompanying consolidated financial statements and believes that it is in compliance with all applicable laws and regulations.

Fairview Health Services
Notes to Consolidated Financial Statements (continued) (Dollars in Thousands)
1911-3320751 23
6. Patient Service Revenue and Accounts Receivable for Medical Services (continued)
The composition of patient service revenue based on lines of business is summarized below:
2019 2018 Hospital services $ 3,373,711 $ 3,301,818 Pharmacy services 1,106,692 1,017,405 Physician services 657,721 522,551 Senior services 125,785 129,271 Other 136,651 126,945 $ 5,400,560 $ 5,097,990
Hospital revenue includes a variety of services mainly covering inpatient procedures requiring overnight stays or outpatient operations that require anesthesia or use of complex diagnostic and surgical equipment as well as emergency care. Pharmacy services include services provided outside of hospital services, including retail and specialty pharmacies. Physician services include services primarily focused on the care of outpatients covering primary and specialty health care needs. Senior services include care provided at long-term senior care facilities, home care, and hospice services.
Patient service revenue by major payor source is summarized below:
2019 2018 Medicare $ 1,467,722 $ 1,364,591 Medicaid 806,530 760,640 Negotiated contracts, commercial, and other 3,071,890 2,921,779 Self-pay 54,418 50,980 $ 5,400,560 $ 5,097,990
Deductibles, co-payments, and coinsurance under third-party payment programs that are the patient’s responsibility are included within the primary payor category in the table above.

Fairview Health Services
Notes to Consolidated Financial Statements (continued) (Dollars in Thousands)
1911-3320751 24
6. Patient Service Revenue and Accounts Receivable for Medical Services (continued)
Fairview does not adjust the promised amount of consideration from patients and third-party payors for the effects of a significant financing component due to Fairview’s expectation that the period between the time the service is provided to a patient and the time that the patient or a third-party payor pays for that service will be one year or less. However, Fairview does, in certain instances, enter into payment agreements with patients that allow payments in excess of one year. For those cases, the financing component is not deemed to be significant to the contract.
Fairview grants credit without collateral to its patients, most of whom are residents in the communities served by Fairview and are insured under third-party payor agreements. The mix of accounts receivable for medical services at December 31 consists of the following:
2019 2018 Medicare $ 150,741 $ 155,855 Medicaid 91,176 62,342 Negotiated contracts, commercial, and other 429,692 361,583 Self-pay 38,160 43,639 $ 709,769 $ 623,419
One negotiated contract payor accounted for 18% of patient service revenue and 13% of accounts receivable for medical services at December 31, 2019, and 18% of patient service revenue and 14% of accounts receivable for medical services at December 31, 2018.
7. Other Operating Revenue
For the years ended December 31, other operating revenue consisted of the following:
2019 2018 Health insurance services $ 315,953 $ 281,516 Pharmacy benefit management 132,384 144,405 Other 197,663 186,079 $ 646,000 $ 612,000

Fairview Health Services
Notes to Consolidated Financial Statements (continued) (Dollars in Thousands)
1911-3320751 25
8. Land, Buildings, and Equipment
Land, buildings, and equipment at December 31 consist of the following:
2019 2018 Land and improvements $ 111,641 $ 133,701 Buildings and improvements 1,685,526 1,728,059 Equipment 770,631 793,087 Finance leased facilities and equipment 74,908 95,662 2,642,706 2,750,509 Accumulated depreciation and amortization (1,510,164) (1,468,480) 1,132,542 1,282,029 Construction-in-progress 108,768 73,406 $ 1,241,310 $ 1,355,435
Depreciation expense, including amortization of assets under capital leases, was $155,569 and $147,163 for 2019 and 2018, respectively. During 2019, Fairview recorded $122,843 in non-recurring expenses related to the impairment of land, building and equipment on select hospital, clinic and pharmacy sites where sustained operating losses indicated that the net book value would not be recovered.

Fairview Health Services
Notes to Consolidated Financial Statements (continued) (Dollars in Thousands)
1911-3320751 26
9. Investments
The composition of Fairview’s investments, including those with limited uses, at December 31 is summarized as follows:
2019 2018 Cash and cash equivalents $ 278,682 $ 319,428 Certificates of deposit 1,687 5,702 Asset-backed securities 59,633 77,771 Commercial paper – 893 Corporate debt securities 278,785 363,764 Equity mutual funds 747,193 582,808 Equity securities 100,896 106,707 Fixed income mutual funds 230,345 137,457 Mortgage backed securities 40,196 40,460 Municipal debt securities 50,355 48,563 U.S. government agency and mortgage-backed securities 204,475 171,582 U.S. treasury debt securities 169,209 254,615 Sovereign debt 1,435 – Equity commingled funds 71,877 78,799 Fund of hedge funds 104,600 161,228 Hedge funds 187,187 116,513 Private capital funds 17,231 11,314 Real estate investment trusts 740 925 $ 2,544,526 $ 2,478,529

Fairview Health Services
Notes to Consolidated Financial Statements (continued) (Dollars in Thousands)
1911-3320751 27
9. Investments (continued)
Alternative investments accounted for using the equity method of accounting and investments in certain entities that calculate net asset value (NAV) per share (or its equivalent), including restricted and unrestricted assets, are as follows:
December 31 Unfunded
Commitments at Redemption Redemption 2019 2018 December 31, 2019 Frequency Notice Period Equity commingled funds $ 71,877 $ 78,799 $ – Monthly 10 days Equity long/short hedge funds 94,494 61,347 – Monthly/
Quarterly 30–90 days Opportunistic fixed-income
hedge fund 47,876 24,731 – Quarterly 60 days Strategic fixed-income hedge
fund 44,817 30,435 – Annually 120 days Fund of hedge funds 104,600 161,228 – Semiannually 95 days Real estate investment trust 740 925 – Monthly/
Quarterly 0–20 days Private capital fund 17,231 11,314 35,480 7–9 years N/A Total $ 381,635 $ 368,779 $ 35,480
Fairview’s investments are exposed to various types and levels of risk. Equity securities and equity mutual funds expose Fairview to market risk, performance risk, and liquidity risk for both domestic and international investments. Market risk is the risk associated with major movements of the equity markets. Performance risk is the risk associated with a company’s operating performance. Fixed-income securities and fixed-income mutual funds expose Fairview to interest rate risk, credit risk, and liquidity risk. As interest rates change, the value of many fixed-income securities is affected, including those with fixed interest rates. Credit risk is the risk that the obligor of the security will not fulfill its obligations. Liquidity risk is affected by the willingness of market participants to buy and sell particular securities. Liquidity risk tends to be higher for equities related to small capitalization companies and certain alternative investments, such as private capital funds, hedge funds, and fund of hedge funds. Through Fairview’s investments in hedge funds and fund of hedge funds, Fairview is indirectly involved in investment activities, such as securities lending, trading in futures and forward contracts, and other derivative products. Derivatives are used to adjust underlying manager portfolio risk exposure. While these financial

Fairview Health Services
Notes to Consolidated Financial Statements (continued) (Dollars in Thousands)
1911-3320751 28
9. Investments (continued)
instruments may contain varying degrees of risk, Fairview’s risk with respect to such transactions is limited to its capital balance in each investment. Due to the volatility in the capital markets, there is a reasonable possibility of subsequent changes in fair value resulting in additional gains and losses in the near term.
Investment return is summarized and reported in the consolidated statements of operations and changes in net assets as follows:
2019 2018 Dividends and interest $ 54,362 $ 45,793 Investment expenses, net (4,738) (2,574) Net realized gains 49,361 17,741 Unrealized gains (losses) on trading investments 185,405 (143,626) $ 284,390 $ (82,666) Other operating revenue $ 5,546 $ 7,205 Nonoperating gains (losses) 278,416 (88,739) Contributions and other changes, net, in donor-
restricted net assets 428 (1,132) $ 284,390 $ (82,666)
Fairview Health Services
Notes to Consolidated Financial Statements (continued) (Dollars in Thousands)
1911-3320751 29
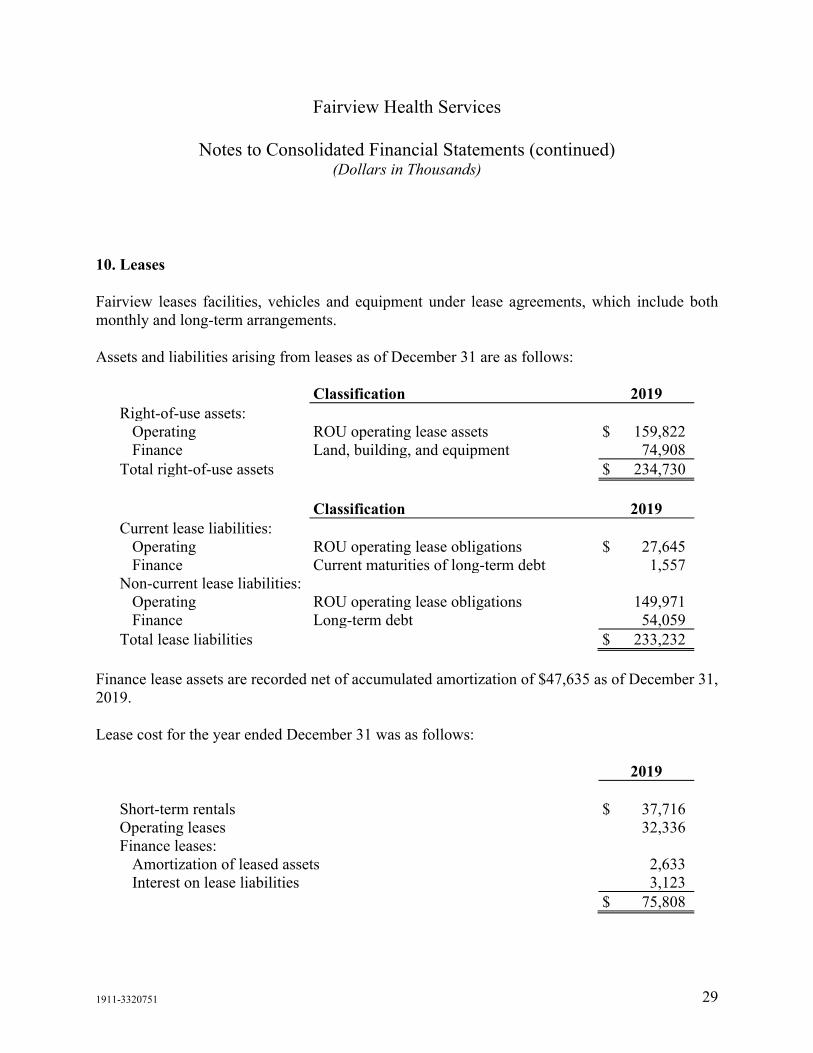
10. Leases
Fairview leases facilities, vehicles and equipment under lease agreements, which include both monthly and long-term arrangements.
Assets and liabilities arising from leases as of December 31 are as follows:
Classification 2019 Right-of-use assets:
Operating ROU operating lease assets $ 159,822 Finance Land, building, and equipment 74,908
Total right-of-use assets $ 234,730 Classification 2019 Current lease liabilities:
Operating ROU operating lease obligations $ 27,645 Finance Current maturities of long-term debt 1,557
Non-current lease liabilities: Operating ROU operating lease obligations 149,971 Finance Long-term debt 54,059
Total lease liabilities $ 233,232 Finance lease assets are recorded net of accumulated amortization of $47,635 as of December 31, 2019.
Lease cost for the year ended December 31 was as follows:
2019 Short-term rentals $ 37,716 Operating leases 32,336 Finance leases:
Amortization of leased assets 2,633 Interest on lease liabilities 3,123
$ 75,808

Fairview Health Services
Notes to Consolidated Financial Statements (continued) (Dollars in Thousands)
1911-3320751 30
10. Leases (continued)
Expense related to short-term rentals and operating leases totaled $68,805 for the year ended December 31, 2018.
The maturity of lease liabilities at December 31, 2019, was as follows:
Operating
Leases Financing
Leases Total Undiscounted cash flows due within:
2020 $ 39,090 $ 5,961 $ 45,051 2021 32,764 5,755 38,519 2022 26,447 4,022 30,469 2023 21,181 4,021 25,202 2024 20,641 4,031 24,672 2025 and thereafter 87,830 64,269 152,099
Total undiscounted cash flows 227,953 88,059 316,012 Impact of present value discount 50,337 32,443 82,780 Amount reported on balance sheet $ 177,616 $ 55,616 $ 233,232
Other disclosures as or for the year-ended of December 31, 2019:
Operating Financing Operating cash flows for leases $ 30,134 $ – Financing cash flows for leases – 4,616 ROU assets obtained in exchange for new lease liabilities 11,590 – Weighted-average term (years) 9.0 20.4 Weighted-average discount rate 3.6% 4.3%

Fairview Health Services
Notes to Consolidated Financial Statements (continued) (Dollars in Thousands)
1911-3320751 31
11. Debt
Fairview’s long-term debt is summarized as follows:
Annual Interest
Final Scheduled Amount Outstanding at December 31
Rates Maturity 2019 2018 Health Care System Revenue Bonds:
Series 2018A Tax-Exempt 4.00%–5.00% 2049 $ 263,890 $ 263,890 Series 2018B Taxable Variable 2048 113,015 113,015 Series 2018C Taxable Variable 2048 110,510 110,510 Series 2017A Tax-Exempt 2.00%–5.00% 2047 192,515 197,275 Series 2017B Taxable 3.13% 2047 95,415 95,415 Series 2017C Taxable 2.79% 2047 95,410 95,410 Series 2015A Tax-Exempt 2.00%–5.00% 2044 102,380 104,705 Series 2015 Taxable 4.16% 2043 328,150 338,665
Senior housing revenue bonds and notes
Various fixed rate Various 64,308 60,677
Finance lease obligations Various fixed rate Various 55,616 71,241
Other Various fixed rate Various 11,842 10,501
1,433,051 1,461,304 Net unamortized premium 46,017 47,691 Unamortized debt issuance costs (10,386) (10,810) Current maturities of long-term debt (30,064) (29,738) $ 1,438,618 $ 1,468,447
In September 2015, the City of Minneapolis, on behalf of Fairview, issued Series 2015A tax-exempt bonds in the aggregate principal amount of $111,255 to refund the principal amount of previously outstanding revenue bonds and provide new money to fund facility expansion. At the same time, Fairview also issued Series 2015 Taxable private placement bonds in the aggregate principal amount of $352,440 to refund the principal amount of previously outstanding revenue bonds. The Series 2015A bonds were issued at a premium of $11,808.
In August 2017, the Housing and Redevelopment Authority of the City of Saint Paul, on behalf of Fairview, issued Series 2017A tax-exempt bonds in the aggregate principal amount of $202,100 to refund existing debt. The Series 2017A bonds were issued at a premium of $22,628. At the same time, Fairview also entered into Series 2017B and Series 2017C taxable term loans with two financial institutions for a total of $190,825 to refund existing taxable direct placement debt. Fairview was able to issue the new debt at lower interest rates than the original debt acquired.

Fairview Health Services
Notes to Consolidated Financial Statements (continued) (Dollars in Thousands)
1911-3320751 32
11. Debt (continued)
In October 2018, the City of Minneapolis, on behalf of Fairview, issued the Series 2018A fixed-rate tax-exempt bonds in the aggregate principal amount of $263,890 to refund the previously outstanding 2008B revenue bonds and provide $100,000 in new money to fund facility improvements. The Series 2018A bonds were issued at a premium of $16,009. Although the issuance of the 2018ABC bonds resulted in an $8,849 loss on early extinguishment of debt related to these transactions, which is recorded on a net basis in other nonoperating gains (losses) in the consolidated statement of operations and changes in net assets, these issuances resulted in a reduction of annual interest expense with minimal change in Fairview’s maximum annual debt service.
The City of Minneapolis, on behalf of Fairview, also issued the Series 2018BC variable-rate demand bonds (VRDBs) in the aggregate principal amount of $223,525 to refund the principal amount of previously outstanding 2008CDE private placement bonds. In conjunction with the issuance of the VRDBs, Fairview has entered into various standby purchase and credit agreements in the amount of $227,420 that expire at various dates, commencing with $112,436 in October 2023 and $114,984 in October 2025. Under the terms of the agreements, the bank will make liquidity loans to Fairview in the amount necessary to purchase all or a portion of the VRDBs and pay up to 53 days of interest in the event of a failed remarketing. Principal payments on the liquidity loans would be generally payable beginning 367 days after a failed remarketing in quarterly installments over a three- or four-year amortization period. If the amortization period extends beyond the one-year anniversary of the stated maturity date of the letter of credit, full prepayment of the remaining balance would be required.
The Fairview Obligated Group (Obligated Group) is defined under the Master Trust Indenture dated September 1, 2015, between Fairview and U.S. Bank National Association, as amended and supplemented from time to time (the MTI). Under the terms of the MTI, members of the Obligated Group are jointly and severally liable for the debts and other obligations of each other and subject to various restrictive covenants, including limitations on incurring additional debt, sale of assets, and the maintenance of certain ratios, including days cash on hand, debt to capitalization, and debt service coverage. On August 30, 2017, Fairview entered into the Third Supplement to Master Indenture, which admitted HealthEast Care System, HealthEast St. Joseph’s Hospital, HealthEast St. John’s Hospital, HealthEast Woodwinds Hospital, and Grand Itasca Clinic and Hospital as obligated affiliates as permitted under Section 9.01 of the MTI. The Obligated Group consists of Fairview Health Services, Fairview Pharmacy Services, Range Regional Healthcare Services, HealthEast, HealthEast St. Joe’s Hospital, HealthEast St. John’s Hospital, HealthEast Woodwinds Hospital, and Grand Itasca Clinic and Hospital (collectively, Obligated Affiliates).

Fairview Health Services
Notes to Consolidated Financial Statements (continued) (Dollars in Thousands)
1911-3320751 33
11. Debt (continued)
The Obligated Group accounted for 86% of Fairview’s consolidated total operating revenue for 2019, and 87% of Fairview’s total consolidated assets at December 31, 2019.
Fairview paid interest, net of capitalized interest, of $55,302 and $56,094 for the years ended 2019 and 2018, respectively.
The following are aggregate maturities and sinking fund requirements of long-term debt for each of the next five years, assuming no early redemption or other changes to variable-rate debt.
2020 $ 30,064 2021 29,553 2022 27,490 2023 28,591 2024 29,801
In October 2005, Fairview and North Memorial Medical Center (NMMC) formed Maple Grove Hospital Corporation (MGHC) to construct and operate the Maple Grove Hospital. Fairview and NMMC are the only two members of MGHC, and Fairview holds a 25% equity interest in MGHC, which is recorded within investments in related parties in the consolidated balance sheets. Fairview has guaranteed 25% of the principal and interest obligations associated with the Health Care Facilities Revenue Bonds, Series 2007, issued on behalf of MGHC, in the event of MGHC’s default. The bonds have an outstanding principal balance of $111,650 as of December 31, 2019, and are payable in installments through May 2037 at annual interest rates ranging from 3.00% to 5.00% Fairview has not recorded a liability related to the guarantee as it has been deemed not probable that MGHC will default on the debt.
Fairview has maintained credit arrangements for short-term borrowing during 2019 and 2018. At December 31, 2019, Fairview had $50,000 in credit available for short-term borrowing at a variable interest rate through December 10, 2021. There were no amounts outstanding at December 31, 2019 or 2018.

Fairview Health Services
Notes to Consolidated Financial Statements (continued) (Dollars in Thousands)
1911-3320751 34
12. Derivative Financial Instruments
Fairview uses various derivative financial instruments, including interest rate swaps, as part of its risk management strategy to manage exposure to fluctuation in interest rates and to manage the overall cost of its debt. Derivatives are used to manage identified and approved exposures and are not used for speculative purposes.
Interest rate swaps between Fairview and a third party (counterparty) provide for the periodic exchange of payments between the parties based on changes in a defined index, the London Interbank Offered Rate (LIBOR), and a fixed rate and include counterparty credit risk. Counterparty credit risk is the risk that contractual obligations of the counterparties will not be fulfilled. Concentrations of credit risk relate to groups of counterparties that have similar economic or industry characteristics that would cause their ability to meet contractual obligations to be similarly affected by changes in economic or other conditions. Counterparty credit risk is managed by requiring high credit standards for Fairview’s counterparties. The counterparties to these contracts are financial institutions that carry investment-grade credit ratings. The interest rate swap contracts contain collateral provisions applicable to both parties to mitigate credit risk. Fairview does not anticipate nonperformance by its counterparties.
The following is a summary of the outstanding positions under these interest rate swaps at December 31, 2019:
Instrument Type Notional Amount Maturity Date Rate Paid Rate Received Floating-to-fixed rate
swap $ 147,620 November 15, 2047 3.50% 62.4% of 1-month LIBOR
and 0.29% Floating-to-fixed rate
swap $ 74,880 November 15, 2047 3.60% 62.4% of 1-month LIBOR
and 0.29% The fair value of interest rate swaps of ($82,672) and ($57,645) at December 31, 2019 and 2018, respectively, is recorded as a liability in the consolidated balance sheet.
None of the derivative financial instruments are designated as hedging instruments. Accordingly, nonoperating (losses) gains are recorded on the consolidated statements of operations and changes in net assets. The (losses) gains on interest rate swaps are ($27,845) and $4,985 for the years ended December 31, 2019 and 2018, respectively.
Fairview Health Services
Notes to Consolidated Financial Statements (continued) (Dollars in Thousands)
1911-3320751 35
12. Derivative Financial Instruments (continued)
Fairview offsets the fair value amounts recognized for the derivative instruments and the fair value amounts recognized for the right to reclaim cash collateral (a receivable) based on the terms of the master netting agreement with the counterparty. Fairview’s master netting agreements contain provisions that require Fairview to post collateral with the counterparty when the net liability of the derivative instruments is greater than the predetermined threshold. No collateral was required to be posted at December 31, 2019 or 2018.
13. Fair Value Measurements
Fairview’s investments include money market, fixed income, and equity securities, which are carried at fair value, based on quoted market prices, and are classified as trading securities. Investments designated for use within one year are classified as short-term investments in the consolidated balance sheets. Investment securities are exposed to various risks, such as interest rate, credit, and overall market volatility. In addition, Fairview invests in commingled funds, which are accounted for at NAV as a practical expedient to fair value, and other alternative investments, which are accounted for using the equity method of accounting.
Fair value is defined as the price that would be received to sell an asset or paid to transfer a liability in an orderly transaction between market participants at the measurement date. The fair value measurements and disclosures section of the FASB’s Accounting Standards Codification establishes a framework for measuring fair value. The framework consists of a three-level hierarchy for fair value measurements based upon the transparency of inputs to the valuation of an asset or liability as of the measurement date.
A financial instrument’s categorization within the valuation hierarchy is based upon the lowest level of input that is significant to the fair value measurement.
The fair value for Level 1 assets in the fair value measurements tables is based upon quoted market prices. Fair value for Level 2 is based on quoted prices for similar instruments in active markets, quoted prices for identical or similar instruments in markets that are not active, and model-based valuation techniques for which all significant assumptions are observable in the market or can be corroborated by observable market data for substantially the full term of the assets. Inputs are obtained from various sources, including market participants, dealers, and brokers. Fairview utilizes a discounted cash flow methodology for valuing derivative financial instruments. The valuations reflect a credit spread adjustment to the LIBOR discount curve in order to reflect the

Fairview Health Services
Notes to Consolidated Financial Statements (continued) (Dollars in Thousands)
1911-3320751 36
13. Fair Value Measurements (continued)
credit value adjustment for nonperformance risk. The credit spread adjustment is derived from other comparably rated entities’ bonds priced in the market. The credit spread adjustment recorded was $3,821 and $3,604 at December 31, 2019 and 2018, respectively. Fair value for Level 3 is based on unobservable market data. There were no financial instruments recorded at fair value classified as Level 3 at December 31, 2019 or 2018.
The methods described above may produce a fair value calculation that may not be indicative of net realizable value or reflective of future fair values. Furthermore, while Fairview believes its valuation methods are appropriate and consistent with other market participants, the use of different methodologies or assumptions to determine the fair value of certain financial instruments could result in a different estimate of fair value at the reporting date.
The carrying values of cash and cash equivalents, accounts receivable for medical services, accounts payable, and receivables and payables under third-party reimbursement contracts are reasonable estimates of their fair value due to the short-term nature of these financial instruments.
The estimated fair value of fixed-rate long-term debt was $85,463 and $8,971 more than its carrying value at December 31, 2019 and 2018, respectively, which included consideration of third-party credit enhancements, of which there was no effect. The valuation for the fair value of long-term debt is completed by a third-party service and considers a number of factors, including, but not limited to, (i) general interest rate and market conditions; (ii) quoted prices for similar instruments; (iii) comparable trades, where available; and (iv) discounted cash flow analyses using current borrowing rates for similar types of borrowing arrangements, adjusted for Fairview credit risk. Based on the inputs used in determining the estimated fair value of long-term debt, this liability would be considered Level 2 on the fair value hierarchy. The fair value of variable-rate debt is assumed to be equal to cost based on the nature of these obligations.

Fairview Health Services
Notes to Consolidated Financial Statements (continued) (Dollars in Thousands)
1911-3320751 37
13. Fair Value Measurements (continued)
The following table presents the financial instruments carried at fair value on a recurring basis as of December 31, 2019, based on the definition of the fair value hierarchy:
Level 1 Level 2 Level 3 Total Assets :
Cash and cash equivalents $ 278,682 $ – $ – $ 278,682 Asset-backed securities – 59,633 – 59,633 Certificates of deposit – 1,687 – 1,687 Mortgage backed securities – 40,196 – 40,196 Commercial paper – – – – Corporate debt securities – 278,785 – 278,785 Equity mutual funds 747,193 – – 747,193 Equity securities 99,614 1,282 – 100,896 Fixed-income mutual funds 230,345 – – 230,345 Municipal debt securities – 50,355 – 50,355 Sovereign debt – 1,435 – 1,435 U.S. government agency debt
securities – 204,475 – 204,475 U.S. Treasury debt securities 169,209 – – 169,209
Total investments at fair value $ 1,525,043 $ 637,848 $ – 2,162,891 Equity commingled funds at
NAV(1) 71,877 Investments not at fair value 309,758 Total investments $ 2,544,526 Liabilities Derivative financial instruments $ – $ (82,672) $ – $ (82,672)
(1)In accordance with ASC 820-10, certain investments that are measured at fair value using the net asset
value per share (or its equivalent) practical expedient have not been classified in the fair value hierarchy.

Fairview Health Services
Notes to Consolidated Financial Statements (continued) (Dollars in Thousands)
1911-3320751 38
13. Fair Value Measurements (continued)
The following table presents the financial instruments carried at fair value on a recurring basis as of December 31, 2018, based on the definition of the fair value hierarchy:
Level 1 Level 2 Level 3 Total Assets:
Cash and cash equivalents $ 319,428 $ – $ – $ 319,428 Asset-backed securities – 77,771 – 77,771 Certificates of deposit – 5,702 – 5,702 Mortgage backed securities – 40,460 – 40,460 Commercial paper – 893 – 893 Corporate debt securities – 363,764 – 363,764 Equity mutual funds 528,808 – – 528,808 Equity securities 106,707 – – 106,707 Fixed-income mutual funds 137,457 – – 137,457 Municipal debt securities – 48,563 – 48,563 U.S. government agency debt
securities – 171,582 – 171,582 U.S. Treasury debt securities 254,615 – – 254,615
Total investments at fair value $ 1,347,015 $ 708,735 $ – 2,055,750 Equity commingled funds at
NAV(1) 78,799 Investments not at fair value 289,980 Total investments $ 2,424,529 Liabilities Derivative financial instruments $ – $ (57,645) $ – $ (57,645)
(1) In accordance with ASC 820-10, certain investments that are measured at fair value using the net asset value per share (or its equivalent) practical expedient have not been classified in the fair value hierarchy
14. Commitments and Contingencies
Fairview is insured with external insurance carriers for professional and general liability claims in excess of amounts self-insured through its insurance subsidiary. Fairview self-insures a portion of its professional and general liability risk through its wholly owned captive insurance subsidiary. Premiums paid to its captive insurance subsidiary are based on the cost of comparable coverage with commercial insurance companies and are eliminated in consolidation. Fairview also

Fairview Health Services
Notes to Consolidated Financial Statements (continued) (Dollars in Thousands)
1911-3320751 39
14. Commitments and Contingencies (continued)
maintains coverage for losses in excess of certain limits with an outside insurance carrier under a risk-sharing program with certain other health care providers. Premiums are based on the experience of Fairview and the other health care providers and could result in a retrospective adjustment.
Fairview manages its professional and general liability insurance programs through its captive insurance company and its employee health insurance through self-funded plans. The provision for claims against these programs includes an estimate of the ultimate cost for reported claims and claims incurred but not reported. The estimate for professional and general liability, workers’ compensation, and employee health insurance claims is based on actual claims to date and actuarial studies of Fairview’s estimated future liability for such claims.
The estimated liability for outstanding employee health insurance claims was $27,884 and $24,930 at December 31, 2019 and 2018, respectively. The estimated liability for professional, general, and workers’ compensation claims totaled $93,218 and $109,589 at December 31, 2019 and 2018, respectively which are included in other current liabilities and insurance subsidiaries claims reserves. Valuation of these liabilities is based on historical data.
Fairview is a defendant in various lawsuits arising in the ordinary course of business. Although the outcome of these lawsuits cannot be predicted with certainty, management believes the ultimate disposition of such matters will not have a material adverse effect on Fairview’s consolidated financial condition or operations. However, there can be no assurance that this will be the case.
Approximately 26% of Fairview’s employees are represented by various collective bargaining arrangements, which expire within one to four years.
15. Employee Benefit Plans
Fairview sponsors a number of defined contribution pension plans covering most of its employees who meet certain eligibility requirements. Fairview’s contribution expense for the plans was $83,493 and $77,419 for 2019 and 2018, respectively, and is reported in the consolidated statements of operations and changes in net assets within salaries and benefits expense.
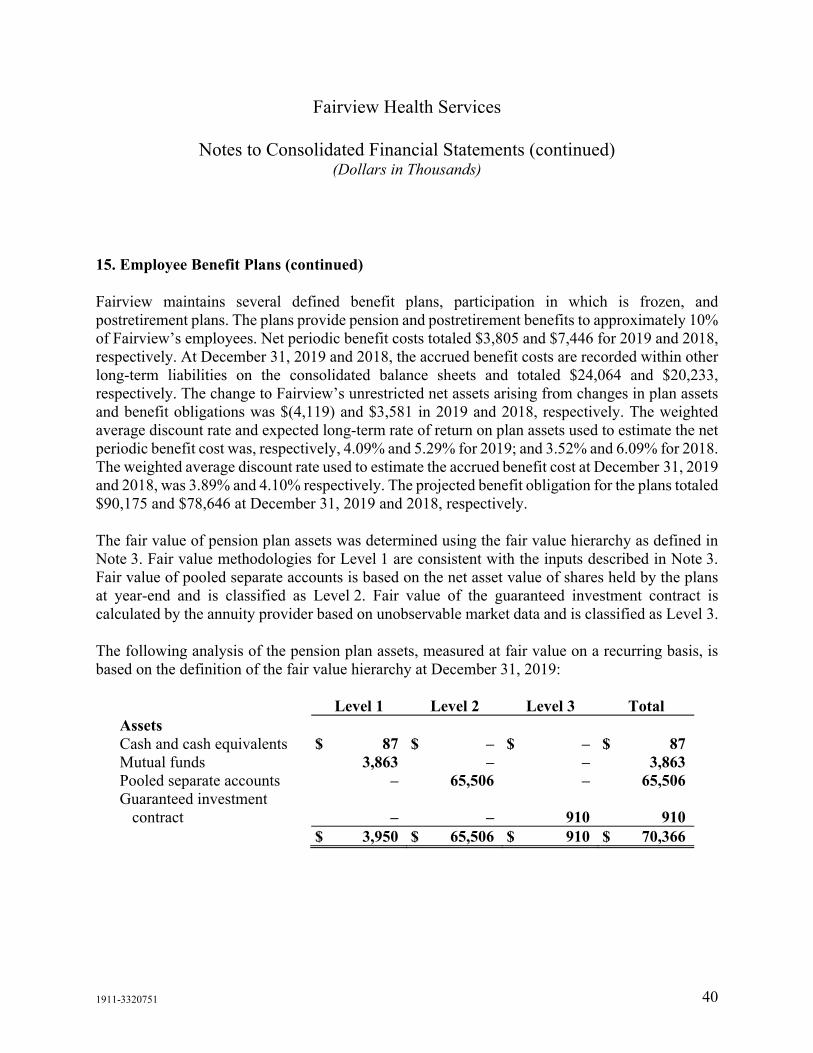
Fairview Health Services
Notes to Consolidated Financial Statements (continued) (Dollars in Thousands)
1911-3320751 40
15. Employee Benefit Plans (continued)
Fairview maintains several defined benefit plans, participation in which is frozen, and postretirement plans. The plans provide pension and postretirement benefits to approximately 10% of Fairview’s employees. Net periodic benefit costs totaled $3,805 and $7,446 for 2019 and 2018, respectively. At December 31, 2019 and 2018, the accrued benefit costs are recorded within other long-term liabilities on the consolidated balance sheets and totaled $24,064 and $20,233, respectively. The change to Fairview’s unrestricted net assets arising from changes in plan assets and benefit obligations was $(4,119) and $3,581 in 2019 and 2018, respectively. The weighted average discount rate and expected long-term rate of return on plan assets used to estimate the net periodic benefit cost was, respectively, 4.09% and 5.29% for 2019; and 3.52% and 6.09% for 2018. The weighted average discount rate used to estimate the accrued benefit cost at December 31, 2019 and 2018, was 3.89% and 4.10% respectively. The projected benefit obligation for the plans totaled $90,175 and $78,646 at December 31, 2019 and 2018, respectively.
The fair value of pension plan assets was determined using the fair value hierarchy as defined in Note 3. Fair value methodologies for Level 1 are consistent with the inputs described in Note 3. Fair value of pooled separate accounts is based on the net asset value of shares held by the plans at year-end and is classified as Level 2. Fair value of the guaranteed investment contract is calculated by the annuity provider based on unobservable market data and is classified as Level 3.
The following analysis of the pension plan assets, measured at fair value on a recurring basis, is based on the definition of the fair value hierarchy at December 31, 2019:
Level 1 Level 2 Level 3 Total Assets Cash and cash equivalents $ 87 $ – $ – $ 87 Mutual funds 3,863 – – 3,863 Pooled separate accounts – 65,506 – 65,506 Guaranteed investment
contract – – 910 910 $ 3,950 $ 65,506 $ 910 $ 70,366

Fairview Health Services
Notes to Consolidated Financial Statements (continued) (Dollars in Thousands)
1911-3320751 41
15. Employee Benefit Plans (continued)
The following analysis of the pension plan assets, measured at fair value on a recurring basis, is based on the definition of the fair value hierarchy at December 31, 2018:
Level 1 Level 2 Level 3 Total Assets Cash and cash equivalents $ 58 $ – $ – $ 58 Mutual funds 3,878 – – 3,878 Pooled separate accounts – 57,408 – 57,408 Guaranteed investment
contract – – 905 905 $ 3,936 $ 57,408 $ 905 $ 62,249
Fairview also participates in union-sponsored multi-employer plans to which contributions are made in accordance with collective bargaining agreements. The risks of participation in these multi-employer plans are different from single-employer plans in the following aspects: (a) assets contributed to the multi-employer plan by one employer may be used to provide benefits to employees of other participating employers; (b) if a participating employer stops contributing to the plan, the unfunded obligations of the plan may be borne by the remaining participating employers; and (c) if Fairview chooses to stop participating in some of its multi-employer plans and if the plan is underfunded, Fairview may be required to pay those plans an amount based on the underfunded status of the plan, referred to as the withdrawal liability.
Fairview’s participation in these plans is outlined in the table below. The “EIN/Pension Plan Number” column provides the Employee Identification Number (EIN) and the three-digit plan number, if applicable. The most recent Pension Protection Act zone status available is for the plan’s year-end at December 31, 2019 and 2018, respectively. The zone status is based on information that Fairview received from the plan and is certified by the plan’s actuary. Among other factors, plans in the red zone are generally less than 65% funded, plans in the yellow zone are less than 80% funded, and plans in the green zone are at least 80% funded. The “FIP/RP Status
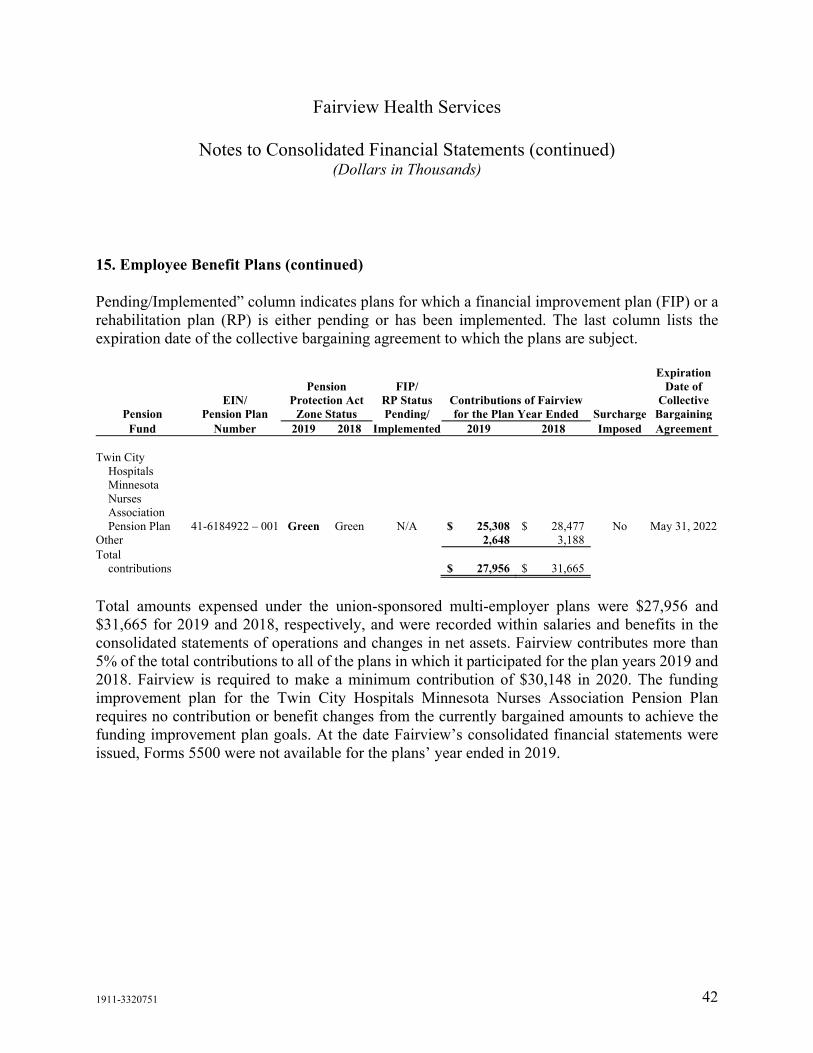
Fairview Health Services
Notes to Consolidated Financial Statements (continued) (Dollars in Thousands)
1911-3320751 42
15. Employee Benefit Plans (continued)
Pending/Implemented” column indicates plans for which a financial improvement plan (FIP) or a rehabilitation plan (RP) is either pending or has been implemented. The last column lists the expiration date of the collective bargaining agreement to which the plans are subject.
Pension EIN/
Pension Plan
Pension Protection Act
Zone Status
FIP/ RP Status Pending/
Contributions of Fairview for the Plan Year Ended Surcharge
Expiration Date of
Collective Bargaining
Fund Number 2019 2018 Implemented 2019 2018 Imposed Agreement Twin City
Hospitals Minnesota Nurses Association Pension Plan 41-6184922 – 001 Green Green N/A $ 25,308 $ 28,477 No May 31, 2022
Other 2,648 3,188 Total
contributions $ 27,956 $ 31,665
Total amounts expensed under the union-sponsored multi-employer plans were $27,956 and $31,665 for 2019 and 2018, respectively, and were recorded within salaries and benefits in the consolidated statements of operations and changes in net assets. Fairview contributes more than 5% of the total contributions to all of the plans in which it participated for the plan years 2019 and 2018. Fairview is required to make a minimum contribution of $30,148 in 2020. The funding improvement plan for the Twin City Hospitals Minnesota Nurses Association Pension Plan requires no contribution or benefit changes from the currently bargained amounts to achieve the funding improvement plan goals. At the date Fairview’s consolidated financial statements were issued, Forms 5500 were not available for the plans’ year ended in 2019.

Fairview Health Services
Notes to Consolidated Financial Statements (continued) (Dollars in Thousands)
1911-3320751 43
16. Functional Expenses
Fairview provides health-related services to patients and operates a health insurance services organization providing health insurance services to subscribers in the communities it serves. Recurring and non-recurring expenses related to providing these services, included in the consolidated statements of operations and changes in net assets, are as follows:
Health Care
Services
Health Insurance Services
General and Administrative Total
Year ended December 31, 2019 Salaries and benefits $ 2,316,430 $ 33,862 $ 465,857 $ 2,816,149 Supplies 1,538,511 – 11,547 1,550,058 Purchased services 795,249 259,391 50,729 1,105,369 Depreciation and amortization 101,868 694 56,085 158,647 Interest 49,966 – 3,403 53,369 Other 329,836 2,584 129,998 462,418 $ 5,131,860 $ 296,531 $ 717,619 $ 6,146,010
Health Care
Services
Health Insurance Services
General and Administrative Total
Year ended December 31, 2018 Salaries and benefits $ 2,282,891 $ 31,357 $ 404,166 $ 2,718,414 Supplies 1,398,304 – 11,227 1,409,531 Purchased services 556,498 233,178 37,362 827,038 Depreciation and amortization 103,569 811 46,120 150,500 Interest 52,374 – 3,123 55,497 Other 263,058 3,239 185,208 451,505 $ 4,656,694 $ 268,585 $ 687,206 $ 5,612,485
17. Income Taxes
Most of Fairview’s controlled affiliates are tax-exempt organizations as described in Section 501(c)(3) of the Internal Revenue Code. These organizations are subject to income tax on any income from unrelated business activities. Fairview also owns or controls certain taxable affiliates. Fairview files income tax returns in the U.S. federal jurisdiction and in various state and local jurisdictions. With few exceptions, Fairview is no longer subject to U.S. federal, state, and local, or non-U.S. income tax examinations by tax authorities for years before 2015.

Fairview Health Services
Notes to Consolidated Financial Statements (continued) (Dollars in Thousands)
1911-3320751 44
17. Income Taxes (continued)
Fairview recognizes all tax positions, including those positions in a previously filed tax return or a position expected to be taken in a future tax filing that is reflected in measuring current or deferred income tax assets and liabilities, when it is more likely than not (likelihood of greater than 50%) that, based on technical merits, the position will be sustained upon examination. There are no uncertain tax positions recorded in the consolidated balance sheets as of December 31, 2019 or 2018. Fairview has made reasonable estimates of the provision for income taxes and on existing deferred tax balances based on accounting guidance included in ASC 740, Income Taxes.
Fairview does not expect that there will be a significant change in the total amount of unrecognized tax benefits within the next 12 months.
18. Subsequent Events
Due to the global viral outbreak caused by Coronavirus Disease 2019 (COVID-19) in 2020, there have been resulting effects in the economy generally and the healthcare industry specifically which will impact Fairview’s financial condition, including significant capital market volatility, various temporary closures and cancellations, and supply disruptions.
On March 19, 2020, Minnesota Governor Tim Walz issued Emergency Executive Order 20-09 (the Order) directing delay of all non-essential or elective surgeries and procedures. The Order took effect March 23, 2020 and will continue for the duration of the peacetime emergency declared by Governor Walz on March 13, 2020, which had an initial period of 30 days, subject to extension or revision in accordance with Minnesota law.
Fairview expects the Order, combined with an expected growth in the volume of COVID-19 patients at its acute care hospitals to have a negative impact on near-term operations and revenues. The timing, source and rate of reimbursement for COVID-19-related patient care; ability to respond to patient demand; extent and timing of federal and state grants, reimbursements and other contributions, if any, to compensate for revenue losses and increased expenses is not yet fully known, as is the length of delay and level of attrition in elective procedures, expense increases and acceleration, impact of changes in payor mix, and potential rise in uninsured patients and need for charity care and effect of the economic downturn on demand for elective procedures and billing cycle. Fairview is monitoring liquidity and cash flow and is taking steps to protect its fiscal health,

Fairview Health Services
Notes to Consolidated Financial Statements (continued) (Dollars in Thousands)
1911-3320751 45
18. Subsequent Events (continued)
including a focus on maintaining liquidity to meet its obligations. In addition, Fairview expects to apply for all appropriate COVID-19 related resources, including supplies, financial support, payroll tax deferrals and relief, if any, and other assistance made available through local, state and federal government and community partners.
Due to the rapidly evolving nature of the COVID-19 response, the ultimate impact of these matters to Fairview and its financial condition is presently unknown. The accompanying consolidated financial statements as of and for the year ended December 31, 2019, do not reflect the effects of these subsequent events.
Fairview evaluated events and transactions occurring subsequent to December 31, 2019, through April 14, 2020, the date of issuance of the consolidated financial statements. During this period, there were no other subsequent events requiring recognition or disclosure in the consolidated financial statements.

EY | Assurance | Tax | Transactions | Advisory
About EYEY is a global leader in assurance, tax, transaction and advisory services. The insights and quality services we deliver help build trust and confidence in the capital markets and in economies the world over. We develop outstanding leaders who team to deliver on our promises to all of our stakeholders. In so doing, we play a critical role in building a better working world for our people, for our clients and for our communities.
EY refers to the global organization, and may refer to one or more, of the member firms of Ernst & Young Global Limited, each of which is a separate legal entity. Ernst & Young Global Limited, a UK company limited by guarantee, does not provide services to clients. Information about how EY collects and uses personal data and a description of the rights individuals have under data protection legislation are available via ey.com/privacy. For more information about our organization, please visit ey.com.
© 2020 Ernst & Young LLP. All Rights Reserved.
ey.com