“Fairness means treating everybody the same.” · “Fairness means treating everybody the same....
78
1 “Fairness means treating everybody the same.” “Fairness means recognizing that everyone, and every situation, is unique.”
-
Upload
nguyenhanh -
Category
Documents
-
view
213 -
download
0
Transcript of “Fairness means treating everybody the same.” · “Fairness means treating everybody the same....

1
“Fairness means
treating everybody
the same.”
“Fairness means
recognizing that
everyone, and every
situation, is unique.”

2
Drinking water pollution cases
Relative Degree of Regulation
Relative Degree of Water Quality Impacts
Irrigated Ag Urban StormwaterTimber
Landfills
Landfills
Mun. WastewaterDrinking water pollution cases
Mun. Wastewater
2011 Order
Tier 1 Tier 2 Tier 3
2004 Conditional Waiver
TimberUrban Stormwater

We have some of the most severe pollution in the United States.
And it’s not new…
3

4
Nitrates in Groundwater, Salinas, California, June 1988Prepared by: Monterey County Flood Control & Water Conservation DistrictSalinas Valley Water Advisory Commission and Monterey County Board of Supervisors
“Nitrate contamination poses a substantial threat to this industry.”
“Drinking water is considered the highest beneficial use of water.”
“Nitrate removal from drinking water supplies is costly.”
“The State maintains a non-degradation policy… if additional wells go out of production… the nitrate situation will become critical, and it is anticipated that additional regulations would be imposed.”
“…specific actions are needed to mitigate existing problems, and to reduce the potential for future problems.”
“The situation will merit a dedicated effort and special attention by the leadership in the County and around the state. If it is ignored it will not go
away.”

Salinas Groundwater Basin –
Northern Region* Maximum Nitrate Concentrations
in Public Water Supply Wells
(≥ 15 connections) 1979 to 2009
<14 mg/L as NO3
14 mg/L to 44 mg/L as NO3
>= 45 mg/L as NO3
NO3 Concentrations in milligrams per Liter (mg/L)
82
40%
78
37%
49
23%
4*Excluding Seaside, Langley and Corral de Tierra areas 5

Santa Maria Groundwater Basin
Maximum Nitrate Concentrations in Public Water Supply Wells
(≥ 15 connections)
1984 to 2009
<14 mg/L as NO3
14 mg/L to 44 mg/L as NO3
>= 45 mg/L as NO3
NO3 Concentrations in milligrams per Liter (mg/L)
51
33%
62
40%
42
27%
56

7
Domestic Drinking Water Wells
44,000+ domestic wells - Central Coast RegionHow many
people are drinking
polluted water
?Water Board actions:
-- identifying high risk areas-- identifying home owners-- drafting notice to homeowners-- well testing program-- alternative water cases
8
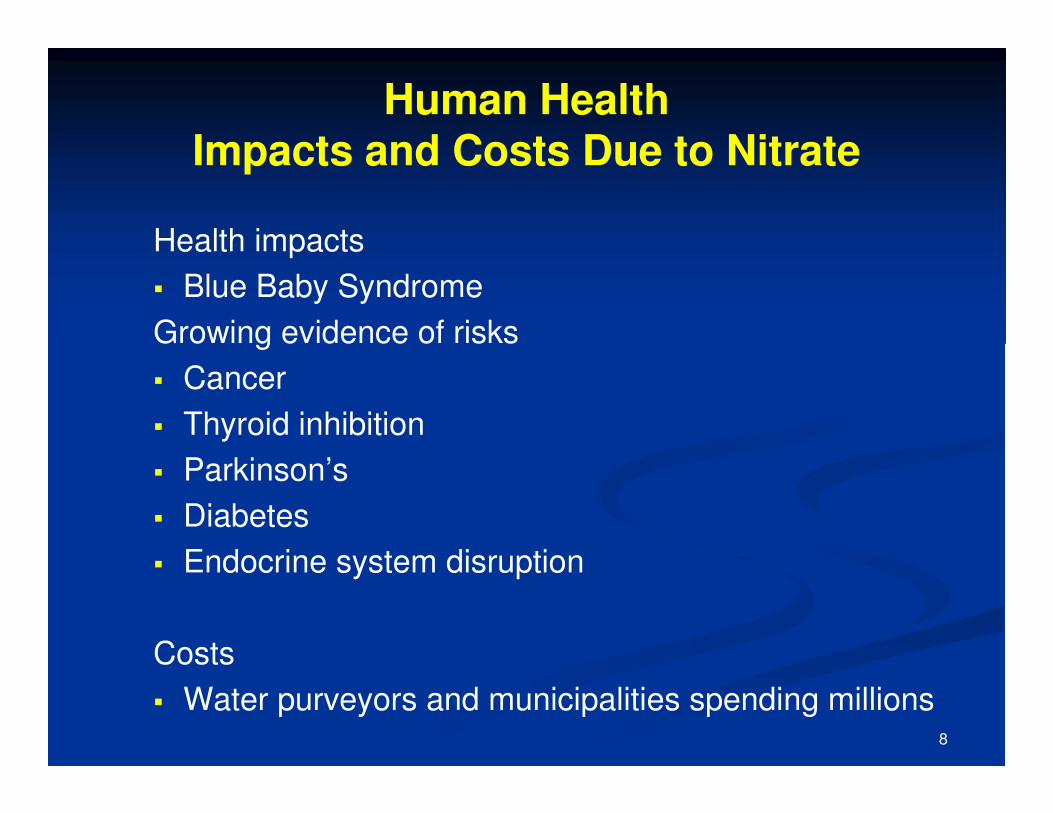
Human HealthImpacts and Costs Due to Nitrate
Health impacts
� Blue Baby Syndrome
Growing evidence of risks
� Cancer
� Thyroid inhibition
� Parkinson’s
� Diabetes
� Endocrine system disruption
Costs
� Water purveyors and municipalities spending millions

Switch to surface water
9

10
Image from Bryan Image from Bryan LargayLargay
Elkhorn Slough National Estuarine Research ReserveElkhorn Slough National Estuarine Research Reserve

11
Water Quality Monitoring in Elkhorn Slough: A Summary of Results 1988-1996
““A significant increase in nitrate concentrations since the A significant increase in nitrate concentrations since the
1970s1970s””
““Extraordinarily high nitrate concentrations in the lower Extraordinarily high nitrate concentrations in the lower
Salinas River which may be the highest recorded in Salinas River which may be the highest recorded in
scientific literature for a river or estuaryscientific literature for a river or estuary””
And still increasingAnd still increasing……
MBARI

Old Salinas River at Monterey Dunes Way

Quail Creek at Highway 101

Natividad Creek upstream Salinas Rec Canal

Blanco Drain

Santa Maria River Estuary

Orcutt Creek upstream SM River
18
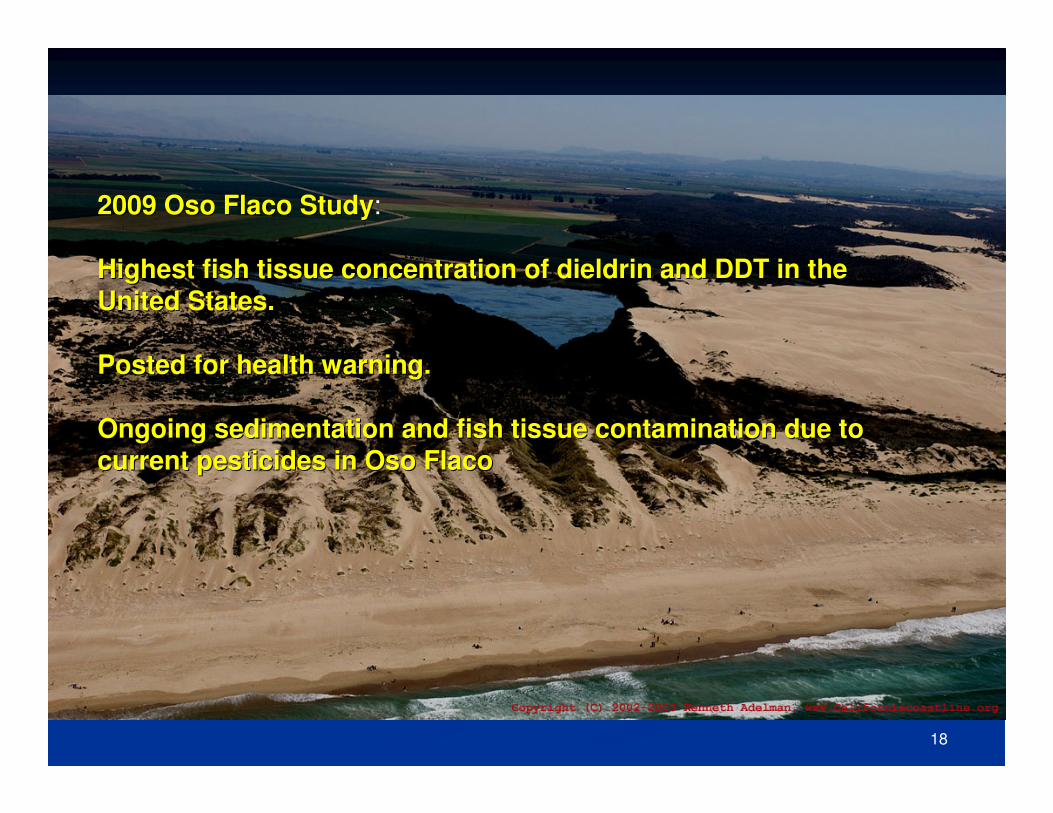
2009 2009 OsoOso FlacoFlaco StudyStudy:
Highest fish tissue concentration of Highest fish tissue concentration of dieldrindieldrin and DDT in the and DDT in the
United States.United States.
Posted for health warning.Posted for health warning.
Ongoing sedimentation and fish tissue contamination due to Ongoing sedimentation and fish tissue contamination due to
current pesticides in current pesticides in OsoOso FlacoFlaco

19
2010 State ReportToxicity in California Waters
Quail Creek discharge to Salinas River
Chemical Plumes Damage Aquatic Life
� 56% of sites Toxic
� 22% of sites Highly Toxic
� Central Coast streams have highest percentage of toxic sites state-wide.
19

20
Agricultural Pesticide Use
� Agricultural pesticide use in the Central Coast Region and associated toxicity are among highest in State.
� DPR Study*: � Salinas River area had highest % of study sites with
pyrethroid detections (85%),� Highest % of sites exceeding toxic levels (42%), and� Highest rate of active ingredients applied (113
lbs/acre, three-fold compared to other locations)
* Statewide study included Salinas River, Sacramento Valley/Feather River, Northern San Joaquin Valley (NSJV), and Imperial Valley
20
2121
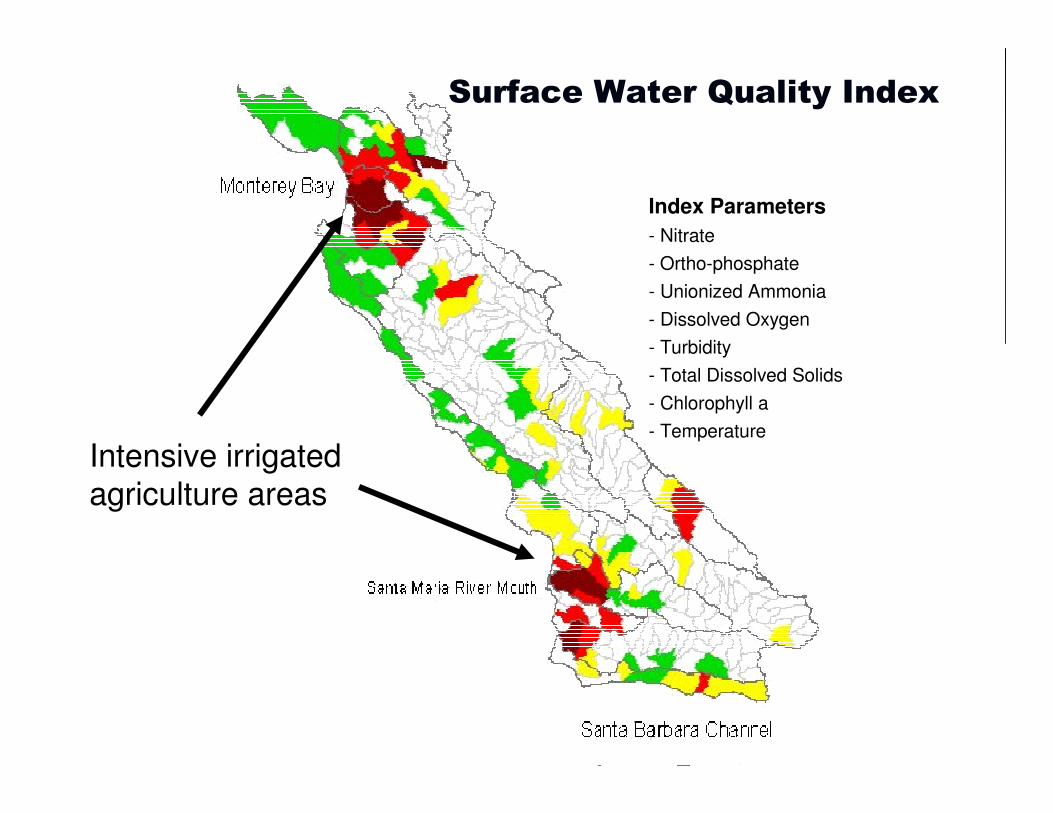
Index Parameters
- Nitrate
- Ortho-phosphate
- Unionized Ammonia
- Dissolved Oxygen
- Turbidity
- Total Dissolved Solids
- Chlorophyll a
- Temperature
Surface Water Quality Index
Intensive irrigated agriculture areas

This is why we must renew the 2004 Conditional Waiver
22
23
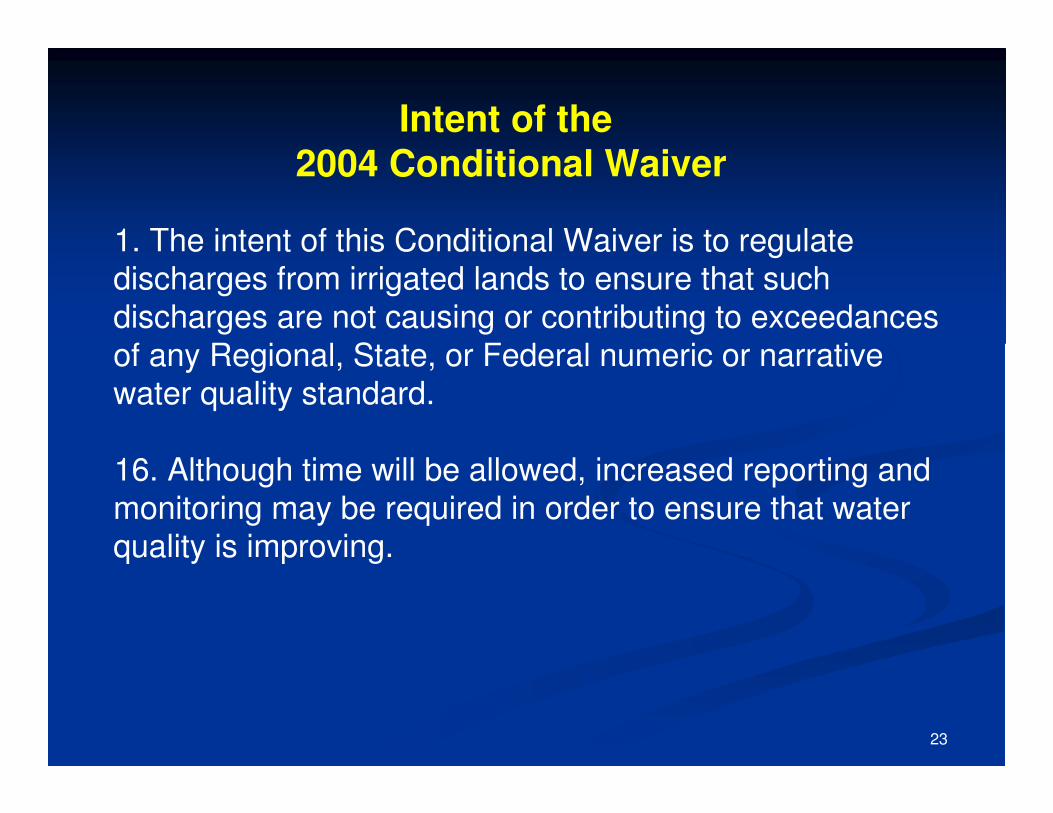
1. The intent of this Conditional Waiver is to regulate discharges from irrigated lands to ensure that such discharges are not causing or contributing to exceedancesof any Regional, State, or Federal numeric or narrative water quality standard.
16. Although time will be allowed, increased reporting and monitoring may be required in order to ensure that water quality is improving.
Intent of the
2004 Conditional Waiver
Building on the 2004 Conditional Waiver
24

25
Meet Water Quality Standards
File Notice of Intent
Farm Plan
-- irrigation management
-- pesticide management
-- nutrient management
-- erosion management
-- schedules to implement
Management Practice Checklist
Surface Water Monitoring
Education
Groundwater requirements
Backflow prevention
Annual compliance info - Online entry form
2004 Conditional Waiver

26
2011 Order Tier 1
Tier 2 Minus:
Annual compliance info - Online entry form
2011 Order Tier 3
Tier 2 Plus:
Water Quality Buffer Plan
Individual Monitoring
Irrigation and Nutrient
Mgmt Plan
Time Schedules
2011 Order Tier 2
Meet Water Quality Standards
File Notice of Intent
Farm Plan
-- irrigation management
-- pesticide management
-- nutrient management
-- erosion management
-- schedules to implement
Management Practice Checklist
Surface Water Monitoring
Education
Groundwater requirements
Backflow prevention
Annual compliance info - Online entry form

Tier 1
500
~ 21% Acreage, ~92,000 Acres
Tier 2
1200
~25% Acreage, ~110,000 Acres
Tier 3
100
~54% Acreage, ~233,000 Acres
27

28

29
Annual Compliance Form
All Tier 2 and Tier 3:
• Date of completed Farm Plan • Type and characteristics of discharge• Identify direct agricultural discharges to a waterbody• Specific practices completed, in progress, and planned (dates)• Nitrate concentration of irrigation water• Backflow prevention• Description of method and location of pesticide use relative to surface water• Nitrate Loading Risk factors and level• Practice outcomes and effectiveness
Subset of Tier 2 and Tier 3:
• Photo monitoring• Total nitrogen applied
Subset of Tier 3:
• Proof of Certified INMP and elements• Water Quality Buffer Plan
29

Tiering Criteria
30

Growers must drill monitoring wells.
Groundwater sampling will cost tens of thousands per grower (Tiers 1-2 $790, Tier 3 $2,370, over life of permit).
Prohibition of tile drains; land will be fallowed.
Everyone has to have buffer strip of x feet. More land out of production.
Dischargers must meet 1 mg/l nitrate limit.
Misunderstandings
31

32
Conclusions and Recommendations

33
Severity
Evidence
Water Board authority, responsibility, accountability.
Solutions
Discharger accountability
The public right to clean water. No one has a right to pollute public
waters.
Reasonableness
Urgency

34
Recommendation:
Adopt the proposed Order and get on to implementation.

1
Draft Agricultural Order
Item 14
Central Coast Water Board Meeting
March 17, 2011
Angela Schroeter, Agricultural Regulatory Program

2
Central Coast Region
Surface Water
~17,000 Miles
Groundwater~4000 Miles2
Irrigated Agriculture
~1700 Operations
~ 3000 Farms
~ 435,000 AcresFARMIRRIGATION
CROP
SETTING
LOCATION
PESTICIDESPRACTICES
FERTILIZERS
SIZE

3
3 Tiers - Criteria
Crops known to have higher nitrate loading impacts
Chemicals known to cause pollution
Proximity to an impaired waterbody or public water system well
Discharge to toxic or pesticide impaired waterbody
Size of farm operation

4
Tier 1
� Does not use chlorpyrifos or diazinon, and
� Operation not located within 1000 feet of an impaired surface waterbody, and
� If growing crops with high potential to load nitrate to groundwater, then operation must be <1000 acres and not within 1000 ft of impacted public well
OR
� SIP Certified Vineyard
4

5
Tier 2
5
� Use chlorpyrifos or diazinon, or
� Operation located within 1000 feet of an impaired surface waterbod, or
� If growing crops with high potential to load nitrate to groundwater, then operation is <1000 acres and within 1000 ft of impacted public well

6
Tier 3
� Operation >1000 acres, and grows crops with high potential to load nitrate to groundwater; or
� Use chlorpryifos or diazinon, and discharge to waterbody impaired for toxicity or pesticides;
6

7
How does the Draft Order evaluate threat to
water quality and use tiers?
Salinas example:
•Toxicity and pesticides
•Operation and individual farm characteristics
•Water quality conditions
•Threat to water quality
*Numbers of farms estimated based on data from 2011 eNOI update.

8Sustainable Ag Expo, Nov. 15, 2010
Salinas –
360 Farms
9
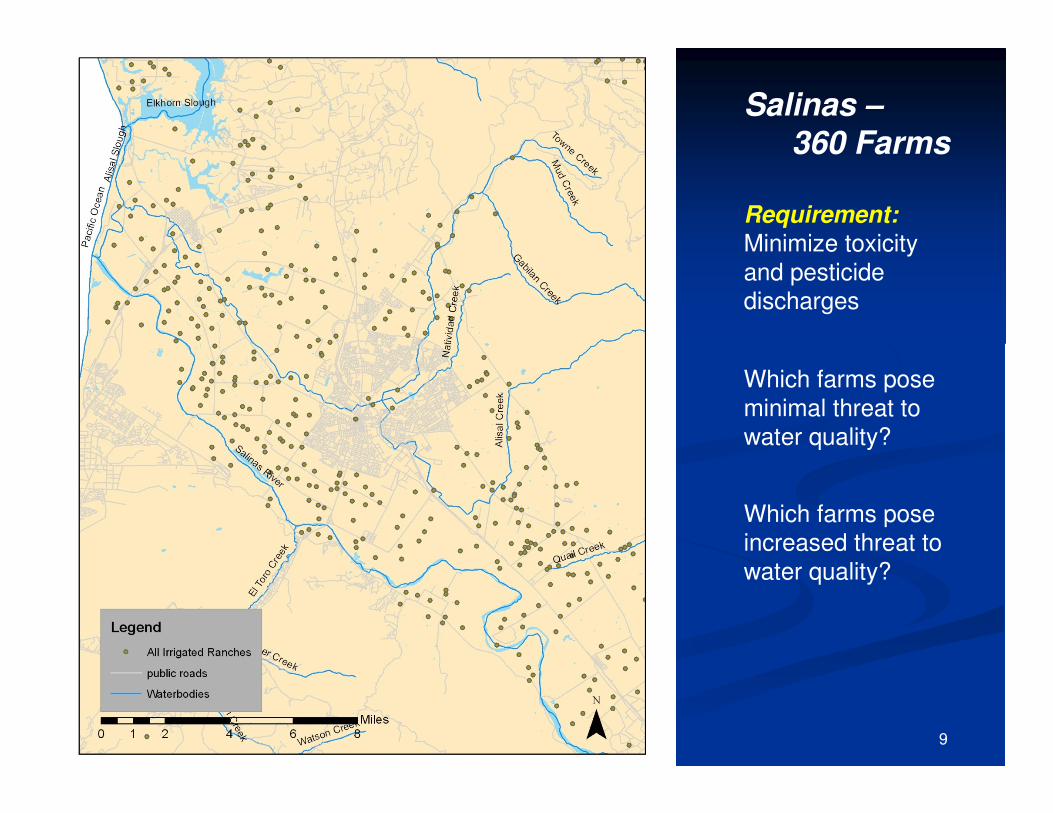
Salinas –
360 Farms
Requirement:
Minimize toxicity and pesticide discharges
Which farms pose minimal threat to water quality?
Which farms pose increased threat to water quality?

10
Salinas –
360 Farms
Which farms are a
lower threat to
water quality?
SIP certified?
0 Vineyards

11
Salinas –
360 Farms
Which farms apply
pesticides?
360 Farms
Apply pesticides
detected in surface
water?360 Farms
Apply pesticides
that cause toxicity
and impairment?
~170 Farms
Apply chlorpyrifos
or diazinon within
1000 feet?
~22 Farms

12
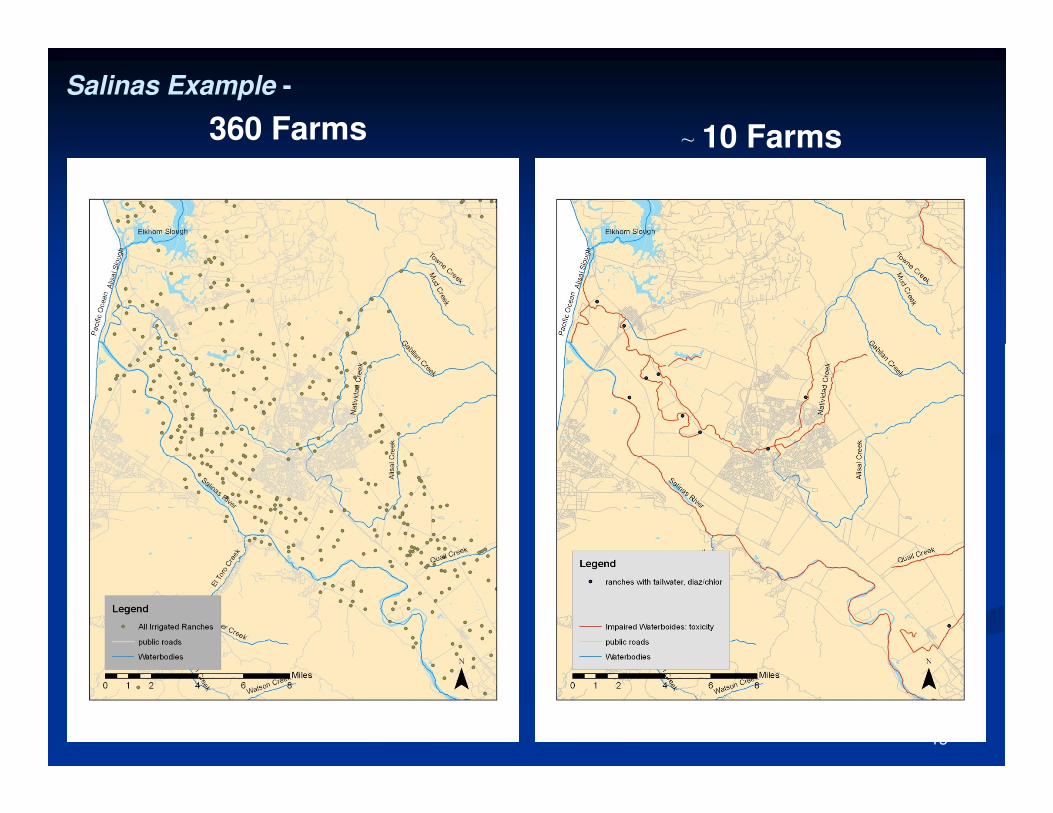
Salinas –
360 Farms
Which farms apply
chlorpyrifos or
diazinon and drain
to a creek impaired
for toxicity or
pesticides?
~10 Farms
13
Salinas Example -
360 Farms~ 10 Farms

14
SIP or apply lower
risk pesticides~ 151 Farms
Within 1000 ft,
apply pesticides
that cause toxicity
and impairment~ 199 Farms
Apply chlorpyrifos
or diazinon and
drain to a creek
impaired for toxicity
or pesticides~ 10 Farms
1
2
3
Salinas –
360 Farms(Toxicity / Pesticides)
Tier
15
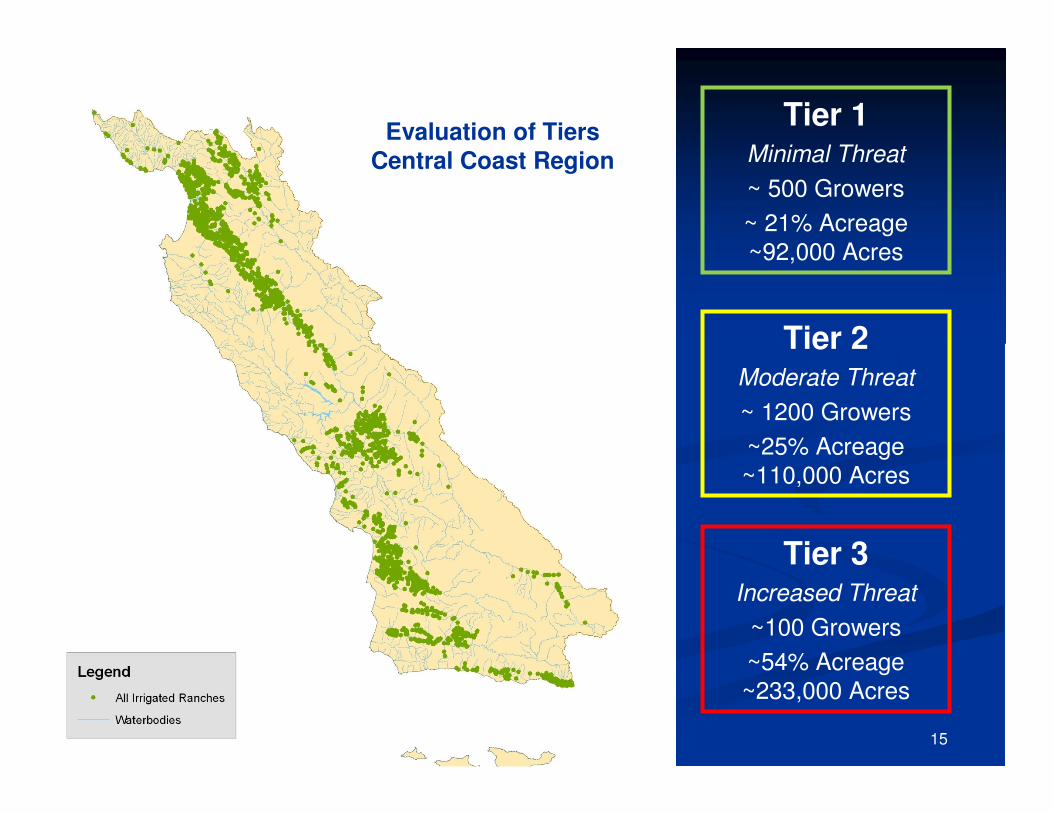
Tier 1Minimal Threat
~ 500 Growers
~ 21% Acreage ~92,000 Acres
Tier 2Moderate Threat
~ 1200 Growers
~25% Acreage ~110,000 Acres
Tier 3Increased Threat
~100 Growers
~54% Acreage ~233,000 Acres
Evaluation of Tiers
Central Coast Region

16
2011 Order Tier 1
Tier 2 Minus:
Annual compliance info - Online entry form
Meet Water Quality Standards
File Notice of Intent
Farm Plan
-- irrigation management
-- pesticide management
-- nutrient management
-- erosion management
-- schedules to implement
Surface Water Monitoring
Education
Groundwater sampling and reporting
Backflow prevention
Annual compliance info – Online entry form
2011 Order Tier 2 2011 Order Tier 3
Tier 2 Plus:
Individual Monitoring
Water Quality Buffer Plan
Irrigation and Nutrient
Mgmt Plan
Time Schedules

17
Tier 3Individual Surface Discharge Monitoring
� Irrigation and Stormwater Runoff
� Discharge Flow/Volume
� Temperature
� pH
� Electrical Conductivity
� Nitrate
� Chlorpyrifos / Diazinon
� Toxicity
17

1818
Tier 3Irrigation & Nutrient Management Plan
Subset of Tier 3 Operations – Farms with high nitrate
loading risk
Purpose: Minimize nitrate loading to surface water and groundwater due to excess fertilizer.

1919
Tier 3Irrigation & Nutrient Management Plan
• Certified by crop advisor
• Standard nutrient budgeting tools− Identify crop needs (nitrogen uptake values)− Report total nitrogen applied− Calculate nitrate balance ratios
• Report management practices implemented
• Estimate nitrate loading to groundwater
• INMP effectiveness
• Alternative – monitoring to evaluate nitrate loading
Approximately 30 Operations – Farm specific

20
Within 3 years:
Nitrogen Balance Ratio =
Nitrogen Balance RatioTargets
1→ Multiple (triple or double) cropping systems (e.g. vegetables)
1.2→ Annual crop (e.g. strawberries)
Total Nitrogen Applied
Crop Needs

21
Staff overlayed nitrogen balance ratio info on graphic presented at the 2011 Irrigation and Nutrient
Management Meeting and Cover Crop and Water Quality Field Day Presentations (UCANR)
Nitrogen
Balance =
Ratio
Total Nitrogen Applied
Crop Needs (120 - 140) NitrogenBalance
Ratio
2.8
0.5
1.8
1.5
2.0

2222
Tier 3Water Quality Buffer Plan
Subset of Tier 3 Operations – Farms that contain or
are adjacent to waterbody impaired for sediment,
turbidity, or temperature.
Purpose: Prevent waste discharge, comply with water quality standards, and protect beneficial uses in compliance with Order and Basin Plan.

2323
• Minimum 30 foot buffer
• Any increases in buffer width to prevent discharge of waste
• Schedule for implementation
• Maintenance provisions to ensure water quality protection
• Photo monitoring
• Alternatives - functionally equivalent
Tier 3Water Quality Buffer Plan
Approximately 10 Operations – Farm Specific

24
2011 Order Tier 1
Tier 2 Minus:
Annual compliance info - Online entry form
Meet Water Quality Standards
File Notice of Intent
Farm Plan
-- irrigation management
-- pesticide management
-- nutrient management
-- erosion management
-- schedules to implement
Surface Water Monitoring
Education
Groundwater sampling and reporting
Backflow prevention
Annual compliance info – Online entry form
2011 Order Tier 2 2011 Order Tier 3
Tier 2 Plus:
Individual Monitoring
Water Quality Buffer Plan
Irrigation and Nutrient
Mgmt Plan
Time Schedules


26
EXTRA SLIDES

27
TIER 3 OPERATION
1300 ACRES – 3 FARMS
FARM #1800 Acres
Lettuce
Tailwater
FARM #3300 Acres
Grapes
NoTailwater
FARM #2200 Acres
Carrots
NoTailwater
INMP
Ind Monitoring Irrigation + Stormwater
Ind Monitoring
Stormwater Only
WQ Buffer Plan
Ind Monitoring
Stormwater Only

3/29/2011 1March 17, 2011 Board Meeting
Agricultural Order
Public Input and Staff ResponsesPublic Input and Staff Responses
� Process
� Input
� Alternatives
� Comments
� Responses

3/29/2011 2March 17, 2011 Board Meeting
Agricultural Order
Public Input ProcessPublic Input Process
�� Fall 2008 Fall 2008 -- presentpresent
�� 2.5 years2.5 years
�� Numerous stakeholdersNumerous stakeholders
�� Diverse interestsDiverse interests
�� Multiple events and meetingsMultiple events and meetings

3/29/2011 3March 17, 2011 Board Meeting
Agricultural Order
Table Table
of of
Public Outreach MeetingsPublic Outreach Meetings

3/29/2011 4March 17, 2011 Board Meeting
Agricultural Order
Summary of InputSummary of Input
�� PrioritizePrioritize
�� Human health, drinking waterHuman health, drinking water
�� ““One size does not fit allOne size does not fit all””
�� ReasonablenessReasonableness
�� Flexibility Flexibility

3/29/2011 5March 17, 2011 Board Meeting
Agricultural Order
Options and Alternatives ComparedOptions and Alternatives Compared
�� 2004 Conditional Waiver 2004 Conditional Waiver
�� OSR Enterprises OSR Enterprises
�� Farm Bureau Farm Bureau
�� 2011 Draft Order2011 Draft Order
�� Environmental OrganizationsEnvironmental Organizations
�� Feb 1, 2010 Preliminary Draft Feb 1, 2010 Preliminary Draft
OrderOrder

3/29/2011 6March 17, 2011 Board Meeting
Agricultural Order
Farm Bureau ProposalFarm Bureau Proposal
�� Changes to Order:Changes to Order:
�� Added use of coalitions to assist individual growers Added use of coalitions to assist individual growers comply comply
�� Unworkable elements:Unworkable elements:
�� Monitoring and ReportingMonitoring and Reporting
�� No indicators to show control of waste discharges No indicators to show control of waste discharges
�� No indicators to show pollution reduction at No indicators to show pollution reduction at individual farm levelindividual farm level
�� No reporting results of groundwater monitoringNo reporting results of groundwater monitoring
�� No reporting results of No reporting results of optionaloptional individual discharge individual discharge monitoringmonitoring
�� Time SchedulesTime Schedules
�� MilestonesMilestones

3/29/2011 7March 17, 2011 Board Meeting
Agricultural Order
Draft Order MilestonesDraft Order Milestones
�� General Condition General Condition
�� Meet WQ standardsMeet WQ standards
�� Protect beneficial usesProtect beneficial uses
�� Prevent nuisancePrevent nuisance
�� Specific ConditionsSpecific Conditions
�� Control Discharges Control Discharges
�� By specific datesBy specific dates
�� Nutrients controlled by October 1, 2015Nutrients controlled by October 1, 2015
�� MilestonesMilestones
�� Indicators of ConditionsIndicators of Conditions
�� Indicators of water quality improvementIndicators of water quality improvement

3/29/2011 8March 17, 2011 Board Meeting
Agricultural Order
Milestones ComparedMilestones Compared
Draft OrderDraft Order
�� Receiving waterReceiving water
�� Individual dischargeIndividual discharge--
pollution reductionpollution reduction
�� Farm nitrate loading to GWFarm nitrate loading to GW
�� Greater water quality Greater water quality
improvementimprovement
�� Shorter timeframesShorter timeframes
Farm Bureau ProposalFarm Bureau Proposal
�� Receiving WaterReceiving Water
�� NO Individual dischargeNO Individual discharge
�� NO GWNO GW
�� Less water quality Less water quality
improvementimprovement
�� Longer timeframesLonger timeframes

Current Nitrate Concentration30 mg/l
10% Load Reduction = 10% Concentration Reduction, if flow stays the same
Farm Bureau Milestone10 % reduction = 3 mg/l reduction
Concentration in 10 Years 27 mg/l
2011 Draft Agricultural Order Milestone67% reduction = Meet 10 mg/l
Concentration in 5 Years 10 mg/l
Comparison of Milestones, Applied
3/29/2011 10March 17, 2011 Board Meeting
Agricultural Order
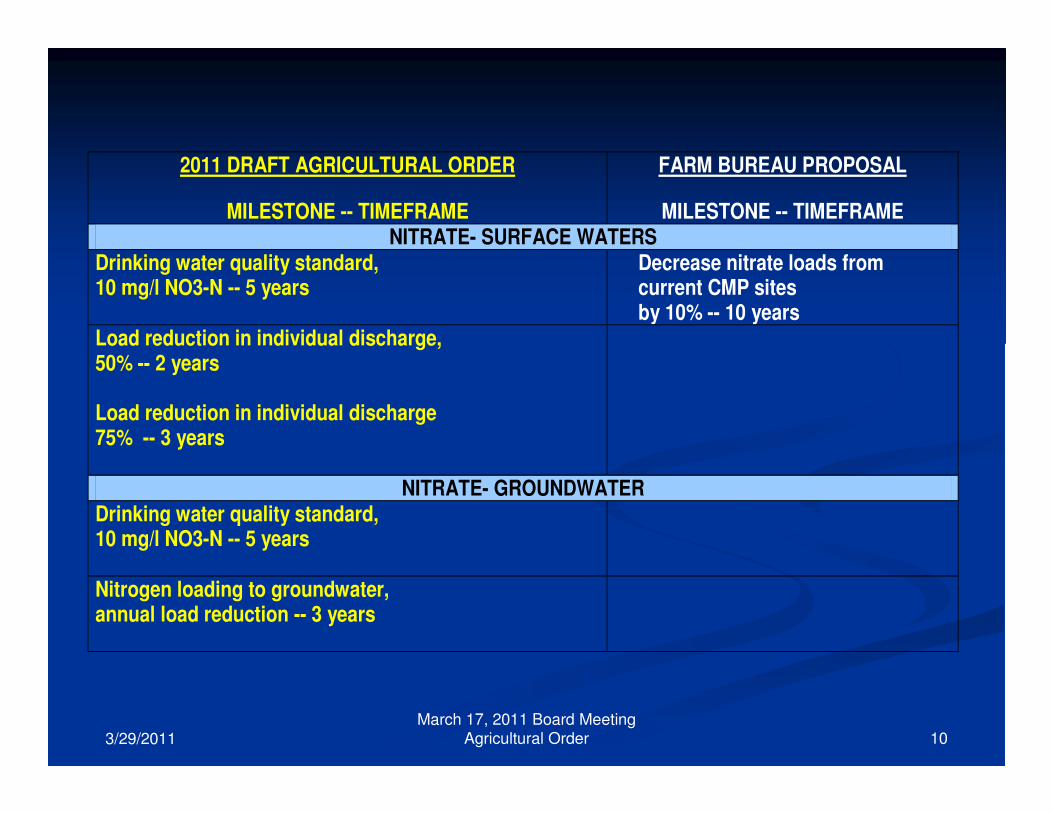
2011 DRAFT AGRICULTURAL ORDER
MILESTONE -- TIMEFRAME
FARM BUREAU PROPOSAL
MILESTONE -- TIMEFRAME NITRATE- SURFACE WATERS
Drinking water quality standard, 10 mg/l NO3-N -- 5 years
Decrease nitrate loads from current CMP sites by 10% -- 10 years
Load reduction in individual discharge, 50% -- 2 years Load reduction in individual discharge 75% -- 3 years
NITRATE- GROUNDWATER Drinking water quality standard, 10 mg/l NO3-N -- 5 years
Nitrogen loading to groundwater, annual load reduction -- 3 years

3/29/2011 11March 17, 2011 Board Meeting
Agricultural Order
Environmental AlternativeEnvironmental Alternative
�� Like Feb. 1, 2010 Prelim Draft OrderLike Feb. 1, 2010 Prelim Draft Order
�� ““More protective of water qualityMore protective of water quality””
�� Monitoring requirements Monitoring requirements
�� Increased erosion and sediment control Increased erosion and sediment control
�� Riparian area protectionRiparian area protection
�� ClarificationClarification

3/29/2011 12March 17, 2011 Board Meeting
Agricultural Order
Public Comments and ResponsesPublic Comments and Responses
�� 116 letters116 letters
�� All stakeholder groupsAll stakeholder groups
�� Comments focused on:Comments focused on:
�� TieringTiering criteriacriteria
�� Drinking water impactsDrinking water impacts
�� Groundwater protectionGroundwater protection
�� MonitoringMonitoring
�� Legal issuesLegal issues

3/29/2011 13March 17, 2011 Board Meeting
Agricultural Order
Tiers and Tiers and TieringTiering Criteria Criteria --
Response to CommentsResponse to Comments
�� Added proximity to public water Added proximity to public water supply wellssupply wells
�� Changed re: pesticide useChanged re: pesticide use
�� Deleted sizeDeleted size
�� Replaced Replaced ““adjacent toadjacent to”” with with ““discharge todischarge to”” to impaired waterto impaired water
�� Added EO will add pesticides based Added EO will add pesticides based on new informationon new information
�� Added Sustainable In Practice Added Sustainable In Practice Certification for Tier 1Certification for Tier 1

3/29/2011 14March 17, 2011 Board Meeting
Agricultural Order
Drinking Water and Groundwater Drinking Water and Groundwater --
Response to CommentsResponse to Comments
�� Reduced frequency of Reduced frequency of
samplingsampling
�� Clarified Clarified gwgw level level
measurement measurement
�� Reduced time for backflow Reduced time for backflow
prevention devicesprevention devices--
3 years to 1 year3 years to 1 year
3/29/2011 15March 17, 2011 Board Meeting
Agricultural Order
MonitoringMonitoring--
Response to CommentsResponse to Comments
�� Removed parametersRemoved parameters
from surface water from surface water
�� Changed toxicity test forChanged toxicity test for
individual dischargeindividual discharge
�� Separated Separated MRPsMRPs for each Tierfor each Tier

3/29/2011 16March 17, 2011 Board Meeting
Agricultural Order
Legal IssuesLegal Issues--
Response to CommentsResponse to Comments
�� Clarified law re: confidential infoClarified law re: confidential info
�� Deleted prohibitions Deleted prohibitions
�� e.g., use of excess fertilizere.g., use of excess fertilizer
�� Changed prohibitions to conditionsChanged prohibitions to conditions
�� e.g., cover bare soil to prevent e.g., cover bare soil to prevent
sediment dischargesediment discharge
�� Clarified time and requirements to Clarified time and requirements to
meet water quality standardsmeet water quality standards

3/29/2011 17March 17, 2011 Board Meeting
Agricultural Order
In SummaryIn Summary
� Options
� Alternative proposals
� Hundreds of comments
��LOTS OF CHANGESLOTS OF CHANGES